Laser-assisted Fano resonance: attosecond quantum control and dynamical imaging
A Fano resonance arises from the pathway interference between discrete and continuum states, playing a fundamental role in many branches of physics, chemistry and material science. Here, we introduce the concept of a laser-assisted Fano resonance, created from two interferometric pathways that are coupled together by an additional laser field, which introduces a controllable phase delay between them and results in a generalized Fano lineshape that can be actively controlled on the attosecond time scale. Based on our experimental results of unprecedented resolution, we dynamically image a resonant electron wave packet during its evolution directly in the time domain, extracting both the amplitude and the phase, which allows for the measurement of the resonant photoionization time delay. Ab-initio calculations and simulations employing a physically transparent two-level model agree with our experimental results, laying the groundwork for extending our concepts into attosecond quantum control of complex systems.
We live in a world ruled by resonances, ranging from atoms over musical instruments to medical equipment. Spectroscopy is an essential tool for uncovering resonances in light-matter interactions. The observed spectral line positions reveal resonant energies of the excited quantum states, whereas the lineshapes are determined by how the matter relaxes after light is resonantly absorbed. For example, when a discrete state is resonantly excited by a light field, the corresponding absorption spectrum will show a symmetric Lorentzian lineshape. If the discrete state is coupled with a continuum, the pathway interference between them will result in an asymmetric Fano lineshape (?, ?). As a central paradigm, Fano resonances widely exist in many branches of science (?, ?, ?, ?), serving as a bridge towards quantum optical control of electron dynamics, such as electromagnetically induced transparency (EIT) (?), Borrmann (?) and Kerker (?, ?) effects.
The birth and development of attosecond light sources (?, ?) and attosecond metrologies (?, ?, ?) have enabled real-time observation of ultrafast electron dynamics inside atoms (?, ?, ?), molecules (?, ?), solids (?, ?) and liquids (?, ?). Consequently, the quest for quantum control of the electron dynamics on the attosecond time scale becomes a central topic in ultrafast science (?, ?). Although quantum control in infrared (IR) and visible frequency regimes has already been accessible based on the dense energy levels of cold alkali-metal atoms (?) or the tunable plasmonic resonance of nanostructures (?), extending such manipulations down to the extreme-ultraviolet (XUV) regime is still quite challenging owing to both technical and methodological limitations. Recent breakthroughs (?, ?) have demonstrated the control of attosecond dynamics in a classical way, relying on the electron classical motion driven by optical fields. However, attosecond quantum control of the electron dynamics is still in its infancy.
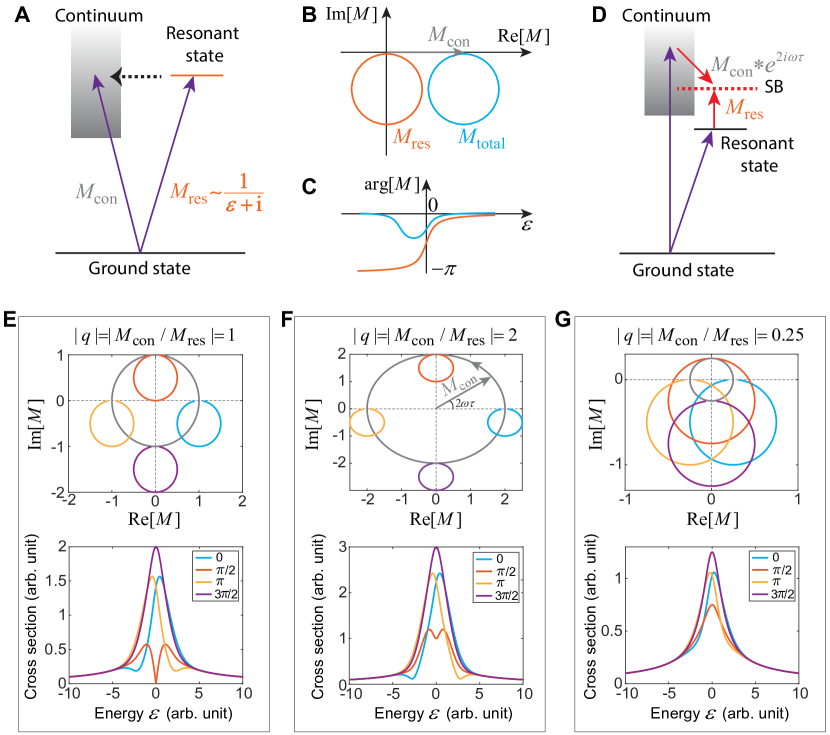
Here, we show how to quantum engineer the Fano lineshape through photoelectron spectroscopy by introducing a new variant of the Fano resonance, i.e. the laser-assisted Fano resonance. Previous time-resolved studies have been limited to the well-known “natural” Fano resonances arising from the doubly excited states of helium (?, ?, ?). In the standard Fano resonance, the resonant state is a doubly excited state, lying higher than the first ionization threshold of the system, as shown in Fig. 1A. Therefore, an XUV pulse can eject the electron directly into the continuum or excite it into the resonant doubly excited state. The latter can then autoionize and couple to the continuum wave packet, whereby their interference gives rise to the Fano lineshape.
The relationship between the interference and the asymmetric lineshape becomes clearer when one uses the complex-plane representation, as shown in Fig. 1B, where , and stand for complex amplitudes of the continuum pathway, the resonant pathway and their coherent sum, respectively. The resonant transition amplitude can be described by a Breit-Wigner amplitude (?) whose absolute square corresponds to a Lorentzian lineshape, where denotes the reduced energy containing and as the position and width of the resonance, respectively, and is the reduced Planck constant. The resonant transition amplitude (orange circle in Fig. 1B), which is originally symmetric with respect to the imaginary axis, will be shifted to become asymmetric with respect to the imaginary axis (blue circle in Fig. 1B) after the coherent superposition with a real-valued continuum transition amplitude. The position of the transition amplitude in the complex plane determines the argument (i.e. phase) as well as the modulus (i.e. cross section). The phase distributions of and as a function of energy are depicted in Fig. 1C, where the Lorentzian curve has a -phase jump at the resonant position and the phase minimum position of the Fano curve deviates from the resonant position. This energy offset for the phase is related to the asymmetry parameter (real number) of its lineshape, which is defined as the channel intensity ratio (?), and it can be influenced by the Stark shift of the resonant state in a strong IR field, as illustrated in previous studies (?, ?). However, this line-shape control relies on the action of the pulse envelope and is thus limited to the femtosecond time scale.
Here, we introduce the concept of the laser-assisted Fano resonance, as illustrated in Fig. 1D. We separate the two interferometric arms of the Fano resonance and introduce a controllable phase delay between them before the recombination. The resonant and continuum pathways can be respectively triggered by two adjacent odd harmonics in an attosecond pulse train, and their recombination occurs at the intermediate sideband (SB) through the assistance of a fundamental IR field. By coupling with the IR field, the two pathways acquire phase factors of and , respectively, where is the IR frequency and is the XUV-IR time delay. By taking as the reference, will carry a phase factor of , corresponding to a concentric circle in the complex plane. Therefore, the coherent sum of and corresponds to the rotation of the resonant Lorentzian circle on the concentric circle of the continuum pathway, and the azimuth angle of the rotation is their phase difference , which is experimentally controllable on the attosecond time scale. Therefore, in our case the parameter, , is a complex number, which allows to rotate the transition amplitude in the whole complex plane and thus covers the concept of the “natural” Fano resonance.
In Fig. 1E, we show the complex-plane representations and the lineshapes of the total transition amplitude at the phase delays of 0, , , and . For the cases of and , which correspond to symmetric double-peak and single-peak lineshapes, respectively, the total amplitudes in the complex plane are both symmetric with respect to the imaginary axis. At the delays of 0 and , rotates to the positions which are the farthest away from the imaginary axis, and thus the asymmetry of the corresponding lineshapes is the largest, with the opposite directions for the two delays. Note that not only the intensity ratio , i.e., the traditional Fano parameter, but also phase delay between the two arms determine the lineshape in our case. The intensity ratio is visualized as the relative size of the two circles in the complex plane. In Fig. 1F-G, we display the lineshapes at of 2 and 0.25, respectively. When is larger than , the two peaks at the delay of might be merged together and thus the lineshape (red curve in Fig. 1G) goes back to a symmetric single peak. Furthermore, both the peak-position shift between the delays of 0 and and the peak-amplitude contrast between the delays of and decrease with the decrease in the ratio . In reality, the intensity ratio between the two pathways can be controlled by the Stark-shift-induced detuning of the resonance in the femtosecond time scale, as we show later in our experiment.
Experimentally, the XUV attosecond pulse train is produced from high-order harmonic generation of argon atoms driven by an intense IR pulse accurately characterized by the transient-grating FROG technique. The central wavelength is 799 nm and the pulse duration (FWHM) is 31 fs. The XUV pulse duration (FWHM) is characterized to be 12 fs from the cross-correlation signal of normal sidebands. We choose the singly excited 1s3p state of helium atoms as the resonant state to demonstrate the concept of laser-assisted Fano resonance. This resonant state is naturally covered by the harmonic 15 with the bandwidth of 0.2 eV and is identified in an additional experiment of the long-range XUV-IR scan [see Supplementary Material (SM)]. The harmonic 17 can directly ionize the helium atoms, serving as the interferometric arm of the continuum pathway. The sideband 16 is formed by the interference of the two pathways, i.e. the signal of laser-assisted Fano resonance. Our experimental approach builds on the across-threshold RABBIT scheme (?, ?, ?, ?, ?, ?), but critically hinges on two aspects: (i) we have dramatically enhanced the energy resolution to 10 meV around zero kinetic energy using a COLTRIMS detector (?, ?), and (ii) we have resolved the XUV-IR delay in a very long range of 50 fs with the attosecond stability. The former allows one to directly observe the attosecond change of the lineshapes, and the latter reveals that the RABBIT phase is locally dependent on the XUV-IR delay, adding a fundamentally new aspect compared to previous studies (?, ?, ?, ?, ?, ?).
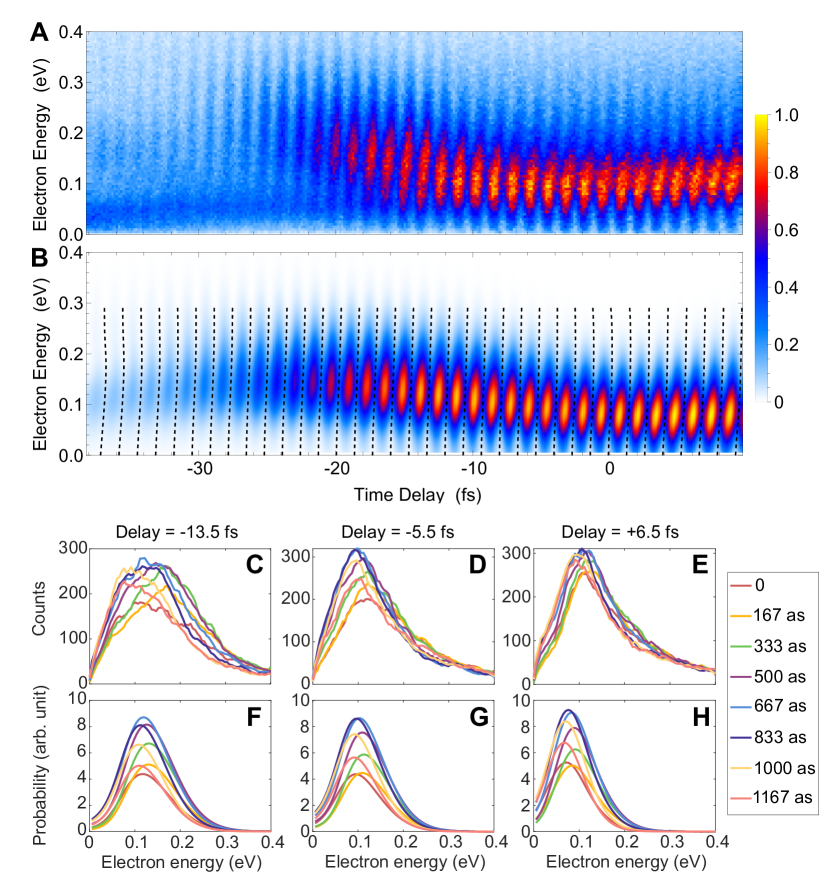
In Figs. 2A-B, we show the delay-resolved photoelectron energy spectra of the sideband 16 from the measurement and the ab initio solution of time-dependent Schrödinger equation (TDSE), respectively. In our TDSE simulations, we used the modified Tong-Lin potential (?), and the calculated resonant energy of 1s2-1s3p transition agrees very well with the NIST value (a.u.) down to the fifth significant digit. In the simulation, the XUV and IR pulses are both of Gaussian shape without any chirps, and the light intensities and durations are adopted from the experimental values. The photoelectron final momentum or energy is obtained by projecting the wavefunction onto the continuum eigenstates of the model potential without any approximations (see SM for the calculation details). The TDSE simulation reproduces most of features we measured, including both femtosecond and attosecond structures. In our definition, the negative time delay means that the IR pulse is behind the XUV pulse. Around the delay of zero, the photoelectron energy is the lowest, owing to the largest Stark shift (by the ponderomotive energy ) of the ionization potential () caused by the peak of the IR envelope. When the IR pulse gradually comes after the XUV pulse, the electron energy goes up due to the decrease of the Stark shift until around -25 fs, where the two pulses only overlap by a small part and thus the continuum pathway becomes very weak. Since the resonant pathway has a much weaker Stark-shift effect than the continuum pathway, the electrons from the two pathways will gradually mismatch in energy when delaying the IR pulse until leaving a long tail of the resonant pathway in the lower-energy regime. As for the attosecond structure, both measurement and TDSE simulation reveal that the RABBIT fringes are tilted and the slope locally depends on the time delay. In Figs. 2C-E, we display the line cuts with attosecond resolution at the time delays of around -13.5 fs, -5.5 fs and 6.5 fs, respectively, which agree well with the corresponding TDSE results shown in Figs. 2F-H. The photoelectron lineshapes varied from a low-amplitude symmetric one, over a rightward biased one and then a high-amplitude symmetric one, to a leftward biased one. This behavior basically corresponds to the physical picture that is larger than (i.e. Fig. 1G). As the time delay decreases from 6.5 fs to -13.5 fs, the left-right energy shift and the up-down yield contrast are both enhanced, indicating that the two pathways become closer in channel intensity. This is because delaying the IR pulse will increase the detuning of the resonant pathway and then its channel intensity decreases faster than the continuum pathway, making the two channel intensities more comparable. Therefore, the attosecond control of the lineshape corresponds to the two-circle rotation in the complex plane, while the femtosecond control relies on the manipulation of the relative size of the two circles. Both can be well understood within the physical picture of the laser-assisted Fano resonance, as shown in Fig. 1.
To capture the physical processes at play, we develop a transparent two-level model, including two discrete states (1s and 3p) and a continuum. The resonant-pathway amplitude is described by , and the continuum-pathway amplitude is written as , where is the transition dipole from state to state ( stand for the bound 1s and 3p states or the continuum states with energy of and ), is the sideband energy, and are the IR and harmonic 17 fields, respectively. The time-dependent probability amplitudes for the electron being pumped to the 3p state or staying in the 1s state are described with a two-level equation including Stark shift and ionization loss (see SM for more details). We calculate the energy-resolved interference minima between and based on the two-level model and plot them onto Fig. 2B with dashed lines. The predictions of the two-level model agree excellently with the ab-initio TDSE result over the whole delay range. This finding gives rise to a counter-intuitive conclusion that the energy dependence of the Wigner phase and continuum-continuum (CC) transition phase (?) are negligible here even in this low-energy regime, since our two-level model did not include the Wigner or CC phase. In the SM, we show that the Wigner and CC phases cancel out in the across-threshold RABBIT scheme. Therefore, here the measured energy and delay dependence of the RABBIT fringes originates from the resonant dynamics. This finding has important consequences because it defines an absolute time scale for the measurements of photoionization delays. Whereas previous RABBIT measurements could only determine relative photoionization delays between two simultaneously measured photoionization processes (?, ?, ?, ?), our results show a pathway for determining the origin of time in RABBIT measurements, which could be further developed to measure absolute photoionization delays.
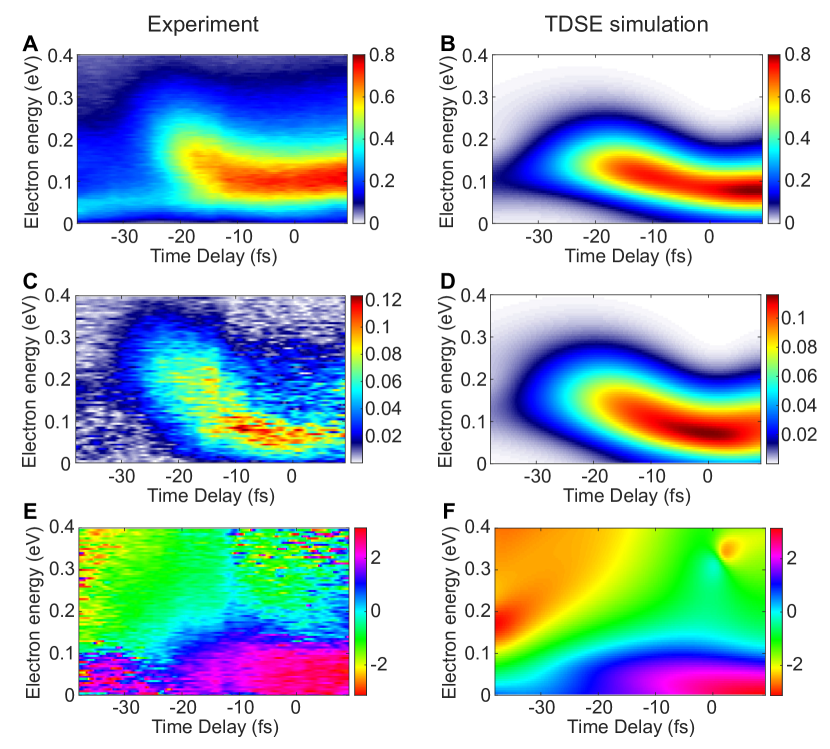
To quantify the energy and delay dependence, we locally fit the interference fringes with the function . In Fig. 3, we show the fitting results of , and from the experimental data and the TDSE simulation, respectively. The background term corresponds to the sum of squares of the two wave packets, i.e. , while the fringe contrast corresponds to the product of their modulus, i.e. . Hence, the background term displays a low-energy tail if the two pulses are separated, as opposed to the contrast term. The parabolic shape of both and manifests the effect of the -shift from the IR field in the continuum pathway. Note that here the IR light intensity is as low as in typical RABBIT experiments. Our experimental data reveals that the effect of the IR-pulse envelope is not negligible if the energy resolution is high enough. Finally, the RABBIT phase corresponds to the phase difference between the two pathways, i.e. , which mainly reflects the feature of the resonant pathway. As the time delay decreases, the energy position of the phase jump (blue area) gradually becomes smoother and shifts towards the low-energy regime.
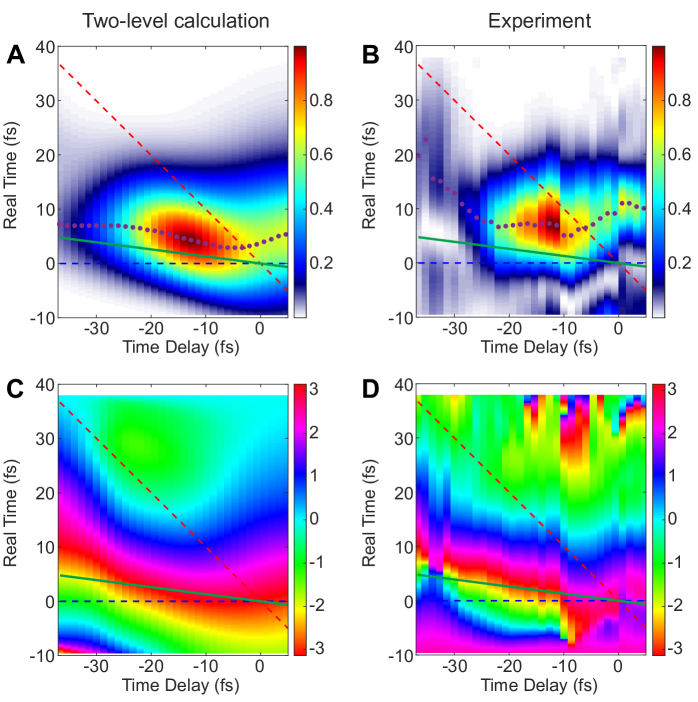
From the fitting results, we can extract the amplitude and the phase and thus dynamically image the resonant wave packet in the time domain. After subtracting the amplitude and the phase of the continuum pathway, we obtain the complex amplitude of the resonant pathway in the energy domain. Using the time-frequency transformation, we finally obtain the wave packet in the time domain, as illustrated in Figs. 4B-D (see SM for the details of data analysis). A comparison with the results directly calculated from the two-level model is shown in Fig. 4A-C. In these plots, the horizontal axis stands for the XUV-IR time delay, while the vertical axis represents real time. The XUV pulse is centered at time zero (blue dashed line), and the IR pulse is located at positions where the real time equals to the XUV-IR time delay (red dashed diagonal line). We also plot the peak position of the product of two pulse envelopes (i.e. ) as the solid green line, which corresponds to the peak position of the wave packet in the continuum pathway, i.e. the non-resonant two-photon wave packet. This solid green line is the reference that there is no any delays between absorbing XUV and IR photons. Both experimental and model results (see magenta dots in Figs. 4(A-B)) reveal that the resonant wave packet peaks in the regime between the green and red lines, indicating that the resonant wave packet will stay at the resonant state for some time before absorbing the IR photon. The temporal separation between the peak positions of the resonant and non-resonant wave packets is the so-called resonant two-photon photoionization time delay (?). Since the XUV pulse intensity is too weak to trigger Rabi flopping between the two levels, the population of the excited state generally accumulates within the XUV pulse. This accumulation leads to a delay in the instantaneous ionization from the resonant state. Our finding validates a previous theoretical prediction (?) that the resonant two-photon time delay depends on the pulse envelope. The phase distributions exhibit increasing of the temporal dispersion of the electron wave packet when the IR pulse is delayed, which corresponds to the energy shift in the frequency domain. Note that we have varied pulse parameters in the two-level model and found the above discussed phenomena to be very general and robust.
To conclude, we have quantum engineered a new variant of the Fano resonance, the laser-assisted Fano resonance, in which the photoelectron lineshape is controllable on both attosecond and femtosecond time scales. The different possibilities for control over lineshapes have been made transparent with a simple picture in the complex plane. Our unprecedented high-resolution experimental results reveal the envelope effects of XUV and IR pulses in the across-threshold RABBIT technique and show that the RABBIT phase locally depends on the two-pulse time delay. With the help of ab-initio calculations and a two-level model, we have clarified the role of the Wigner and CC delays in this across-threshold RABBIT case. We have further dynamically imaged a resonant electron wave packet and determined the resonant photoionization time delay. Since the resonant states slightly below the threshold can be regarded as bound states embedded in the continuum in the photon-dressed Floquet picture, the quantum manipulation based on Fano resonances, such as EIT (?), should be easily accessible based on the singly excited states in attosecond science. For example, if one odd harmonic covers two singly excited states, this corresponds exactly to the case of a typical EIT system involving two Fano resonances (?, ?). Hence, the photoelectron line due to three-channel interference will display a modulation between “transparency” and “opaqueness” that is controllable on the attosecond time scale. Therefore, our study paves the way to attosecond quantum control over electronic resonance phenomena in more complex systems.
References
- 1. U. Fano, Nuovo Cimento 12, 154 (1935).
- 2. U. Fano, Phys. Rev. 124, 1866 (1961).
- 3. J. M. Rost, K. Schulz, M. Domke, G. Kaindl, J. Phys. B: At. Mol. Opt. Phys. 30, 4663 (1997).
- 4. J. A. Fan, et al., Science 328, 1135 (2010).
- 5. M. F. Limonov, M. V. Rybin, A. N. Poddubny, Y. S. Kivshar, Nat. Photon. 11, 543 (2017).
- 6. I. Mazumdar, A. Rau, V. Bhasin, Phys. Rev. Lett. 97, 062503 (2006).
- 7. S. E. Harris, Phys. Today 50, 36 (1997).
- 8. V. Novikov, T. Murzina, Opt. Lett. 42, 1389 (2017).
- 9. M. V. Rybin, et al., Phys. Rev. B 88, 205106 (2013).
- 10. A. Poshakinskiy, A. Poddubny, Physical Review X 9, 011008 (2019).
- 11. M. Hentschel, et al., Nature 414, 509 (2001).
- 12. P. M. Paul, et al., Science 292, 1689 (2001).
- 13. J. Itatani, et al., Phys. Rev. Lett. 88, 173903 (2002).
- 14. M. Schultze, et al., Science 328, 1658 (2010).
- 15. J. M. Dahlström, et al., Chem. Phys. 414, 53 (2013).
- 16. C. Ott, et al., Science 340, 716 (2013).
- 17. A. Kaldun, et al., Science 354, 738 (2016).
- 18. V. Gruson, et al., Science 354, 734 (2016).
- 19. M. Huppert, I. Jordan, D. Baykusheva, A. von Conta, H. J. Wörner, Phys. Rev. Lett. 117, 093001 (2016).
- 20. E. Gagnon, et al., Science 317, 1374 (2007).
- 21. A. L. Cavalieri, et al., Nature 449, 1029 (2007).
- 22. S. Ghimire, et al., Nat. Phys. 7, 138 (2011).
- 23. T. T. Luu, et al., Nat. Commun. 9, 3723 (2018).
- 24. I. Jordan, et al., Science (2020).
- 25. C. Lin, W.-C. Chu, Science 340, 694 (2013).
- 26. P. M. Kraus, et al., Science 350, 790 (2015).
- 27. S. Chu, Nature 416, 206 (2002).
- 28. E. Goulielmakis, et al., Science 317, 769 (2007).
- 29. A. D. Bandrauk, N. H. Shon, Phys. Rev. A 66, 031401 (2002).
- 30. C. Ott, et al., Phys. Rev. Lett. 123, 163201 (2019).
- 31. M. Swoboda, et al., Phys. Rev. Lett. 104, 103003 (2010).
- 32. L. Neoričić, et al., Front. Phys. p. 908 (2022).
- 33. A. Autuori, et al., Sci. Adv. 8, eabl7594 (2022).
- 34. L. Drescher, T. Witting, O. Kornilov, M. Vrakking, Phys. Rev. A 105, L011101 (2022).
- 35. A. S. Kheifets, A. W. Bray, Phys. Rev. A 103, L011101 (2021).
- 36. D. Villeneuve, P. Hockett, M. Vrakking, H. Niikura, Science 356, 1150 (2017).
- 37. R. Dörner, et al., Phys. Rep. 330, 95 (2000).
- 38. J. Ullrich, et al., Rep. Prog. Phys. 66, 1463 (2003).
- 39. X. M. Tong, C. D. Lin, J. Phys. B 38, 2593 (2005).
- 40. K. Klünder, et al., Phys. Rev. Lett. 106, 143002 (2011).
- 41. M. Isinger, et al., Science 358, 893 (2017).
- 42. J. Su, H. Ni, A. Jaroń-Becker, A. Becker, Phys. Rev. Lett. 113, 263002 (2014).
Acknowledgments
We thank A. Schneider and M. Seiler for their technical support. Funding M.H. acknowledges the funding from the European Union’s Horizon 2020 research and innovation program under the Marie Skłodowska-Curie grant agreement No 801459 - FP-RESOMUS. This work was supported by ETH Zürich and the Swiss National Science Foundation through projects 200021_172946 and the NCCR-MUST.
Authors contributions M.H. and K.U. conceived the study. M.H. performed the experiments with the support of J.J. and L.C.S.. H.L. and M.H. analyzed and interpreted the data. Simulations were implemented by H.L.. J.M.R., K.U. and H.J.W. supervised the realization of the study. M.H., H.L., J.M.R, K.U. and H.J.W. wrote the paper with the input of all co-authors.
Competing interests None to declare.
Data and materials availability All data needed to evaluate the conclusions in the paper are present in the paper or the supplementary materials.