VIBFREQ1295: A New Database for Vibrational Frequency Calculations
Abstract
High-throughput approaches for producing approximate vibrational spectral data for molecules of astrochemistry interest rely on harmonic frequency calculations using computational quantum chemistry. However, model chemistry recommendations (i.e, a level of theory and basis set pair) for these calculations are not yet available and, thus, thorough benchmarking against comprehensive benchmark databases is needed.
Here, we present a new database for vibrational frequency calculations (VIBFREQ1295) storing 1,295 experimental fundamental frequencies and CCSD(T)(F12*)/cc-pVDZ-F12 ab initio harmonic frequencies from 141 molecules. VIBFREQ1295’s experimental data was complied through a comprehensive review of contemporary experimental data while the ab initio data was computed here. The chemical space spanned by the molecules chosen is considered in depth and shown to have good representation of common organic functional groups and vibrational modes.
Scaling factors are routinely used to approximate the effect of anharmonicity and convert computed harmonic frequencies to predicted fundamental frequencies. With our experimental and high-level ab initio data, we find that a single global uniform scaling factor of 0.9617(3) results in median differences of 15.9(5) cm-1. Far superior performance with a median difference of 7.5(5) cm-1 can be obtained, however, by using separate scaling factors for three regions: frequencies less than 1000 cm-1 (SF = 0.987(1)), between 1000 and 2000 cm-1 (SF = 0.9727(6)) and above 2000 cm-1 (SF = 0.9564(4)). This sets a lower bound for the performance that could be reliably obtained using scaling of harmonic frequencies calculations to predict experimental fundamental frequencies.
VIBFREQ1295’s most important purpose is to provide a robust database for benchmarking the performance of any vibrational frequency calculations. VIBFREQ1295 data could also be used to train machine-learning models for the prediction of vibrational spectra, and as a reference and data starting point for more detailed spectroscopic modelling of particular molecules. The database can be found as part of the supplemental material for this paper, or in the Harvard DataVerse at \urlhttps://doi.org/10.7910/DVN/VLVNU7.
University of New South Wales] School of Chemistry, University of New South Wales, 2052, Sydney
1 Introduction
Definitive remote detection of molecular species in different astronomical settings, e.g (exo)planetary atmospheres, relies on the availability of high-resolution spectroscopic data 1, 2, 3, 4, 5, 6, 7, which is very time-intensive to produce. As a complementary approach, it is likely to be useful to obtain approximate data for the thousands of molecular species of interest astrophysically, e.g. as discussed in Seager et al. 8 Though this novel approach 9, 10 cannot enable definitive molecular detections, there are nevertheless many anticipated applications of these big data including identification of molecules with strong absorption (that will be easier to detect), recognising potential ambiguities in molecular detections over some spectral windows, understanding the relative congestion of signals at different frequencies, and providing data for machine learning of vibrational frequencies.
An obvious way to produce this approximate vibrational spectral data for thousands of molecules is through harmonic or anharmonic quantum chemistry vibrational frequency calculations, as piloted in Zapata Trujillo et al. 10 However, existing literature, as recently reviewed in Zapata Trujillo and McKemmish11, does not provide a definitive recommendation for a quantum chemistry methodology, even within the extremely popular harmonic approximation, nor explore the likely errors. These recommendations and error analysis are of interest far beyond the astrochemistry community (as evidenced by high citation numbers of, for example, Scott and Radom 12). We note that there has certainly been significant prior work on this topic (reviewed in Zapata Trujillo and McKemmish 11) - it is the reliable definitive modern recommendations that are missing. Root-mean-squared errors (RMSE) between experimental and theoretical scaled harmonic frequencies have been computed extensively to compare model chemistry performance 11 but conclusions from this collation can only be preliminary as (1) the RMSE metrics cannot be fairly compared across different publications due to differences in the benchmark datasets used; and (2) there is often a lack of data for many important modern model chemistry choices.
The need for a new thorough and comprehensive benchmarking study of model chemistry performance for harmonic frequency calculations is clear 11, but crucially the quality of this study relies on the quality of the experimental database against which theoretical results are compared. A key focus of this paper is to provide such an updated and collated experimental database, which we call VIBFREQ1295. The need for an update is justified initially by the fact that it has been almost thirty years since the most extensive and frequently used database was compiled in Pople et al. 13 1064f/122mol (note this is widely known as the F1 set due to its use in Scott and Radom 12), then in hindsight by the significant number of updates to this original data that were found.
Given that using scaled harmonic frequencies is the most widespread approach to predict experimental fundamental frequencies in quantum chemistry, understanding the inherent errors of the harmonic approximation at very high levels of model chemistry, e.g., CCSD(T)-like calculations, is pivotal for providing directions into less-demanding and routine calculations. For instance, such comparison can allow us to explore how best to quantify the error distribution and occurrence of large outliers in the calculations. Moreover, we can also examine different approaches for the implementation of scaling factors, highlighting errors and expected performance in each case.
In the present paper, we provide a new benchmark database for vibrational frequencies, containing 1,295 experimental fundamental frequencies from 141 organic-like molecules (VIBFREQ1295). The frequencies collated here correspond to the most up-to-date experimental fundamental frequencies for the molecules considered, as recorded by an extensive literature review search. The uncertainties in the experimental measurements (when available), the symmetry of the vibration, as well as approximate descriptions to the vibrational modes, are also provided for all molecules in the database. To complement the experimental frequencies, we also calculated high-level CCSD(T)(F12*)/cc-pVDZ-F12 ab initio harmonic frequencies for all molecules in the database. The reader can access the VIBFREQ1295 database in the supplemental material for this paper, as well as through the Harvard DataVerse platform 14 (\urlhttps://doi.org/10.7910/DVN/VLVNU7).
This paper is organised as follows. In Section 2 we explain the criteria used to select the molecules and frequencies included in the database, and provide a comparison between the newly compiled experimental frequencies and the data from the previous vibrational frequency databases. A detailed analysis into the chemical space and functional groups included into VIBFREQ1295 is presented in Section 3, with particular interest in the distribution of different vibrational modes in the database. In Section 4 we present the high-level (CCSD(T)(F12*)15/cc-pVDZ-F1216, 17) ab initio harmonic frequencies for the molecules together with our analysis in terms of the scaling factor calculation, its implication on the accuracy of the scaled harmonic frequencies, and the expected anharmonicity error. Finally, in Section 5 we summarise our findings, outlining concluding remarks and future directions for this work.
2 Constructing the Database
Herein, we present a new database for vibrational frequency calculations containing 1,295 experimental fundamental frequencies and high-quality (CCSD(T)(F12*)15/cc-pVDZ-F1216, 17) ab initio harmonic frequencies for 141 molecules. Table 1 presents an overview of the molecules considered in the database, showcasing the total number of atoms and experimental frequencies, frequency range covered, and references to the original experimental publications.
| Formula | IUPAC Name | #At | Freq. (cm-1) | Vib. Freqs. | Refs | Formula | IUPAC Name | #At | Freq. (cm-1) | Vib. Freqs. | Refs |
|---|---|---|---|---|---|---|---|---|---|---|---|
| \ceAlCl3 | Aluminium chloride | 4 | 616 - 151 | 6 | 23 | \ceClNO | Nitrosyl chloride | 3 | 1799 - 331 | 3 | 24, 25 |
| \ceBH | -borane | 2 | 2269 - 2269 | 1 | 26 | \ceClNO2 | Chloro nitrite | 4 | 1683 - 370 | 6 | 27, 28, 29, 30, 31 |
| \ceBH3CO | Borane carbonyl | 6 | 2456 - 313 | 12 | 32, 33, 34 | \ceClO | Chlorosyl | 2 | 853 - 853 | 1 | 35 |
| \ceBO | Oxoboron | 2 | 1772 - 1772 | 1 | 36 | \ceCN | Cyano radical | 2 | 2042 - 2042 | 1 | 37 |
| \cec-C2H4S3 | 1,2,4-trithiolane | 9 | 2976 - 82 | 21 | 38 | \ceCO | Carbon monoxide | 2 | 2169 - 2169 | 1 | 39 |
| \cec-C3H3NO | 1,3-oxazole | 8 | 3160 - 609 | 18 | 40, 41 | \ceCO2 | Carbon dioxide | 3 | 2349 - 667 | 4 | 42, 43 |
| \cec-C3H3NO_1 | 1,2-oxazole | 8 | 3160 - 591 | 18 | 44 | \ceCOCl2 | Carbonyl dichloride | 4 | 1828 - 301 | 6 | 45, 46, 47, 48 |
| \cec-C3H6 | Cyclopropane | 9 | 3101 - 737 | 21 | 49, 50, 51, 52, 53 | \ceCOClF | Carbonyl chloride fluoride | 4 | 1875 - 408 | 6 | 54 |
| \cec-C3H6S | Thietane | 10 | 2994 - 113 | 24 | 55, 38 | \ceCOF2 | Carbonyl difluoride | 4 | 1944 - 581 | 6 | 56, 57, 58 |
| \cec-C4H4N2 | Pyrazine | 10 | 3069 - 350 | 24 | 59 | \ceCS | Methanidylidynesulfanium | 2 | 1285 - 1285 | 1 | 60 |
| \cec-C4H4O | Furan | 9 | 3169 - 599 | 21 | 61, 62, 63, 64, 65, 66 | \ceCS2 | Carbon disulfide | 3 | 1535 - 395 | 4 | 67, 68, 69 |
| \cec-C4H5N | 1H-pyrrole | 10 | 3530 - 474 | 24 | 70, 71, 72, 62, 73, 66 | \ceCSCl2 | Thiocarbonyl dichloride | 4 | 1138 - 297 | 6 | 74, 75, 76 |
| \cec-C4H8O2 | 1,4-dioxane | 14 | 2970 - 274 | 36 | 18 | \ceCSF2 | Difluoromethanethione | 4 | 1368 - 417 | 6 | 77 |
| \cec-C5H5N | Pyridine | 11 | 3094 - 373 | 27 | 78 | \ceF2 | Molecular fluorine | 2 | 893 - 893 | 1 | 79 |
| \cec-CH2N4 | 1H-tetrazole | 7 | 3447 - 578 | 15 | 80 | \ceF2O | Fluoro hypofluorite | 3 | 928 - 460 | 3 | 81, 82, 83 |
| \ceC2Cl2 | 1,2-dichloroethyne | 4 | 2234 - 171 | 7 | 84, 85 | \ceF2SO | Thionyl fluoride | 4 | 1334 - 376 | 6 | 86, 87 |
| \ceC2H2 | Acetylene | 4 | 3372 - 612 | 7 | 88, 89, 90 | \ceFCN | Carbononitridic fluoride | 3 | 2318 - 451 | 4 | 91, 92, 93 |
| \ceC2H2O | Ketene | 5 | 3165 - 439 | 9 | 94, 95, 96, 97, 98 | \ceH2CO | Formaldehyde | 4 | 2843 - 1167 | 6 | 99, 100 |
| \ceC2H2O2 | Oxaldehyde | 6 | 2844 - 127 | 12 | 101, 102, 103, 104 | \ceH2O | Water | 3 | 3755 - 1594 | 3 | 105, 106 |
| \ceC2H3Cl | Chloroethene | 6 | 3129 - 395 | 12 | 107, 108, 109, 110, 111, 112 | \ceH2S | Sulfane | 3 | 2628 - 1182 | 3 | 113, 114 |
| \ceC2H3N | Acetonitrile | 6 | 3040 - 362 | 12 | 115 | \ceHCl | Hydrochloric acid | 2 | 2990 - 2990 | 1 | 116 |
| \ceC2H3N_1 | Isocyanomethane | 6 | 3013 - 260 | 12 | 117, 118, 119, 120 | \ceHCN | Hydrogen cyanide | 3 | 3311 - 711 | 4 | 121 |
| \ceC2H3OF | Acetyl fluoride | 7 | 3043 - 123 | 15 | 122 | \ceHCO | Formyl radical | 3 | 2434 - 1080 | 3 | 123, 124, 125 |
| \ceC2H4O | Acetaldehyde | 7 | 3014 - 143 | 15 | 126, 127, 128, 129, 130 | \ceHNCO | Isocyanic acid | 4 | 3538 - 577 | 6 | 131, 132, 133, 134 |
| \ceC2H4O2 | Methyl formate | 8 | 3045 - 130 | 18 | 135 | \ceHNO | Nitroxyl | 3 | 2683 - 1500 | 3 | 136, 137 |
| \ceC2H4O2_1 | Acetic acid | 8 | 3585 - 93 | 18 | 138, 139 | \ceHNO3 | Nitric acid | 5 | 3550 - 458 | 9 | 140, 141, 142, 143, 144, 145, 146 |
| \ceC2H5F | Fluoroethane | 8 | 3000 - 243 | 18 | 147 | \ceHO2 | Hydroperoxy radical | 3 | 3436 - 1097 | 3 | 148, 149, 150 |
| \ceC2H6 | Ethane | 8 | 2985 - 289 | 18 | 151, 152, 153, 154, 155 | \ceHOCl | Hypochlorous acid | 3 | 3609 - 724 | 3 | 156, 157 |
| \ceC2H6O | Methoxymethane | 9 | 2993 - 198 | 21 | 158, 159, 160 | \ceHOF | Hypofluorous acid | 3 | 3577 - 889 | 3 | 161, 162 |
| \ceC2H6S | Methylsulfanylmethane | 9 | 2998 - 175 | 21 | 163, 164 | \ceN2F2 | (E)-difluorodiazene | 4 | 1522 - 365 | 6 | 165 |
| \ceC2HCl | Chloroethyne | 4 | 3339 - 324 | 7 | 166, 167 | \ceN2H4 | Hydrazine | 6 | 3398 - 376 | 12 | 168, 169, 170 |
| \ceC2HF | Fluoroethyne | 4 | 3356 - 366 | 7 | 171 | \ceN2O | Nitrous oxide | 3 | 2223 - 588 | 4 | 172, 173, 174 |
| \ceC2N2 | Oxalonitrile | 4 | 2330 - 233 | 7 | 175 | \ceNCl2F | Diclhorofluoroamine | 4 | 825 - 274 | 6 | 176 |
| \ceC3H3Cl | 3-chloroprop-1-yne | 7 | 3335 - 186 | 15 | 177 | \ceNClF2 | Chlorodifluoroamine | 4 | 930 - 378 | 6 | 178, 179 |
| \ceC3H3F | 3-fluoroprop-1-yne | 7 | 3338 - 211 | 15 | 177 | \ceNF3 | Nitrogen trifluoride | 4 | 1032 - 493 | 6 | 180, 181 |
| \ceC3H3N | Acrylonitrile | 7 | 3123 - 228 | 15 | 182, 183 | \ceNH | -azane | 2 | 3125 - 3125 | 1 | 184 |
| \ceC3H4 | Propa-1,2-diene | 7 | 3085 - 352 | 15 | 185, 186, 187, 188, 189, 190 | \ceNH3 | Amonia | 4 | 3443 - 968 | 6 | 191, 192, 193 |
| \ceC3H4_1 | Prop-1-yne | 7 | 3335 - 330 | 15 | 194, 195, 196, 197, 187, 198, 199 | \ceNHF2 | Difluoroamine | 4 | 3193 - 500 | 6 | 200 |
| \ceC3H4O | Prop-2-enal | 8 | 3103 - 157 | 18 | 201, 202, 203, 204, 205 | \ceNO2 | Nitrogen dioxide | 3 | 1616 - 749 | 3 | 206 |
| \ceC3H6 | Prop-1-ene | 9 | 3091 - 189 | 21 | 207, 208, 209, 210, 211 | \ceNSCl | Azanylidyne(chloro)--sulfane | 3 | 1325 - 271 | 3 | 212, 213 |
| \ceC3H8 | propane | 11 | 2976 - 217 | 27 | 214, 215, 216, 217, 218, 219 | \ceNSF | Azanylidyne(fluoro)--sulfane | 3 | 1372 - 366 | 3 | 220 |
| \ceC3O2 | Carbon suboxide | 5 | 2289 - 60 | 10 | 221, 222, 223, 224, 225, 226, 227 | \ceO3 | Ozone | 3 | 1103 - 700 | 3 | 228 |
| \ceC4H2 | Buta-1,3-diyne | 6 | 3333 - 219 | 13 | 229, 230 | \ceOCS | Carbonyl sulfide | 3 | 2062 - 521 | 4 | 231, 232 |
| \ceC4H6 | Buta-1,3-diene | 10 | 3100 - 162 | 24 | 233, 234, 235, 236, 237 | \ceONF | Nitrosyl fluoride | 3 | 1844 - 519 | 3 | 238, 239 |
| \ceC4N2 | Dicyanoacetylene | 6 | 2296 - 107 | 13 | 240, 241, 242, 243 | \ceP4 | Tetraphosphorus | 4 | 600 - 360 | 6 | 244 |
| \ceC6H8 | (3E)-hexa-1,3,5-triene | 14 | 3099 - 90 | 36 | 245 | \cePCl3 | Trichlorophosphane | 4 | 504 - 198 | 6 | 246 |
| \ceCCl2F2 | Dichloro(difluoro)methane | 5 | 1161 - 261 | 9 | 247, 248, 249, 250, 251 | \cePF3 | Trifluorophosphane | 4 | 891 - 347 | 6 | 252 |
| \ceCCl4 | Tetrachloromethane | 5 | 793 - 218 | 9 | 253, 254, 255 | \cePH | -phosphane | 2 | 2276 - 2276 | 1 | 256 |
| \ceCF4 | Tetrafluoromethane | 5 | 1283 - 435 | 9 | 257 | \cePH3 | Phosphine | 4 | 2326 - 992 | 6 | 258, 259 |
| \ceCH | Methylidyne radical | 2 | 2732 - 2732 | 1 | 260 | \cePN | Azanylidynephosphane | 2 | 1323 - 1323 | 1 | 261 |
| \ceCH2Cl2 | Dichloromethane | 5 | 3055 - 281 | 9 | 262 | \ceS2 | Disulfur | 2 | 725 - 725 | 1 | 263 |
| \ceCH2N2 | Diazomethane | 5 | 3184 - 408 | 9 | 264, 265, 266 | \ceS2F2 | Fluorosulfanyl thiohypofluorite | 4 | 717 - 182 | 6 | 267 |
| \ceCH2O2 | Formic acid | 5 | 3568 - 626 | 9 | 268, 269, 270, 271, 272 | \ceS2O | Disulfur monoxide | 3 | 1166 - 380 | 3 | 273, 274, 275 |
| \ceCH2S | Thioformaldehyde | 4 | 3024 - 990 | 6 | 276, 277, 278 | \ceSCl2 | Chloro thiohypochlorite | 3 | 528 - 205 | 3 | 279 |
| \ceCH3Cl | Chloromethane | 5 | 3039 - 732 | 9 | 280, 281 | \ceSH | -sulfane | 2 | 2599 - 2599 | 1 | 282 |
| \ceCH3F | Fluoromethane | 5 | 2998 - 1048 | 9 | 283, 284, 285, 286 | \ceSi2H6 | Disilane | 8 | 2169 - 130 | 18 | 287, 288, 289, 290, 291, 292 |
| \ceCH3N | Methanimine | 5 | 3262 - 1058 | 9 | 293, 294, 295, 296, 297 | \ceSiH2 | Silylene | 3 | 1995 - 998 | 3 | 298 |
| \ceCH3NO | Formamide | 6 | 3563 - 288 | 12 | 299, 300 | \ceSiH2Cl2 | Dichlorosilane | 5 | 2237 - 188 | 9 | 301 |
| \ceCH4 | Methane | 5 | 3018 - 1310 | 9 | 302 | \ceSiH3Cl | Chlorosilane | 5 | 2201 - 550 | 9 | 303, 304 |
| \ceCH4O | Methanol | 6 | 3682 - 199 | 12 | 305 | \ceSiH3F | Fluorosilane | 5 | 2209 - 729 | 9 | 306, 307 |
| \ceCH4S | Methanethiol | 6 | 3010 - 234 | 12 | 308, 309, 310, 311, 19, 312 | \ceSiH4 | Silane | 5 | 2189 - 913 | 9 | 313, 314, 315 |
| \ceCH5N | Methanamine | 7 | 3424 - 264 | 15 | 316, 317, 318, 319, 320 | \ceSiHCl3 | Trichlorosilane | 5 | 2260 - 175 | 9 | 321 |
| \ceCH5P | Methylphosphine | 7 | 3002 - 219 | 15 | 322 | \ceSiHF3 | Trifluorosilane | 5 | 2315 - 305 | 9 | 323, 324, 325, 326 |
| \ceCH6Si | Methylsilane | 8 | 2981 - 187 | 18 | 327, 328 | \ceCH2 | Methylene | 3 | 2864 - 1352 | 3 | 329, 330, 331 |
| \ceCHCl3 | Chloroform | 5 | 3032 - 260 | 9 | 332, 333, 334, 335, 336, 337 | \ceSiO | Oxosilicon | 2 | 1241 - 1241 | 1 | 338 |
| \ceCHF3 | Fluoroform | 5 | 3018 - 507 | 9 | 339, 340, 341 | \ceSO2 | Sulfur dioxide | 3 | 1362 - 517 | 3 | 342, 343 |
| \ceCl2 | Molecular chlorine | 2 | 559 - 559 | 1 | 344 | \ceSO3 | Sulfur trioxide | 4 | 1391 - 497 | 6 | 345, 346 |
| \ceCl2O | Chloro hypochlorite | 3 | 686 - 300 | 3 | 347, 348 | \ceSOCl2 | Thionyl dichloride | 4 | 1251 - 194 | 6 | 349, 350, 351 |
| \ceClCN | Carbononitridic chloride | 3 | 2249 - 381 | 4 | 352 | \cetrans-C2H4Cl2 | 1,2-dichloroethane | 8 | 3018 - 137 | 18 | 353 |
| \ceClF | Chlorine fluoride | 2 | 773 - 773 | 1 | 354 | \ceCH2 | Methylene | 3 | 3213 - 963 | 3 | 355, 356 |
| \ceClF3 | Trifluoro--chlorane | 4 | 751 - 328 | 6 | 357 |
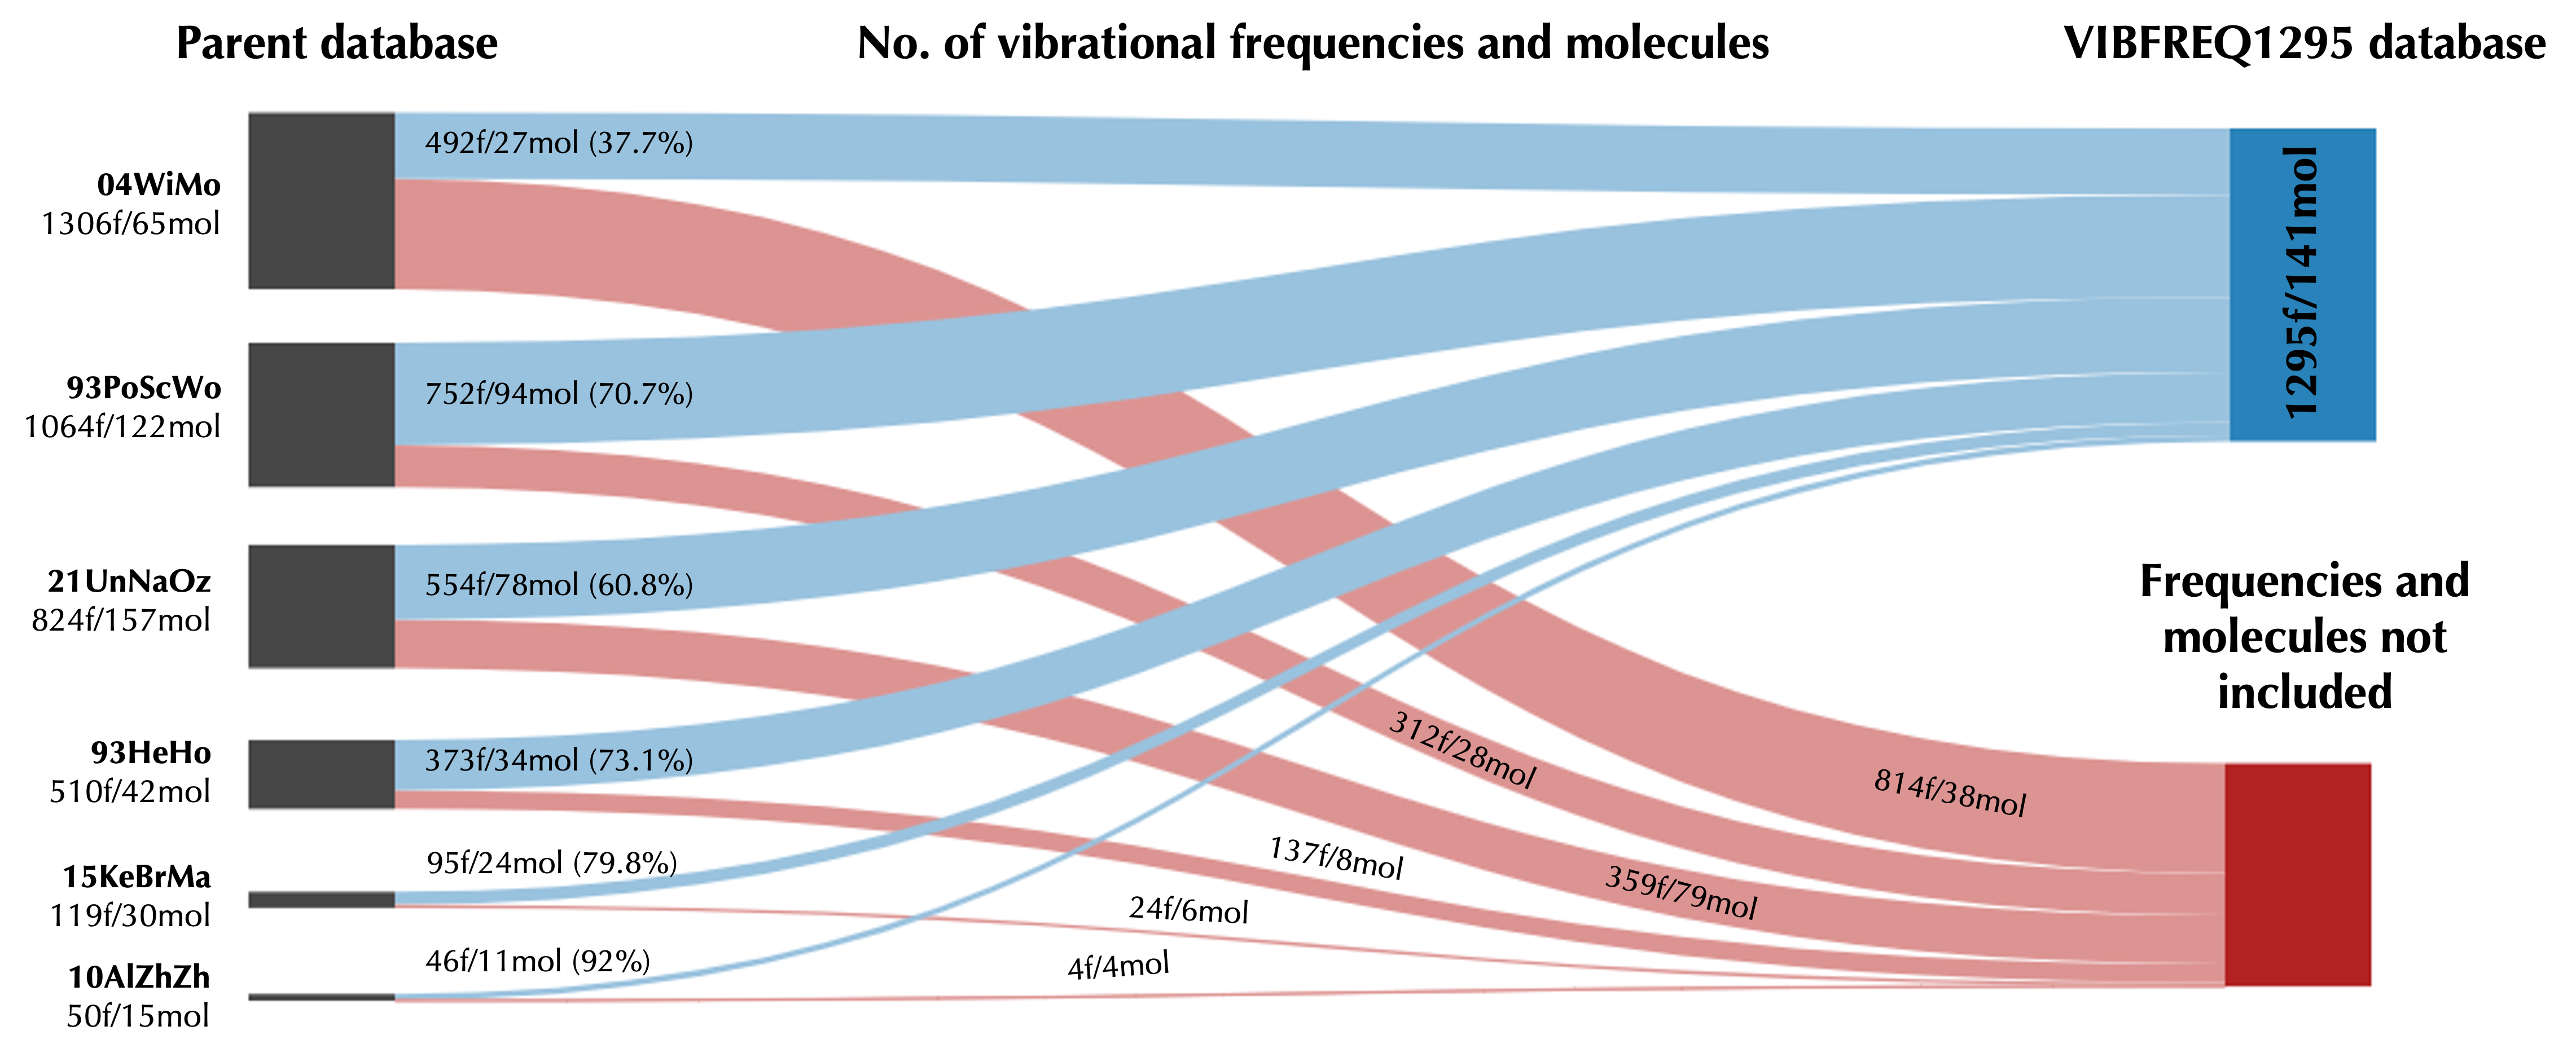
VIBFREQ1295 was built upon data collected from six popular vibrational frequency databases available in the literature that have all been previously used to calculate scaling factors, indicating the suitability of the collated molecules for this purpose. Table 2 outlines the databases considered, describing their original source of data when compiling the experimental fundamental frequencies. We chose these databases based on the heterogeneity of the molecules considered to guarantee minimal overlap of molecules between the different sets. In Figure 1 we present the six databases considered, showcasing the size of each database as indicated by the notation (x)f/(y)mol, where and represent the total number of frequencies and molecules, respectively. It is worth mentioning some other databases of critically evaluated experimental data, especially the Computational Chemistry Comparison and Benchmark Database (CCCBDB) 358, the compilation of experimental vibrational frequencies by Shimanouchi 359, and the database collated by Huber and Herzberg 360. Though these bigger databases contain additional molecules and data that could be used to expand our new database, we chose to align more closely with the heritage of previous database collation for vibrational frequency scaling factors, which were often extracted from these larger databases.
| Database | Alias | Reference | Freqs | Mols | Data Origin |
|---|---|---|---|---|---|
| 04WiMo | 1306f/65mol | Witek and Morokuma 18 | 1306 | 65 | Largely based on the Computational Chemistry Comparison and Benchmark Database (CCCBDB) 358. |
| 93PoScWo | 1064f/122mol | Pople et al. 13 | 1064 | 122 | Frequencies collected from the herculean work of Shimanouchi 359. Widley implemented in the calculation of scaling factors as evidenced by Scott and Radom 12. |
| 21UnNaOz | 842f/157mol | Ünal et al. 19 | 824 | 157 | Largely based on the Computational Chemistry Comparison and Benchmark Database (CCCBDB) 358. |
| 93HeHo | 510f/42mol | Healy and Holder 20 | 510 | 42 | Largely based on the Computational Chemistry Comparison and Benchmark Database (CCCBDB) 358. |
| 15KeBrMa | 119f/30mol | Kesharwani et al. 21 | 119 | 30 | Combination of experimental and computational data taken from the CCCBD set 358 and the Huber and Herzberg compilation 360, as well as from individual studies. |
| 10AlZhZh | 50f/15mol | Alecu et al. 22 | 50 | 15 | Based on the NIST Web book 361 and the CCCBD set 358. |
As displayed in Figure 1, not all molecules and frequencies from the former databases were included into VIBFREQ1295. Instead, we curated the initial data by considering only molecules fulfilling three main criteria:
- 1.
-
2.
Small- to medium-sized molecules with no more than 14 total atoms and 6 non-hydrogen atoms; and
-
3.
Molecules with easily accessible and reliable gas-phase experimental fundamental frequencies reported in the literature.
The light-blue areas connecting the nodes in Figure 1 schematically represent the number of molecules and frequencies from each database that have been considered into VIBFREQ1295, along with the percentages they represent in their parent database. In most cases, we included 60 % of the molecules and frequencies from the parent databases, except for the 1306f/65mol (04WiMo) 18 set, where only 37.7 % of the data was considered. The light-red areas in the figure, on the other hand, represent the proportion of data that was excluded from our database. This data mostly consists of a combination of molecules that (1) exceed the 14 total atoms criteria, (2) have incomplete frequency assignments, and (3) rely on experimental fundamental frequencies recorded in liquid-phase or with matrix isolation techniques. Note that despite disregarding this data from the database, VIBFREQ1295 is still large in terms of the number of experimental fundamental frequencies considered.
To avoid carrying forward potential misassignments in the fundamental frequencies, we performed a thorough literature search to search for potential updates to the original experimental fundamental frequencies for all molecules in our database. Frequencies from newer publications replaced the original data when either (1) the new publication had data at a significantly higher resolution (usually rovibrational resolved vs unresolved) and (2) the new publication explicitly discussed and justified the reassignments of the experimental data (often with computational or extra experimental evidence).
Figure 2 presents a histogram of the compiled experimental data as a function of the year of publication. We observe that, whilst the time-length of publications spans between the 1950s to 2020, 39.3 % of the collated data (i.e., 509 fundamental frequencies) have been published since 2000.

| Percentage (%) | No. of Frequencies | |
|---|---|---|
| Identical | 30.4 | 394 |
| (0 – 1] | 34.4 | 445 |
| (1 – 10] | 24.7 | 320 |
| (10 – 50] | 8.11 | 105 |
| 50 | 2.39 | 31 |
| Molecule | Mode | Former Freq. (cm-1) | Former Reference | New Freq. (cm-1) | New Reference | (cm-1) | Reason |
|---|---|---|---|---|---|---|---|
| \ceBH | 1 | 2367.0 | Fernando and Bernath 26 | 2269.2 | Fernando and Bernath 26 | 97.773 | Former frequency was harmonic |
| \ceBO | 1 | 1885.0 | Melen et al. 36 | 1772.9 | Melen et al. 36 | 112.14 | Former frequency was harmonic |
| \ceC2H5F | 8 | 1048.0 | Pople et al. 13∗ | 1109.0 | Dinu et al. 147 | 61.000 | Potential missassignment |
| 16 | 1108.0 | 1172.0 | 64.000 | ||||
| \ceC2H6S | 14 | 973.00 | Witek and Morokuma18∗ | 1030.0 | Ellwood et al. 163 | 57.000 | Potential missassignment |
| \ceC4N2 | 3 | 692.00 | Chase et al. 363 | 620.00 | Winther and Schönhoff240 | 72.000 | Potential missassignment |
| \ceCH2S | 5 | 3180.7 | Yachmenev et al. 364 | 3024.6 | Johns and Olson276 | 156.07 | Former frequency was harmonic |
| 1 | 3088.2 | 2971.0 | 117.21 | ||||
| \ceCH4O | 12 | 250.00 | Healy and Holder 20∗ | 199.80 | Twagirayezu et al. 305 | 50.200 | Potential missassignment |
| \ceCH5P | 5 | 1238.0 | Ünal et al. 19∗ | 1296.2 | Kim and Zeroka 322 | 58.200 | Potential missassignment |
| \ceCSCl2 | 3 | 220.00 | Pople et al. 13∗ | 297.00 | Frenzel et al. 76 | 77.000 | Potential missassignment |
| \ceHCO | 1 | 2488.0 | Pople et al. 13∗ | 2434.5 | Dane et al. 123 | 53.522 | Potential missassignment |
| \ceHO2 | 2 | 1489.0 | Ünal et al. 19∗ | 1391.8 | Burkholder et al. 150 | 97.246 | Potential missassignment |
| 3 | 1295.0 | 1097.6 | Nelson and Zahniser 149 | 197.38 | |||
| \cec-C3H3NO_1 | 13 | 764.00 | Witek and Morokuma18∗ | 857.10 | Robertson 44 | 93.100 | Potential missassignment |
| 12 | 1021.0 | 900.20 | 120.80 | ||||
| 16 | 651.00 | 764.90 | 113.90 | ||||
| 4 | 1653.0 | 1561.1 | 91.900 | ||||
| 5 | 1560.0 | 1432.6 | 127.40 | ||||
| 6 | 1432.0 | 1370.9 | 61.100 | ||||
| 7 | 1373.0 | 1218.3 | 154.70 | ||||
| 8 | 1217.0 | 1130.0 | 87.000 | ||||
| 10 | 1089.0 | 1024.20 | 64.800 | ||||
| 11 | 1033.0 | 919.50 | 113.50 | ||||
| \cec-C4H4N2 | 3 | 1335.0 | Witek and Morokuma18∗ | 1233.0 | Hewett et al. 59 | 102.00 | Potential missassignment |
| 17 | 1235.0 | 1149 | 86.000 | ||||
| \ceCH2 | 1 | 3026.0 | Pople et al. 13∗ | 2806.1 | Petek et al. 330 | 219.93 | Potential missassignment |
| 3 | 3074.0 | 2864.5 | Petek et al. 329 | 209.50 | |||
| \ceCH2 | 2 | 1056.0 | Pople et al. 13∗ | 963.10 | Marshall and McKellar 355 | 92.901 | Potential missassignment |
| 3 | 3123.0 | 3213.5 | Jensen and Bunker 356 | 90.500 |
-
(*) Note that the compilation paper, i.e., the parent vibrational frequency database, is referenced when the original experimental publication was not available.
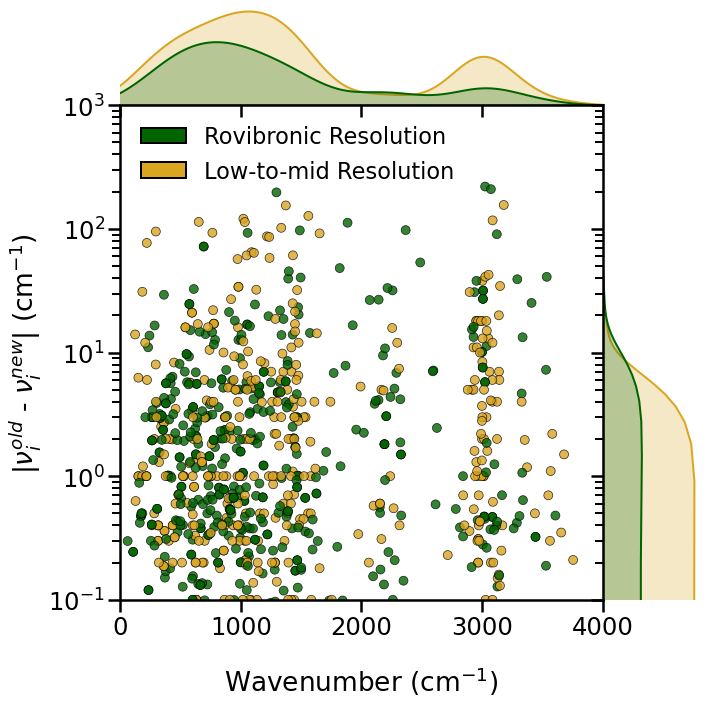
Figure 2 also highlights the experimental resolution of the data, a good indication of likely uncertainty in the reported experimental figure. 497 of the collected frequencies (38 %) have rovibronic resolution, whereas the rest of the database consists of fundamental frequencies recorded at low- to mid-resolution.
To understand the importance of the data update, Figure 3 presents the absolute difference (in logarithmic scale) between the frequencies reported in the parent databases (), and the frequencies collected from our new literature search (), i.e., . The plots on the top and right-side of the figure illustrate the density distribution of the data in each axis. Large errors concentrate in the region below 1500 cm-1 (the low-frequency region) and around 3000 cm-1 where the C–H stretching frequencies dominate; however, these are also the regions were more data is available.
Interestingly, the resolution at which the fundamental frequencies have been recorded does not significantly influence the similarity between the former and updated frequencies.
Table 3 presents the frequency difference breakdown between the former and updated values. Note that the first row in the table corresponds to frequencies where no updated experimental values were found in the literature (this data is not displayed in Figure 3). The last row in the table, on the other hand, shows the number of frequencies for which the difference between the former and updated values differs by more than 50 cm-1. We can attribute two main factors to the large discrepancies in these cases: (1) former data corresponding to experimentally-derived harmonic frequencies rather than fundamental frequencies (VIBFREQ1295 consists of experimental fundamental frequencies only), and (2) potentially unnoticed missasignments in the parent databases. In Table 4 we present the former and updated frequencies for these molecules, along with the absolute frequency difference , and the references to the original and updated experimental publications.
3 Database Overview
3.1 Chemical Space and Molecular Classes
Understanding the chemical nature underpinning the database is essential for delimiting the scope of its applications. In this section, we will compare the chemical composition of the molecules in VIBFREQ1295 with those from four benchmark databases in computational quantum chemistry: the popular general-chemistry sets MGCDB84 365 and GMTKN55 366, both containing reference values for thermochemistry, isomerisation energies and kinetics; as well as the specialised Dip152 367 and Pol132 368 databases, storing benchmark dipole moments and static polarisabilities for small molecules, respectively. For the sake of completeness, we also make comparisons against the popular 1064f/122mol vibrational frequencies database collated by Pople et al. 13
Figure 4 displays the range of elements available in VIBFREQ1295, along with the percentage of molecules containing each element individually. We can observe that the element composition in the database is constrained to molecules containing nonmetal and halogen atoms, with a small percentage of molecules containing the less common B, Si and Al elements. Thus, future applications of VIBFREQ1295 should focus towards general-chemistry properties of rigid organic-like molecules only.
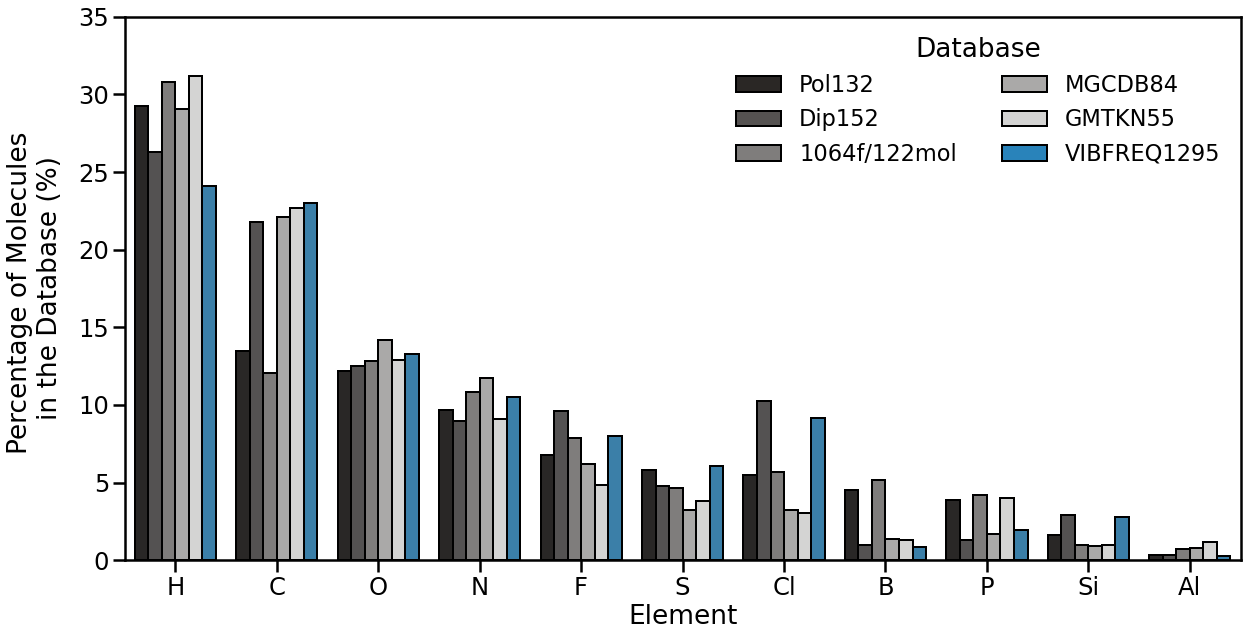
Figure 4 also compares the molecular element compositions of VIBFREQ1295 with those from the other general-chemistry and specialised databases. Note that the percentages in the figure are indicative only, as the naming convention for some molecules in the databases was not consistent. All six databases share a similar trend in element composition focusing particularly in organic-like molecules containing H, C, O, N and halogens (except for the Pol132 and 1064f/122mol sets where C-containing molecules are less prominent). Even though 70.7 % of the data from 1064f/122mol was included into VIBFREQ1295 (see Figure 1), the figure shows some significant differences in the percentages for both sets, especially for Cl-containing molecules where VIBFREQ1295 is particularly large. We can attribute this difference to the widespread of Cl-containing molecules in the other vibrational frequency databases considered.
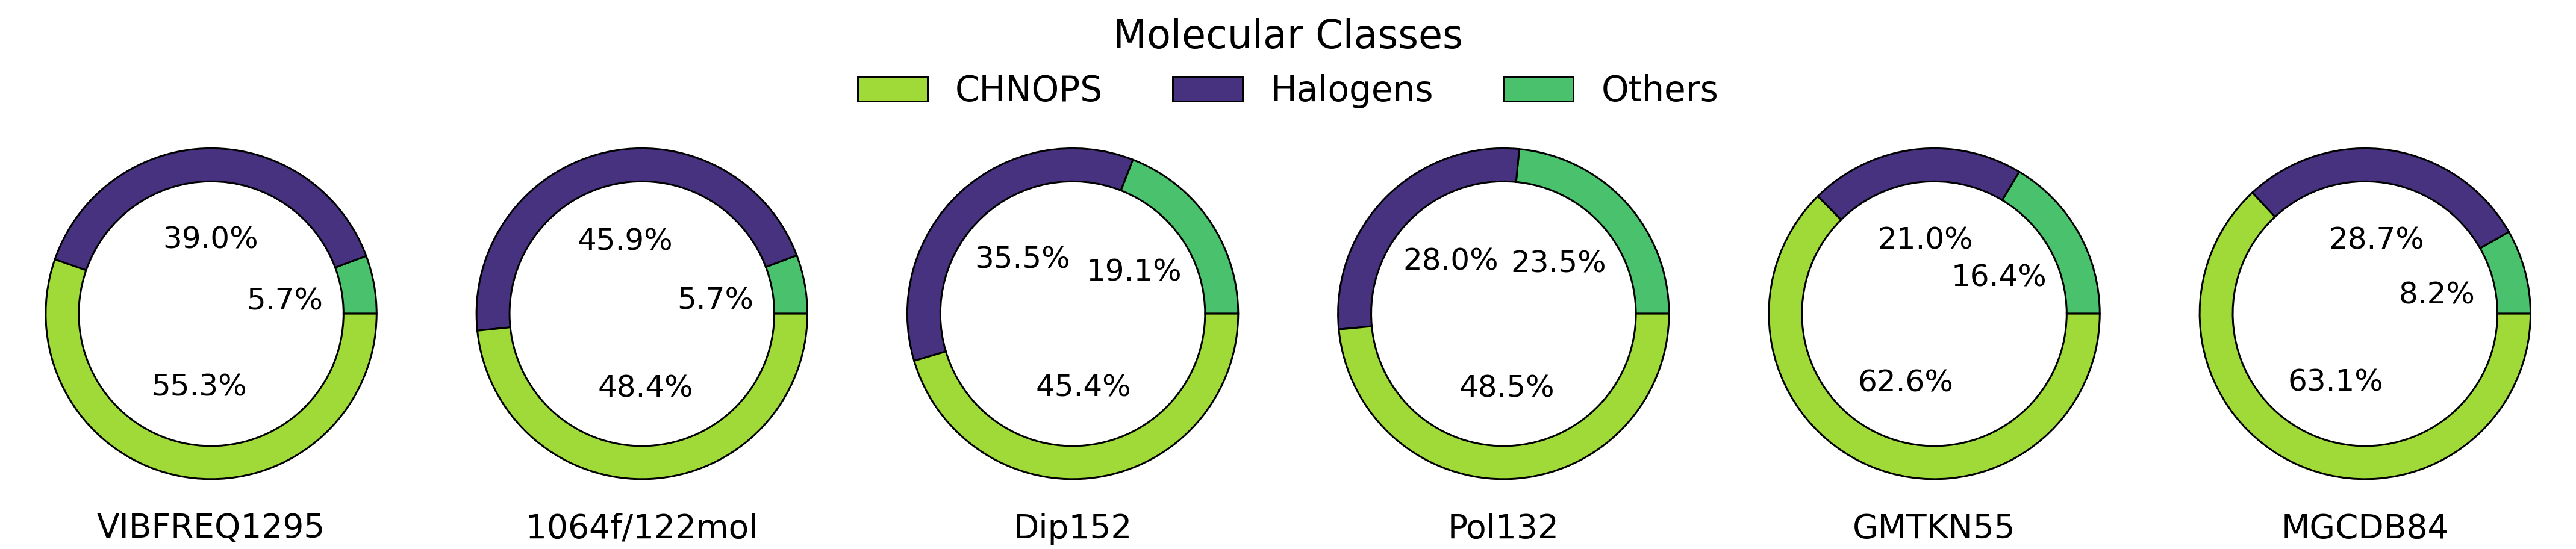
To allow further comparisons, we categorised the list of all molecules in the six databases into three main classes:
-
1.
CHNOPS Molecules: molecules containing C, H, N, O, P and S only (e.g., c-\ceC4H4O, \ceC2N2);
-
2.
Halogens: any molecule containing a halogen element (e.g., \ceAlCl3, \ceSiH3F); and
-
3.
Others: molecules containing any other element from the periodic table, except for halogens (e.g., \ceBH3CO, \ceCH6Si); and
The pie charts in Figure 5 show the percentages for each molecular class in the different databases considered. CHNOPS-like molecules dominate across all databases, especially in the VIBFREQ1295, GMTKN55 and MGCDB84 sets with more than 50 % of the molecules falling within this class. Molecules belonging to the Others class are scarce in VIBFREQ1295 (only 5.7 % of the database), mostly due to the absence of species containing B, Si and Al (see Figure 4), similarly to the 1064f/122mol and MGCDB84 sets which also seem to underestimate this molecular class. Nonetheless, VIBFREQ1295 is notably rich in halogenated compounds (almost 40 % of the database), which correlates with the large percentage of Cl-containing molecules in the database. As both CHNOPS-like and halogenated compounds share similar percentages in VIBFREQ1295, we do not expect significant biases towards a particular class in future applications (see Section 4). However, we caution the user about the potential overestimation of halogenated compounds in VIBFREQ1295.
3.2 Functional Groups
We wrote a python code based on the RDKtid library 369 to obtain the counts of the different functional groups in our database. A comprehensive description of all functional groups can be found in Table S1 in the supplemental material for this paper.
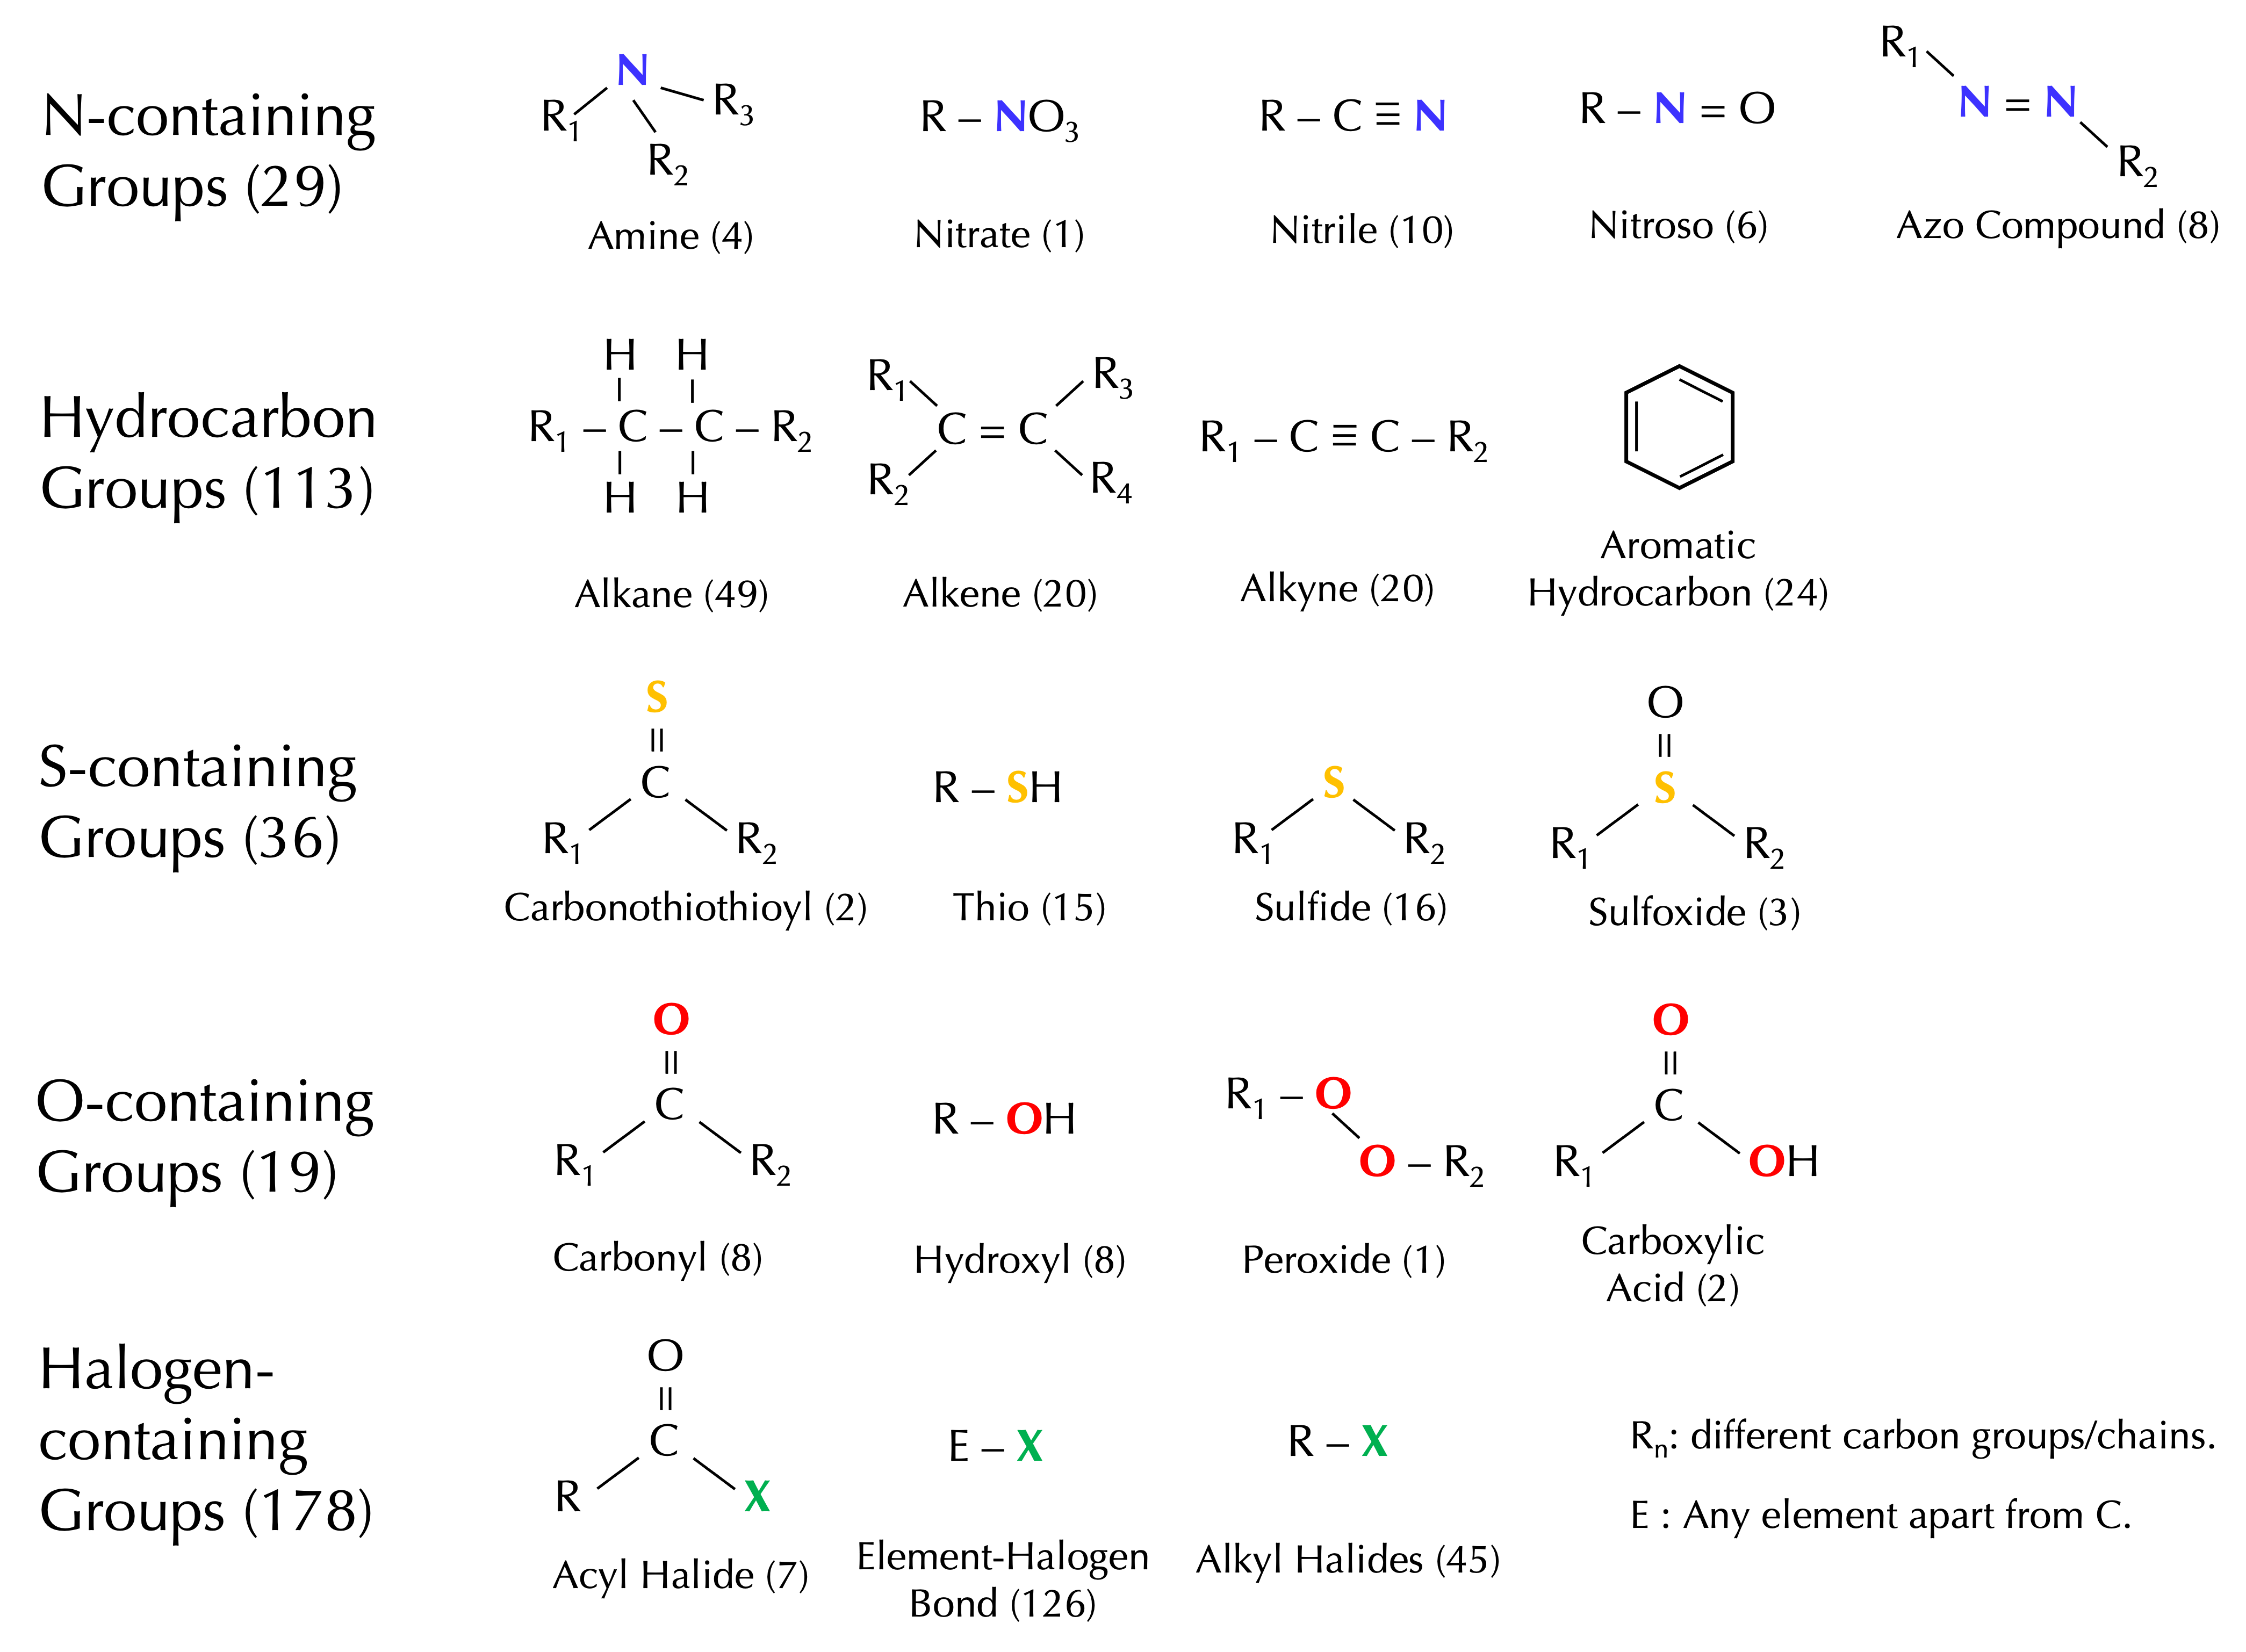
Figure 6 illustrates some of the functional groups present in VIBFREQ1295, along with their indicative counts in parenthesis. In line with the predominance of F- and Cl-containing species, halogen-containing functional groups dominate in the database, particularly due to the ubiquitous presence of the E–X group (where represents any element apart from C, and is a halogen), having the largest count across all functional groups. Hydrocarbon groups are also widespread in the database, with a large proportion of molecules containing alkane- and alkene-like groups. Note that the variety of O-containing groups is extensive, with multiple functional groups containing pairs of heteroatoms including O, e.g., R–NO3 (nitrate) or R1–SO–R2 (sulfoxide).
3.3 Vibrational Modes
Functional groups are not only responsible for driving chemical reactivity, but also help distinguishing between molecules based on their vibrational motions. As functional groups correspond to well-defined regions of the molecule containing specific atoms (e.g., C=O group), it is straightforward to identify the localised vibrations of those functional groups in the infrared spectrum (e.g., C=O stretch at 1700 cm-1).
In VIBFREQ1295, we provide approximate descriptions for all vibrational modes in the database, based on the vibrational motions from our quantum-chemistry calculations (see Section 4). Note that these descriptions are indicative only; Highly-coupled modes and descriptions in the low-frequency range (usually below 1,000 cm-1) are less accurate due to the large number of atoms and bonds involved in the vibration.
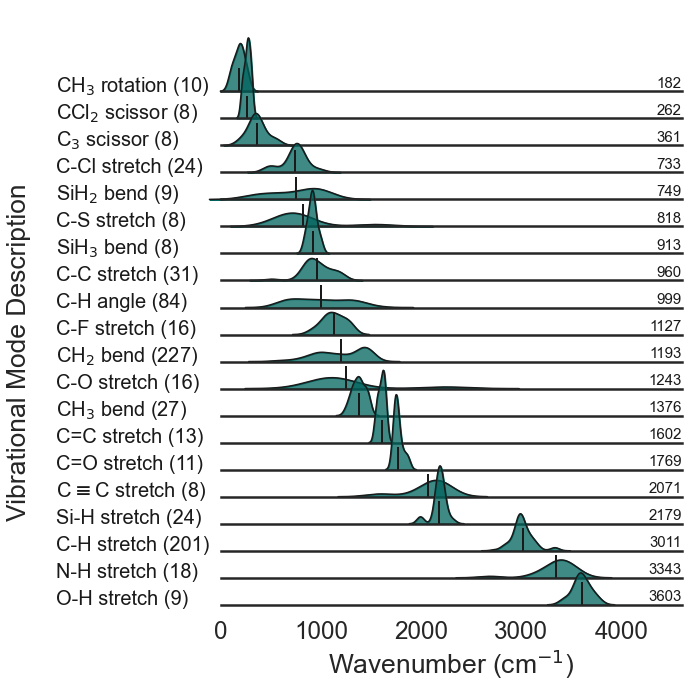
Figure 7 presents the density distribution for the 20 most common vibrational modes in the database. The numbers in parenthesis indicate the counts for each vibrational mode, with central frequencies displayed in the right-most side of the figure. We can observe that the database has a good coverage in terms of vibrational modes, spanning between the far- (10 – 400 cm-1) and mid-infrared (400 – 4,000 cm-1) regions. Popular modes like the C–H and O–H stretches are well-defined in the database, with their expected central frequencies lying at approximately 3,000 and 3,600 cm-1, respectively. However, non-stretch modes were more difficult to define uniquely and we kept the terms fairly generic - e.g., C-H angle and \ceCH2 bend are used as classifiers for a variety of different vibrational motions (including some wagging, rocking, twisting and scissoring modes) and thus they span a wider frequency range. The figure also shows that, as expected, vibrational modes involving more than two atoms, or relatively heavy elements, e.g., S, Cl, lie in the low-frequency range of the spectrum (usually below 1,000 cm-1).
3.4 Applications for this database
It is clear that the primary use of VIBFREQ1295 is to allow benchmarking of the performance of model chemistries for harmonic frequency calculations. We are currently undertaking a benchmarking study quantifying the quality of scaled harmonic vibrational frequencies produced from a wide cross-section of density functional approximations, and double and triple-zeta basis sets. Future studies considering the performance of various anharmonic treatments, e.g., VPT2 and VSCF, are natural and important follow-ups.
It is possible that future density functional theories or basis sets could utilise this vibrational frequency data as part of their training data, perhaps producing approximations specifically tuned to this property. However, this is less likely than for other experimental property databases because (1) frequencies are computationally expensive calculations, and (2) vibrational frequencies are not a particularly challenging property for model chemistries to predict as anharmonicity error dominates over model chemistry error very quickly 11.
Instead, more promising applications could be directed towards machine learning algorithms. Models trained on the VIBFREQ1295 experimental data could predict fundamental frequencies of small molecules either entirely without computational quantum chemistry, or as corrections to these calculations. For instance, The RASCALL computational chemistry approach 9 uses experimental fundamental frequencies (mostly from common organic functional groups) to predict approximate spectral data for thousands of molecules simultaneously. RASCALL could benefit from the distribution of vibrational frequencies collated here for multiple functional groups, as this data can help considering the effects of the chemical environment in the vibrational frequency for a given functional group, i.e., how the frequency for the functional group vibration shifts according to the atoms and chemical groups surrounding it (see Figure 7).
Another potential application of VIBFREQ1295 is providing a centralised repository of high-level ab initio harmonic frequencies for supporting approaches seeking more accurate vibrational spectra predictions. This is the case of, for example, the hybrid approach implemented by Biczysko et al. 370 where CCSD(T)-like harmonic frequencies for a given molecule are corrected by means of anharmonic calculations (usually VPT2) performed at a computationally less-demanding model chemistry choice, e.g., hybrid functionals and double-zeta basis sets. This hybrid approach has proved to deliver satisfactory performance in small-to-medium-sized molecules 371, 372, 373.
It is not only the experimental and theoretical harmonic frequencies in VIBFREQ1295 that can be practical; the set of compiled literature references for each molecule are a useful starting point for more detailed spectral data compilation such as model Hamiltonians fits or assigned rovibrational transitions. These higher-resolution data are crucial for enabling remote molecular identification and environmental characterisation in complex gaseous environments including planetary atmospheres 374, 375, 376.
4 High-quality ab initio Harmonic Frequencies: Comparison with Experiment
4.1 Computational Details
To complement the experimental fundamental frequencies collated here, we also calculated high-level ab initio harmonic vibrational frequencies for all 141 molecules. Initial molecular geometries were obtained from their SMILES identifiers through an automated approach using the RDKit 369 and ChemCoord 377 libraries in python.
We performed all harmonic frequency calculations using the CCSD(T)(F12*) method 15 together with the cc-pVDZ-F12 basis set 16, 17. We chose this model chemistry based on recommendations by Martin and Kesharwani 378 and Schmitz and Christiansen 379, who found a fast basis set convergence at a reasonable computational cost for this model chemistry. Indeed, they reported errors between 3–4 cm-1 in the computed harmonic frequencies when compared against CCSD(T) limit results.
The initial geometries for the calculations were optimised using a tight convergence criteria, with maximum force and maximum displacements smaller than 1.5x10⁻⁵ Hartree/Bohr and 6.0x10⁻⁵ Å, respectively. Default values were used for the CABS singles (1.0x10⁻⁸) and CCSD convergence (1.0x10⁻⁶) thresholds. A template of the input file used in the calculations is provided in the supplemental material for this paper. All calculations were carried out using the MOLPRO 2020 quantum chemistry package 380.
4.2 Calculating Scaling Factors: The Test and Training Set Separation
Scaling factors are essential for comparing calculated harmonic frequencies with experimental fundamental frequencies 11. The standard approach usually involves fitting and testing the scaling factor using the same set of fundamental frequencies without distinguishing between independent training and test sets.
Here, however, in line with good-practice procedures in data science, we computed our scaling factor by splitting the database into two different sets: a training set, used in the fitting of the scaling factor, and a test set to evaluate the performance of the computed scaling factor. Both the training and test sets have been assigned with similar percentage compositions in terms of the molecular classes (halogens 29 % and non-halogens 71 %), and vibrational modes (stretch 44 % and non-stretch 56 %) considered. Ensuring high similarity between the training and test sets is pivotal for extrapolating conclusions.
To analyse how sensitive the scaling factor and scaling factor’s performance are to the partition of the database, we split VIBFREQ1295 into four different groups of training and test sets: 100 – 0, 90 – 10, 80 – 20, and 70 – 30, where the numbers in each pair correspond to the percentages of data from VIBFREQ1295 included in the training and test sets, respectively. The first partition group (100 – 0) corresponds to the standard approach of using the whole set of data to fit and test the scaling factor.
In all cases, we used the training set to calculate the corresponding scaling factor as , where and represent the calculated harmonic and experimental fundamental frequencies, respectively, and both summations run over the total number of frequencies considered in the training set. The calculated scaling factors were then used to scale the raw harmonic frequencies in the corresponding test sets, with performance judged by the root-mean-squared-error (RMSE), the standard statistical metric for assessing performance 11, between the scaled harmonic and experimental fundamental frequencies as .
To ensure convergence in the reported metrics, we randomised the partition of the training and test sets over 100 cycles, calculating each time the scaling factor and corresponding RMSE. We present the average results with their standard deviations in Table 5 for both the training and test sets, separately, across the different partition groups.
| Scaling Factor | % | Training Set | % | Test Set |
|---|---|---|---|---|
| RMSE (cm-1) | RMSE (cm-1) | |||
| 0.9617 | 100 | 33 | 0 | - |
| 0.9618(2) | 90 | 33 (1) | 10 | 31 (6) |
| 0.9618(3) | 80 | 33 (1) | 20 | 32 (5) |
| 0.9617(3) | 70 | 33 (2) | 30 | 32 (4) |
Table 5 shows that virtually the same metrics are obtained for both the training and test sets across the different partition groups, ensuring high similarity between both sets, and thus negligible overfitting in the computed scaling factors. This implies that the metrics obtained from our analysis represent a fair indication of our model chemistry and scaling factor performance. Looking at the different partition groups in Table 5, there is no major differences in the statistical figures reported; however, the overall small standard deviation in the test set for the 70 – 30 split highlight as a good compromise for future calculations. Therefore, further discussions in this paper will focused on calculations using the 70 – 30 split (with metrics hereafter referred as the global scaling factor), unless otherwise noted.
It is worth noting that the global scaling factor optimised here for the CCSD(T)(F12*)/cc-pVDZ-F12 model chemistry (0.9617(3)) is essentially identical to the scaling factor of 0.9627 found by Kesharwani et al. 21 for the CCSD(T)(F12*)/cc-pVQZ-F12 model chemistry. This further validates our previous finding suggesting convergence of the scaling factor at quite moderate computational levels 11, e.g., hybrid functional with double-zeta basis sets, thus suggesting the potential implementation of universal scaling factors for model chemistries above the hybrid/double-zeta level.
4.3 Robust Error Quantification: Comparing Theory with Experiment
The conventional approach for quantifying error in harmonic frequency calculations requires comparing experimental fundamental frequencies against calculated harmonic frequencies that have been scaled using a global scaling factor (e.g., 0.9617(3) in Table 5). However, as noted by the early work of Scott and Radom 12, this procedure fails in properly describing low-frequency vibrations as it inherently gives more weight to frequencies lying at the upper end of the vibrational spectrum. Instead, alternative approaches have opted for calculating scaling factors for different frequency regions leading to differences in performance 381, 382, 383, 384, 385, 386, 387, 388, 389.
The standard cutoff for distinguishing between low- and high-frequency vibrations is usually set at 1,000 cm-1 382. However, based on a detailed analysis examining the effect of multiple frequency thresholds (further explained in the supplemental material), we defined three different regions of importance: low-frequency (< 1,000 cm-1), mid-frequency (1,000 – 2,000 cm-1), and high-frequency ( 2,000 cm-1) vibrations.
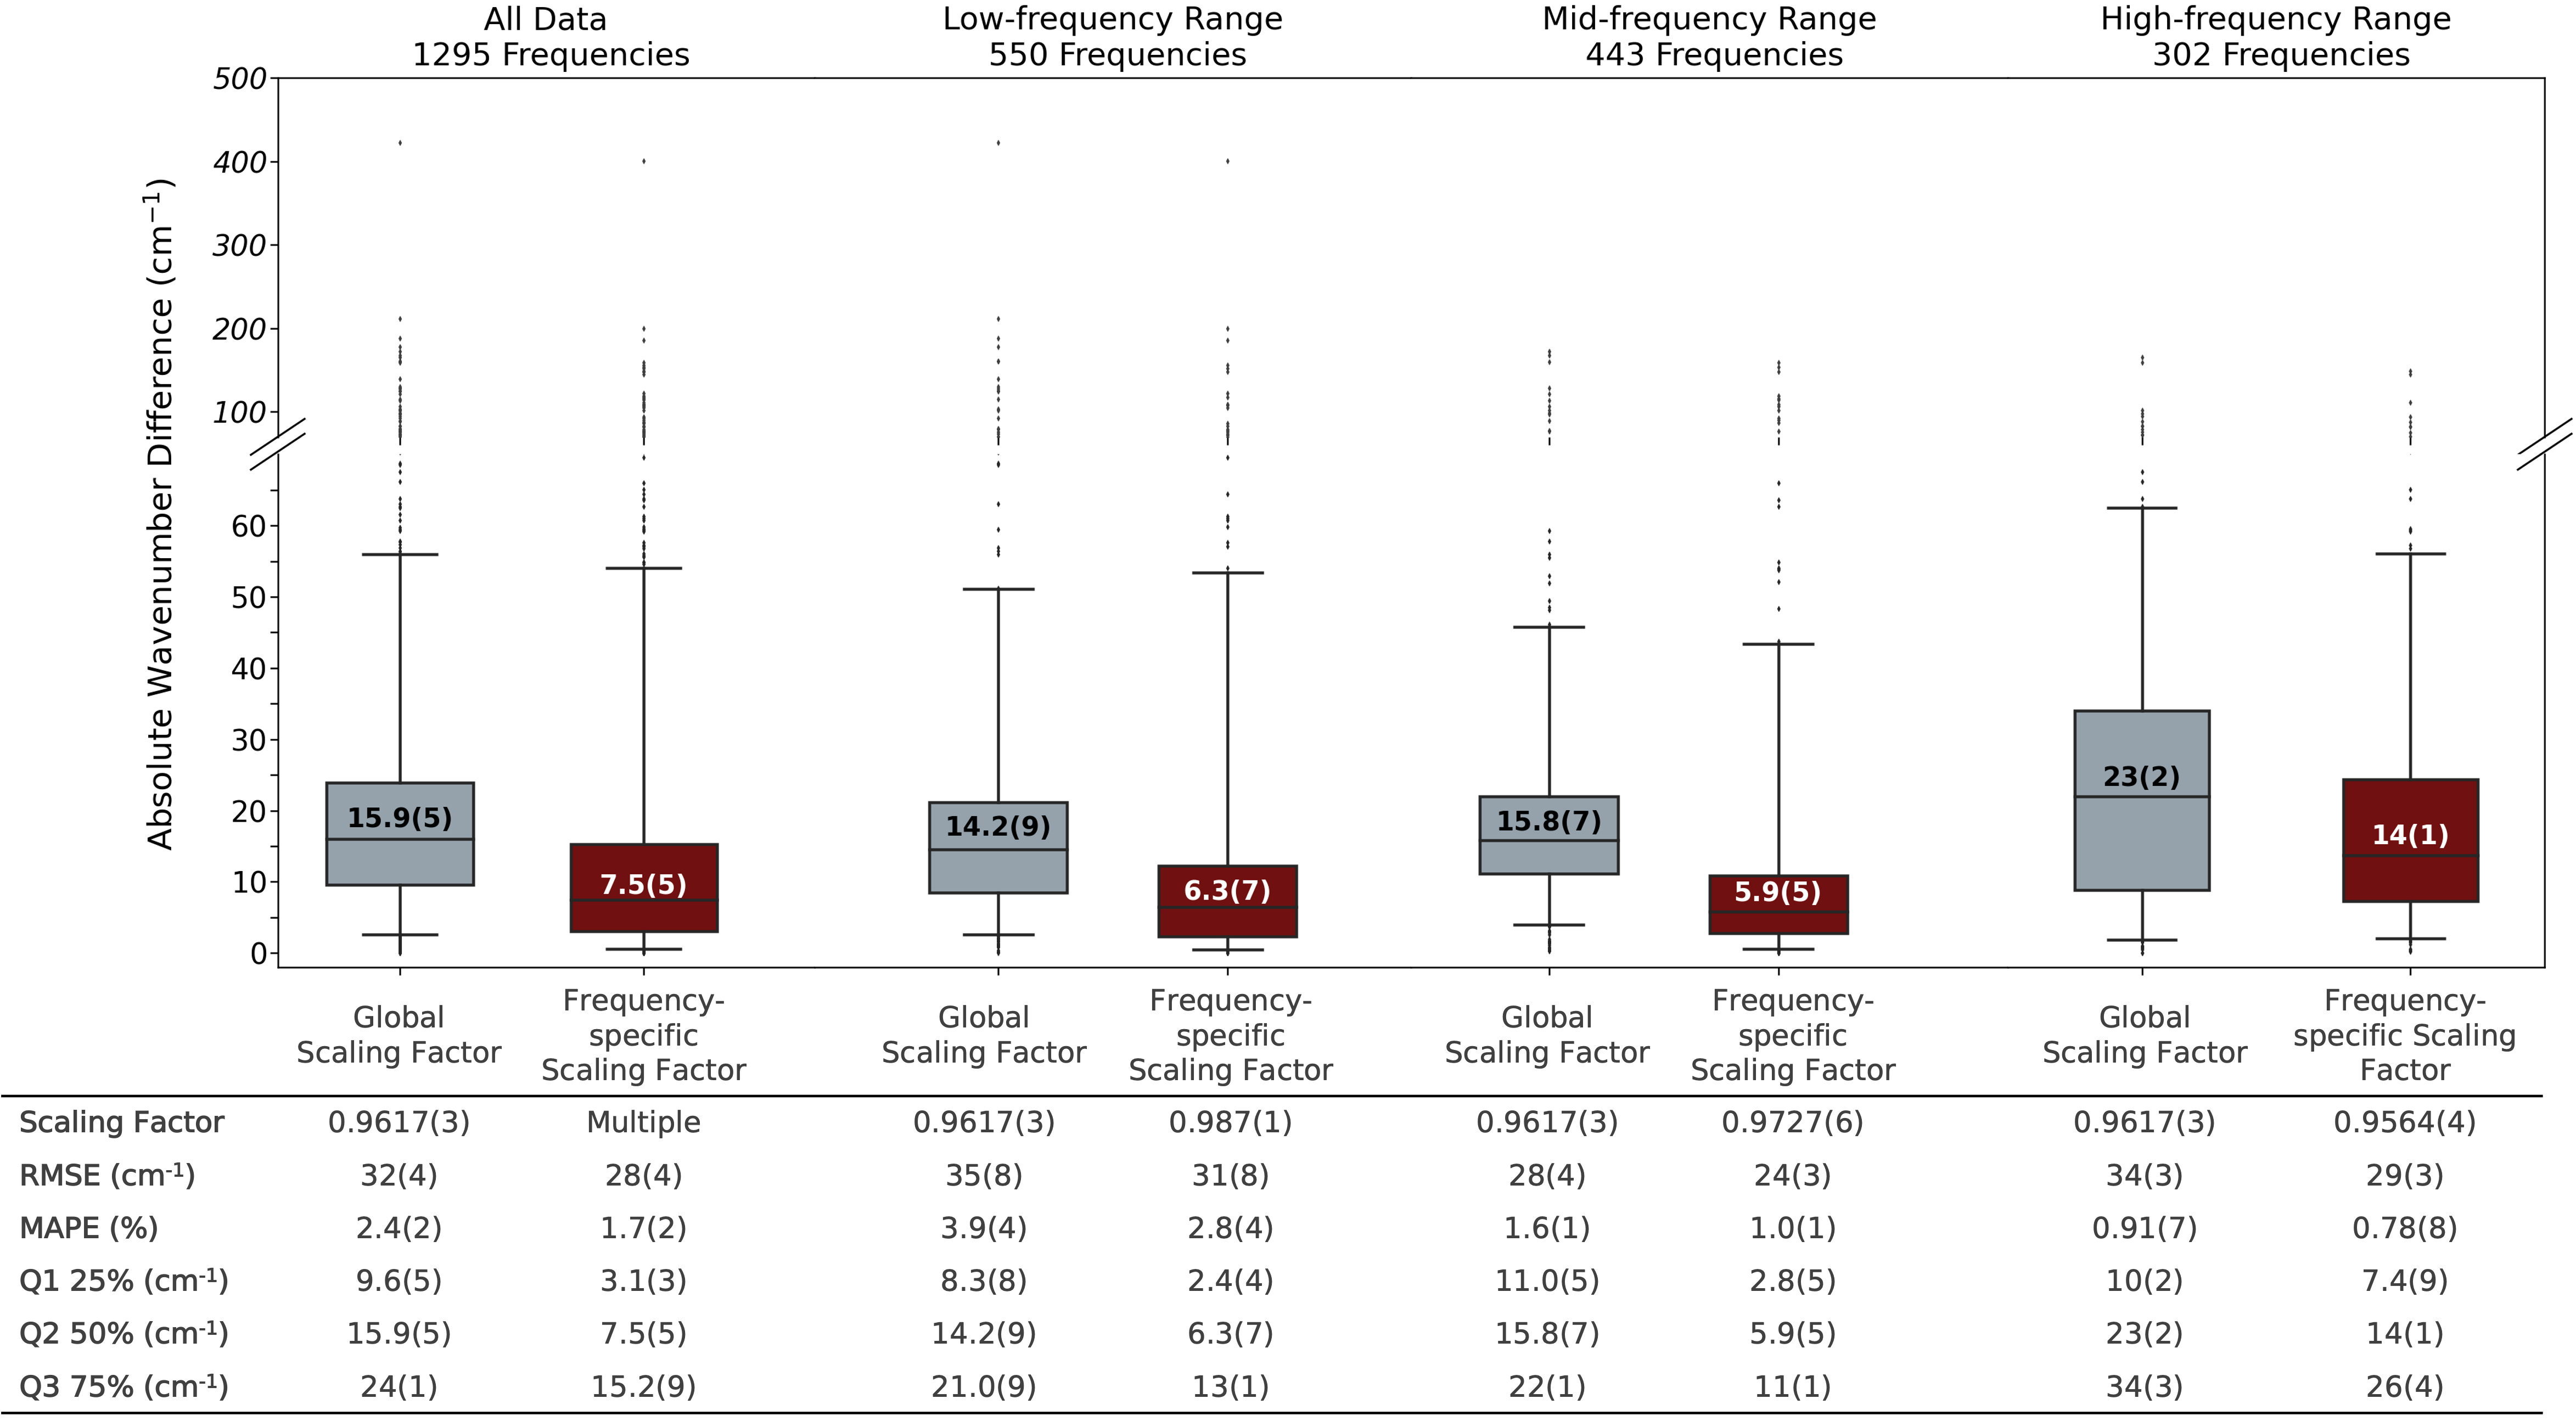
In Figure 8 we present the absolute wavenumber difference (in cm-1) between the scaled harmonic and experimental fundamental frequencies for the defined frequency regions using the following scaling factors: in grey, using the global scaling factor (0.9617(3)) reported in Table 5; and in maroon, using scaling factors optimised for the low- (0.987(1)), mid- (0.9727(6)), and high-frequency (0.9564(4)) regions. Note that the frequency-range-specific scaling factors were calculated by only considering frequencies falling within each range, e.g., the scaling factor for the low-frequency region was calculated by considering frequencies below 1,000 cm-1 only. The number of frequencies in each frequency region is displayed at the top of the figure. The left-most boxes compare the performance of using the global and frequency-range-specific scaling factors in the whole set of data, whereas the rest of the figure compares performance for each frequency range individually. The corresponding scaling factors, RMSEs, mean absolute percentage errors (MAPE), as well as we the first, second (also displayed inside each box), and third quartiles are presented in the table at the bottom of the figure.
Overall, the figure shows a significant improvement in the absolute wavenumber difference when introducing frequency-range-specific scaling factors in the calculations (medians of 15.9(5) vs 7.5(5) cm-1 for the global and frequency-range-specific scaling, respectively). This result suggests that the error in the scaled harmonic frequencies is not constant, but changes gradually with the frequency region and, thus, justifies the implementation of frequency-range-specific over global scaling factors to achieve superior performance. We can confirm this variation by looking at the spread of the absolute wavenumber differences for all three designated frequency regions, where it is evident that the errors generally increase from low- to high-frequency vibrations.
The relatively high errors in the high-frequency range (when using both the global and frequency-range-specific scaling factors) can be explained by inspecting the composition of our database. A closer look into Figure 7 shows that the high-frequency vibrations ( 2,000 cm-1) in VIBFREQ1295 are mostly dominated by stretching-like modes, e.g., C–H, O–H, and N–H stretches, which are inherently more anharmonic than other vibrational modes in the database. This is because stretching modes can naturally lead to bond dissociation, a process not contemplated under the harmonic approximation and thus better represented by anharmonic approaches, while most non-stretching modes are harmonically bound. We can further justify this finding by noting the differences in scaling factors between the three designated frequency regions, where the scaling factor decreases from the low- (0.987(1)) and mid- (0.9727(6)), to the high-frequency (0.9564(4)) range (which also supports splitting the vibrational spectrum in three instead of two frequency regions).
Another potential aspect to examine from this compilation of data is whether the reported metrics in Figure 8 are affected by the type of molecules (halogens and non-halogens), or vibrational modes (stretches and non-stretches) in the database. We opted for excluding this analysis from the main manuscript to avoid over-complicating the narrative; however, we encourage the interested reader to look into the detailed description in the supplemental material. Instead, we summarise our findings into three main points:
-
1.
developing scaling factors specifically tuned for halogen and non-halogen molecules is unnecessary as akin performance in the scaled harmonic frequencies is achieved when utilising the global scaling factor (0.9617(3));
-
2.
despite the large counts of halogen-containing molecules in VIBFREQ1295 (see Figure 4 and Figure 5), applications of this database are not likely to be biased towards a particular molecular group as similar scaling factors and statistical metrics were found for halogen-containing and non-halogen-containing molecules; and
-
3.
using mode-specific scaling factors results in an overall improvement in the scaled harmonic frequencies over using a global scaling factor, potentially suggesting the implementation of different scaling factors whenever a particular vibrational mode is considered, as suggested in previous approaches 390, 391, 392, 393, 394, 395, 396, 397, 11. Nonetheless, stretching and non-stretching modes can be generally assigned to the high and low/mid-frequency ranges of the vibrational spectrum, respectively (see Figure 7), implying that both mode-specific and frequency-range-specific scaling factors are accounting for the same corrections and could be potentially interchanged.
In light of these findings and noting that sorting vibrational frequencies based on their frequency position is more straightforward and reliable than assigning vibrational modes from quantum-chemistry calculations (especially for highly-coupled modes), we encourage the use of frequency-range-specific (low-, mid-, and high-frequency ranges) scaling factors to achieve superior performance in harmonic frequencies calculations.
Despite the overall satisfactory performance of introducing frequency-range-specific scaling factors in harmonic frequency calculations, we also found some scaled harmonic frequencies with significant deviations from the experimental values (data points above the whiskers in Figure 8). The reason behind these large discrepancies is unclear to us as no evident trend is observed in terms of the vibrational mode type, frequency range, or molecular geometry for these frequencies. It might be the case that these frequencies correspond to highly couple modes involving different vibrations simultaneously, which could reach the limits of accuracy within the harmonic approximation; unfortunately, however, there is not a straightforward approach to anticipate this behaviour given a random molecule.
We find open-shell molecules have generally larger errors than closed shell molecules, e.g. of the 10 open-shell species, 7 have at least one frequency with calculation error greater than 50 cm-1. This result is in alignment with previous studies that have shown open-shell systems to be challenging for routine computational quantum chemistry calculations 398, 399, 400, 401, 402. However, it is unclear whether the larger errors in these systems arise purely from increased errors in the computational chemistry method (e.g. from increased multi-reference character in these molecules) or from an increased error in the harmonic approximation for open-shell systems.
As the frequencies with large deviations only account for approximately 5 % of the data distribution (top whiskers lie at 95 %), we expect their occurrence to be minimal in routine calculations. Table S4 in the supplemental material lists all molecules and frequencies with deviations larger than 50 cm-1 from experiment, in addition to their corresponding molecular class and vibrational mode description.
4.4 The Anharmonicity Error
Assuming that harmonic frequency calculations at the CCSD(T)(F12*) 15/cc-pVDZ-F1216, 17 level reduce model chemistry error to a minimum, we can quantify the intrinsic error in the harmonic approximation, a.k.a. the anharmonicity error, by comparing the scaled harmonic and experimental fundamental frequencies in the database.
Using the RMSE as a metric of performance, Kesharwani et al. 21 first estimated this error by scaling experimentally-derived harmonic frequencies against experimental fundamental frequencies for a dataset containing 119 frequencies from 30 molecules (see Figure 1). They found that an optimal scaling factor of 0.9627 results in an RMSE of 24.9 cm-1. We found a very similar scaling factor with the data in our database (0.9617(3) in Table 5). However, our computed RMSE (32(4) cm-1) when implementing the global scaling approach is significantly higher than the Kesharwani et al. 21 value. One potential reason for this deviation lies in the heterogeneity of both data sets, but the approximate errors in our model chemistry choice, e.g., remaining basis set incompleteness error and the lack of higher order correlation effects, could also influence on the accuracy of our results 403, 378, 379.
Using the RMSE as an estimate for anharmonicity error comes with two main limitations: (1) RMSEs are highly influenced by the presence of outliers in the data, and (2) the RMSEs are a single number that doesn’t provide information about the distribution of errors. These limitations are evident in the results in Figure 8 where similar RMSEs are obtained for the different frequency regions when using the global or frequency-range-specific scaling factors despite the error distribution clearly improving substantially when using the frequency-range-specific scaling factors.
Instead of the RMSE, the median error (Q2 50 %) for each absolute wavenumber difference distribution visually represents a more appropriate metric for anticipating the error between the predicted scaled harmonic and experimental fundamental frequency. Thus we recommend that median errors be used instead of RMSE when quantifying anharmonicity error because medians are simple to relate to the usual error of a calculation rather than emphasising outliers like RMSEs.
The median anharmonicity error, and its distribution computed here, sets a lower bound to the reliable performance of a faster more approximate model chemistry such as a hybrid or double-hybrid functional with a double or triple-zeta basis set. Though cancellation of errors could reduce the computed anharmonicity error, there is no physical rationale for this and thus lower errors could be unreliable.
5 Concluding Remarks
Routine quantum-chemistry calculations, e.g., harmonic and anharmonic frequency calculations, have the potential to enable high-throughput approaches for producing approximate spectral data for thousands of molecules of astrochemistry interest 10. However, it is currently unclear what model chemistry should be used and what errors in frequency predictions should be expected; this is essential information to help assess the usefulness of these high-throughput calculations to astrochemistry.
In order to rigorously assess the errors and quantify the minimum error obtainable by scaling harmonic computed vibrational frequencies (without unreliable cancellation of errors), here we introduce a new benchmark database (VIBFREQ1295) for harmonic frequency calculations containing 1,295 experimental fundamental frequencies, and CCSD(T)(F12*)15/cc-pVDZ-F1216, 17 ab initio harmonic frequencies for 141 molecules. The database can be found as part of the supplemental material for this publication, as well as through the Harvard DataVerse 14 (\urlhttps://doi.org/10.7910/DVN/VLVNU7).
VIBFREQ1295’s experimental component is a robust and comprehensive compilation of contemporary experimental fundamental frequencies, providing general updates in previous molecular frequency assignments. The set of compiled literature references in the database spans across nearly 80 years of research in spectroscopy, with a significant proportion of the compiled experimental data corresponding to publications between the 1990s and 2020. More than 30 % of the collated frequencies have been recorded at rovibronic resolution, with the rest of the database compiling fundamental frequencies recorded at moderate resolution. This overall update in the vibrational frequencies was crucial in identifying potentially unnoticed misassignments, frequencies recorded in liquid-phase or with matrix isolation techniques, as well as the use of harmonic rather than fundamental frequencies reported in previous benchmark databases.
The primary application of the VIBFREQ1295 experimental data is to assess the performance of computational chemistry methodologies, most importantly determining the best density functional approximations (DFAs) and basis set combinations for routine calculation of vibrational frequencies, improving on the results compiled in Zapata Trujillo and McKemmish 11 –this work is currently underway. VIBFREQ1295 can also be used to train machine-learning models for predicting vibrational spectra of organic-like molecules. Further, the references for the high-resolution experimental publications in the database represent a good initial source for more detailed spectral data compilations, e.g., model Hamiltonian fits.
The compiled experimental data is complemented by new CCSD(T)(F12*) 15/cc-pVDZ-F1216, 17 ab initio harmonic frequencies calculations for all molecules. The comparison of the experimental and computed data allowed an in-depth analysis of the anharmonicity error, i.e., the error between the experimental fundamental frequency and scaled harmonic frequencies. The anharmonicity error was previously estimated as 24.9 cm-1 21 based on RMSE differences between experimental fundamental and scaled harmonic frequencies; however, our analysis shows that median errors are more appropriate than RMSEs in predicting performance given that RMSEs are dominated by outliers rather than typical expected results. With three frequency-range-specific scaling factors (0.987(1) for frequencies < 1000 cm-1, 0.9727(6) for frequencies between 1000 - 2000 cm-1 and 0.9564(4) for frequencies above 2000 cm-1), our results show a median anharmonicity error of 7.5(5) cm-1 (RMSE 28(4) cm-1); far better than the median 15.9(5) cm-1 (RMSE 32(4) cm-1) anharmonicity error obtained with a uniform global scaling factor of 0.9617(3). We therefore recommend implementing frequency-range-specific scaling factors in harmonic frequency calculations to achieve superior performance. Future benchmarking studies should seek to determine model chemistry choices whose performance can get as close as possible to the anharmonicity error.
This research was undertaken with the assistance of resources from the National Computational Infrastructure (NCI Australia), an NCRIS enabled capability supported by the Australian Government.
The authors declare no conflicts of interest.
The compiled experimental data and calculated harmonic frequencies are presented in the article and within the supplementary information.
Specifically, the VIBFREQ1295 database is provided as a csv file with each row containing specific information for the molecules in the database (e.g., total number of atoms and non-hydrogen atoms, and molecular classification), the experimental fundamental and calculated harmonic frequencies (with vibrational modes descriptions, symmetries, resolution, and references to the original publications), as well as references to the parent databases used in the development of VIBFREQ1295.
We also provide a PDF file detailing the acronyms in the csv file, as well as additional analysis supporting our findings described in the main manuscript.
Alternatively, this data is available through the Harvard DataVerse 14 (\urlhttps://doi.org/10.7910/DVN/VLVNU7).
References
- Bézard et al. 1990 Bézard, B.; De Bergh, C.; Crisp, D.; Maillard, J. P. The deep atmosphere of Venus revealed by high-resolution nightside spectra. Nature 1990, 345, 508–511
- Encrenaz et al. 1999 Encrenaz, T.; Drossart, P.; Feuchtgruber, H.; Lellouch, E.; Bézard, B.; Fouchet, T.; Atreya, S. K. The atmospheric composition and structure of Jupiter and Saturn from ISO observations: A preliminary review. Planetary and Space Science 1999, 47, 1225–1242
- Krasnopoisky and Feldman 2001 Krasnopoisky, V. A.; Feldman, P. D. Detection of molecular hydrogen in the atmosphere of Mars. Science 2001, 294, 1914–1917
- Tielens 2008 Tielens, A. G. Interstellar polycyclic aromatic hydrocarbon molecules. Annual Review of Astronomy and Astrophysics 2008, 46, 289–337
- McGuire et al. 2016 McGuire, B. A.; Brandon Carroll, P.; Loomis, R. A.; Finneran, I. A.; Jewell, P. R.; Remijan, A. J.; Blake, G. A. Discovery of the interstellar chiral molecule propylene oxide (CH3CHCH2O). Science 2016, 352, 1449–1452
- Tennyson and Yurchenko 2012 Tennyson, J.; Yurchenko, S. N. ExoMol: Molecular line lists for exoplanet and other atmospheres. Monthly Notices of the Royal Astronomical Society 2012, 425, 21–33
- Tennyson and Yurchenko 2022 Tennyson, J.; Yurchenko, S. N. High Accuracy Molecular Line Lists for Studies of Exoplanets and Other Hot Atmospheres. Frontiers in Astronomy and Space Sciences 2022, 8, 218
- Seager et al. 2016 Seager, S.; Bains, W.; Petkowski, J. J. Toward a List of Molecules as Potential Biosignature Gases for the Search for Life on Exoplanets and Applications to Terrestrial Biochemistry. Astrobiology 2016, 16, 465–485
- Sousa-Silva et al. 2019 Sousa-Silva, C.; Petkowski, J. J.; Seager, S. Molecular Simulations for the Spectroscopic Detection of Atmospheric Gases. Physical 2019, 21, 18970–18987
- Zapata Trujillo et al. 2021 Zapata Trujillo, J. C. et al. Computational Infrared Spectroscopy of 958 Phosphorus-Bearing Molecules. Frontiers in Astronomy and Space Sciences 2021, 8, 639068
- Zapata Trujillo and McKemmish 2021 Zapata Trujillo, J. C.; McKemmish, L. K. Meta-analysis of uniform scaling factors for harmonic frequency calculations. WIREs Computational Molecular Science 2021, e1584
- Scott and Radom 1996 Scott, A. P.; Radom, L. Harmonic vibrational frequencies: An evaluation of Hartree-Fock, Møller-Plesset, quadratic configuration interaction, density functional theory, and semiempirical scale factors. Journal of Physical Chemistry 1996, 100, 16502–16513
- Pople et al. 1993 Pople, J. A.; Scott, A. P.; Wong, M. W.; Radom, L. Scaling Factors for Obtaining Fundamental Vibrational Frequencies and Zero-Point Energies from HF/6–31G* and MP2/6–31G* Harmonic Frequencies. Israel Journal of Chemistry 1993, 33, 345–350
- Zapata Trujillo and McKemmish 2022 Zapata Trujillo, J.; McKemmish, L. VIBFREQ1295. 2022; \urlhttps://doi.org/10.7910/DVN/VLVNU7
- Hättig et al. 2010 Hättig, C.; Tew, D. P.; Köhn, A. Communications: Accurate and efficient approximations to explicitly correlated coupled-cluster singles and doubles, CCSD-F12. Journal of Chemical Physics 2010, 132, 231102
- Peterson et al. 2008 Peterson, K. A.; Adler, T. B.; Werner, H. J. Systematically convergent basis sets for explicitly correlated wavefunctions: The atoms H, He, B-Ne, and Al-Ar. Journal of Chemical Physics 2008, 128, 084102
- Hill and Peterson 2010 Hill, J. G.; Peterson, K. A. Correlation consistent basis sets for explicitly correlated wavefunctions: Valence and core-valence basis sets for Li, Be, Na, and Mg. Physical Chemistry Chemical Physics 2010, 12, 10460–10468
- Witek and Morokuma 2004 Witek, H. A.; Morokuma, K. Systematic study of vibrational frequencies calculated with the self-consistent charge density functional tight-binding method. Journal of Computational Chemistry 2004, 25, 1858–1864
- Ünal et al. 2021 Ünal, Y.; Nassif, W.; Özaydin, B. C.; Sayin, K. Scale factor database for the vibration frequencies calculated in M06-2X, one of the DFT methods. Vibrational Spectroscopy 2021, 112, 103189
- Healy and Holder 1993 Healy, E. F.; Holder, A. An evaluation of AM1 calculated vibrational frequencies. Journal of Molecular Structure: THEOCHEM 1993, 281, 141–156
- Kesharwani et al. 2015 Kesharwani, M. K.; Brauer, B.; Martin, J. M. Frequency and zero-point vibrational energy scale factors for double-hybrid density functionals (and other selected methods): Can anharmonic force fields be avoided? Journal of Physical Chemistry A 2015, 119, 1701–1714
- Alecu et al. 2010 Alecu, I. M.; Zheng, J.; Zhao, Y.; Truhlar, D. G. Computational Thermochemistry: Scale Factor Databases and Scale Factors for Vibrational Frequencies Obtained from Electronic Model Chemistries. Journal of Chemical Theory and Computation 2010, 6, 2872–2887
- Tomita et al. 1983 Tomita, T.; Sjøgren, C. E.; Klaeboe, P.; Papatheodorou, G. N.; Rytter, E. High-temperature infrared and Raman spectra of aluminium chloride dimer and monomer in the vapour phase. Journal of Raman Spectroscopy 1983, 14, 415–425
- Orphal 2019 Orphal, J. High-resolution spectroscopy and analysis of the 3 bands of ClNO (nitrosyl chloride) around 30 µm. Journal of Quantitative Spectroscopy and Radiative Transfer 2019, 230, 115–119
- McDonald et al. 1988 McDonald, J. K.; Kalasinsky, V. F.; Geyer, T. J.; Durig, J. R. High-resolution infrared spectra of the 1, 2, and 3 fundamentals of ON35Cl. Journal of Molecular Spectroscopy 1988, 132, 104–122
- Fernando and Bernath 1991 Fernando, W. T.; Bernath, P. F. Fourier transform spectroscopy of the A1-X1+ transition of BH and BD. Journal of Molecular Spectroscopy 1991, 145, 392–402
- Durig et al. 1994 Durig, J.; Kim, Y. H.; Guirgis, G.; McDonald, J. FT-Raman and infrared spectra, r0 structural parameters, ab initio calculations and vibrational assignment for nitryl chloride. Spectrochimica Acta Part A: Molecular Spectroscopy 1994, 50, 463–472
- Flaud et al. 2019 Flaud, J. M.; Anantharajah, A.; Tchana, F. K.; Manceron, L.; Orphal, J.; Wagner, G.; Birk, M. High-resolution analysis of the 12.6 µm spectral region of the nitryl chloride ClNO2 molecule. Journal of Quantitative Spectroscopy and Radiative Transfer 2019, 224, 217–221
- Anantharajah et al. 2020 Anantharajah, A.; Kwabia Tchana, F.; Manceron, L.; Orphal, J.; Flaud, J. M. New analysis of line positions of the 3 bands of 35ClNO2 and 37ClNO2 around 370 cm-1. Journal of Quantitative Spectroscopy and Radiative Transfer 2020, 253, 107078
- Orphal et al. 1994 Orphal, J.; Morillon-Chapey, M.; Guelachvili, G. The high-resolution infrared spectrum of nitryl chloride: Rotational analysis of the 35cino2 4 band around 6 m. Journal of Molecular Spectroscopy 1994, 165, 315–322
- Orphal et al. 1998 Orphal, J.; Morillon-Chapey, M.; Klee, S.; Mellau, G. C.; Winnewisser, M. The Far-Infrared Spectrum of ClNO 2 Studied by High-Resolution Fourier-Transform Spectroscopy. Journal of Molecular Spectroscopy 1998, 190, 101–106
- Bethke et al. 1957 Bethke, G. W.; Kent Wilson, M.; BETHKEt, O.; KENT WILSONt, M. Vibrational Spectrum of Borine Carbonyl. The Journal of Chemical Physics 1957, 26, 1118
- Lambert et al. 1972 Lambert, L.; Pépin, C.; Cabana, A. High resolution infrared absorption spectrum of borine carbonyl: The analysis of 4 and 4 + 8 - 8 of 11BH3CO. Journal of Molecular Spectroscopy 1972, 44, 578–593
- Pépin et al. 1976 Pépin, C.; Lambert, L.; Cabana, A. High-resolution infrared spectrum of borine carbonyl. The 7 perpendicular band of 10BH3CO at 12 m. Journal of Molecular Spectroscopy 1976, 59, 43–50
- Drouin et al. 2001 Drouin, B. J.; Miller, C. E.; Cohen, E. A.; Wagner, G.; Birk, M. Further Investigations of the ClO Rotational Spectrum. Journal of Molecular Spectroscopy 2001, 207, 4–9
- Melen et al. 1985 Melen, F.; Dubois, I.; Bredohl, H. The A-X and B-X transitions of BO. Journal of Physics B: Atomic and Molecular Physics (1968-1987) 1985, 18, 2423
- Prasad and Bernath 1992 Prasad, C. V.; Bernath, P. F. Fourier transform jet-emission spectroscopy of the A2i-X2+ transition of CN. Journal of Molecular Spectroscopy 1992, 156, 327–340
- Dorofeeva and Gurvich 1995 Dorofeeva, O. V.; Gurvich, L. V. Ideal Gas Thermodynamic Properties of Sulphur Heterocyclic Compounds. Journal of Physical and Chemical Reference Data 1995, 24, 1351–1375
- Le Floch 1991 Le Floch, A. Revised molecular constants for the ground state of CO. Molecular Physics 1991, 72, 133–144
- Hegelund et al. 2007 Hegelund, F.; Larsen, R. W.; Palmer, M. H. High-resolution infrared and theoretical study of gaseous oxazole in the 600-1400 cm-1 region. Journal of Molecular Spectroscopy 2007, 241, 26–44
- Mille et al. 1975 Mille, G.; Pouchan, C.; Sauvaitre, H.; Chouteau, J. Étude expérimentale et théorique des vibrations moléculaires de l’oxazole. Journal de Chimie Physique 1975, 72, 37–41
- Miller and Brown 2004 Miller, C. E.; Brown, L. R. Near infrared spectroscopy of carbon dioxide I. 16O 12C16O line positions. Journal of Molecular Spectroscopy 2004, 228, 329–354
- Kauppinen et al. 1982 Kauppinen, J.; Jolma, K.; Horneman, V.-M. New wave-number calibration tables for H2O, CO2, and OCS lines between 500 and 900 cm-1. Applied Optics 1982, 21, 3332
- Robertson 2005 Robertson, E. G. Vibrational assignment of isoxazole aided by rovibrational data and density functional theory. Journal of Molecular Spectroscopy 2005, 231, 50–56
- Kwabia Tchana et al. 2015 Kwabia Tchana, F.; Lafferty, W. J.; Flaud, J. M.; Manceron, L.; Ndao, M. High-resolution analysis of the v1 and v5 bands of phosgene 35Cl2CO and 35Cl37ClCO. Molecular Physics 2015, 113, 3241–3246
- Flaud et al. 2017 Flaud, J.-M.; Kwabia Tchana, F.; Lafferty, W. J.; Perrin, A.; Manceron, L.; Ndao, M. First far-infrared high-resolution analysis of the 2 and 4 bands of phosgene 35 Cl 2 CO and 35 Cl 37 ClCO. Molecular Physics 2017, 116, 3463–3467
- Ndao et al. 2016 Ndao, M.; Perrin, A.; Kwabia Tchana, F.; Manceron, L.; Flaud, J. M. First far-infrared high resolution analysis of the 3 band of phosgene 35Cl2CO and 35Cl37ClCO. Journal of Molecular Spectroscopy 2016, 326, 90–94
- Flaud et al. 2016 Flaud, J. M.; Tchana, F. K.; Lafferty, W. J.; Manceron, L.; Ndao, M. First far-infrared high resolution analysis of the 6 band of phosgene 35Cl2CO and 35Cl37ClCO. Journal of Molecular Spectroscopy 2016, 326, 87–89
- Butcher and Jones 1973 Butcher, R. J.; Jones, W. J. Cyclopropane: Studies of some vibration-rotation Raman bands. Journal of Molecular Spectroscopy 1973, 47, 64–83
- Masiello et al. 2009 Masiello, T.; Maki, A.; Blake, T. A. Analysis of the high-resolution infrared spectrum of cyclopropane. Journal of Molecular Spectroscopy 2009, 255, 45–55
- Plíva et al. 1992 Plíva, J.; Merdes, D. W.; Pine, A. S. Parallel bands of cyclopropane in the 3.2-m region. Journal of Molecular Spectroscopy 1992, 153, 133–144
- Merdes et al. 1991 Merdes, D. W.; Plíva, J.; Pine, A. S. Perpendicular bands of cyclopropane in the 3.5 m region. Journal of Molecular Spectroscopy 1991, 147, 431–447
- Plíva et al. 1989 Plíva, J.; Terki-Hasseine, M.; Lavorel, B.; Saint-Loup, R.; Santos, J.; Schrötter, H. W.; Berger, H. Inverse Raman spectrum of cyclopropane in the region 3000-3050 cm-1. Journal of Molecular Spectroscopy 1989, 133, 157–170
- Perrin et al. 2001 Perrin, A.; Flaud, J. M.; Bürger, H.; Pawelke, G.; Sander, S.; Willner, H. First high-resolution analysis of the six fundamental bands v1, v2, v3, v4, v5, and v6 of COF35Cl in the 340- to 2000-cm-1 region. Journal of Molecular Spectroscopy 2001, 209, 122–132
- Shaw et al. 1988 Shaw, R. A.; Castro, C.; Ibrahim, N.; Wieser, H. Vibrational spectra and scaled ab initio harmonic force field for thietane and several deuteriated isotopomers. Journal of Physical Chemistry 1988, 92, 6528–6536
- McPhail et al. 1997 McPhail, M. J.; Duxbury, G.; May, R. D. The 1, 22, and 23+ 4Band System of Carbonyl Fluoride. Journal of Molecular Spectroscopy 1997, 182, 118–123
- Cohen et al. 2013 Cohen, E. A.; Drouin, B. J.; Brown, L. R.; Oh, J. J. Terahertz and infrared spectra of carbonyl fluoride, COF2: Vibration-rotation analyses of the four lowest bands, 26, and 6 hot bands; 13COF2 ground state and 6 band. Journal of Quantitative Spectroscopy and Radiative Transfer 2013, 114, 13–19
- Camy-Peyret et al. 1991 Camy-Peyret, C.; Flaud, J. M.; Goldman, A.; Murcray, F. J.; Blatherwick, R. D.; Bonomo, F. S.; Murcray, D. G.; Rinsland, C. P. The 4 band of carbonyl fluoride. Journal of Molecular Spectroscopy 1991, 149, 481–490
- Hewett et al. 1994 Hewett, K. B.; Shen, M.; Brummel, C. L.; Philips, L. A. High resolution infrared spectroscopy of pyrazine and naphthalene in a molecular beam. The Journal of Chemical Physics 1994, 100, 4077–4086
- Ram et al. 1995 Ram, R. S.; Bernath, P. F.; Davis, S. P. Fourier transform infrared emission spectroscopy of CS. Journal of Molecular Spectroscopy 1995, 173, 146–157
- Mellouki et al. 2001 Mellouki, A.; Vander Auwera, J.; Demaison, J.; Herman, M. Rotational analysis of the v6 band in furan (C4H4O). Journal of Molecular Spectroscopy 2001, 209, 136–138
- Klots et al. 1994 Klots, T. D.; Chirico, R. D.; Steele, W. V. Complete vapor phase assignment for the fundamental vibrations of furan, pyrrole and thiophene. Spectrochimica Acta Part A: Molecular Spectroscopy 1994, 50, 765–795
- Pankoke et al. 1993 Pankoke, B.; Yamada, K. M.; Winnewisser, G. High Resolution I R-Spectra of Furane and Thiophene. Zeitschrift fur Naturforschung - Section A Journal of Physical Sciences 1993, 48, 1193–1202
- Tokaryk et al. 2011 Tokaryk, D. W.; Culligan, S. D.; Billinghurst, B. E.; Van Wijngaarden, J. A. Synchrotron-based far-infrared spectroscopy of furan: Rotational analysis of the 14, 11, 18 and 19 vibrational levels. Journal of Molecular Spectroscopy 2011, 270, 56–60
- Mellouki et al. 1999 Mellouki, A.; Herman, M.; Demaison, J.; Lemoine, B.; Margulès, L. Rotational Analysis of the 7 Band in Furan (C4H4O). Journal of Molecular Spectroscopy 1999, 198, 348–357
- Mellouki et al. 2001 Mellouki, A.; Liévin, J.; Herman, M. The vibrational spectrum of pyrrole (C4H5N) and furan (C4H4O) in the gas phase. Chemical Physics 2001, 271, 239–266
- Wells et al. 1988 Wells, J. S.; Schneider, M.; Maki, A. G. Calibration tables covering the 1460- to 1550-cm-1 region from heterodyne frequency measurements on the 3 bands of 12CS2 and 13CS2. Journal of Molecular Spectroscopy 1988, 132, 422–428
- Blanquet et al. 1985 Blanquet, G.; Baeten, E.; Cauuet, I.; Walrand, J.; Courtoy, C. P. Diode-laser measurements of carbon disulfide and general rovibrational analysis. Journal of Molecular Spectroscopy 1985, 112, 55–70
- Jolma and Kauppinen 1980 Jolma, K.; Kauppinen, J. High-resolution infrared spectrum of CS2 in the region of the bending fundamental 2. Journal of Molecular Spectroscopy 1980, 82, 214–219
- Hegelund et al. 2008 Hegelund, F.; Wugt Larsen, R.; Palmer, M. H. The high-resolution infrared spectrum of pyrrole between 900 and 1500 cm-1 revisited. Journal of Molecular Spectroscopy 2008, 252, 93–97
- Mellouki et al. 1999 Mellouki, A.; Vander Auwera, J.; Herman, M. Rotation-vibration constants for the 1, 22, 24, 22 + 24, and ground states in pyrrole (12C4H5N). Journal of Molecular Spectroscopy 1999, 193, 195–203
- Held and Herman 1995 Held, A.; Herman, M. High resolution spectroscopic study of the first overtone of the N-H stretch and of the fundamentals of the C-H stretches in pyrrole. Chemical Physics 1995, 190, 407–417
- Tokaryk and van Wijngaarden 2009 Tokaryk, D. W.; van Wijngaarden, J. A. Fourier transform spectra of the 16 , 2 16 , and 2 16 – 16 bands of pyrrole taken with synchrotron radiationThis article is part of a Special Issue on Spectroscopy at the University of New Brunswick in honour of Colan Linton and Ron Lees. Canadian Journal of Physics 2009, 87, 443–448
- McKellar and Billinghurst 2010 McKellar, A. R.; Billinghurst, B. E. High-resolution synchrotron infrared spectroscopy of thiophosgene: The 2 and 4 fundamental bands near 500 cm-1. Journal of Molecular Spectroscopy 2010, 260, 66–71
- McKellar and Billinghurst 2015 McKellar, A. R.; Billinghurst, B. E. High-resolution synchrotron infrared spectroscopy of thiophosgene: The 1, 5, 24, and 2 + 26 bands. Journal of Molecular Spectroscopy 2015, 315, 24–29
- Frenzel et al. 1970 Frenzel, C. A.; Blick, K. E.; Bennett, C. R.; Niedenzu, K. Investigations of the Raman and infrared spectra of thiophosgene and polymeric species. The Journal of Chemical Physics 1970, 53, 198–204
- Hopper et al. 1972 Hopper, M. J.; Russell, J. W.; Overend, J. Vibrational intensities—XXVI CSF2 and CSCl2. Spectrochimica Acta Part A: Molecular Spectroscopy 1972, 28, 1215–1224
- Klots 1998 Klots, T. Raman vapor spectrum and vibrational assignment for pyridine. Spectrochimica Acta Part A: Molecular and Biomolecular Spectroscopy 1998, 54, 1481–1498
- Martinez et al. 1994 Martinez, R.; Bermejo, D.; Santos, J.; Cancio, P. High-Resolution Stimulated Raman Spectrum of F2. Journal of Molecular Spectroscopy 1994, 168, 343–349
- Billes et al. 2000 Billes, F.; Endrédi, H.; Keresztury, G. Vibrational spectroscopy of triazoles and tetrazole. Journal of Molecular Structure: THEOCHEM 2000, 530, 183–200
- Bürger and Schippel 1987 Bürger, H.; Schippel, G. FTIR investigation and rovibrational analysis of the 2 fundamental of OF2. Journal of Molecular Spectroscopy 1987, 121, 238–241
- Taubmann et al. 1986 Taubmann, G.; Jones, H.; Rudolph, H. D.; Takami, M. Diode laser spectroscopy of the 1 22 Fermi diad of OF2. Journal of Molecular Spectroscopy 1986, 120, 90–100
- Taubmann 1987 Taubmann, G. Diode Laser Spectroscopy of the v3 Band of OF2. Zeitschrift fur Naturforschung - Section A Journal of Physical Sciences 1987, 42, 87–90
- McNaughton 1992 McNaughton, D. High resolution infrared spectrum and molecular structure of dichloroacetylene. Structural Chemistry 1992 3:4 1992, 3, 245–252
- Klaboe et al. 1970 Klaboe, P.; Kloster-Jensen, E.; Christensen, D. H.; Johnsen, I. The vibrational spectra of dichloro-, dibromo-, diiodo-, bromochloro- and chloroiodoacetylene. Spectrochimica Acta Part A: Molecular Spectroscopy 1970, 26, 1567–1580
- O’Hara and Noftle 1982 O’Hara, T. J.; Noftle, R. E. The vibrational spectrum of thionynyl fluoride and its oxygen-18 isotopomer. Journal of Fluorine Chemistry 1982, 20, 149–156
- Davies et al. 2003 Davies, C. J.; Newnham, D. A.; Smith, D. M. High-resolution Fourier-transform infrared spectroscopy of the 2 fundamental band of thionyl fluoride, SOF2. Physical Chemistry Chemical Physics 2003, 5, 446–450
- Vanderauwera et al. 1993 Vanderauwera, J.; Hurtmans, D.; Carleer, M.; Herman, M. The 3 Fundamental in C2H2. Journal of Molecular Spectroscopy 1993, 157, 337–357
- Hietanen and Kauppinen 1981 Hietanen, J.; Kauppinen, J. High-resolution infrared spectrum of acetylene in the region of the bending fundamental v 5. Molecular Physics 1981, 42, 411–423
- Fast and Welsh 1972 Fast, H.; Welsh, H. High-resolution Raman spectra of acetylene, acetylene-d1, and acetylene-d2. Journal of Molecular Spectroscopy 1972, 41, 203–221
- Cole et al. 1967 Cole, A.; Isaacson, L.; Lord, R. Two vibration-rotation bands of cyanogen fluoride. Journal of Molecular Spectroscopy 1967, 23, 86–93
- Farkhsi et al. 1997 Farkhsi, A.; Bredohl, H.; Dubois, I.; Remy, F.; Fayt, A. Fourier transform infrared spectrum of FCN: The 1800-2800 cm-1 spectral range. Journal of Molecular Spectroscopy 1997, 181, 119–126
- Jones et al. 1985 Jones, H.; Lindenmayer, J.; Takami, M. The 1 fundamental and associated hot bands of three isotopic forms of cyanogen fluoride by diode laser spectroscopy. Journal of Molecular Spectroscopy 1985, 113, 339–354
- Nemes et al. 2000 Nemes, L.; Luckhaus, D.; Quack, M.; Johns, J. W. Deperturbation of the low-frequency infrared modes of ketene (CH2CO). Journal of Molecular Structure 2000, 517-518, 217–226
- Duncan et al. 1987 Duncan, J. L.; Ferguson, A. M.; Harper, J.; Tonge, K. H. A combined empirical-ab initio determination of the general harmonic force field of ketene. Journal of Molecular Spectroscopy 1987, 125, 196–213
- Escribano et al. 1994 Escribano, R.; Doménech, J. L.; Cancio, P.; Ortigoso, J.; Santos, J.; Bermejo, D. The v1 band of ketene. The Journal of Chemical Physics 1994, 101, 937–949
- Duncan et al. 1987 Duncan, J. L.; Ferguson, A. M.; Harper, J.; Tonge, K. H.; Hegelund, F. High-resolution infrared rovibrational studies of the A1 species fundamentals of isotopic ketenes. Journal of Molecular Spectroscopy 1987, 122, 72–93
- Johns et al. 1972 Johns, J. W.; Stone, J. M.; Winnewisser, G. The ground state of ketene. Journal of Molecular Spectroscopy 1972, 42, 523–535
- Perrin et al. 2006 Perrin, A.; Valentin, A.; Daumont, L. New analysis of the 24, 4+6, 26, 3+4, 3+ 6, 1. Journal of Molecular Structure 2006, 780-781, 28–44
- Perrin et al. 2003 Perrin, A.; Keller, F.; Flaud, J. M. New analysis of the v2, v3, v4 and v6 bands of formaldehyde H212C16O line positions and intensities in the 5-10 m spectral region. Journal of Molecular Spectroscopy 2003, 221, 192–198
- Profeta et al. 2011 Profeta, L. T.; Sams, R. L.; Johnson, T. J.; Williams, S. D. Quantitative infrared intensity studies of vapor-phase glyoxal, methylglyoxal, and 2,3-butanedione (diacetyl) with vibrational assignments. Journal of Physical Chemistry A 2011, 115, 9886–9900
- Cole and Osborne 1970 Cole, A. R.; Osborne, G. A. Rotational fine structure of the antisymmetric CH stretching band 9, of glyoxal. Journal of Molecular Spectroscopy 1970, 36, 376–385
- Wugt Larsen et al. 2002 Wugt Larsen, R.; Hegelund, F.; Ceponkus, J.; Nelander, B. A high-resolution ft-ir study of the fundamental bands v6, v10, and v11 of trans-glyoxal. Journal of Molecular Spectroscopy 2002, 211, 127–134
- Cole and Osborne 1971 Cole, A. R.; Osborne, G. A. Vibrational spectra of glyoxal, monodeuteroglyoxal and dideuteroglyoxal. Spectrochimica Acta Part A: Molecular Spectroscopy 1971, 27, 2461–2490
- Benedict et al. 1956 Benedict, W. S.; Gailar, N.; Plyler, E. K. Rotation-vibration spectra of deuterated water vapor. The Journal of Chemical Physics 1956, 24, 1139–1165
- Camy-Peyret and Flaud 1976 Camy-Peyret, C.; Flaud, J. M. Line positions and intensities in the v2 band of H216O. Molecular Physics 1976, 32, 523–537
- Enomoto and Asahina 1966 Enomoto, S.; Asahina, M. Infrared spectra of vinyl chloride and its deuterated derivatives. Journal of Molecular Spectroscopy 1966, 19, 117–130
- De Lorenzi et al. 2000 De Lorenzi, A.; Giorgianni, S.; Bini, R. High-resolution FTIR spectrum of vinyl chloride: Rovibrational analysis of the v10 and v11 fundamental bands. Molecular Physics 2000, 98, 355–362
- Giorgianni et al. 1997 Giorgianni, S.; Stoppa, P.; De Lorenzi, A. Infrared laser spectroscopy of the nu band of CH2–CH37Cl. Molecular Physics 1997, 92, 301–306
- Stoppa et al. 1997 Stoppa, P.; Giorgianni, S.; Ghersetti, S. Infrared measurements and rovibrational study of the v7 band of vinyl chloride by diode laser spectroscopy. Molecular Physics 1997, 91, 215–222
- Demaison et al. 2005 Demaison, J.; Møllendal, H.; Perrin, A.; Orphal, J.; Tchana, F. K.; Rudolph, H. D.; Willaert, F. Microwave and high resolution infrared spectra of vinyl chloride, ab initio anharmonic force field and equilibrium structure. Journal of Molecular Spectroscopy 2005, 232, 174–185
- Giorgianni et al. 1992 Giorgianni, S.; De Lorenzi, A.; Stoppa, P.; Ghersetti, S. Infrared spectrum and rovibrational analysis of the 6 band of vinyl chloride by diode laser spectroscopy. Journal of Molecular Spectroscopy 1992, 156, 373–382
- Brown et al. 1998 Brown, L. R.; Crisp, J. A.; Crisp, D.; Naumenko, O. V.; Smirnov, M. A.; Sinitsa, L. N.; Perrin, A. The absorption spectrum of H2S between 2150 and 4260 cm-1: Analysis of the positions and intensities in the first (22, 1, and 3) and second (32, 1 + 2, and 2 + 3) triad regions. Journal of Molecular Spectroscopy 1998, 188, 148–174
- Ulenikov et al. 1996 Ulenikov, O. N.; Malikova, A. B.; Koivusaari, M.; Alanko, S.; Anttila, R. High resolution vibrational-rotational spectrum of H2S in the region of the v2 fundamental band. Journal of Molecular Spectroscopy 1996, 176, 229–235
- Parellada et al. 1979 Parellada, R.; Perez-Peña, J.; Arenas, J. F. Infrared spectrum of acetonitrile-15N. Journal of Molecular Structure 1979, 51, 1–7
- Parekunnel et al. 1999 Parekunnel, T.; Hirao, T.; Le Roy, R. J.; Bernath, P. F. FTIR Emission Spectra and Molecular Constants for DCl. Journal of Molecular Spectroscopy 1999, 195, 185–191
- Williams 1956 Williams, R. L. Infrared Spectrum of Methyl Isocyanide. The Journal of Chemical Physics 1956, 25, 656
- He and Bernheim 1992 He, C.; Bernheim, R. High-resolution spectroscopy of methyl isocyanide: The 4 fundamental and ground state constants. Journal of Molecular Spectroscopy 1992, 155, 365–383
- Le et al. 1995 Le, L.; Pliva, J.; Gold, L.; Bernheim, R. High-Resolution Infrared Spectroscopy of Methyl Isocyanide: The 3, 6, and 7 + 8 Bands. Journal of Molecular Spectroscopy 1995, 170, 506–515
- Khlifi et al. 1996 Khlifi, M.; Paillous, P.; Bruston, P.; Raulin, F.; Guillemin, J. C. Absolute IR band intensities of CH2N2, CH3N3, and CH3NC in the 250-4300 cm-1 region and upper limits of abundance in Titan’s stratosphere. Icarus 1996, 124, 318–328
- Maki et al. 2000 Maki, A. G.; Mellau, G. C.; Klee, S.; Winnewisser, M.; Quapp, W. High-temperature infrared measurements in the region of the bending fundamental of H12C14N, H12C15N, and H13C14N. Journal of Molecular Spectroscopy 2000, 202, 67–82
- Berney and Cormier 1972 Berney, C. V.; Cormier, A. D. Vibrational spectra of acetyl fluoride and acetyl fluoride-d3. Spectrochimica Acta Part A: Molecular Spectroscopy 1972, 28, 1813–1822
- Dane et al. 1988 Dane, C. B.; Lander, D. R.; Curl, R. F.; Tittel, F. K.; Guo, Y.; Ochsner, M. I.; Moore, C. B. Infrared flash kinetic spectroscopy of HCO. The Journal of Chemical Physics 1988, 88, 2121–2128
- Brown et al. 1983 Brown, J. M.; Dumper, K.; Lowe, R. S. Further measurement and analysis of lines in the LMR spectrum of HCO at 5.3 m. Journal of Molecular Spectroscopy 1983, 97, 441–448
- Johns et al. 1978 Johns, J. W.; McKellar, A. R.; Riggin, M. Laser magnetic resonance spectroscopy of the 3 fundamental band of HO2 at 9.1 m. The Journal of Chemical Physics 1978, 68, 3957–3966
- Hollenstein and Günthard 1971 Hollenstein, H.; Günthard, H. H. Solid state and gas infrared spectra and normal coordinate analysis of 5 isotopic species of acetaldehyde. Spectrochimica Acta Part A: Molecular Spectroscopy 1971, 27, 2027–2060
- Andrews et al. 1995 Andrews, A. M.; Tretyakov, M. Y.; Pate, B. H.; Fraser, G. T.; Kleiner, I. Fourier-transform infrared and jet-cooled diode-iaser spectra of the 867 cm-1 v9 band of acetaldehyde. Molecular Physics 1995, 84, 201–210
- Herman et al. 1999 Herman, M.; Herregodts, F.; Georges, R.; Hepp, M.; Hadj Bachir, I.; Lecoutre, M.; Kleiner, I. Spectroscopic investigation of vibration-rotation bands in acetaldehyde:: Focus on the n3 (n=1-5) aldehyde CH stretch bands. Chemical Physics 1999, 246, 433–443
- Hollenstein 1980 Hollenstein, H. Coriolis resonance in cs-asymmetric tops analysis of the5, v12- and v8, v13-coriolis resonance bands in the infrared spectrum of acetaldehyde. Molecular Physics 1980, 39, 1013–1033
- Kleiner and Herman 1994 Kleiner, I.; Herman, M. The fundamental 14 band of acetaldehyde. Journal of Molecular Spectroscopy 1994, 167, 300–313
- Steiner et al. 1983 Steiner, D. A.; Polo, S. R.; McCubbin, T. K.; Wishah, K. A. Infrared spectrum of the fundamental 2 of isocyanic acid. Journal of Molecular Spectroscopy 1983, 98, 453–483
- Yamada et al. 1990 Yamada, K. M.; Winnewisser, M.; Johns, J. W. High-resolution spectrum of the 1 fundamental band of isocyanic acid, HNCO. Journal of Molecular Spectroscopy 1990, 140, 353–372
- Brown et al. 1997 Brown, S. S.; Berghout, H. L.; Crim, F. F. Raman spectroscopy of the N–C–O symmetric (3) and antisymmetric (2) stretch fundamentals in HNCO. The Journal of Chemical Physics 1997, 107, 9764–9771
- Steiner et al. 1979 Steiner, D. A.; Wishah, K. A.; Polo, S. R.; McCubbin, T. K. Infrared spectrum of isocyanic acid between 465 and 1100 cm-1. Journal of Molecular Spectroscopy 1979, 76, 341–373
- Chao et al. 1986 Chao, J.; Hall, K. R.; Marsh, K. N.; Wilhoit, R. C. Thermodynamic Properties of Key Organic Oxygen Compounds in the Carbon Range C1 to C4. Part 2. Ideal Gas Properties. Journal of Physical and Chemical Reference Data 1986, 15, 1369 – 1436
- Petersen and Vervloet 1987 Petersen, J. C.; Vervloet, M. Infrared emission spectrum of HNO: The 1 band. Chemical Physics Letters 1987, 141, 499–502
- Johns and McKellar 1977 Johns, J. W.; McKellar, A. R. Laser Stark spectroscopy of the fundamental bands of HNO (2 and 3) and DNO (1 and 2). The Journal of Chemical Physics 1977, 66, 1217
- Haurie and Novak 1965 Haurie, M.; Novak, A. Spectres de vibration des molécules CH 3 COOH, CH 3 COOD, CD 3 COOH et CD 3 COOD. Journal de Chimie Physique 1965, 62, 137–145
- Havey et al. 2005 Havey, D. K.; Feierabend, K. J.; Black, J. C.; Vaida, V. Temperature-dependent infrared spectra of torsional vibrations in acetic acid. Journal of Molecular Spectroscopy 2005, 229, 151–157
- Tan et al. 1992 Tan, T.; Looi, E.; Lua, K. Improved spectroscopic constants for the 2 infrared band of HNO3. Journal of Molecular Spectroscopy 1992, 155, 420–423
- Tan et al. 1996 Tan, T. L.; Wang, W. F.; Looi, B. C.; Ong, P. P. High resolution FTIR spectrum of the 6 band of HNO3. Spectrochimica Acta - Part A Molecular Spectroscopy 1996, 52, 1315–1317
- Perrin 1998 Perrin, A. Recent progress in the analysis of HNO3 spectra. Spectrochimica Acta Part A: Molecular and Biomolecular Spectroscopy 1998, 54, 375–393
- Looi et al. 1996 Looi, E. C.; Lan, T. L.; Wang, W. F.; Ong, P. P. Improved spectroscopic constants for the 7 and 8 bands of HNO3. Journal of Molecular Spectroscopy 1996, 176, 222–225
- Perrin 2013 Perrin, A. New analysis of the 3 and 4 bands of HNO 3 in the 7.6 m region. Journal of Physical Chemistry A 2013, 117, 13236–13248
- Perrin et al. 2004 Perrin, A.; Orphal, J.; Flaud, J. M.; Klee, S.; Mellau, G.; Mäder, H.; Walbrodt, D.; Winnewisser, M. New analysis of the 5 and 2 9 bands of HNO3 by infrared and millimeter wave techniques: Line positions and intensities. Journal of Molecular Spectroscopy 2004, 228, 375–391
- Goldman et al. 1988 Goldman, A.; Burkholder, J. B.; Howard, C. J.; Escribano, R.; Maki, A. G. Spectroscopic constants for the 9 infrared band of HNO3. Journal of Molecular Spectroscopy 1988, 131, 195–200
- Dinu et al. 2020 Dinu, D. F.; Ziegler, B.; Podewitz, M.; Liedl, K. R.; Loerting, T.; Grothe, H.; Rauhut, G. The interplay of VSCF/VCI calculations and matrix-isolation IR spectroscopy – Mid infrared spectrum of CH3CH2F and CD3CD2F. Journal of Molecular Spectroscopy 2020, 367, 111224
- Yamada et al. 1998 Yamada, C.; Endo, Y.; Hirota, E. Difference frequency laser spectroscopy of the 1 band of the HO2 radical. The Journal of Chemical Physics 1998, 78, 4379
- Nelson and Zahniser 1991 Nelson, D. D.; Zahniser, M. S. Diode laser spectroscopy of the 3 vibration of the HO2 radical. Journal of Molecular Spectroscopy 1991, 150, 527–534
- Burkholder et al. 1992 Burkholder, J. B.; Hammer, P. D.; Howard, C. J.; Towle, J. P.; Brown, J. M. Fourier transform spectroscopy of the 2 and 3 bands of HO2. Journal of Molecular Spectroscopy 1992, 151, 493–512
- Lattanzi et al. 2011 Lattanzi, F.; Di Lauro, C.; Vander Auwera, J. Toward the understanding of the high resolution infrared spectrum of C 2H6 near 3.3 m. Journal of Molecular Spectroscopy 2011, 267, 71–79
- Borvayeh et al. 2008 Borvayeh, L.; Moazzen-Ahmadi, N.; Horneman, V. M. The 12 - 9 band of ethane: A global frequency analysis of data from the four lowest vibrational states. Journal of Molecular Spectroscopy 2008, 250, 51–56
- Helvoort et al. 1987 Helvoort, V. K.; Fantoni, R.; Knippers, W.; Stolte, S. The Raman spectrum of ethane from 600 to 6500 cm-1 stokes shifts. Chemical Physics 1987, 111, 445–465
- Lattanzi et al. 2011 Lattanzi, F.; Di Lauro, C.; Horneman, V. M. High resolution difference bands of ethane C 2H 6 from torsionally excited lower states: Rotation-torsion structure of the v 2, v 11 and v 4 + v 11 vibrational states. Molecular Physics 2011, 109, 2375–2383
- Moazzen-Ahmadi and Oliaee 2016 Moazzen-Ahmadi, N.; Oliaee, J. N. The band system of ethane around 7 micron: Frequency analysis of the 6 band. Journal of Quantitative Spectroscopy and Radiative Transfer 2016, 180, 7–13
- Lafferty and Olson 1986 Lafferty, W. J.; Olson, W. B. The high-resolution infrared spectra of the 2 and 3 bands of HOCl. Journal of Molecular Spectroscopy 1986, 120, 359–373
- Wells et al. 1979 Wells, J. S.; Sams, R. L.; Lafferty, W. J. The High Resolution Infrared Spectrum of the v1 Band of HOCl. Journal of Molecular Spectroscopy 1979, 77, 349 – 364
- Kutzer et al. 2016 Kutzer, P.; Weismann, D.; Waßmuth, B.; Pirali, O.; Roy, P.; Yamada, K. M.; Giesen, T. F. Far-infrared spectra of dimethyl-ether and its 13C enriched isotopologues: The fundamental band of the C–O–C in plane bending mode, 7. Journal of Molecular Spectroscopy 2016, 329, 28–34
- Coudert et al. 2002 Coudert, L. H.; Çarçabal, P.; Chevalier, M.; Broquier, M.; Hepp, M.; Herman, M. High-resolution analysis of the v6, v17, and v21 bands of dimethyl ether. Journal of Molecular Spectroscopy 2002, 212, 203–207
- Perchard et al. 1964 Perchard, J.-P.; Forel, M.-T.; Josien, M.-L. Étude par spectroscopie infrarouge de quelques molécules gem-dyméthylées. Journal de Chimie Physique 1964, 61, 632–644
- Bürger et al. 1989 Bürger, H.; Pawelke, G.; Sommer, S.; Rahner, A.; Appelman, E.; Mills, I. The high-resolution infrared spectrum of HOF near 2700 cm-1: The ground and 22 states. Journal of Molecular Spectroscopy 1989, 136, 197–204
- Bürger et al. 1988 Bürger, H.; Pawelke, G.; Rahner, A.; Appelman, E.; Mills, I. The infrared spectrum of the 2 and 3 bands of H16OF, H18OF, and D16OF. Journal of Molecular Spectroscopy 1988, 128, 278–287
- Ellwood et al. 1994 Ellwood, J. A.; Steele, D.; Gerrard, D. Vibrational absorption intensities in chemical analysis—VIII. Dimethyl sulphide. Spectrochimica Acta Part A: Molecular Spectroscopy 1994, 50, 913–928
- Jabri et al. 2018 Jabri, A.; Belkhodja, Y.; Berger, Y.; Kleiner, I.; Asselin, P. High resolution rovibrational analysis of dimethyl sulfide spectrum in the 10 µm atmospheric window combining supersonic jet-quantum cascade laser and FTIR spectroscopies. Journal of Molecular Spectroscopy 2018, 349, 32–36
- King and Overend 1966 King, S. T.; Overend, J. Infrared and Raman spectra of trans N2F2. Spectrochimica Acta 1966, 22, 689–694
- Hore et al. 2002 Hore, N. R.; Russell, D. K.; Wesendrup, R. High-resolution tunable diode laser study of the v2 band system of monochloroacetylene. Journal of Molecular Spectroscopy 2002, 213, 153–157
- Nela et al. 2002 Nela, M.; Niskanen, K.; Vaittinen, O.; Halonen, L.; Bürger, H.; Polanz, O. High-resolution infrared and laser photoacoustic spectroscopy of monochloroacetylene. Molecular Physics 2002, 100, 655–665
- Giguère and Liu 1952 Giguère, P. A.; Liu, I. D. On the Infrared Spectrum of Hydrazine. The Journal of Chemical Physics 1952, 20, 136
- Durig et al. 1975 Durig, J. R.; Griffin, M. G.; Macnamee, R. W. Raman spectra of gases. XV: Hydrazine and hydrazine-d4. Journal of Raman Spectroscopy 1975, 3, 133–141
- Yamaguchi et al. 1960 Yamaguchi, A.; Ichishima, I.; Shimanouchi, T.; Mizushima, S.-I. Far infra-red spectrum of hydrazine. Spectrochimica Acta 1960, 16, 1471–1485
- Holland et al. 1992 Holland, J. K.; Newnham, D. A.; Mills, I. M.; Herman, M. Vibration-rotation spectra of monofluoroacetylene: 1700 to 7500 cm-1. Journal of Molecular Spectroscopy 1992, 151, 346–368
- Ting et al. 2014 Ting, W.-J.; Chang, C.-H.; Chen, S.-E.; Chen, H.-C.; Shy, J.-T.; Drouin, B. J.; Daly, A. M. Precision frequency measurement of N_2O transitions near 45 m and above 150 m. Journal of the Optical Society of America B 2014, 31, 1954
- Horneman 2007 Horneman, V. M. High accurate peak positions for calibration purposes with the lowest fundamental bands 2 of N2O and CO2. Journal of Molecular Spectroscopy 2007, 241, 45–50
- AlSaif et al. 2018 AlSaif, B.; Lamperti, M.; Gatti, D.; Laporta, P.; Fermann, M.; Farooq, A.; Lyulin, O.; Campargue, A.; Marangoni, M. High accuracy line positions of the 1 fundamental band of 14 N 2 16 O. Journal of Quantitative Spectroscopy and Radiative Transfer 2018, 211, 172–178
- Maki 2011 Maki, A. G. High-resolution infrared spectrum of cyanogen. Journal of Molecular Spectroscopy 2011, 269, 166–174
- Hirschmann et al. 1968 Hirschmann, R. P.; Anderson, L. R.; Harnish, D. F.; Fox, W. B. The infrared spectrum of dichlorofluoroamine, NFCl2. Spectrochimica Acta 1968, 24A, 1267 – 1270
- Evans and Nyquist 1963 Evans, J. C.; Nyquist, R. A. The vibrational spectra and vibrational assignments of the propargyl halides. Spectrochimica Acta 1963, 19, 1153–1163
- Ettinger 1963 Ettinger, R. Infrared spectrum of chlorodifluoramine, ClNF2. The Journal of Chemical Physics 1963, 38, 2427–2429
- Comeford 1966 Comeford, J. J. Vibrational Spectrum of ClNF2. The Journal of Chemical Physics 1966, 45, 3463–3465
- Bolotova et al. 2018 Bolotova, I. B.; Ulenikov, O. N.; Bekhtereva, E. S.; Albert, S.; Bauerecker, S.; Hollenstein, H.; Lerch, P.; Quack, M.; Peter, T.; Seyfang, G.; Wokaun, A. High resolution analysis of the FTIR spectra of trifluoroamine NF3. Journal of Molecular Spectroscopy 2018, 348, 87–102
- Najib 2015 Najib, H. Experimental values of the rotational and vibrational constants and equilibrium structure of nitrogen trifluoride. Journal of Molecular Spectroscopy 2015, 312, 1–5
- Kisiel et al. 2015 Kisiel, Z.; Martin-Drumel, M. A.; Pirali, O. Lowest vibrational states of acrylonitrile from microwave and synchrotron radiation spectra. Journal of Molecular Spectroscopy 2015, 315, 83–91
- Khlifi et al. 1999 Khlifi, M.; Nollet, M.; Paillous, P.; Bruston, P.; Raulin, F.; Bénilan, Y.; Khanna, R. K. Absolute Intensities of the Infrared Bands of Gaseous Acrylonitrile. Journal of Molecular Spectroscopy 1999, 194, 206–210
- Ram et al. 1999 Ram, R. S.; Bernath, P. F.; Hinkle, K. H. Infrared emission spectroscopy of NH: Comparison of a cryogenic echelle spectrograph with a Fourier transform spectrometer. Journal of Chemical Physics 1999, 110, 5557–5563
- Nissen et al. 2002 Nissen, S.; Hegelund, F.; Johnson, M. S.; Nelander, B. High-resolution infrared study of the 11 band of allene. Journal of Molecular Spectroscopy 2002, 216, 197–202
- Plíva and Martin 1982 Plíva, J.; Martin, C. The spectrum of allene near 5 m. Journal of Molecular Spectroscopy 1982, 91, 218–237
- Es-Sebbar et al. 2014 Es-Sebbar, E.; Jolly, A.; Benilan, Y.; Farooq, A. Quantitative mid-infrared spectra of allene and propyne from room to high temperatures. Journal of Molecular Spectroscopy 2014, 305, 10–16
- Maki et al. 1985 Maki, A. G.; Pine, A. S.; Dang-Nhu, M. A Doppler-limited study of the infrared spectrum of allene from 2965 to 3114 cm-1. Journal of Molecular Spectroscopy 1985, 112, 459–481
- Ohshima et al. 1986 Ohshima, Y.; Yamamoto, S.; Kuchitsu, K.; Nakanaga, T.; Takeo, H.; Matsumura, C. Diode laser spectrum of the 7 9 + 11 band system of allene. Journal of Molecular Spectroscopy 1986, 117, 138–151
- Hegelund 1994 Hegelund, F. Reanalysis of the 9, 10 band system in allene. Journal of Molecular Spectroscopy 1994, 165, 586–587
- Urban et al. 1981 Urban, S.; Spirko, V.; Papousek, D.; Kauppinen, J.; Belov, S. P.; Gershtein, L. I.; Krupnov, A. F. A simultaneous analysis of the microwave, submillimeterwave, far infrared, and infrared-microwave two-photon transitions between the ground and 2 inversion-rotation levels of 14NH3. Journal of Molecular Spectroscopy 1981, 88, 274–292
- Kleiner et al. 1999 Kleiner, I.; Brown, L. R.; Tarrago, G.; Kou, Q. L.; Picqué, N.; Guelachvili, G.; Dana, V.; Mandin, J. Y. Positions and intensities in the 24/1/3 vibrational system of 14NH3 near 3 m. Journal of Molecular Spectroscopy 1999, 193, 46–71
- Cottaz et al. 2000 Cottaz, C.; Kleiner, I.; Tarrago, G.; Brown, L. R.; Margolis, J. S.; Poynter, R. L.; Pickett, H. M.; Fouchet, T.; Drossart, P.; Lellouch, E. Line positions and intensities in the 22/4 vibrational system of 14NH3 near 5-7 m. Journal of Molecular Spectroscopy 2000, 203, 285–309
- Kerstel et al. 1994 Kerstel, E. R.; Lehmann, K. K.; Pate, B. H.; Scoles, G. Reinvestigation of the acetylenic C-H stretching fundamental of propyne via high resolution, optothermal infrared spectroscopy: Nonresonant perturbations to 1. The Journal of Chemical Physics 1994, 100, 2588–2595
- Go et al. 1993 Go, J.; Cronin, T. J.; Perry, D. S. A free-jet infrared double resonance study of the threshold region of IVR. The 6, 1 + 6, and 21 bands of propyne. Chemical Physics 1993, 175, 127–145
- Pracna et al. 2004 Pracna, P.; Muller, H. S.; Klee, S.; Horneman, V. M. Interactions in symmetric top molecules between vibrational polyads: Rotational and rovibrational spectroscopy of low-lying states of propyne, H3C-CCH. Molecular Physics 2004, 102, 1555–1568
- Henfrey and Thrush 1987 Henfrey, N. F.; Thrush, B. A. A high-resolution study of the 3 and 280 bands of propyne. Journal of Molecular Spectroscopy 1987, 121, 150–166
- Pracna et al. 2009 Pracna, P.; Müller, H.; Urban, S.; Horneman, V.-M.; Klee, S. Interactions between vibrational polyads of propyne, H3CCCH: Rotational and rovibrational spectroscopy of the levels around 1000cm-1. Journal of Molecular Spectroscopy 2009, 256, 152–162
- Henfrey and Thrush 1985 Henfrey, N. F.; Thrush, B. A. A high-resolution study of the 7 band of propyne. Journal of Molecular Spectroscopy 1985, 113, 426–450
- Comeford et al. 1963 Comeford, J. J.; Mann, D. E.; Schoen, L. J.; Lide, D. R. Infrared spectrum of difluoramine. The Journal of Chemical Physics 1963, 38, 461–463
- McKellar et al. 2018 McKellar, A. R.; Billinghurst, B. E.; Xu, L. H.; Lees, R. M. High-resolution synchrotron infrared spectroscopy of acrolein: The interacting 101 and 141181 states and other vibrational levels between 1020 and 1200 cm-1. Journal of Molecular Spectroscopy 2018, 350, 51–56
- Hamada et al. 1985 Hamada, Y.; Nishimura, Y.; Tsuboi, M. Infrared spectrum of trans-acrolein. Chemical Physics 1985, 100, 365–375
- McKellar et al. 2015 McKellar, A. R.; Billinghurst, B. E.; Xu, L. H.; Lees, R. M. High-resolution synchrotron infrared spectroscopy of acrolein: The vibrational levels between 850 and 1020 cm-1. Journal of Molecular Spectroscopy 2015, 317, 16–25
- McKellar et al. 2007 McKellar, A. R.; Tokaryk, D. W.; Appadoo, D. R. The far-infrared spectrum of acrolein, CH2CHCHO: The 18 fundamental and (17 + 18) - 18 hot bands. Journal of Molecular Spectroscopy 2007, 244, 146–152
- McKellar and Appadoo 2008 McKellar, A. R.; Appadoo, D. R. High-resolution synchrotron far-infrared spectroscopy of acrolein: The vibrational levels below 700 cm-1. Journal of Molecular Spectroscopy 2008, 250, 106–113
- Perrin et al. 1998 Perrin, A.; Flaud, J. M.; Goldman, A.; Camy-Peyret, C.; Lafferty, W. J.; Arcas, P.; Rinsland, C. P. NO2 and SO2 line parameters: 1996 HITRAN update and new results. Journal of Quantitative Spectroscopy and Radiative Transfer 1998, 60, 839–850
- Ainetschian et al. 1994 Ainetschian, A.; Fraser, G. T.; Ortigoso, J.; Pate, B. H. Contaminated torsional tunneling splittings in five normal-mode vibrations of propene. The Journal of Chemical Physics 1994, 100, 729–732
- Silvi et al. 1973 Silvi, B.; Labarbe, P.; Perchard, J. P. Spectres de vibration et coordonnées normales de quatre espèces isotopiques de propène. Spectrochimica Acta Part A: Molecular Spectroscopy 1973, 29, 263–276
- Lafferty et al. 2006 Lafferty, W. J.; Flaud, J. M.; Herman, M. Resolved torsional splitting in the 18 and 19- bands of propene. Journal of Molecular Structure 2006, 780-781, 65–69
- Es-sebbar et al. 2014 Es-sebbar, E. t.; Alrefae, M.; Farooq, A. Infrared cross-sections and integrated band intensities of propylene: Temperature-dependent studies. Journal of Quantitative Spectroscopy and Radiative Transfer 2014, 133, 559–569
- Sung et al. 2018 Sung, K.; Toon, G. C.; Drouin, B. J.; Mantz, A. W.; Smith, M. A. H. FT-IR measurements of cold propene (C3H6) cross-sections at temperatures between 150 and 299 K. Journal of Quantitative Spectroscopy and Radiative Transfer 2018, 213, 119–132
- Müller et al. 1976 Müller, A.; Mohan, N.; Cyvin, S. J.; Weinstock, N.; Glemser, O. Molecular constants for NSCl and NSF. Journal of Molecular Spectroscopy 1976, 59, 161–170
- Robertson and McNaughton 2006 Robertson, E. G.; McNaughton, D. Maximising rovibrational assignments in the 1 band of NSCl by spectral analysis by subtraction of simulated intensities (SASSI). Journal of Molecular Spectroscopy 2006, 238, 56–63
- Flaud et al. 2001 Flaud, J. M.; Lafferty, W. J.; Herman, M. First high resolution analysis of the absorption spectrum of propane in the 6.7 m to 7.5 m spectral region. Journal of Chemical Physics 2001, 114, 9361–9366
- Gayles and King 1965 Gayles, J. N.; King, W. T. The infrared spectrum of propane. Spectrochimica Acta 1965, 21, 543–557
- Grant et al. 1970 Grant, D. M.; Pugmire, R. J.; Livingston, R. C.; Strong, K. A.; McMurry, H. L.; Brugger, R. M. Methyl Libration in Propane Measured with Neutron Inelastic Scattering. The Journal of Chemical Physics 1970, 52, 4418–4423
- Kwabia Tchana et al. 2010 Kwabia Tchana, F.; Flaud, J. M.; Lafferty, W. J.; Manceron, L.; Roy, P. The first high-resolution analysis of the low-lying 9 band of propane. Journal of Quantitative Spectroscopy and Radiative Transfer 2010, 111, 1277–1281
- Flaud et al. 2010 Flaud, J. M.; Tchana, F. K.; Lafferty, W. J.; Nixon, C. A. High resolution analysis of the v26 and 2v9-v 9 bands of propane: Modelling of Titan’s infrared spectrum at 13.4 m. Molecular Physics 2010, 108, 699–704
- Perrin et al. 2019 Perrin, A.; Flaud, J. M.; Kwabia-Tchana, F.; Manceron, L.; Groner, P. Investigation of the 8 and 21 bands of propane CH3CH2CH3 at 11.5 and 10.9 µm: evidence of large amplitude tunnelling effects. Molecular Physics 2019, 117, 323–339
- Miller et al. 1984 Miller, K.; Emken, W.; Duncan, L. The low temperature infrared spectrum of thiazyl fluoride and the addition compounds of thiazyl fluoride with boron trifluoride, phosphorus penta-fluoride and arsenic pentafluoride. Journal of Fluorine Chemistry 1984, 26, 125–132
- Lolck and Brodersen 1978 Lolck, J. E.; Brodersen, S. The 2, 2 + 270, and 270 Raman band-accumulations of C3O2. Journal of Molecular Spectroscopy 1978, 72, 445–462
- Weber et al. 2008 Weber, W. H.; Maker, P. D.; Peters, C. W. Analysis of tunable diode laser spectra of the 4 band of 12C316O2. The Journal of Chemical Physics 2008, 64, 2149
- Lolck and Brodersen 1979 Lolck, J. E.; Brodersen, S. Some Raman bands of C3O2. Journal of Molecular Spectroscopy 1979, 75, 234–244
- Fusina et al. 1980 Fusina, L.; Mills, I. M.; Guelachvili, G. Carbon suboxide: The infrared spectrum from 1800 to 2600 cm-1. Journal of Molecular Spectroscopy 1980, 79, 101–122
- Auwera et al. 1994 Auwera, J. V.; Holland, J. K.; Jensen, P.; Johns, J. W. The 6 Band System of C3O2 Near 540 cm-11. Journal of Molecular Spectroscopy 1994, 163, 529–540
- Halonen et al. 1981 Halonen, L.; Mills, I. M.; Kauppinen, J. Vibrational renner-teller effects in the infrared spectrum of carbon suboxide. Molecular Physics 1981, 43, 913–931
- Vander Auwera et al. 1998 Vander Auwera, J.; Johns, J. W.; Polyansky, O. L. The far infrared spectrum of C3O2. The Journal of Chemical Physics 1998, 95, 2299
- Wagner et al. 2002 Wagner, G.; Birk, M.; Schreier, F.; Flaud, J. M. Spectroscopic database for ozone in the fundamental spectral regions. Journal of Geophysical Research 2002, 107, 4626
- Guelachvili et al. 1984 Guelachvili, G.; Craig, A. M.; Ramsay, D. A. High-resolution Fourier studies of diacetylene in the regions of the 4 and 5 fundamentals. Journal of Molecular Spectroscopy 1984, 105, 156–192
- McNaughton and Bruget 1992 McNaughton, D.; Bruget, D. N. The high-resolution infrared spectrum of diacetylene and structures of diacetylene, triacetylene and dicyanoacetylene. Journal of Molecular Structure 1992, 273, 11–25
- Vander Auwera and Fayt 2006 Vander Auwera, J.; Fayt, A. Absolute line intensities for carbonyl sulfide from 827 to 2939 cm -1. Journal of Molecular Structure 2006, 780-781, 134–141
- Kagann 1982 Kagann, R. H. Infrared absorption intensities for OCS. Journal of Molecular Spectroscopy 1982, 94, 192–198
- Krasnoshchekov et al. 2015 Krasnoshchekov, S. V.; Craig, N. C.; Boopalachandran, P.; Laane, J.; Stepanov, N. F. Anharmonic Vibrational Analysis of the Infrared and Raman Gas-Phase Spectra of s-trans- and s-gauche-1,3-Butadiene. Journal of Physical Chemistry A 2015, 119, 10706–10723
- Halonen et al. 2004 Halonen, M.; Halonen, L.; Nesbitt, D. J. Structural Issues in Conjugated Hydrocarbons: High-Resolution Infrared Slit-Jet Spectroscopy of trans -1,3-Butadiene. The Journal of Physical Chemistry A 2004, 108, 3367–3372
- Craig et al. 2004 Craig, N. C.; Davis, J. L.; Hanson, K. A.; Moore, M. C.; Weidenbaum, K. J.; Lock, M. Analysis of the rotational structure in bands in the high-resolution infrared spectra of butadiene and butadiene-2,3-d2: Refinement in assignments of fundamentals. Journal of Molecular Structure 2004, 695-696, 59–69
- Craig and Sams 2008 Craig, N. C.; Sams, R. L. An investigation of the rotamers of butadiene by high-resolution infrared spectroscopy. Journal of Physical Chemistry A 2008, 112, 12637–12646
- Martin-Drumel et al. 2020 Martin-Drumel, M. A.; Porterfield, J. P.; Goubet, M.; Asselin, P.; Georges, R.; Soulard, P.; Nava, M.; Changala, P. B.; Billinghurst, B.; Pirali, O.; McCarthy, M. C.; Baraban, J. H. Synchrotron-Based High Resolution Far-Infrared Spectroscopy of trans-Butadiene. Journal of Physical Chemistry A 2020, 124, 2427–2435
- Evans et al. 1998 Evans, C. J.; McNaughton, D.; Dexter, P.; Lawrance, W. High-resolution fourier transform infrared spectroscopy of nitrosyl fluoride. Journal of Molecular Spectroscopy 1998, 187, 75–81
- Foster and Johns 1984 Foster, S. C.; Johns, J. W. High-resolution Fourier transform spectroscopy of the 2 and 3 fundamentals of nitrosyl fluoride, FNO. Journal of Molecular Spectroscopy 1984, 103, 176–186
- Winther and Schönhoff 1997 Winther, F.; Schönhoff, M. The Fundamental Vibrations of NC–CC–CN (Dicyanoacetylene). Journal of Molecular Spectroscopy 1997, 186, 54–65
- Winther et al. 1994 Winther, F.; Ketelsen, M.; Guarnieri, A. The infrared and Raman spectrum of dicyanoacetylene. The 9 fundamental. Journal of Molecular Structure 1994, 320, 65–73
- Winther et al. 1992 Winther, F.; Ketelsen, M.; Niedenhoff, M.; Yamada, K. M. The v4 Rotation Vibration Band of Dicyanoacetylene. Zeitschrift fur Naturforschung - Section A Journal of Physical Sciences 1992, 47, 1253–1254
- Winther et al. 1992 Winther, F.; Schönhoff, M.; LePrince, R.; Guarnieri, A.; Bruget, D. N.; McNaughton, D. The infrared rotation-vibration spectrum of dicyanoacetylene: The ground and v9 = 1 state rotational constants. Journal of Molecular Spectroscopy 1992, 152, 205–212
- Edwards 1993 Edwards, H. G. Vibrational raman spectrum and force constants of phosphorus, P4. Journal of Molecular Structure 1993, 295, 95–100
- Chhiba and Vergotten 1994 Chhiba, M.; Vergotten, G. The structures and vibrational frequencies of a series of linear alkenes obtained using the spectroscopic potential SPASIBA. Journal of Molecular Structure 1994, 326, 35–58
- Mirri et al. 1965 Mirri, A. M.; Scappini, F.; Favero, P. G. Millimeter wave spectrum of PF3 and PCl3 and force constants determination. Spectrochimica Acta 1965, 21, 965–971
- Evans et al. 2014 Evans, C. J.; Sinik, A.; Medcraft, C.; McNaughton, D.; Appadoo, D.; Robertson, E. G. IR band profiling of dichlorodifluoromethane in the greenhouse window: High-resolution FTIR spectroscopy of 2 and 8. Journal of Physical Chemistry A 2014, 118, 2480–2487
- Giorgianni et al. 1990 Giorgianni, S.; Gambi, A.; Baldacci, A.; De Lorenzi, A.; Ghersetti, S. Infrared Study of the vl Band of CF2C12 by Diode Laser Spectroscopy. Journal of Molecular Spectroscopy 1990, 144, 230–238
- Giorgianni et al. 1979 Giorgianni, S.; Gambi, A.; Franco, L.; Ghersetti, S. Infrared spectrum and molecular force field of CF2Cl2. Journal of Molecular Spectroscopy 1979, 75, 389–405
- Robertson et al. 2014 Robertson, E. G.; Medcraft, C.; McNaughton, D.; Appadoo, D. The limits of rovibrational analysis: The severely entangled 1 polyad vibration of dichlorodifluoromethane in the greenhouse IR window. Journal of Physical Chemistry A 2014, 118, 10944–10954
- Jones and Morillon-Chapey 1982 Jones, H.; Morillon-Chapey, M. The 923-cm-1 band of CF235Cl2 (freon 12), studied by infrared-microwave double resonance. Journal of Molecular Spectroscopy 1982, 91, 87–102
- Najib 2014 Najib, H. Experimental rovibrational constants and equilibrium structure of phosphorus trifluoride. Journal of Molecular Spectroscopy 2014, 305, 17–21
- Chakraborty and Verma 2002 Chakraborty, T.; Verma, A. L. Vibrational spectra of CCl4: Isotopic components and hot bands. Part I. Spectrochimica Acta - Part A Molecular and Biomolecular Spectroscopy 2002, 58, 1013–1023
- Chakraborty and Rai 2006 Chakraborty, T.; Rai, S. N. Comparative study of infrared and Raman spectra of CCl4 in vapour and condensed phases: Effect of LO-TO splitting resulting from hetero-isotopic TD-TD interactions. Spectrochimica Acta - Part A: Molecular and Biomolecular Spectroscopy 2006, 65, 406–413
- Gaynor et al. 2014 Gaynor, J. D.; Wetterer, A. M.; Valente, E. J.; Mayer, S. G. The 3 - 4 difference band contribution to the CCl4 symmetric stretch (1) mode. Journal of Raman Spectroscopy 2014, 46, 189–193
- Ram and Bernath 1996 Ram, R. S.; Bernath, P. F. Fourier transform infrared emission spectroscopy of ND and PH. Journal of Molecular Spectroscopy 1996, 176, 329–336
- Carlos et al. 2017 Carlos, M.; Gruson, O.; Richard, C.; Boudon, V.; Rotger, M.; Thomas, X.; Maul, C.; Sydow, C.; Domanskaya, A.; Georges, R.; Soulard, P.; Pirali, O.; Goubet, M.; Asselin, P.; Huet, T. R. High-resolution spectroscopy and global analysis of CF4 rovibrational bands to model its atmospheric absorption. Journal of Quantitative Spectroscopy and Radiative Transfer 2017, 201, 75–93
- Tarrago et al. 1992 Tarrago, G.; Lacome, N.; Lévy, A.; Guelachvili, G.; Bézard, B.; Drossart, P. Phosphine spectrum at 4-5 m: Analysis and line-by-line simulation of 22, 2 + 4, 24, 1, and 3 bands. Journal of Molecular Spectroscopy 1992, 154, 30–42
- Fusina and Di Lonardo 2000 Fusina, L.; Di Lonardo, G. The v2 and v4 bending fundamentals of phosphine (PH3). Journal of Molecular Structure 2000, 517-518, 67–78
- Zachwieja 1995 Zachwieja, M. New Investigations of the A2-X2 band system in the ch radical and a new reduction of the vibration-rotation spectrum of CH from the ATMOS spectra. Journal of Molecular Spectroscopy 1995, 170, 285–309
- Ahmad and Hamilton 1995 Ahmad, I. K.; Hamilton, P. A. The Fourier Transform Infrared Spectrum of PN. Journal of Molecular Spectroscopy 1995, 169, 286–291
- Duncan et al. 1986 Duncan, J. L.; Nivellini, G. D.; Tullini, F. Methylene chloride: The mid-infrared spectrum of an almost vibrationally unperturbed molecule. Journal of Molecular Spectroscopy 1986, 118, 145–162
- Lindner et al. 1994 Lindner, J.; Niemann, R.; Tiemann, E. Laser spectroscopy of the b3-u-x3-g spectrum of S2 produced by photodissociation. Journal of Molecular Spectroscopy 1994, 165, 358–367
- Vogt et al. 1984 Vogt, J.; Winnewisser, M.; Yamada, K.; Winnewisser, G. The Fourier transform and diode laser spectrum of the 2 band of diazomethane. Chemical Physics 1984, 83, 309–318
- Nemes et al. 1990 Nemes, L.; Vogt, J.; Winnewisser, M. Analysis of the three lowest frequency vibration-rotation bands of diazomethane. Journal of Molecular Structure 1990, 218, 219–224
- Moore and Pimentel 1964 Moore, C. B.; Pimentel, G. C. Infrared Spectra of Gaseous Diazomethane. Journal of Chemical Physics 1964, 40, 329 – 341
- Brown and Pez 1970 Brown, R. D.; Pez, G. P. Vibrational spectra of thio-thionyl fluoride and difluoro disulphane. Spectrochimica Acta Part A: Molecular Spectroscopy 1970, 26, 1375–1386
- Bertie and Michaelian 1982 Bertie, J. E.; Michaelian, K. H. The Raman spectrum of gaseous acetic acid at 21 ∘C. The Journal of Chemical Physics 1982, 77, 5267–5271
- Baskakov et al. 2006 Baskakov, O. I.; Markov, I. A.; Alekseev, E. A.; Motiyenko, R. A.; Lohilahti, J.; Horneman, V. M.; Winnewisser, B. P.; Medvedev, I. R.; Lucia, F. C. Simultaneous analysis of rovibrational and rotational data for the 41, 51, 61, 72, 81, 7191 and 92 states of HCOOH. Journal of Molecular Structure 2006, 795, 54–77
- Perrin et al. 2009 Perrin, A.; Vander Auwera, J.; Zelinger, Z. High-resolution Fourier transform study of the 3 fundamental band of trans-formic acid. Journal of Quantitative Spectroscopy and Radiative Transfer 2009, 110, 743–755
- Luo et al. 2017 Luo, W.; Zhang, Y.; Li, W.; Duan, C. Jet-cooled infrared absorption spectrum of the v4 fundamental band of HCOOH and HCOOD. Journal of Molecular Spectroscopy 2017, 334, 22–25
- Baskakov et al. 2006 Baskakov, O. I.; Alekseev, E. A.; Motiyenko, R. A.; Lohilahti, J.; Horneman, V. M.; Alanko, S.; Winnewisser, B. P.; Medvedev, I. R.; De Lucia, F. C. FTIR and millimeter wave investigation of the 71 and 91 states of formic acid HCOOH and H13COOH. Journal of Molecular Spectroscopy 2006, 240, 188–201
- Thorwirth et al. 2016 Thorwirth, S.; Martin-Drumel, M. A.; Endres, C. P.; Salomon, T.; Zingsheim, O.; Van Wijngaarden, J.; Pirali, O.; Gruet, S.; Lewen, F.; Schlemmer, S.; McCarthy, M. C. An ASAP treatment of vibrationally excited S2O: The 3 mode and the 3 + 2 - 2 hot band. Journal of Molecular Spectroscopy 2016, 319, 47–49
- Lindenmayer et al. 1986 Lindenmayer, J.; Rudolph, H. D.; Jones, H. The equilibrium structure of disulfur monoxide: Diode laser spectroscopy of 1 and 3 of S218O and 3 of S216O. Journal of Molecular Spectroscopy 1986, 119, 56–67
- Martin-Drumel et al. 2015 Martin-Drumel, M. A.; Endres, C. P.; Zingsheim, O.; Salomon, T.; Van Wijngaarden, J.; Pirali, O.; Gruet, S.; Lewen, F.; Schlemmer, S.; McCarthy, M. C.; Thorwirth, S. The SOLEIL view on sulfur rich oxides: The S2O bending mode 2 at 380 cm-1 and its analysis using an Automated Spectral Assignment Procedure (ASAP). Journal of Molecular Spectroscopy 2015, 315, 72–79
- Johns and Olson 1971 Johns, J. W.; Olson, W. B. The infrared spectrum of thioformaldehyde. Journal of Molecular Spectroscopy 1971, 39, 479 – 505
- McNaughton and Bruget 1993 McNaughton, D.; Bruget, D. N. Far-Infrared and 2 Vibration-Rotation Spectrum of Thioformaldehyde and Infrared Spectrum of Thioglyoxal. Journal of Molecular Spectroscopy 1993, 159, 340–349
- Flaud et al. 2008 Flaud, J. M.; Lafferty, W. J.; Perrin, A.; Kim, Y. S.; Beckers, H.; Willner, H. The first high-resolution analysis of the 10-m absorption of thioformaldehyde. Journal of Quantitative Spectroscopy and Radiative Transfer 2008, 109, 995–1003
- Bizzocchi et al. 2000 Bizzocchi, L.; Cludi, L.; Degli Esposti, C.; Giorgi, A. Millimeter-wave spectroscopy of sulfur dichloride. Journal of Molecular Spectroscopy 2000, 204, 275–280
- Bray et al. 2011 Bray, C.; Perrin, A.; Jacquemart, D.; Lacome, N. The 1, 4 and 36 bands of methyl chloride in the 3.4-m region: Line positions and intensities. Journal of Quantitative Spectroscopy and Radiative Transfer 2011, 112, 2446–2462
- Nikitin et al. 2003 Nikitin, A.; Féjard, L.; Champion, J. P.; Bür, H.; Litz, M.; Colmont, J. M.; Bakri, B. New measurements and global analysis of chloromethane in the region from 0 to 1800 cm-1. Journal of Molecular Spectroscopy 2003, 221, 199–212
- Ram et al. 1995 Ram, R. S.; Bernath, P. F.; Engleman, R.; Brault, J. W. Fourier Transform Infrared Emission Spectroscopy of SH. Journal of Molecular Spectroscopy 1995, 172, 34–42
- Papousek et al. 1992 Papousek, D.; Papouskova, Z.; Ogilvie, J. F.; Pracna, P.; Civis, S.; Winnewisser, M. Vibration-rotational interactions in the states v2 = 1 and v5 = 1 of H312CF. Journal of Molecular Spectroscopy 1992, 153, 145–166
- Papousek et al. 1991 Papousek, D.; Ogilvie, J. F.; Civis, S.; Winnewisser, M. The vibration-rotational bands 3, 23 - 3, and 3 + 6 - 6 of H312CF. Journal of Molecular Spectroscopy 1991, 149, 109–124
- Papousek et al. 1991 Papousek, D.; Tesar, R.; Pracna, P.; Civis, S.; Winnewisser, M.; Belov, S. P.; Tretyakov, M. Y. High-resolution Fourier transform and submillimeter-wave study of the 6 band of 12CH3F. Journal of Molecular Spectroscopy 1991, 147, 279–299
- Champion et al. 1982 Champion, J. P.; Robiette, A. G.; Mills, I. M.; Graner, G. Simultaneous analysis of the 1, 4, 22, 2 + 5, and 25 infrared bands of 12CH3F. Journal of Molecular Spectroscopy 1982, 96, 422–441
- Bethke and Kent Wilson 1957 Bethke, G. W.; Kent Wilson, M. Vibrational Spectrum of Disilane. The Journal of Chemical Physics 1957, 26, 1107
- Lattanzi et al. 2005 Lattanzi, F.; Di Lauro, C.; Horneman, V. M. Torsional tunneling splittings in the V4 = 1 excited torsional state of Si2H6: Analysis of hot bands accompanying fundamental transitions in the high resolution infrared spectrum. Molecular Physics 2005, 103, 2655–2663
- LATTANZI et al. 2003 LATTANZI, F.; DI LAURO, C.; HORNEMAN, V.-M. The 6 , 8 3 4 + 12 infrared system of Si 2 H 6 under high resolution: rotational and torsional analysis. Molecular Physics 2003, 101, 2895–2906
- Lattanzi et al. 2004 Lattanzi, F.; Di Lauro, C.; Horneman, V. M. Rotation-torsion analysis of the Si2H6 infrared fundamental v9, perturbed by excited torsional levels of the vibrational ground state. Molecular Physics 2004, 102, 507–512
- McKean 1992 McKean, D. C. On the assignment of SiH and SiD stretching frequencies: A reanalysis of the 7 bands of Si2H6 and Si2D6 and a harmonic local mode force field for disilane. Spectrochimica Acta Part A: Molecular Spectroscopy 1992, 48, 1335–1345
- Lattanzi et al. 2004 Lattanzi, F.; Di Lauro, C.; Horneman, V. M. The high-resolution infrared spectrum of Si2H6: Rotation-torsion analysis of the v5 and v7 fundamentals, and torsional splittings in the degenerate vibrational states. Molecular Physics 2004, 102, 757–764
- Halonen and Duxbury 1985 Halonen, L.; Duxbury, G. High resolution infrared spectrum of methyleneimine, CH2NH, in the 3 m region. The Journal of Chemical Physics 1985, 83, 2091–2096
- Duxbury et al. 1981 Duxbury, G.; Kato, H.; Le Lerre, M. L. Laser Stark and interferometric studies of thioformaldehyde and methyleneimine. Faraday Discussions of the Chemical Society 1981, 71, 97–110
- Duxbury and Le Lerre 1982 Duxbury, G.; Le Lerre, M. L. Fourier transform infrared spectra of CH2NH: The 5 and 6 bands. Journal of Molecular Spectroscopy 1982, 92, 326–348
- Halonen and Duxbury 1985 Halonen, L.; Duxbury, G. The Fourier transform infrared spectrum of methyleneimine in the 10 m region. The Journal of Chemical Physics 1985, 83, 2078–2090
- Halonen and Duxbury 1985 Halonen, L.; Duxbury, G. Fourier transform infrared spectrum of CH2NH: The 1 band. Chemical Physics Letters 1985, 118, 246–251
- Hirota and Ishikawa 1999 Hirota, E.; Ishikawa, H. The vibrational spectrum and molecular constants of silicon dihydride SiH2 in the ground electronic state. The Journal of Chemical Physics 1999, 110, 4254
- Sztraka and Horneman 2009 Sztraka, L.; Horneman, V. M. Study of vibration-rotation levels in formamide with high resolution FTIR spectroscopy: The 12, 212, 11, and 9 bands. Journal of Molecular Spectroscopy 2009, 255, 172–182
- McNaughton et al. 1999 McNaughton, D.; Evans, C. J.; Lane, S.; Nielsen, C. J. The High-Resolution FTIR Far-Infrared Spectrum of Formamide. Journal of Molecular Spectroscopy 1999, 193, 104 – 117
- Christensen and Nielsen 1968 Christensen, D. H.; Nielsen, O. F. Infrared absorption spectra of SiH2Cl2, SiDHCl2 and SiD2Cl2. Journal of Molecular Spectroscopy 1968, 27, 489–498
- Amyay et al. 2018 Amyay, B.; Gardez, A.; Georges, R.; Biennier, L.; Vander Auwera, J.; Richard, C.; Boudon, V. New investigation of the 3 C-H stretching region of 12CH4 through the analysis of high temperature infrared emission spectra. Journal of Chemical Physics 2018, 148
- Barrett and Carpenter 1984 Barrett, D.; Carpenter, J. H. The millimeter-wave spectrum of chlorosilane. Journal of Molecular Spectroscopy 1984, 107, 153–159
- Newman et al. 1956 Newman, C.; Kenneth O’Loane, J.; Polo, S. R.; Kent Wilson, M. Infrared Spectra and Molecular Structures of SiH3F, SiH3Cl, and SiH3Br. The Journal of Chemical Physics 1956, 25, 855
- Twagirayezu et al. 2010 Twagirayezu, S.; Clasp, T. N.; Perry, D. S.; Neill, J. L.; Muckle, M. T.; Pate, B. H. Vibrational coupling pathways in methanol as revealed by coherence-converted population transfer Fourier transform microwave infrared double-resonance spectroscopy. Journal of Physical Chemistry A 2010, 114, 6818–6828
- Escribano et al. 1982 Escribano, R.; Garcia Hernandez, M.; Butcher, R. J. The infrared spectra of SiH3F: 3 and 4 bands. Journal of Molecular Spectroscopy 1982, 95, 334–349
- Robiette et al. 1971 Robiette, A. G.; Cartwright, G. J.; Hoy, A. R.; Mills, I. M. The infra-red spectra of silyl fluoride and silyl fluoride-d3. Molecular Physics 1971, 20, 541–553
- Lees et al. 2016 Lees, R. M.; Xu, L. H.; Billinghurst, B. E. High-resolution Fourier transform synchrotron spectroscopy of the C–S stretching band of methyl mercaptan, CH332SH. Journal of Molecular Spectroscopy 2016, 319, 30–38
- Lees et al. 2018 Lees, R. M.; Xu, L. H.; Twagirayezu, S.; Perry, D. S.; Dawadi, M. B.; Billinghurst, B. E. FTIR synchrotron spectroscopy of the S–H stretching fundamental of the 12CH332SH species of methyl mercaptan. Molecular Physics 2018, 116, 3554–3563
- Du et al. 2017 Du, Z.; Li, J.; Gao, H.; Luo, G.; Cao, X.; Ma, Y. Ultrahigh-resolution spectroscopy for methyl mercaptan at the 2-band by a distributed feedback interband cascade laser. Journal of Quantitative Spectroscopy and Radiative Transfer 2017, 196, 123–129
- Lees et al. 2018 Lees, R. M.; Xu, L. H.; Guislain, B. G.; Reid, E. M.; Twagirayezu, S.; Perry, D. S.; Dawadi, M. B.; Thapaliya, B. P.; Billinghurst, B. E. Torsion-rotation structure and quasi-symmetric-rotor behaviour for the CH3SH asymmetric CH3-bending and C-H stretching bands of E parentage. Journal of Molecular Spectroscopy 2018, 343, 18–27
- Du et al. 2016 Du, Z.; Zhen, W.; Zhang, Z.; Li, J.; Gao, N. Detection of methyl mercaptan with a 3393-nm distributed feedback interband cascade laser. Applied Physics B: Lasers and Optics 2016, 122, 1–8
- Johns et al. 1976 Johns, J. W.; Kreiner, W. A.; Susskind, J. Measurement and analysis of the 4 band of silane. Journal of Molecular Spectroscopy 1976, 60, 400–411
- Wilkinson and Kent Wilson 2004 Wilkinson, G. R.; Kent Wilson, M. Infrared Spectra of Some MH4 Molecules. The Journal of Chemical Physics 2004, 44, 3867
- Cabana et al. 1978 Cabana, A.; Gray, D. L.; Robiette, A. G.; Pierre, G. Analysis of the 3 and 1 infra-red bands of SiH4. Molecular Physics 1978, 36, 1503–1516
- Gulaczyk et al. 2020 Gulaczyk, I.; Kreglewski, M.; Asselin, P.; Pirali, O.; Kleiner, I. The NH2 scissors band of methylamine. Canadian Journal of Physics 2020, 98, 560–566
- Gulaczyk et al. 2011 Gulaczyk, I.; Kreglewski, M.; Horneman, V. M. The C-N stretching band of methylamine. Journal of Molecular Spectroscopy 2011, 270, 70–74
- Gray and Lord 1957 Gray, A. P.; Lord, R. C. Rotation-vibration spectra of methyl amine and its deuterium derivatives. The Journal of Chemical Physics 1957, 26, 690–705
- Gulaczyk et al. 2010 Gulaczyk, I.; Lodyga, W.; Kreglewski, M.; Horneman, V. M. Reinvestigation of the wagging band of methylamine. Molecular Physics 2010, 108, 2389–2394
- Gulaczyk and Kreglewski 2020 Gulaczyk, I.; Kreglewski, M. IR rotational spectrum of methylamine. Journal of Quantitative Spectroscopy and Radiative Transfer 2020, 252, 107097
- Bürger and Ruoff 1970 Bürger, H.; Ruoff, A. Schwingungsspektren und kraftkonstanten symmetrischer kreisel-II HSiCl3 und DSiCl3. Spectrochimica Acta Part A: Molecular Spectroscopy 1970, 26, 1449–1458
- Kim and Zeroka 2001 Kim, H. W.; Zeroka, D. A theoretical study of methylphosphine CH3PH2 and selected isotopomers: vibrational analysis and infrared spectra. Journal of Molecular Structure: THEOCHEM 2001, 571, 59–70
- Bürger et al. 2000 Bürger, H.; Mkadmi, E. B.; Demaison, J.; Margulès, L.; Gnida, M. High-Resolution Infrared and Millimeter-Wave Study of the v3 = 1 State of HSiF3 and DSiF3. Journal of Molecular Spectroscopy 2000, 200, 203–209
- Gnida et al. 2000 Gnida, M.; Margulès, L.; Cosléou, J.; Bocquet, R.; Demaison, J.; Mkadmi, E. B.; Bürger, H.; Harder, H.; Mäder, H. Radiofrequency, Centimeter-Wave, Millimeter-Wave, and Infrared Spectra of SiHF3: Investigation of the Ground, 4 = 1, and 6 = 1 Vibrational States. Journal of Molecular Spectroscopy 2000, 200, 40–54
- Harada et al. 1992 Harada, K.; Akao, S.; Miyachi, K.; Tanaka, K.; Tanaka, T. CO2 laser Stark spectroscopy of the 4 band of SiHF3: The C0 rotational constant and vibrationally induced dipole moment. The Journal of Chemical Physics 1992, 96, 5–12
- Bürger et al. 1971 Bürger, H.; Biedermann, S.; Ruoff, A. Schwingungsspektren und Kraftkonstanten symmetrischer Kreisel-V1 1 IV. Mitteilung s. Ref. [1]. Die IR-Spektren von HSiF3 und DSiF3. Spectrochimica Acta Part A: Molecular Spectroscopy 1971, 27, 1687–1702
- Borvayeh et al. 2009 Borvayeh, L.; Ozier, I.; Bauder, A.; Moazzen-Ahmadi, N. High resolution infrared spectrum and global analysis of 5, 12, and 12 + 6 - 6 in CH3SiH3. Journal of Molecular Spectroscopy 2009, 255, 122–133
- Wilde 1962 Wilde, R. E. The infrared spectrum of CH3SiH3 and CH3SiD3. Journal of Molecular Spectroscopy 1962, 8, 427–454
- Petek et al. 1983 Petek, H.; Nesbitt, D. J.; Ogilby, P. R.; Moore, C. B. Infrared flash kinetic spectroscopy: The v1 and v3 spectra of singlet methylene. Journal of Physical Chemistry 1983, 87, 5367–5371
- Petek et al. 1989 Petek, H.; Nesbitt, D. J.; Darwin, D. C.; Ogilby, P. R.; Moore, C. B.; Ramsay, D. A. Analysis of CH2 a 1A1 (1,0,0) and (0,0,1) Coriolis-coupled states, a 1A1-XX 3B1 spin-orbit coupling, and the equilibrium structure of CH2 a 1A1 state. The Journal of Chemical Physics 1989, 91, 6566–6578
- Petek et al. 1987 Petek, H.; Nesbitt, D. J.; Bradley Moore, C.; Birss, F. W.; Ramsay, D. A. Visible absorption and magnetic-rotation spectroscopy of 1CH2: Analysis of the 1A1 state and the 1A1-3B1 coupling. The Journal of Chemical Physics 1987, 86, 1189–1205
- Pracna et al. 2012 Pracna, P.; Ceausu-Velcescu, A.; Horneman, V. M. The ground and 6=1 vibrational levels of HC 35Cl 3: The first high-resolution analysis of the 6 fundamental band. Journal of Quantitative Spectroscopy and Radiative Transfer 2012, 113, 1220–1225
- Pietilä et al. 2002 Pietilä, J.; Alanko, S.; Horneman, V. M.; Anttila, R. High-resolution infrared studies of 1, 21, and 24 bands of CH35Cl3. Journal of Molecular Spectroscopy 2002, 216, 271–283
- PietilÁ et al. 2000 PietilÁ, J.; Horneman, V.; Anttila, R.; Lemoine, B.; Raynaud, F.; Colmont, J. The perpendicular fundamental v5 of chloroform 12CH35Cl3: High resolution infrared study of the v5 band together with the millimetre-wave rotational spectrum. Molecular Physics 2000, 98, 549–557
- Anttila et al. 2004 Anttila, R.; Alanko, S.; Horneman, V. M. The C-H bending vibration 4 of chloroform CH 35Cl3. Molecular Physics 2004, 102, 1537–1542
- Pasa et al. 1995 Pasa, R.; Horneman, V. M.; Pietilä, J.; Anttila, R. High-resolution study of the infrared band 2 of CH35Cl3. Chemical Physics Letters 1995, 247, 277–282
- PietilÄ et al. 1999 PietilÄ, J.; Horneman, V.; Anttila, R. High resolution infrared study of the parallel band 3 of chloroform CH35 Cl3. Molecular Physics 1999, 96, 1449–1456
- Sanz et al. 2003 Sanz, M. E.; McCarthy, M. C.; Thaddeus, P. Rotational transitions of SO, SiO, and SiS excited by a discharge in a supersonic molecular beam: Vibrational temperatures, Dunham coefficients, Born-Oppenheimer breakdown, and hyperfine structure. Journal of Chemical Physics 2003, 119, 11715–11727
- Albert et al. 2018 Albert, S.; Bauerecker, S.; Bekhtereva, E. S.; Bolotova, I. B.; Hollenstein, H.; Quack, M.; Ulenikov, O. N. High resolution FTIR spectroscopy of fluoroform 12CHF3 and critical analysis of the infrared spectrum from 25 to 1500 cm-1. Molecular Physics 2018, 116, 1091–1107
- Dübal and Quack 1984 Dübal, H. R.; Quack, M. Tridiagonal Fermi resonance structure in the IR spectrum of the excited CH chromophore in CF3H. The Journal of Chemical Physics 1984, 81, 3779–3791
- Ceausu-Velcescu et al. 2003 Ceausu-Velcescu, A.; Cosléou, J.; Demaison, J.; Graner, G.; Duxbury, G.; Bürger, H. The v6 = 1 state of fluoroform, HCF3: Analysis of the rotational and vibrational spectra. Journal of Molecular Spectroscopy 2003, 220, 291–297
- Müller and Brünken 2005 Müller, H. S.; Brünken, S. Accurate rotational spectroscopy of sulfur dioxide, SO2, in its ground vibrational and first excited bending states, v2 = 0, 1, up to 2 THz. Journal of Molecular Spectroscopy 2005, 232, 213–222
- Guelachvili et al. 1987 Guelachvili, G.; Naumenko, O. V.; Ulenikov, O. N. Analysis of the SO2 absorption Fourier spectrum in regions 1055 to 2000 and 2200 to 2550 cm-1. Journal of Molecular Spectroscopy 1987, 125, 128–139
- Douglas and Hoy 1975 Douglas, A. E.; Hoy, A. R. The Resonance Fluorescence Spectrum of Cl 2 in the Vacuum Ultraviolet. Canadian Journal of Physics 1975, 53, 1965–1975
- Maki et al. 2001 Maki, A.; Blake, T. A.; Sams, R. L.; Vulpanovici, N.; Barber, J.; Chrysostom, E. T.; Masiello, T.; Nibler, J. W.; Weber, A. High-resolution infrared spectra of the v2, v3, v4, and 2v3 bands of 32s16O3. Journal of Molecular Spectroscopy 2001, 210, 240–249
- Barber et al. 2002 Barber, J.; Chrysostom, E. T.; Masiello, T.; Nibler, J. W.; Maki, A.; Weber, A.; Blake, T. A.; Sams, R. L. Analysis of v2, v4 infrared hot bands of 32S16O3: Resolution of the puzzle of the v1 CARS spectrum. Journal of Molecular Spectroscopy 2002, 216, 105–112
- Rochkind and Pimentel 1965 Rochkind, M. M.; Pimentel, G. C. Infrared spectrum and vibrational assignment for chlorine monoxide, Cl 2O. The Journal of Chemical Physics 1965, 42, 1361–1368
- Xu et al. 1996 Xu, Y.; McKellar, A. R.; Burkholder, J. B.; Orlando, J. J. High-resolution infrared spectrum of the v1 and v3 bands of dichlorine monoxide, Cl2O. Journal of Molecular Spectroscopy 1996, 175, 68–72
- Roucou et al. 2017 Roucou, A.; Dhont, G.; Cuisset, A.; Martin-Drumel, M. A.; Thorwirth, S.; Fontanari, D.; Meerts, W. L. High resolution study of the 2 and 5 rovibrational fundamental bands of thionyl chloride: Interplay of an evolutionary algorithm and a line-by-line analysis. The Journal of Chemical Physics 2017, 147, 054303
- Martin-Drumel et al. 2015 Martin-Drumel, M. A.; Mouret, G.; Pirali, O.; Cuisset, A. High-resolution synchrotron far infrared spectroscopy of thionyl chloride: Analysis of the 3 and 6 fundamental bands. Journal of Molecular Spectroscopy 2015, 315, 30–36
- Martz and Lagemann 1954 Martz, D. E.; Lagemann, R. T. Infrared spectra of thionyl chloride and sulfuryl chloride. The Journal of Chemical Physics 1954, 22, 1193–1195
- Saouli et al. 1994 Saouli, A.; Dubois, I.; Blavier, J. F.; Bredhol, H.; Blanquet, G.; Meyer, C.; Meyer, F. Fourier Transform Infrared Spectrum of ClCN: Analysis of the 1 + 3, 22 + 3, and Associated Hot Bands. Journal of Molecular Structure 1994, 165, 349 – 357
- Mizushima et al. 1975 Mizushima, S.; Shimanouchi, T.; Harada, I.; Abe, Y.; Takeuchi, H. Infrared and Raman Spectra of 1,2-Dichloroethane and its Deuterium Compound in the Gaseous, Liquid, and Solid States. Canadian Journal of Physics 1975, 53, 2085–2094
- Burger et al. 1986 Burger, H.; Schulz, P.; Jacob, E.; Fahnle, M. The Fourier Transform IR Spectra of CIF and BrF. Zeitschrift fur Naturforschung - Section A Journal of Physical Sciences 1986, 41, 1015–1020
- Marshall and McKellar 1986 Marshall, M. D.; McKellar, A. R. The 2 fundamental band of triplet CH2. The Journal of Chemical Physics 1986, 85, 3716–3723
- Jensen and Bunker 1988 Jensen, P.; Bunker, P. R. The potential surface and stretching frequencies X3B 1 methylene (CH2) determined from experiment using the Morse oscillator-rigid bender internal dynamics Hamiltonian. The Journal of Chemical Physics 1988, 89, 1327–1332
- Selig et al. 1970 Selig, H.; Claassen, H. H.; Holloway, J. H. Infrared and raman spectra of ClF3 and BrF3. The Journal of Chemical Physics 1970, 52, 3517–3521
- Rusell D. 2020 Rusell D., J. I. NIST Computational Chemistry Comparison and Benchmark Database NIST Standard Reference Database Number 101. 2020; \urlhttp://cccbdb.nist.gov/
- Shimanouchi 1977 Shimanouchi, T. Tables of molecular vibrational frequencies. Consolidated volume II. Journal of Physical and Chemical Reference Data 1977, 6, 993–1102
- Huber and Herzberg 1979 Huber, K. P.; Herzberg, G. Molecular Spectra and Molecular Structure; Springer US: Boston, MA, 1979; p 716
- WebBook 1966 WebBook, N. C. Methylphosphonic Acid. 1966
- Grimme et al. 2021 Grimme, S.; Bohle, F.; Hansen, A.; Pracht, P.; Spicher, S.; Stahn, M. Efficient Quantum Chemical Calculation of Structure Ensembles and Free Energies for Nonrigid Molecules. Journal of Physical Chemistry A 2021, 125, 4039–4054
- Chase et al. 1975 Chase, M. W.; Curnutt, J. L.; Prophet, H.; Mcdonald, R. A.; Syverud, A. N. JANAF thermochemical tables, 1975 supplement. Journal of Physical and Chemical Reference Data 1975, 4, 1–176
- Yachmenev et al. 2011 Yachmenev, A.; Yurchenko, S. N.; Ribeyre, T.; Thiel, W. High-level ab initio potential energy surfaces and vibrational energies of H2CS. Journal of Chemical Physics 2011, 135
- Mardirossian and Head-Gordon 2017 Mardirossian, N.; Head-Gordon, M. Thirty years of density functional theory in computational chemistry: An overview and extensive assessment of 200 density functionals. Molecular Physics 2017, 115, 2315–2372
- Goerigk et al. 2017 Goerigk, L.; Hansen, A.; Bauer, C.; Ehrlich, S.; Najibi, A.; Grimme, S. A look at the density functional theory zoo with the advanced GMTKN55 database for general main group thermochemistry, kinetics and noncovalent interactions. Physical Chemistry Chemical Physics 2017, 19, 32184–32215
- Hait and Head-Gordon 2018 Hait, D.; Head-Gordon, M. How Accurate Is Density Functional Theory at Predicting Dipole Moments? An Assessment Using a New Database of 200 Benchmark Values. Journal of Chemical Theory and Computation 2018, 14, 1969–1981
- Hait and Head-Gordon 2018 Hait, D.; Head-Gordon, M. How accurate are static polarizability predictions from density functional theory? An assessment over 132 species at equilibrium geometry. Physical Chemistry Chemical Physics 2018, 20, 19800–19810
- Landrum 2010 Landrum, G. RDKit: Open-source cheminformatics. 2010; \urlhttps://www.rdkit.org/
- Biczysko et al. 2010 Biczysko, M.; Panek, P.; Scalmani, G.; Bloino, J.; Barone, V. Harmonic and anharmonic vibrational frequency calculations with the double-hybrid B2PLYP method: Analytic second derivatives and benchmark studies. Journal of Chemical Theory and Computation 2010, 6, 2115–2125
- Barone et al. 2014 Barone, V.; Biczysko, M.; Bloino, J. Fully anharmonic IR and Raman spectra of medium-size molecular systems: Accuracy and interpretation. Physical Chemistry Chemical Physics 2014, 16, 1759–1787
- Barone et al. 2015 Barone, V.; Biczysko, M.; Puzzarini, C. Quantum chemistry meets spectroscopy for astrochemistry: Increasing complexity toward prebiotic molecules. Accounts of Chemical Research 2015, 48, 1413–1422
- Biczysko et al. 2018 Biczysko, M.; Bloino, J.; Puzzarini, C. Computational challenges in Astrochemistry. Wiley Interdisciplinary Reviews: Computational Molecular Science 2018, 8, 1349
- Furtenbacher et al. 2007 Furtenbacher, T.; Császár, A. G.; Tennyson, J. MARVEL: measured active rotational-vibrational energy levels. Journal of Molecular Spectroscopy 2007, 245, 115–125
- Furtenbacher and Császár 2012 Furtenbacher, T.; Császár, A. G. MARVEL: Measured active rotational-vibrational energy levels. II. Algorithmic improvements. Journal of Quantitative Spectroscopy and Radiative Transfer 2012, 113, 929–935
- McKemmish 2021 McKemmish, L. K. Molecular diatomic spectroscopy data. Wiley Interdisciplinary Reviews: Computational Molecular Science 2021, 11, e1520
- Weser 2017 Weser, O. An efficient and general library for the definition and use of internal coordinates in large molecular systems. Ph.D. thesis, Georg August Universität Göttingen, 2017
- Martin and Kesharwani 2014 Martin, J. M. L.; Kesharwani, M. K. Assessment of CCSD(T)-F12 Approximations and Basis Sets for Harmonic Vibrational Frequencies. Journal of Chemical Theory and Computation 2014, 10, 2085–2090
- Schmitz and Christiansen 2017 Schmitz, G.; Christiansen, O. Accuracy of Frequencies Obtained with the Aid of Explicitly Correlated Wave Function Based Methods. Journal of Chemical Theory and Computation 2017, 13, 3602–3613
- Werner et al. 2020 Werner, H. J. et al. The Molpro quantum chemistry package. Journal of Chemical Physics 2020, 152, 144107
- Halls et al. 2001 Halls, M. D.; Velkovski, J.; Schlegel, H. B. Harmonic frequency scaling factors for Hartree-Fock, S-VWN, B-LYP, B3-LYP, B3-PW91 and MP2 with the Sadlej pVTZ electric property basis set. Theoretical Chemistry Accounts 2001, 105, 413–421
- Sinha et al. 2004 Sinha, P.; Boesch, S. E.; Gu, C.; Wheeler, R. A.; Wilson, A. K. Harmonic vibrational frequencies: Scaling factors for HF, B3LYP, and MP2 methods in combination with correlation consistent basis sets. Journal of Physical Chemistry A 2004, 108, 9213–9217
- Andersson and Uvdal 2005 Andersson, M. P.; Uvdal, P. New scale factors for harmonic vibrational frequencies using the B3LYP density functional method with the triple- basis Set 6-311+G(d,p). Journal of Physical Chemistry A 2005, 109, 2937–2941
- Merrick et al. 2007 Merrick, J. P.; Moran, D.; Radom, L. An evaluation of harmonic vibrational frequency scale factors. Journal of Physical Chemistry A 2007, 111, 11683–11700
- Andrade et al. 2008 Andrade, S. G.; Gonçalves, L. C.; Jorge, F. E. Scaling factors for fundamental vibrational frequencies and zero-point energies obtained from HF, MP2, and DFT/DZP and TZP harmonic frequencies. Journal of Molecular Structure: THEOCHEM 2008, 864, 20–25
- Laury et al. 2011 Laury, M. L.; Boesch, S. E.; Haken, I.; Sinha, P.; Wheeler, R. A.; Wilson, A. K. Harmonic Vibrational Frequencies: Scale Factors for Pure, Hybrid, Hybrid Meta, and Double-Hybrid Functionals in Conjunction with Correlation Consistent Basis Sets. Journal of computational chemistry 2011, 32, 2339–2347
- Laury et al. 2012 Laury, M. L.; Carlson, M. J.; Wilson, A. K. Vibrational frequency scale factors for density functional theory and the polarization consistent basis sets. Journal of Computational Chemistry 2012, 33, 2380–2387
- Chan and Radom 2016 Chan, B.; Radom, L. Frequency Scale Factors for Some Double-Hybrid Density Functional Theory Procedures: Accurate Thermochemical Components for High-Level Composite Protocols. Journal of Chemical Theory and Computation 2016, 12, 3774–3780
- Chan 2017 Chan, B. Use of Low-Cost Quantum Chemistry Procedures for Geometry Optimization and Vibrational Frequency Calculations: Determination of Frequency Scale Factors and Application to Reactions of Large Systems. Journal of Chemical Theory and Computation 2017, 13, 6052–6060
- Pulay et al. 1983 Pulay, P.; Fogarasi, G.; Pongor, G.; Boggs, J. E.; Vargha, A. Combination of Theoretical ab Initio and Experimental Information to Obtain Reliable Harmonic Force Constants. Scaled Quantum Mechanical (SQM) Force Fields for Glyoxal, Acrolein, Butadiene, Formaldehyde, and Ethylene. Journal of the American Chemical Society 1983, 105, 7037–7047
- Rauhut and Pulay 1995 Rauhut, G.; Pulay, P. Transferable scaling factors for density functional derived vibrational force fields. Journal of Physical Chemistry 1995, 99, 3093–3100
- Baker et al. 1998 Baker, J.; Jarzecki, A. A.; Pulay, P. Direct scaling of primitive valence force constants: An alternative approach to scaled quantum mechanical force fields. Journal of Physical Chemistry A 1998, 102, 1412–1424
- Fekete et al. 2007 Fekete, Z. A.; Hoffmann, E. A.; Kortvlyesi, T.; Penke, B. Harmonic vibrational frequency scaling factors for the new NDDO Hamiltonians: RM1 and PM6. Molecular Physics 2007, 105, 2597–2605
- Borowski et al. 2007 Borowski, P.; Fernández-Gómez, M.; Fernández-Liencres, M. P.; Ruiz, T. P. An effective scaling frequency factor method for scaling of harmonic vibrational frequencies: theory and preliminary application to toluene. Chemical Physics Letters 2007, 446, 191–198
- Borowski et al. 2008 Borowski, P.; Drzewiecka, A.; Fernández-Gómez, M.; Fernández-Liencres, M. P.; Ruiz, T. P. An effective scaling frequency factor method for harmonic vibrational frequencies: The factors’ transferability problem. Chemical Physics Letters 2008, 465, 290–294
- Borowski 2010 Borowski, P. An effective scaling frequency factor method for scaling of harmonic vibrational frequencies: The use of redundant primitive coordinates. Journal of Molecular Spectroscopy 2010, 264, 66–74
- Borowski et al. 2010 Borowski, P.; Drzewiecka, A.; Fernández-Gómez, M.; Fernández-Liencres, M. P.; Ruiz, T. P. A new, reduced set of scaling factors for both SQM and ESFF calculations. Vibrational Spectroscopy 2010, 52, 16–21
- Brittain et al. 2009 Brittain, D. R.; Lin, C. Y.; Gilbert, A. T.; Izgorodina, E. I.; Gill, P. M.; Coote, M. L. The role of exchange in systematic DFT errors for some organic reactions. Physical Chemistry Chemical Physics 2009, 11, 1138–1142
- Tentscher and Arey 2012 Tentscher, P. R.; Arey, J. S. Geometries and vibrational frequencies of small radicals: Performance of coupled cluster and more approximate methods. Journal of Chemical Theory and Computation 2012, 8, 2165–2179
- Yu and Truhlar 2015 Yu, H.; Truhlar, D. G. Components of the Bond Energy in Polar Diatomic Molecules, Radicals, and Ions Formed by Group-1 and Group-2 Metal Atoms. Journal of Chemical Theory and Computation 2015, 11, 2968–2983
- Yu et al. 2016 Yu, H. S.; Li, S. L.; Truhlar, D. G. Perspective: Kohn-Sham density functional theory descending a staircase. Journal of Chemical Physics 2016, 145, 130901
- Hsu 2018 Hsu, Y.-C. Bending Vibrational Levels in the Electronic Spectra of Small Radicals. Journal of the Chinese Chemical Society 2018, 65, 395–404
- Tew et al. 2007 Tew, D. P.; Klopper, W.; Heckert, M.; Gauss, J. Basis set limit CCSD(T) harmonic vibrational frequencies. Journal of Physical Chemistry A 2007, 111, 11242–11248