Comet 108P/Ciffreo: The Blob
Abstract
Short-period comet 108P/Ciffreo is known for its peculiar double morphology, in which the nucleus is accompanied by a co-moving, detached, diffuse “blob”. We report new observations of 108P/Ciffreo taken with the Hubble Space Telescope and the Nordic Optical Telescope and use them to determine the cause of this unusual morphology. The separation and the longevity of the blob across several orbits together rule out the possibility of a single, slow-moving secondary object near the primary nucleus. We use a model of coma particle dynamics under the action of solar gravity and radiation pressure to show that the blob is an artifact of the turn-around of particles ejected sunward and repelled by sunlight. Numerical experiments limit the range of directions which can reproduce the morphology and explain why the co-moving blob appearance is rare.
1 INTRODUCTION
Short-period comet 108P/Ciffreo was discovered on UT 1985 November 8 (by J. Ciffreo, reported in Heudier et al. (1985)). It is a Jupiter family comet (i.e. a likely escapee from the Kuiper Belt), with orbital semimajor axis = 3.646 au, eccentricity = 0.579, inclination = 14.0°, corresponding to Tisserand parameter with respect to Jupiter = 2.711. The orbital period is 7.0 years; the most recent perihelion occurred on UT 2021 October 16 at = 1.660 au.
A peculiar morphology was reported in late 2021, with the emerging appearance of a double object, consisting of a centrally condensed nucleus with a co-moving diffuse structure (the “blob”) located to its east. 108P was also noted for its peculiar optical morphology in earlier apparitions. For example, observers in 1985 December noted a “detached dust tail” (Larson et al., 1986; Levy & Larson, 1986), persisting to at least 1986 March (Chen and Jewitt 1994). Archived images taken 2014 November - December111http://www.aerith.net/comet/catalog/search.cgi 222http://www.astrosurf.com/cometas-obs/ 333https://tinyurl.com/dzx5dabu, although obtained with small telescopes and of variable quality, show a morphology soon after perihelion similar to that in early 2022, while a single post-perihelion image from 2007 July does not. In other comets, a double appearance normally indicates a nearly co-moving, secondary source displaced from, and independent of, the outgassing activity from the main nucleus (e.g. Boehnhardt 2004). However, this interpretation raises the question of how the double morphology could persist in successive orbits. An alternative possibility is that the detached appearance is caused by projection of dust particles in a sunward fan and then turned around by solar radiation pressure (Manzini et al., 2022). This interpretation is also puzzling since it raises the question of why it would apply only to 108P out of the hundreds of comets that have been imaged in the modern era.
We obtained Hubble Space Telescope observations in order to examine the unusual structure of 108P at high angular resolution, with the particular objective of being to understand the nature and origin of its double appearance. In addition, we secured images with the Nordic Optical Telescope in order to monitor the temporal development of the morphology of this unusual comet. Our purposes in this paper are to present the new observations and to suggest an interpretation.
2 OBSERVATIONS
Observations were obtained using the 2.5 m diameter Nordic Optical Telescope (NOT) located on La Palma, in the Canary Islands, with the telescope tracked to follow the non-sidereal motion of the comet. We used the ALFOSC (Andalucia Faint Object Spectrograph and Camera) imaging spectrometer camera at the f/11 Cassegrain focus. ALFOSC uses a 20482064 pixel “e2v Technologies” charge-coupled device (CCD), yielding an image scale 0.214″ pixel-1 across a 6.5′6.5′ field of view. Seeing was variable from night to night but stayed mostly within the range 1.0″ to 1.5″ FWHM (full width at half maximum). We used broadband Bessel B (central wavelength = 4400Å, FWHM = 1000Å), V ( =5300Å, = 800Å), R ( = 6500Å, = 1300Å) and the “” ( = 7970Å, = 1570Å) facility filters to measure the optical colors of 108P, obtaining a majority of the data in R with integration times of 150 s. Flat fields for these filters were constructed from images of an illuminated spot inside the dome of the NOT, while the bias level of the CCD was measured from a set of images obtained in darkness at the end of each night. Photometric calibration was obtained from observations of Landolt stars (Landolt, 1992) when the sky was clear and from field stars, using calibrations from the Gaia and Sloan DR14 digital sky surveys (Blanton et al., 2017), otherwise.
Observations were secured using the 2.4 m diameter Hubble Space Telescope under program GO 16904 (three orbits). We used the WFC3 camera, giving an image scale 0.04″ pixel-1 over a 120″120″ field of view. The images were taken using the F350LP filter which has central wavelength = 6230Å, and a very large FWHM = 4758Å, providing maximum sensitivity on a solar spectrum source. In each HST orbit, we obtained five exposures of 360 s duration (1800 s per orbit). We also examined archival HST images obtained when = 2.750 au on UT 1999 August 15 under GO 8274 (PI: P. Lamy), but could not identify 108P within the field.
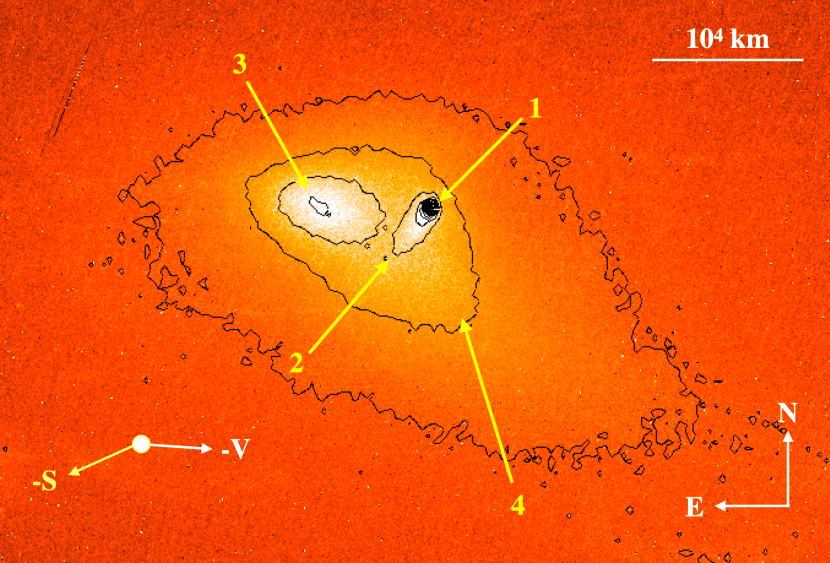
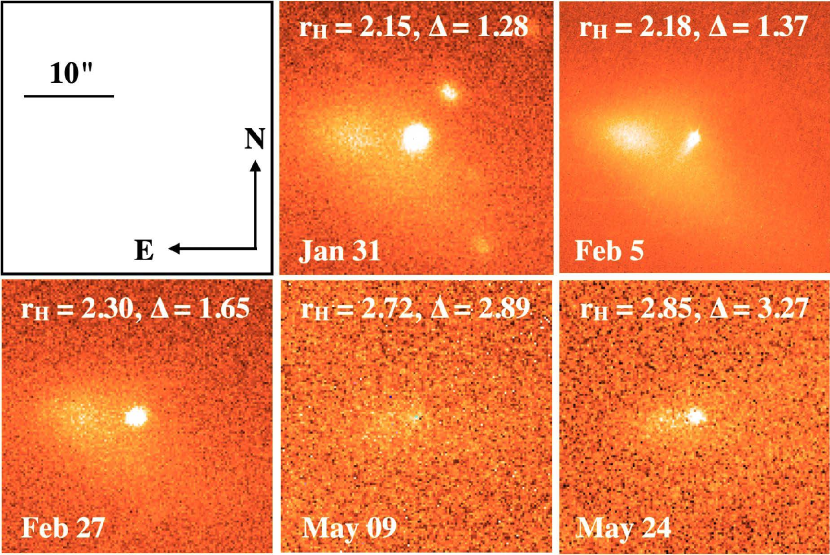
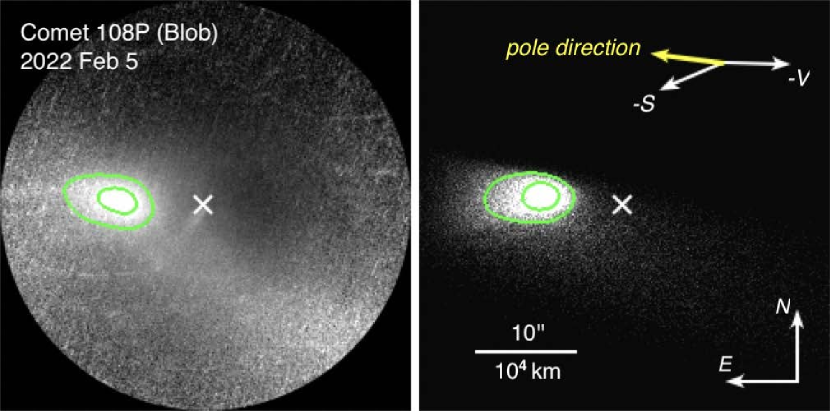
The geometric circumstances of the observations are given in Table 1. A median-combined image from HST is shown in Figure 1, revealing that 108P has four main components; (1) a centrally condensed bright core, (2) a linear, jet-like feature emanating from the nucleus, (3) a diffuse, approximately ellipsoidal blob projected 7″ (6580 km) to the east of the nucleus and (4) diffuse material enveloping the other components. The nucleus jet is not evident in images from the NOT, probably as a result of its lower angular resolution, but the other three components persist in all the observations taken with that telescope. A composite of the images from different dates is shown in Figure 2, where we show only one of the three HST visits (February 5) since the other two are taken close in time and are visually indistinguishable.
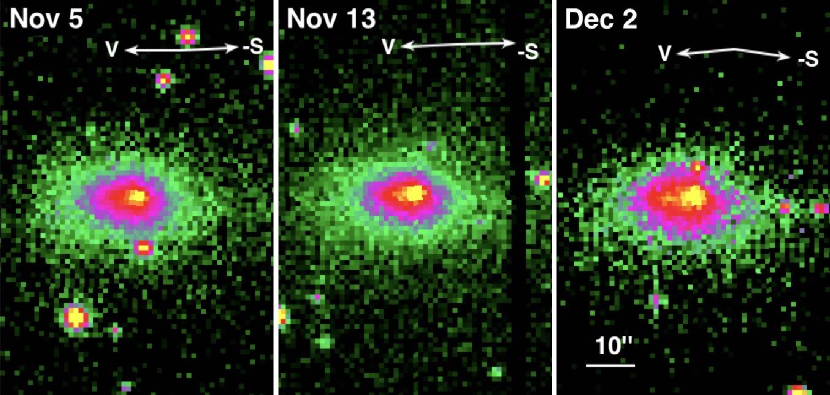
We additionally identified and analyzed archival data from the ZTF (Zwicky Transient Facility; Bellm et al. 2019) taken 2021 November - December. These images have integration times of 30 s in the ZTF r-band filter. Although the ZTF images are of considerably poorer resolution (image scale 1″ pixel-1), the blob was nevertheless clearly apparent on UT 2021 December 2, and a slight extension in the nucleus was observed on UT 2021 November 13 (Figure 3). Except for the emergence of the blob, the shape of the extended envelope in the background is stable, suggesting that the diffuse coma (component 4 in Figure 1) is not related to the blob.
Nucleus: We used images from HST to set the strongest constraints on the nucleus. Measurements obtained using a 0.2″ radius (200 km) aperture, with sky subtraction from a surrounding annulus extending to 0.28″, are summarized in Table 2. We corrected the apparent magnitude, , to absolute magnitude, using phase coefficient = 0.02 magnitude degree-1. The absolute magnitude of the central region varies in the range 17.30 18.08, but it is not clear if these variations reflect changes in the amount of near-nucleus dust, or changes in the projected cross-section of a rotating nucleus, or both.
The cross-section of the nucleus, , is related to its absolute magnitude, , and albedo, , by
| (1) |
where = -26.73 is the absolute magnitude of the Sun (Willmer, 2018). Substituting for we find nucleus scattering cross-sections 0.9 1.8 km2. The equivalent circular radius given by , is 0.5 0.8 km. Given the likelihood of dust contamination, however small, we take the smallest value km as our best estimate of the nucleus radius. The gravitational escape speed from a spherical nucleus of density = 500 kg m-3 and radius = 0.5 km is = 0.26 m s-1. Lamy et al. (2004) cite a larger nucleus radius, = 1.4 km, from unpublished work by Scotti (1995). Given the angular resolution offered by HST and its greater ability to isolate the nucleus from surrounding coma, we suspect that the latter estimate reflects larger dust contamination of the near-nucleus region.
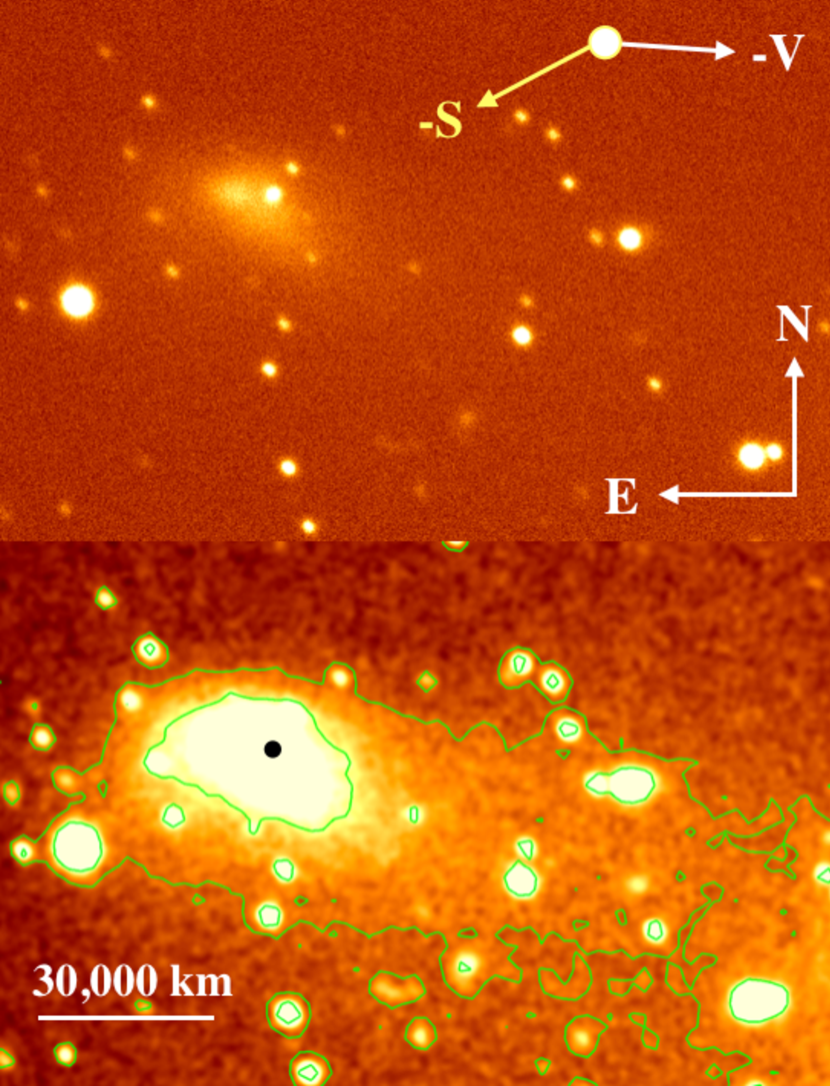
Diffuse Envelope: A composite (600 s equivalent exposure) R-band image taken with the NOT from UT 2022 January 31 is shown in the upper panel of Figure 4. The same image, convolved with a Gaussian of 1.5″ FWHM and subject to a harsh stretch is shown in the lower panel, revealing a long, broad dust tail to the south-west (position angle 2545°). Viewed from out-of-plane angle = -8.7°, the width of this tail is strongly affected by projection and cannot be used to directly determine the extent of the dust perpendicular to the orbit plane. The surface brightness of the tail is shown contoured, with the inner and outer contours corresponding to surface brightnesses = 24.3 and 25.4 magnitudes arcsecond-1, respectively, each accurate to about 0.2 magnitudes arcsecond-1 owing to sky brightness variations.
We used large aperture photometry to estimate the total brightness of the comet, a measure of the sum of the cross-sections of the ejected dust particles. Arbitrarily large photometry apertures are precluded by the influence of sky noise and background object contamination. We present measurements of fixed apertures with projected radii 104 km and 1.5 km. The use of fixed linear apertures provides a measure of the light scattered by particles from within a fixed volume around the nucleus. Note that some light from the coma and tail is unavoidably excluded even from the largest aperture. The measurements are summarized in Table 2.
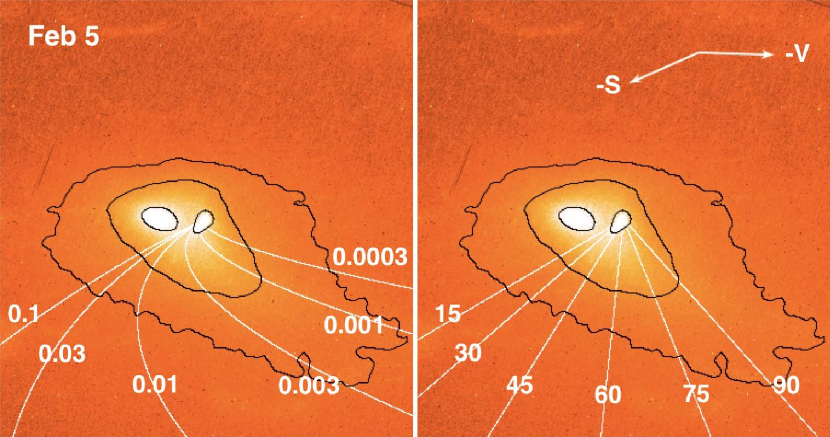
The motion of a cometary dust particle of radius, , is controlled by , the ratio of radiation pressure acceleration to solar gravity. The radiation pressure acceleration on a solid, spherical, non-metallic grain is approximately given by (Bohren & Huffman 1983). Figure 5 (left) shows syndynes on UT 2022 February 5, which are positions of particles of a given released over a range of times (Finson & Probstein 1968). The direction of the extended envelope are matched by syndynes with 0.0003 to 0.001, corresponding to particle radii 1 to 3 mm.
Linear Feature: The position angle of the jet-like linear feature varies in the HST data, from = 145°2° on UT 2022 February 5, to 141°1° on UT 2022 February 10 to 139°2° on UT 2022 February 13. The linear appearance suggests that this is a synchrone, defined by an impulsive ejection of particles having a range of sizes, subsequently size-sorted by radiation pressure. Figure 5 (right) shows synchrones on UT 2022 February 5. The measured angles indicate ejection on UT 2021 December 25 2. The synchrones for the two other epochs yield the same date of ejection. No photometric instability could be found near this date in the online archives.
Colors: We measured the colors of 108P on UT 2022 February 27 using the broadband BVRI filters of the Johnson-Cousins system (Table 3). We used circular photometry apertures with several different radii in order to assess spatial variations in the color. Note that, even the smallest aperture is dominated by light scattered from coma dust, not from the nucleus. Calibration of the data was obtained using nearly simultaneous measurements of Landolt stars at similar airmass. We assessed the photometric uncertainties by comparing measurements from three images taken in each filter. These uncertainties are a few 0.01 magnitude, except for the largest aperture where fluctuations in the sky background grow in importance, particularly for the B filter. Within these uncertainties, we find no evidence for spatial variation of the optical colors of 108P (Table 3). As shown in the table, the colors are redder than those of the Sun (Holmberg et al., 2006), but unremarkable when compared to the average colors of Jupiter family comets taken from Jewitt (2015).
3 DISCUSSION
3.1 Blob
The comet shows remarkably little morphological development (Figure 2), consistently exhibiting a bright nucleus region with a diffuse blob projected to its east. Measurements of the separation between the nucleus and the centroid of the blob, determined visually, are listed in Table 4, where the uncertainties correspond to 0.1″ in the HST observations and 0.5″ in the ground-based data. The linear separation, (km), increases slowly over 6 months of observation (Figure 6), reminiscent of the separation speeds of some fragmenting comets and asteroids (Boehnhardt, 2004). Extrapolation of the data gives in 2021 August (DOY -140), 2 months before perihelion. Figure 6 does not by itself exclude the possibility that the double appearance of 108P is caused by a splitting event. On the other hand, the re-appearance of the double morphology with a 7″ separation in successive (seven year period) orbits argues strongly against this possibility. We further exclude the possibility that a fragment could be co-moving with the main nucleus because it is gravitationally bound. The 6000 km separation is far larger than , the Hill radius of the nucleus (which, for radius = 0.5 km and density = 500 kg m-3 is 100 km).
An alternative explanation is that the co-moving blob is a projection of the sunward fan into the plane of the sky (Manzini et al., 2022). Particles ejected sunward from the dayside of the nucleus experience radiation pressure from the Sun, of magnitude , where is a dimensionless number inversely related to the particle size and is the local solar gravitational acceleration. We write , where is the heliocentric distance expressed in au and = 0.006 m s-2 is the acceleration at = 1 au. Given that the acceleration on a given particle is a constant, the turn-around distance representing the “nose” of the coma in the direction to the Sun is simply
| (2) |
where is the sunward ejection velocity. In gas drag acceleration, the particle ejection speed is a function of both the outflow speed in sublimated gas, , and the particle size. As a rough approximation, we take the thermal speed , where K is the temperature of the sublimating surface, = 18 is the molecular weight of water, the dominant molecule, and is the mass of the hydrogen atom. Substitution gives 500 m s-1. The smallest particles are well-coupled to the gas and leave the nucleus at approximately, . Larger particles are accelerated to smaller terminal ejection speeds, given by , where is the particle radius expressed in microns and . Substituting for in Equation 2 we have
| (3) |
showing that is independent of the particle size. Substitution, taking = 2.2 au as the middle distance (Table 1) gives km. For comparison, the separation of the coma blob from the nucleus is 7000 km in the plane of the sky and, corrected for projection assuming that the blob lies on the Sun-comet line, is 23,000 km. Given the many approximations and assumptions, we regard this as reasonable agreement, consistent with the possibility that the separated blob is a projection of the sunward fan.
3.2 Monte Carlo Dust Model
To further explore the possibility that the blob is a turn-around projection of the sunward fan, we used a Monte-Carlo simulation of the dust. This model, developed by Ishiguro et al. (2007) and used in Kim et al. (2020), accounts for the action of solar gravity and radiation pressure on particles drawn from a size distribution and released from the nucleus over a range of directions and speeds. By its nature, the Monte-Carlo simulation cannot provide unique solutions for the dynamics and structure of the coma. Its value lies in the identification of possible solutions while excluding combinations of parameters that are inconsistent with the data.
We consider a dust jet directed perpendicular to the surface of a rotating nucleus. The rotation of the nucleus sweeps the axis of the jet around a small circle centered on the pole (whose projected direction is (, )) with a half-angle, . We assume that the effective time-averaged jet axis (, ) simply corresponds to the pole (, ) and that jet is only active when the source region on the nucleus is illuminated by the sun. The model assumes a power-law distribution of particle sizes, with differential index = 3.5, dust terminal ejection speed m s-1, a dust production rate , and a range of particle sizes from to . We assume that dust is ejected from to , where is the time elapsed between the start of dust ejection and the observation, and is the time elapsed between the end of dust ejection and the observation. We created a number of model images using a range of parameters, and the model images were visually compared to the observations to find plausible parameters that give it a detached blob appearance. Numerical experiments limit the range of dust parameters:
-
•
We find plausible solutions for jet direction of and to produce a detached appearance and the observed orientation of the blob. A collimated jet () originating from the pole was required to fit the data. We find a best-fit pole orientation of 200 and 0. The implied nucleus obliquity is (i.e. the pole lies in the orbital plane).
-
•
The largest particle size without destroying the detached blob appearance is given by (particle radii 20 mm). The smallest particle size is poorly defined. We set a lower limit to (particle radii 2 mm). Smaller particles contribute less to the surface brightness of the blob because they are more quickly swept into the diffuse background.
-
•
Dust ejection is assumed to begin in 2021 August (Section 3.1). We find, by trial and error, that the termination point of the activity is 2021 December or earlier. A later termination would require a steep dependence of dust production rate on heliocentric distance () for unambiguous separation of the blob, while moderate dependence () is found in other comets (Ishiguro et al., 2007). The period of inferred activity to create a blob is months.
-
•
We find dust ejection speed m s-1 best fits the observed separation of the blob. In Figure 6, we show the best-fit modeled separations (solid line). Particles with mm have speeds of ejection in the range 0.8 3 m s-1. Given this range of speeds, the travel time from the nucleus to the center of the blob lies in the range (4 to 13) s (0.1 to 0.4 year), consistent with the six week (0.1 year) lag between perihelion and the first appearance of the blob in 2021.
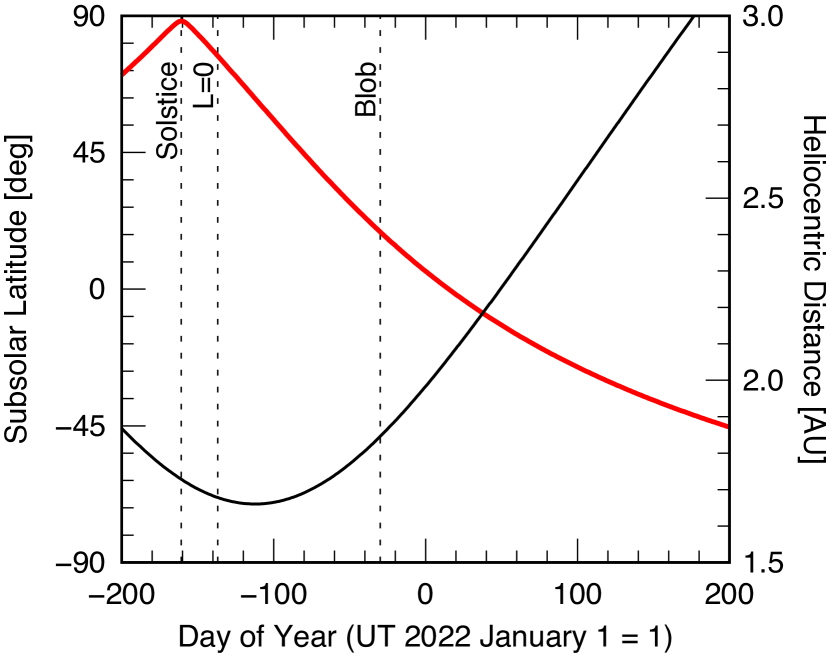
A specific example is given in Figure 7, with the best-fit parameters given in Table 5. In our model, the nucleus rotates with an obliquity of 90, in which case the seasonal variation in solar insolation is maximum. Figure 8 shows the subsolar latitude of 108P as a function of time. It is interesting to note that the northern solstice occurred in 2021 July, shortly before the inferred zero nucleus-blob separation in 2021 August. This suggests that the emergence of the blob may be influenced by seasonal effects.
Lastly, we note that 108P must have multiple active regions, some of which may have formed an extended envelope (Figure 1). The ZTF image sequence (Figure 3) suggests that the detached blob and extended envelope have distinct origins. The focus of this paper is on the blob and modeling of the extended envelope is outside the scope of this paper.
3.3 Pit Source
Three features of the inferred jet are suggestive of a pit source for the sublimated material, like the deep pits imaged on the nucleus of comet 67P (Vincent et al., 2015). First, the required narrow collimation of the jet is consistent with self-shadowing by a topographic feature, as expected of sublimation from the bottom of a vertical pit. Second, the apparently short-lived activity, or alternatively very steep heliocentric dependence of the production rate, is consistent with the limited period over which direct illumination of the floor of such a pit is possible. Third, the blob appeared just after the subsolar latitude 90.
For a self-shadowed, rectangular pit source with a depth-to-diameter ratio , the fraction of the floor illuminated by the Sun is
| (4) |
where the angle is the Sun elevation from the pit floor (Jewitt et al., 2015). We assume that sublimation occurs at the pit floor. Equation 4 gives 0 for , and otherwise. For example, the floor of a pit source with will only be half-illuminated when Sun elevation and in complete shadow when . If a deep pit source exists at the pole of comet 108P then a collimated jet would form in response to heating by the Sun when overhead.
We find that the floor of such a polar pit on 108P would be illuminated for about 60 days, broadly consistent with the longevity of the blob. Numerical experiments confirm that a collimated jet active for 60 days can generate a co-moving blob, whose longevity is further extended by the slow speeds and long travel times of the particles.
If such a pit source exists near the pole and the illumination conditions are satisfied, then similar blobs can be expected on other comets. We estimate the probability that a given nucleus would have an appropriately aligned pole as follows. Simulations of 108P show that the pole direction must be in the range and . The combination of (0.35 radians) and (0.17 radians) corresponds to 0.9% of the sunlit hemisphere. On this basis, and assuming a random distribution of comet spin vectors, we would expect about 1% of comets to show a double appearance like that of 108P due to a dust jet and particle turn-around. However, this is an upper limit to the expected incidence of this distinctive morphology because not all comets necessarily possess sufficiently deep vents (indeed, these have only been clearly recorded on the nucleus of comet 67P) and because of the additional constraint from our models, namely that particles larger than 2 cm must be depleted or absent in order for the blob to be distinct. Consistent with this expected low incidence rate, we find no clear examples of similar morphology in other comets in the refereed literature. However, a nearly co-moving coma structure in the Centaur 174P/Echeclus (reported in Choi et al. 2006) is potentially of similar origin. This possibility deserves investigation.
3.4 Mass
We used aperture photometry to estimate the cross-section of the material in the blob. For this purpose, we subtracted the median signal computed within concentric annuli centered on the main nucleus, using the on-line Cometary Coma Image Enhancement Facility software444Samarasinha, N., Martin, M., Larson, S., 2013. https://tinyurl.com/yued8tva. The background-subtracted image from February 5 is shown in the left panel of Figure 7. In a circular aperture of projected radius 3.2″ (3200 km), with sky subtraction from a surrounding annulus extending to 6.4″, the apparent and absolute magnitudes are and , respectively. The corresponding scattering cross-section computed from Equation (1) is = 0.09 km2.
The particle mass, , and the scattering cross-section, , are related by
| (5) |
where = 500 kg m-3 is the assumed particle density, is the mean particle radius. We take = 1 mm and = 20 mm, yielding 5 mm. Substituting = 0.09 km2, we obtain kg for the mass in the blob particles, equivalent to an equal-density sphere 5 m in radius. The ratio of the blob mass to nucleus mass ( km) is . This measurement shows how an almost inconsequential mass of material can substantially affect the morphology of the comet.
4 SUMMARY
From new observations of short-period comet 108P/Ciffreo, we find the following.
-
•
Comet 108P has a small nucleus with effective radius km, where is the unmeasured geometric albedo. It exhibits a distinctive and recurrent double morphology not commonly reported in other comets.
-
•
Recurrence of the double morphology in successive orbits excludes the possibility of a single, slow-moving secondary object near the nucleus of 108P.
-
•
We used a Monte-Carlo model of coma particle dynamics to show that the blob is an artifact of the turn-around of particles ejected sunward in a narrow jet (half-angle 10° 15°) and repelled by sunlight.
-
•
We suggest that topography (likely a pit) present near the pole of a high-obliquity nucleus may be responsible for the collimation of the jet and the formation of the observed blob.
-
•
The blob morphology is reproduced only for a narrow range of ejection directions, explaining why the appearance is uncommon. We estimate that, if the spin vectors of cometary nuclei are randomly oriented, 1% of comets have the potential to exhibit such morphology.
References
- Bellm et al. (2019) Bellm, E. C., Kulkarni, S. R., Graham, M. J., et al. 2019, PASP, 131, 018002
- Blanton et al. (2017) Blanton, M. R., Bershady, M. A., Abolfathi, B., et al. 2017, AJ, 154, 28
- Bohren & Huffman (1983) Bohren, C. F. & Huffman, D. R. 1983, Absorption and scattering of light by small particles. New York: Wiley, 1983
- Boehnhardt (2004) Boehnhardt, H. 2004, Comets II, 301
- Chen & Jewitt (1994) Chen, J. & Jewitt, D. 1994, Icarus, 108, 265. doi:10.1006/icar.1994.1061
- Choi et al. (2006) Choi, Y.-J., Weissman, P., Chesley, S., et al. 2006, Central Bureau Electronic Telegrams, 563
- Heudier et al. (1985) Heudier, J.-L., Ciffreo, J., & Kosai, H. 1985, IAU Circ., 4135
- Holmberg et al. (2006) Holmberg, J., Flynn, C., & Portinari, L. 2006, MNRAS, 367, 449
- Ishiguro et al. (2007) Ishiguro, M., Sarugaku, Y., Ueno, M., et al. 2007, Icarus, 189, 169
- Jewitt et al. (2015) Jewitt, D., Li, J., Agarwal, J., et al. 2015, AJ, 150, 76. doi:10.1088/0004-6256/150/3/76
- Jewitt (2015) Jewitt, D. 2015, AJ, 150, 201. doi:10.1088/0004-6256/150/6/201
- Kim et al. (2020) Kim, Y., Jewitt, D., Mutchler, M., et al. 2020, ApJ, 895, L34
- Landolt (1992) Landolt, A. U. 1992, AJ, 104, 340. doi:10.1086/116242
- Larson et al. (1986) Larson, S. M., Levy, D., Klemola, A. R., et al. 1986, IAU Circ., 4158
- Levy & Larson (1986) Levy, D. H. & Larson, S. M. 1986, BAAS1986BAAS…18..811L
- Manzini et al. (2022) Manzini, F., Ochner, P., Oldani, V., et al. 2022, The Astronomer’s Telegram, 15177
- Vincent et al. (2015) Vincent, J.-B., Bodewits, D., Besse, S., et al. 2015, Nature, 523, 63. doi:10.1038/nature14564
- Willmer (2018) Willmer, C. 2018, ApJS, 236, 47. doi:10.3847/1538-4365/aabfdf
| UT Date & Time | DOYaaDay of Year, 1 = UT 2022 January 1 | TelbbTelescope: ZTF = Zwicky Transient Facility, NOT = Nordic Optical Telescope, HST = Hubble Space Telescope | ExpccFilter employed | ddTrue anomaly, in degrees | eeHeliocentric distance, in au | ffGeocentric distance, in au | ggPhase angle, in degrees | hhPosition angle of projected anti-solar direction, in degrees | iiPosition angle of negative heliocentric velocity vector, in degrees | jjAngle from orbital plane, in degrees |
|---|---|---|---|---|---|---|---|---|---|---|
| 2021 Dec 02 08:39-08:40 | -30 | ZTF | 44.4 | 1.849 | 0.980 | 19.9 | 261.6 | 275.1 | -3.9 | |
| 2022 Jan 31 21:08-21:17 | 31 | NOT | R | 68.7 | 2.150 | 1.281 | 16.1 | 118.2 | 267.9 | -8.7 |
| 2022 Feb 05 12:34-13:07 | 36 | HST | F350LP | 70.2 | 2.175 | 1.336 | 17.5 | 114.3 | 267.6 | -8.4 |
| 2022 Feb 10 08:28-09:01 | 41 | HST | F350LP | 71.9 | 2.203 | 1.398 | 18.7 | 111.0 | 226.4 | -8.1 |
| 2022 Feb 13 09:30-10:03 | 44 | HST | F350LP | 72.9 | 2.220 | 1.439 | 19.4 | 109.3 | 267.4 | -7.8 |
| 2022 Feb 27 23:15-23:49 | 58 | NOT | BVRI | 73.4 | 2.304 | 1.650 | 22.0 | 103.7 | 267.9 | -6.5 |
| 2022 May 09 20:54-21:13 | 129 | NOT | R | 95.3 | 2.723 | 2.886 | 20.5 | 99.2 | 279.0 | -0.1 |
| 2022 May 24 21:25-22:01 | 144 | NOT | R | 99.8 | 2.850 | 3.267 | 17.4 | 99.3 | 282.8 | +1.2 |
| Date | DOYbb Day of Year, 1 = UT 2022 January 1. | Innercc HST-only photometry with a 0.2″ (200 km at the comet) radius aperture. | Middledd Photometry using a fixed aperture with a projected radius 104 km. | Outeree Photometry using a fixed aperture with a projected radius 1.5 km. |
|---|---|---|---|---|
| January 31 | 31 | – | 16.38/13.86/42.9 | 16.07/13.55/57.1 |
| February 5 | 36 | 19.97/17.30/1.80 | 17.34/14.68/20.2 | 17.05/14.38/26.5 |
| February 10 | 41 | 20.14/17.33/1.76 | 17.47/14.65/20.6 | 17.17/14.36/27.1 |
| February 13 | 44 | 20.99/18.08/0.88 | 16.90/13.99/38.0 | 16.53/13.62/53.3 |
| February 27 | 58 | – | 18.43/15.09/13.8 | 18.06/14.72/19.4 |
| May 9 | 129 | – | 19.84/14.95/15.7 | 19.43/14.54/22.8 |
| May 24 | 144 | – | 20.19/15.00/15.0 | 19.82/14.63/21.1 |
| ApaaAperture radius in arcsecond (km) | B-V | V-R | R-I | B-R |
|---|---|---|---|---|
| 2.1″ (2.6 km) | 0.770.03 | 0.500.03 | 0.470.03 | 1.270.04 |
| 3.2″ (3.8 km) | 0.780.03 | 0.490.03 | 0.500.03 | 1.270.04 |
| 12.5″ (15.0 km) | 0.720.10 | 0.470.03 | 0.430.03 | 1.190.10 |
| JFCbbAverage color of Jupiter Family Comets, from Jewitt (2015) | 0.750.02 | 0.470.02 | 0.430.02 | 1.220.02 |
| SunccColor of the Sun, from Holmberg et al. (2006) | 0.640.02 | 0.350.01 | 0.330.01 | 0.990.02 |
| UT Date | DOYaaDay of Year, 1 = UT 2022 January 1 | bbGeocentric distance, au | ccSeparation angle, arcsec | ddPlane of sky length, km |
|---|---|---|---|---|
| December 02 | -30 | 0.980 | 5.7 | 4051400 |
| December 30 | -2 | 1.019 | 7 | 5250eeFrom Manzini et al. (2022) |
| January 31 | 31 | 1.281 | 6.9 | 6408480 |
| February 05 | 36 | 1.336 | 6.8 | 6586100 |
| February 10 | 41 | 1.398 | 6.8 | 6892105 |
| February 13 | 44 | 1.439 | 6.7 | 6989108 |
| February 27 | 58 | 1.650 | 6.1 | 7297620 |
| May 09 | 129 | 2.886 | 3.2 | 67001080 |
| May 24 | 144 | 3.267 | 3.2 | 75801230 |
| Parameter | Input Values | Best-fit Values |
|---|---|---|
| 0.5 | Fixed | |
| 3.5 | Fixed | |
| 3 | Fixed | |
| to | ||
| to | ||
| (days)aaTime elapsed between the start of dust ejection and the observation (UT 2022 February 5). | 170 | Fixed |
| (days)bbTime elapsed between the end of dust ejection and the observation (UT 2022 February 5). | 0–100 with 10 interval | |
| (m s-1) | 60–150 with 10 interval | 110–120 |
| () | 10–40 with 5 interval | 10–15 |
| () | 0–360 with 5 interval | 190–210 |
| () | -90 to 90 with 5 interval | 0–10 |