Open data from the third observing run of LIGO, Virgo, KAGRA and GEO
Abstract
The global network of gravitational-wave observatories now includes five detectors, namely LIGO Hanford, LIGO Livingston, Virgo, KAGRA, and GEO 600. These detectors collected data during their third observing run, O3, composed of three phases: O3a starting in April of 2019 and lasting six months, O3b starting in November of 2019 and lasting five months, and O3GK starting in April of 2020 and lasting 2 weeks. In this paper we describe these data and various other science products that can be freely accessed through the Gravitational Wave Open Science Center at https://gwosc.org. The main dataset, consisting of the gravitational-wave strain time series that contains the astrophysical signals, is released together with supporting data useful for their analysis and documentation, tutorials, as well as analysis software packages.
1 Introduction
Gravitational-wave (GW) detectors develop through successive generations of instruments with increasing sensitivity (Abbott et al., 2020a). The US-based Advanced LIGO111Laser Interferometer Gravitational-Wave Observatory detectors (Aasi et al., 2015) were the first two instruments of the current generation to begin operation, collecting data during the first observing run (O1) from September 2015 to January 2016, including the first direct detection of gravitational waves (Abbott et al., 2016). The second observing run (O2) followed from November 2016 to August 2017, with the European detector Advanced Virgo (Acernese et al., 2015) joining in August 2017. The GEO 600 detector in Germany (Dooley et al., 2016) serves as a center of research and development, and is used to test a number of critical detector technologies. Another GW detector, the Japan-based KAGRA (Akutsu et al., 2021), has also been rapidly developing.
This article focuses on the data collected during the third observing run, O3, that took place from April 1 2019 to April 21 2020. The bulk of this observing run collected data only from LIGO and Virgo, and is divided into two main operational phases: O3a from April 1 2019 to October 1 2019, and O3b from November 1 2019 to March 27 2020, with a one-month maintenance break between the two phases. KAGRA was expected to join O3, but this initial plan changed due to the outbreak of COVID-19. Instead, KAGRA and GEO 600 operated during an extended observing phase, O3GK, from April 7 to April 21 2020 (Abbott et al., 2022a).
The analysis of the O3 data has led to numerous publications. Those include several updates to the GWTC (GW Transient Catalog; Abbott et al., 2021a, b, c) that compiles transient sources analyzed and reported by the combined LIGO-Virgo-KAGRA Collaboration (LVK). The cumulative GWTC catalog currently includes nearly 100 candidate sources (with a probability of astrophysical origin > 50 %), all associated with the coalescence of compact star binaries composed of either neutron stars, black holes, or both.
Following the policy defined in the LIGO Data Management Plan (LIGO Laboratory, 2022a) and a Memorandum of Understanding (LIGO Scientific Collaboration and Virgo Collaboration, 2019), the O3 data set and associated science products are published through the Gravitational-Wave Open Science Center (GWOSC) at https://gwosc.org 222This website is also accessible at https://gw-openscience.org. allowing the reproducibility of the analyses performed by the LVK and increasing the impact of the data through its wider use. This paper provides a description of the publicly released data (LIGO Scientific Collaboration and Virgo Collaboration, 2021a, b; LIGO Scientific Collaboration, Virgo Collaboration and KAGRA Collaboration, 2022a) along with additional information on their usage.
To date hundreds of scientific articles have been written using the data available from the GWOSC website (all datasets combined) 333See https://gwosc.org/projects for a list of articles that refer to the data published on the GWOSC website.. These analyses confirm, complement, and extend the results published by the LVK Collaboration, demonstrating the impact on the scientific community of the GW data releases.
This paper is organized as follows. Section 2 summarizes the status of the detectors during the observing run O3, together with high-level indicators such as their distance reach and duty cycle of operation. This section also provides insights about how the data are collected and calibrated, about data quality and about simulated signal injections. Section 3 describes the format, content and provenance of the strain data files distributed through the GWOSC, including the nomenclature used for the calibration versions and channel names. Section 4 describes the Event Portal, a searchable GW event database accessible online. Details about the technical validation and review of the data and documentation are given in Section 5. Finally, Section 6 provides some guiding principles to the novice user and suggests software tools that can be used to analyze the data.
2 Instruments
The Advanced LIGO (Aasi et al., 2015) and Advanced Virgo (Acernese et al., 2015) detectors are enhanced Michelson interferometers with arm lengths of 4 km and 3 km, respectively. Advanced LIGO comprises two detectors located at two different sites in the US, namely, in Hanford, WA and Livingston LA, while Advanced Virgo has a single site in Cascina, close to Pisa, Italy. The various instrument upgrades realized between the science runs O2 and O3 for the LIGO and Virgo detectors are described in (Buikema et al., 2020; Abbott et al., 2021a, c; Acernese et al., 2022a). They involve many parts of the instruments, including the main laser source and the core optics along with the installation of mitigation systems for a range of technical noises. One of the major novelties in O3 both for LIGO and Virgo is the use of squeezed light sources (see Tse et al. (2019) for LIGO and Acernese et al. (2019) for Virgo), a technique (Schnabel et al., 2010; Barsotti et al., 2019) that significantly reduces quantum noise, thus enhancing the sensitivity at high frequency.
GEO 600 (Dooley et al., 2016) is a British–German interferometric GW detector with 600 m arms located near Hannover, Germany. As in LIGO and Virgo, quantum squeezing is used to reduce noise in the output measurement quadrature (Lough et al., 2021). This technique was first demonstrated by GEO 600 (Abadie et al., 2011). KAGRA is an underground laser interferometer with 3-km arms, located underground at the Kamioka Observatory in Gifu Prefecture, Japan. An important feature of its design is the cooling system intended to bring the large mirrors of the interferometer to cryogenic temperature (around 20 K) in order to reduce thermal noise (Akutsu et al., 2016; Chen et al., 2014). During the O3GK run however, the detector was operated at room temperature (Akutsu et al., 2018, 2021).
2.1 Detectors performance
A GW detector’s performance is often globally characterized by two measures: its duty factor, defined as the fraction of time the detector is recording observational quality data, and its distance reach, conventionally measured as the binary neutron star (BNS) inspiral range (Finn & Chernoff, 1993; Chen et al., 2021), the distance to which a BNS inspiral could be detected with signal-to-noise ratio of 8, assuming 1.4 solar mass component objects and averaging over source position and orientation. The choice of this metric is a standard convention. The value of 1.4 solar masses is close to the measured masses of the stars in the Hulse–Taylor binary (Weisberg & Huang, 2016) and within the narrow range predicted by stellar evolution for neutron-star masses. The distance reach of the detectors strongly depends on the source mass. For example, binary black-hole (BBH) systems can typically be detected at much greater distances, up to several Gpc (e.g., Abbott et al., 2021c, Table IV).
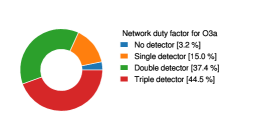
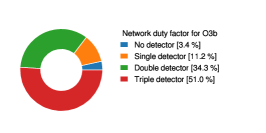
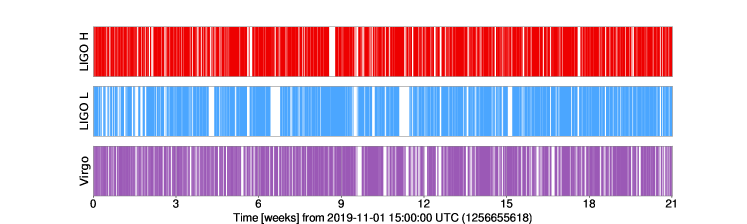
The GWOSC website hosts summary pages for O3a444https://gwosc.org/detector_status/O3a and O3b555https://gwosc.org/detector_status/O3b which describe the LIGO and Virgo operations and sensitivity. The duty factors during O3a are 71% for LIGO Hanford (H1), 76% for LIGO Livingston (L1) and 76% for Virgo (V1). During O3b, the corresponding percentages are 79%, 79% and 76%, respectively. Those translate into the observing factors shown in Fig. 1 that quantify the fraction of observing time spent with one, two or three instruments in operation.
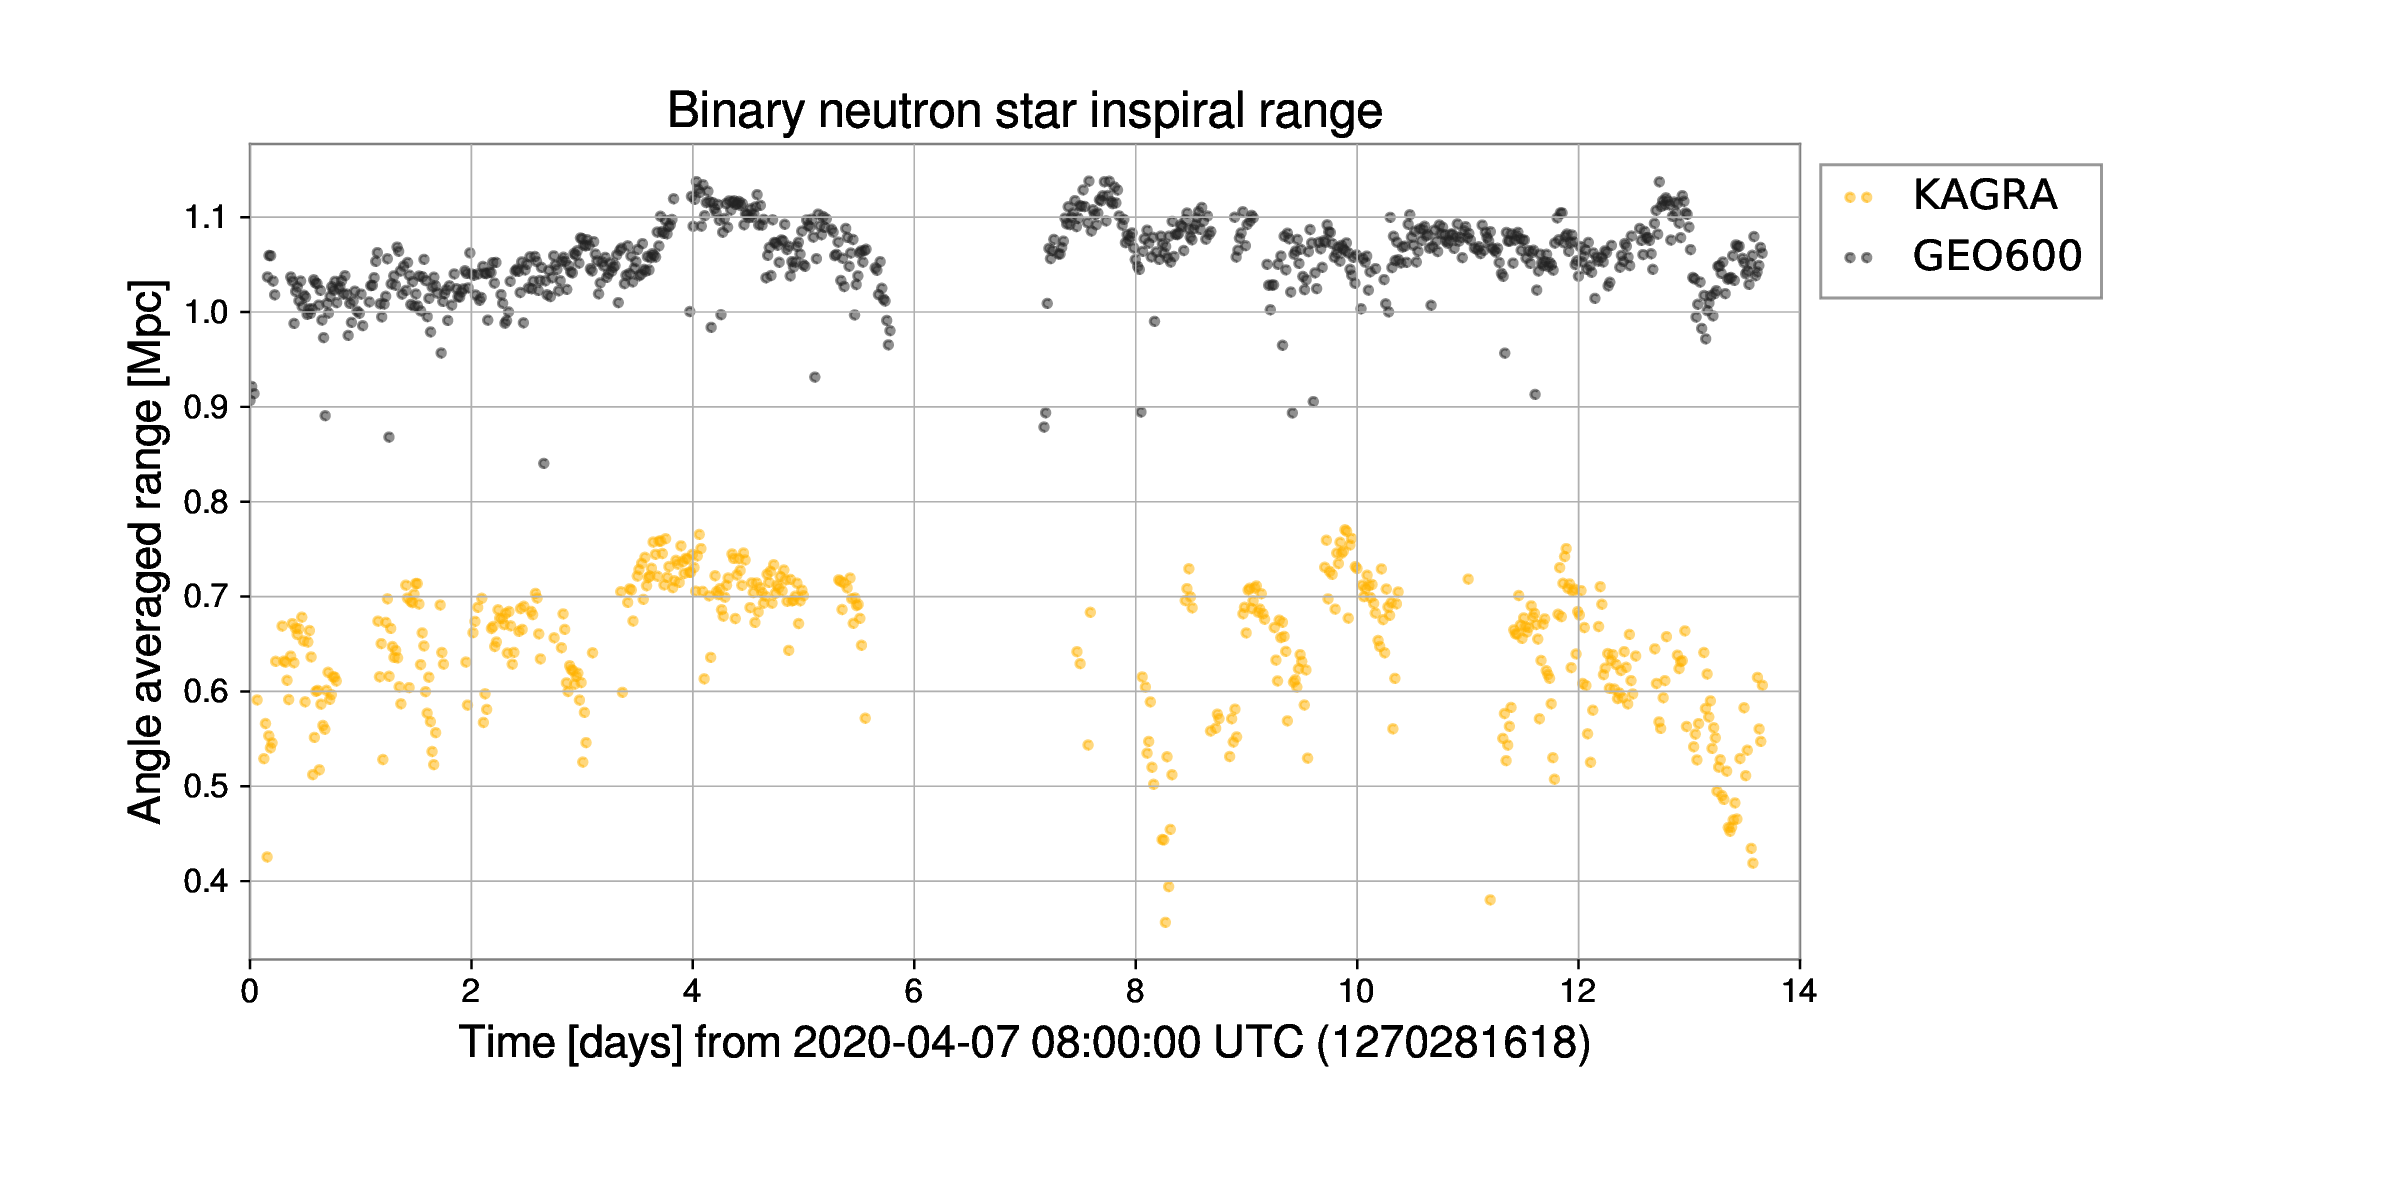
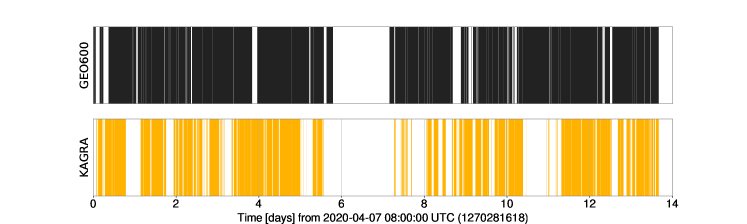
During the O3GK run, the duty factors of KAGRA (K1) and GEO 600 (G1) are 53% and 80% respectively, leading to a coincident observing factor of 47% (Abbott et al., 2022a). The lower duty cycle of KAGRA is due to the fact that alignment sensing and control with wavefront sensors was not yet implemented at the time of the run, leading to a higher susceptibility to microseismic ground vibrations.
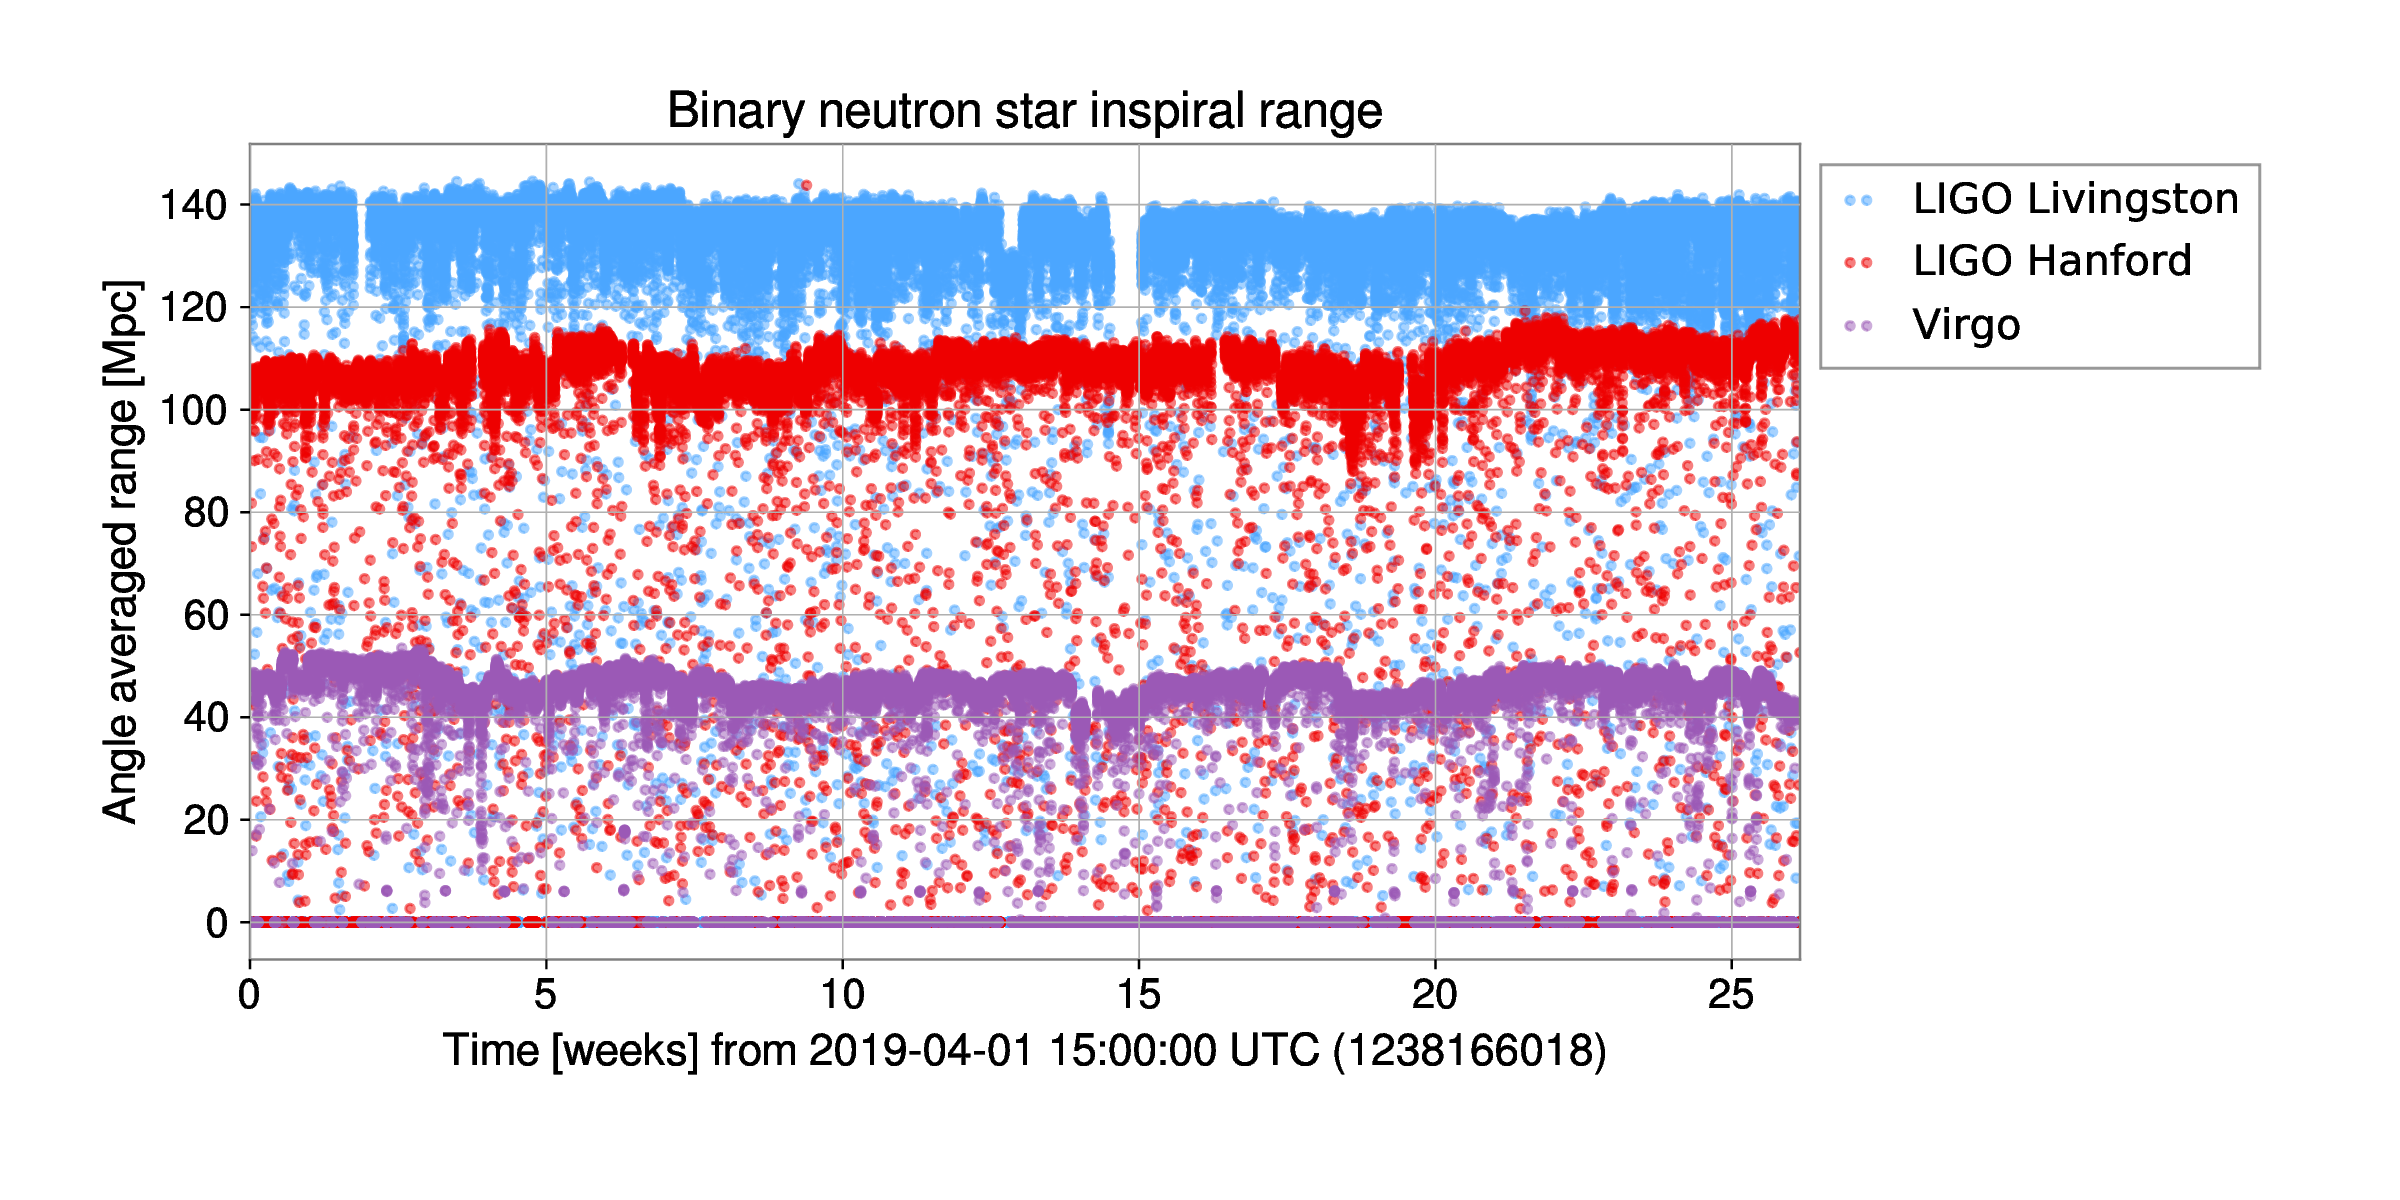
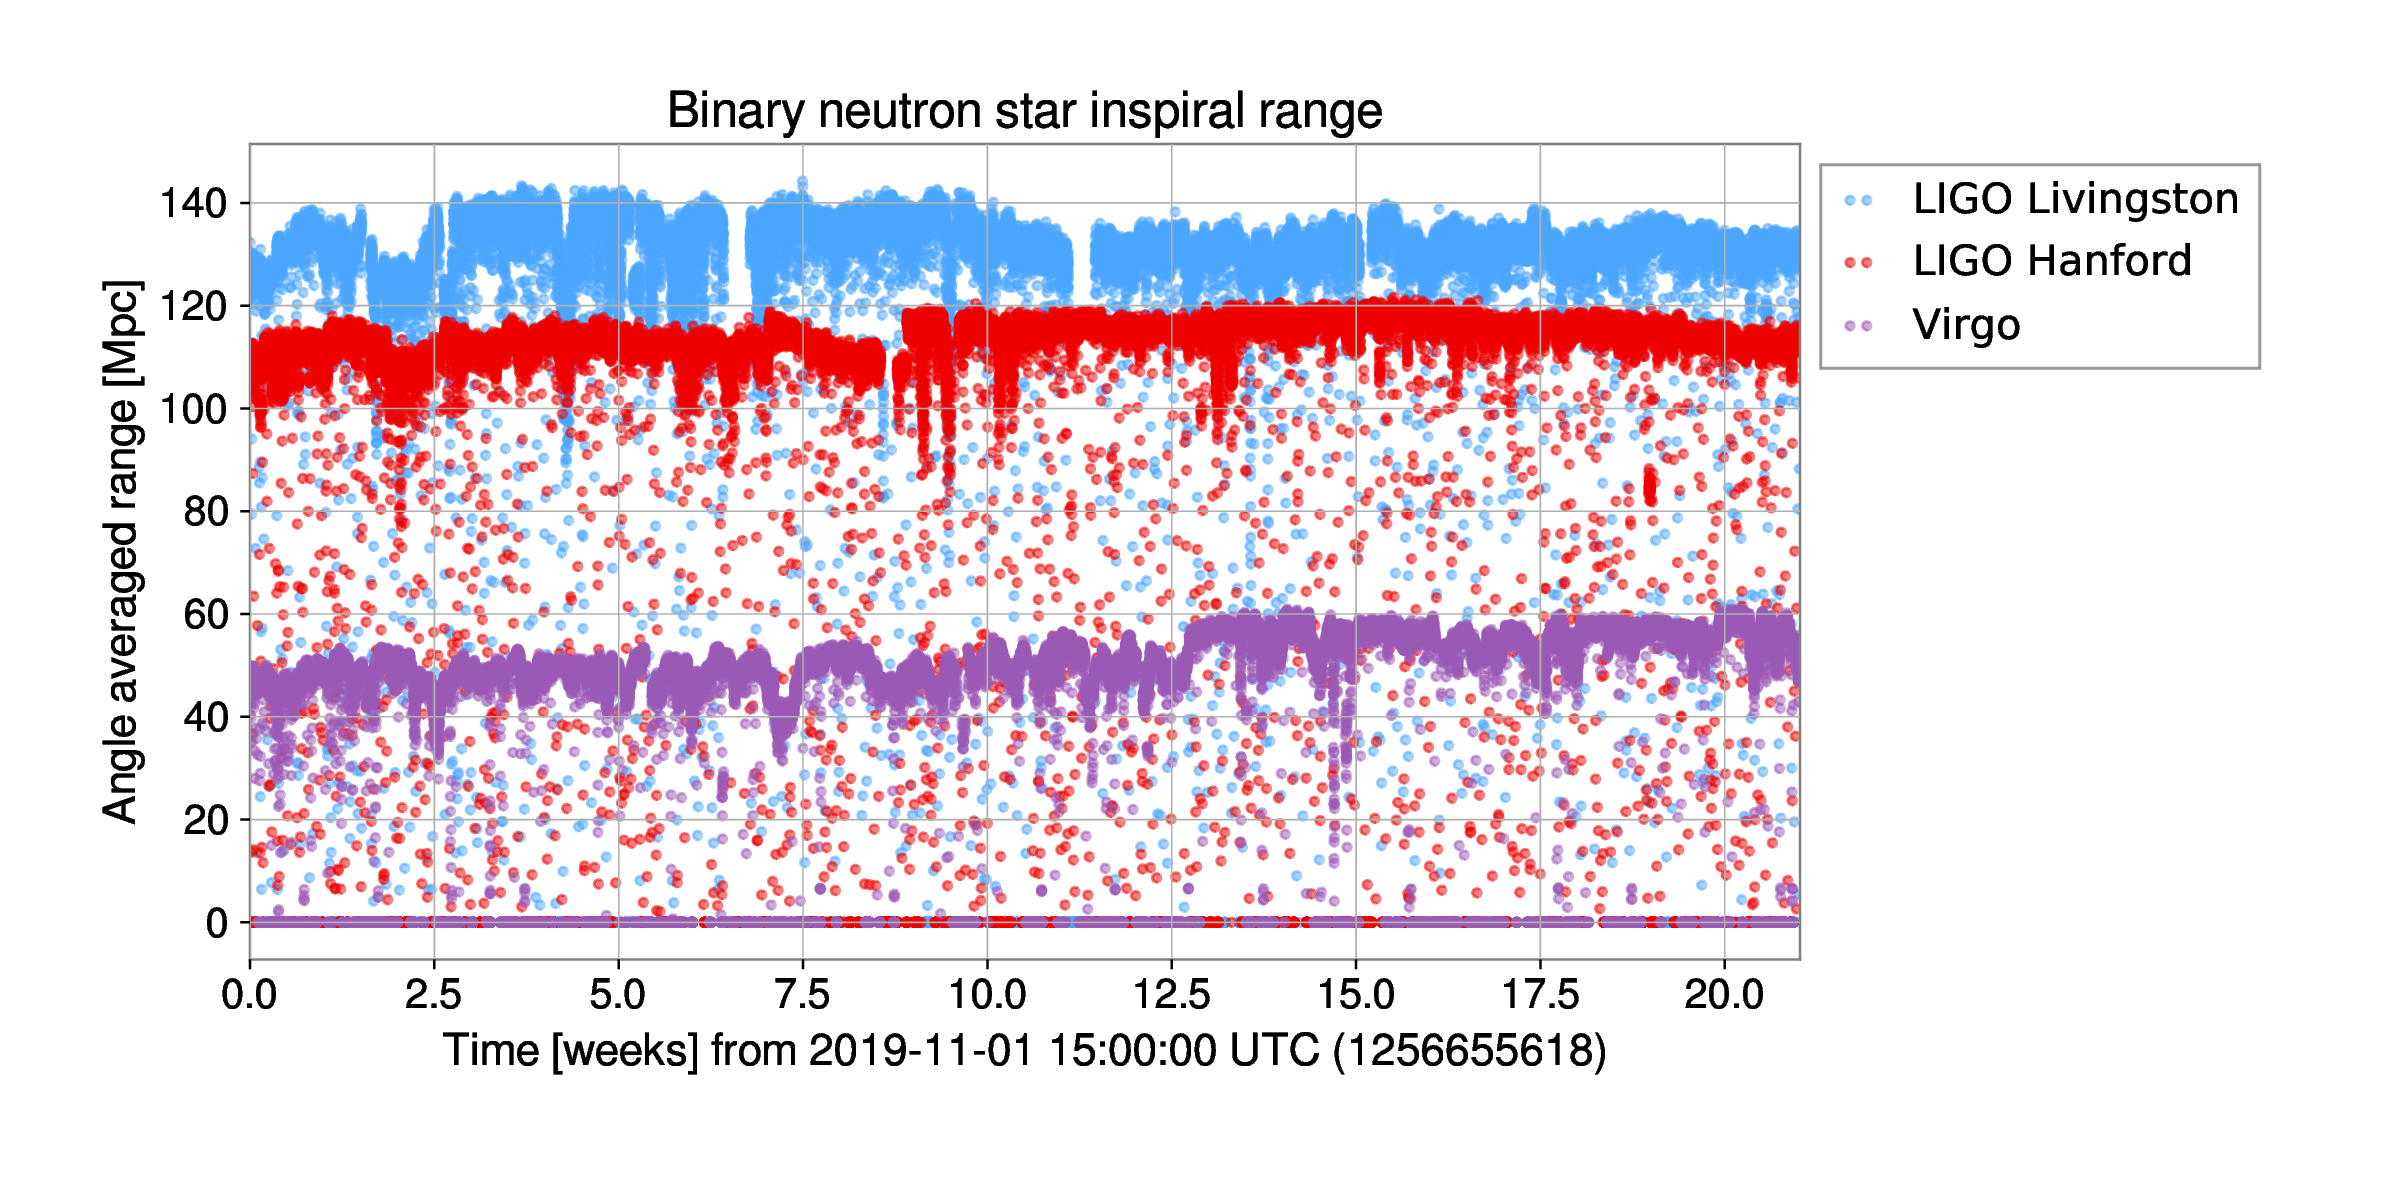
The median values of the BNS range over the whole observing run are 108 Mpc, 135 Mpc and 45 Mpc for H1, L1 and V1 respectively during O3a, and 115 Mpc, 133 Mpc and 51 Mpc during O3b for the same detectors. The median values of the BNS range over the O3GK period are 0.66 Mpc for KAGRA and 1.06 Mpc for GEO 600. Fig. 2 displays the median BNS range computed over regular intervals (5-minute scale for LIGO and Virgo and 20-minute scale for GEO 600 and KAGRA). The drops that can be observed in both plots are due to transient noise artifacts (discussed in Sec. 2.3) reducing the detector sensitivity temporarily. The BNS range shown in the recent GWTC publications such as Abbott et al. (2021a) (Fig. 3) and Abbott et al. (2021c) (Fig. 3) are averaged over a longer period (1 hour) and are thus less affected by transient noise. The longer gaps in the BNS inspiral range are due to maintenance intervals, instrumental issues, and earthquakes.

2.2 Calibration
The GW strain is obtained and calibrated from variations of the optical power measured at the output port of each detector. The calibration procedure and the corresponding characterization of the systematic and statistical uncertainties are described in Viets et al. (2018); Sun et al. (2020, 2021) for Advanced LIGO and Acernese et al. (2022b) for Advanced Virgo. Calibration is performed in two stages: an initial, online calibration used for low-latency analysis, and a final, offline calibration that applies any needed corrections to the initial result. The offline calibration may correct for computer failures, incomplete modelling of the detectors, or any systematic errors characterized after the observing period. The uncertainties in the calibration procedure for both the magnitude and phase of as a function of frequency are documented (LIGO Scientific Collaboration & Virgo Collaboration, 2021).
The calibration process also includes a noise subtraction step based on independent measurements of a range of noise sources by witness sensors, as described in Davis et al. (2019); Vajente et al. (2020a); Mukund et al. (2020); Estevez et al. (2019); and Acernese et al. (2022b). For the last two weeks of O3a, the Virgo data were reprocessed with a new configuration of the noise subtraction (Rolland et al., 2019; Acernese et al., 2022b) so a different calibration is available just for this period (see Table 1).
GWOSC releases two types of strain data: bulk data spanning an entire observing run, and smaller data snippets around the time of each GW event. Data snippets are based on the calibration version available at the time of publication of the related GW event. Events that appear in multiple publications may have multiple data snippets available, sometimes with different calibration versions. Naturally, the time segments released as data snippets are also available in the bulk data set, but the bulk data of the entire O3a, O3b and O3GK observation runs provided through GWOSC correspond to the final (most up-to-date) calibration. These differences in calibration can lead to discrepancies between the data snippets and the corresponding data in the bulk data release, potentially leading in turn to differences in the source parameter values that can be estimated from the data. However, as discussed in Sec. 3.3, in addition to the main bulk data release, several alternate strain channels with different calibration versions are also made public.
The detector strain in O3 is calibrated only between 10 Hz and 5000 Hz for Advanced LIGO, between 20 Hz and 2000 Hz for Advanced Virgo, between 30 Hz and 1500 Hz for KAGRA and between 40 Hz and 6000 Hz for GEO 600. Any apparent signal outside these ranges cannot be trusted because it is not a faithful representation of the GW strain at these frequencies. In addition, Advanced Virgo data between 49.5 Hz and 50.5 Hz are characterised by a large increase of calibration errors because of effects related to the mains power lines (Acernese et al., 2022b). Because of this increased systematic error, data in this narrow frequency band were considered to be uninformative for source-parameter estimation (see Appendix E of Abbott et al. (2021c) for relevant methods).
2.3 Detector noise characterization and data quality
The data are dominated by instrumental noise that can be well described as Gaussian and stationary over limited time scales and frequency ranges. The data also contain intermittent short-duration noise artifacts, or glitches, that contribute to the noise background as well. Any analysis of GW data must account for the presence of these various noise components (see Sec. 6 for more information about using the data). A summary of efforts to characterize data quality in O3 can be seen in Davis et al. (2021) for Advanced LIGO, Acernese et al. (2022a) for Advanced Virgo, and Abe et al. (2022) for KAGRA. The overall quality of data for transient searches is recorded as data quality segments, described in more detail in Sec. 3.2.
2.4 Signal injections
Hardware injections are simulated GW signals added by physically displacing the test masses (i.e. the interferometer mirrors) (Biwer et al., 2017). The simulated signal initiates a response that mimics that of a true GW. By looking for discrepancies between the injected and recovered signals, it is possible to characterize the performance of analyses and the coupling of instrumental subsystems to the detectors’ output channels.
During the third observing run O3, hardware injections were performed in the Advanced LIGO and Advanced Virgo detectors. The record of all injections is available through GWOSC web pages.666http://gwosc.org/O3/o3_inj This list is provided to prevent potential confusion with an actual astrophysical signal. For Virgo, those injections were removed post-facto when producing the calibrated strain (see Acernese et al. (2022b) for details on this subtraction), so the injection times are not marked in the GWOSC files. On the other hand, in the case of Advanced LIGO the injections are still present in the calibrated data, and their times are marked in the GWOSC files (see Sec. 3.2).
No injections were performed during O3GK.
3 Strain data
All O3 open data are distributed under the Creative Commons Attribution International Public License 4.0, including strain data from O3a (LIGO Scientific Collaboration and Virgo Collaboration, 2021a), O3b (LIGO Scientific Collaboration and Virgo Collaboration, 2021b) and O3GK (LIGO Scientific Collaboration, Virgo Collaboration and KAGRA Collaboration, 2022a). Small batches of files can be conveniently downloaded from the GWOSC website directly.777https://gwosc.org/data However, when downloading large amounts of data (such as an entire observing run) the use of the distributed file system CernVM-FS (Weitzel et al., 2017) is recommended.888For CernVM-FS installation instructions, see https://gwosc.org/cvmfs. Once configured, CernVM-FS allows access to all GWOSC data locally on the user’s computer.
The O3 calibrated strain data are distributed in files that contain 4096 seconds of data. Published GW signals are also released in separate files containing data snippets of 4096 seconds or 32 seconds, centered on the event’s detection time and released under the GWOSC Event Portal.999See https://gwosc.org/eventapi. The description of the data records that follows is valid both for single event releases and for bulk data releases.
GWOSC calibrated strain data are repackaged from data stored in the LVK archives. The data source is uniquely identified by a channel name and a frame type (see Table 1). At times when data are unavailable or of quality too poor to be analyzed, the strain values are represented with NaNs. Strain data are made available both at the sampling rate of 16384 Hz, and at a downsampled rate of 4096 Hz101010For simplicity, in the rest of the paper the sampling rates will be indicated in kHz and rounded to the closest integer, i.e. 4 and 16 kHz means 4096 and 16384 Hz, respectively.. Down-sampling is achieved using the standard decimation method implemented in scipy.signal.decimate111111This method applies an anti-aliasing filter based on an order-8 Chebychev type I infinite impulse response (IIR) filter (Ellis, 2012) before decimation. from the Python package SciPy (Virtanen et al., 2020). The highest frequency available is determined by the Nyquist–Shannon sampling theorem (Nyquist, 1924), and is equal to half the sampling rate specified in a particular dataset. This is an important consideration to keep in mind when deciding which sample rate to download from GWOSC. Because the anti-aliasing filters used in resampling roll-off at the upper end of the working frequency interval, the valid frequency range is reduced to a bit less than the Nyquist frequency. So, for the 4 kHz data the maximum usable frequency is approximately 1700 Hz. Higher sample rate data will require more hard-drive space to store and longer times to download. The user can decide which dataset meets their needs.
| Run | Det. | Channel name | Frame type |
|---|---|---|---|
| O3a | H1 | H1:DCS-CALIB_STRAIN_CLEAN-SUB60HZ_C01 | H1_HOFT_CLEAN_SUB60HZ_C01 |
| O3a | L1 | L1:DCS-CALIB_STRAIN_CLEAN-SUB60HZ_C01 | L1_HOFT_CLEAN_SUB60HZ_C01 |
| O3a | V1 | V1:Hrec_hoft_16384Hz | V1Online |
| O3a(last two weeks) | V1 | V1:Hrec_hoft_V1O3ARepro1A_16384Hz | V1O3Repro1A |
| O3b | H1 | H1:DCS-CALIB_STRAIN_CLEAN-SUB60HZ_C01 | H1_HOFT_CLEAN_SUB60HZ_C01 |
| O3b | L1 | L1:DCS-CALIB_STRAIN_CLEAN-SUB60HZ_C01 | L1_HOFT_CLEAN_SUB60HZ_C01 |
| O3b | V1 | V1:Hrec_hoft_16384Hz | V1Online |
| O3GK | G1 | G1:DER_DATA_HD_CLEAN | G1_RDS_C02_L3 |
| O3GK | K1 | K1:DAC-STRAIN_C20 | K1_HOFT_C20 |
3.1 GWOSC file formats
The GWOSC open data are delivered in two different file formats: hdf and gwf. The Hierarchical Data Format hdf (Koziol & Robinson, 2018) is a portable data format readable by many programming languages. The Frame format gwf (LIGO Scientific Collaboration and Virgo Collaboration, 2009) is a specialized format used by the gravitational wave community. Data associated with GW events are also released as plain text files containing two columns with the global positioning system (GPS) time in the first column and the corresponding strain value in the second column.
For both formats the file naming follows the naming convention,
obs—FrameType—GPSstart—duration.extension
where FrameType for the main O3 data release is
ifo_GWOSC_ObservationRun_sKHZ_Rn
and
-
•
obs is the observatory, i.e. the site, so can have values L, H, V, G or K;
-
•
ifo is the interferometer and can have values H1, L1, V1, G1 or K1;
-
•
ObservationRun encodes the observing run name, so in this case is O3a, O3b, or O3GK;
-
•
s is the sampling rate in kHz with either a value 4 or 16 (4096 Hz or 16384 Hz);
-
•
n is the version number of the file (typically 1);
-
•
GPSstart is the starting time of the data contained in the file, as a 10-digit GPS value (in seconds);
-
•
duration is the duration in seconds of the file, typically either 4096 or 32 seconds;
-
•
and extension represents the file format and can be gwf or hdf.
The folders (or groups) included in the hdf files are:
-
•
meta: metadata of the file containing the following fields:
-
–
Description, e.g. “Strain data time series from LIGO”,
-
–
DescriptionURL: URL of the GWOSC website,
-
–
Detector, e.g. L1, and Observatory, e.g. L,121212The observatory refers to the site and it is indicated by one letter, like L for Livingston. The addition of a number after the letter to indicate the detector, e.g. L1, could be useful if multiple detectors are installed in the same site, as was the case for Initial LIGO (Abbott et al., 2009).
-
–
Duration, GPSstart, UTCstart: duration and starting time (using GPS and UTC standards, respectively) of the segment of data contained in a file.
-
–
StrainChannel: channel name used in the LVK archives
-
–
FrameType: frame type used in the LVK archives
-
–
-
•
strain: array of , sampled at 4 or 16 kHz depending on the file. For the times when the detector is not in science mode or the data does not meet the minimum required data quality conditions (see next section), the strain values are set to NaNs. The strain is a function of time, so it is accompanied by the attributes Xstart and Xspacing defining the starting GPS time of the data contained in the array and the corresponding distance in time between the points of the array.
-
•
quality: this folder contains two sub-folders, one for data quality and the other for injections, each including a bitmask to indicate at each second the status of the data quality or the injections and the description of each bit of the mask (see Section 3.2 for details).
The gwf files have a similar content but with a different structure. They contain 3 channels, one for the strain data, one for the data quality and one for the injections. The channel names are described in Table 2. The original files produced internally, whose channel names are listed in Table 1, contain only the strain channel, while the GWOSC files conveniently combine the strain data with the data quality and injection information in the same file.
| Channel name | |
|---|---|
| Strain | ifo:GWOSC-KHZ_R1_STRAIN |
| Data quality mask | ifo:GWOSC-KHZ_R1_DQMASK |
| Injections mask | ifo:GWOSC-KHZ_R1_INJMASK |
3.2 Data quality and injections in GWOSC files
Several types of searches are performed on the LIGO, Virgo, GEO 600, and KAGRA data. Those searches are divided into four families named after the types of signals they target: Compact binary coalescences (CBC), GW bursts (BURST), continuous waves (CW) and stochastic backgrounds (STOCH). As each type of search has a unique sensitivity to instrumental artifacts, a detailed characterization of detector noise and data quality is essential to eliminate spurious signals of terrestrial origin found by the searches. LIGO, Virgo, GEO 600 and KAGRA have dedicated teams responsible for detector characterization and data quality, as described in Davis et al. (2021); Acernese et al. (2022a); Abbott et al. (2022a), and Abe et al. (2022).
CBC analyses (Abbott et al., 2021a, b, c) seek signals from merging neutron stars and black holes by filtering the data with waveform templates. BURST analyses (Abbott et al., 2021e, f) search for generic GW transients with minimal assumptions on the source or signal morphology by identifying excess power in the time-frequency representation of the GW strain data. CW searches (Abbott et al., 2022b) look for long-duration, continuous, periodic GW signals from asymmetries of rapidly spinning neutron stars. STOCH searches (Abbott et al., 2021g, h) target the stochastic GW background signal which is formed by the superposition of and unresolved sources from various stages of the evolution of the universe.
Because of fundamental differences in the search methodologies, certain noise types are relevant to specific searches. CBC and BURST searches look for short, transient signals, with durations from less than a second to several tens of seconds. Data quality information for these searches is recorded as sets of time intervals when data are relatively free of corruption, known as segment lists. This information is provided inside the GWOSC files for the two GW transient searches CBC and BURST. The data quality information most relevant for CW and STOCH searches is in the frequency domain and it is provided as lists of instrumental lines in separate files, available for download on GWOSC131313See https://gwosc.org/O3/o3speclines for L1, H1 and V1, https://gwosc.org/O3/O3GKspeclines for K1 and https://gwosc.org/O3/O3GK_GEO_speclines for G1..
Data quality and signal injection information for a given GPS second is indicated by bitmasks with a 1-Hz sampling rate. The bit meanings are given in Tables 3 and 4 for the data quality and injections, respectively. To describe data quality, different categories are defined. For each category, the corresponding bit in the bitmask shown in Table 3 has a value of 1 (good data) if in that second of time the requirements of the category are fulfilled, otherwise 0 (bad data).
| Bit | Short name | Description |
|---|---|---|
| 0 | DATA | Data present |
| 1 | CBC_CAT1 | Pass CAT1 test |
| 2 | CBC_CAT2 | Pass CAT1 and CAT2 test for CBC searches |
| 3 | CBC_CAT3 | Pass CAT1 and CAT2 and CAT3 test for CBC searches |
| 4 | BURST_CAT1 | Pass CAT1 test |
| 5 | BURST_CAT2 | Pass CAT1 and CAT2 test for BURST searches |
| 6 | BURST_CAT3 | Pass CAT1 and CAT2 and CAT3 test for BURST searches |
| Bit | Short name | Description |
|---|---|---|
| 0 | NO_CBC_HW_INJ | No CBC injections |
| 1 | NO_BURST_HW_INJ | No burst injections |
| 2 | NO_DETCHAR_HW_INJ | No detector characterization injections |
| 3 | NO_CW_HW_INJ | No continuous wave injections |
| 4 | NO_STOCH_HW_INJ | No stochastic injections |
The meaning of each category is described in Davis et al. (2021) and Acernese et al. (2022a). Here, we provide a brief summary of each category:
- DATA
-
Failing this level indicates that strain data are not publicly available at this time because the instruments were not operating in nominal conditions. For O3, this is equivalent to failing Category 1 criteria, defined below. For intervals of bad or absent data, NaNs have been inserted in the corresponding strain data array.
- CAT1
-
(Category 1) Failing a data quality check at this category indicates a critical issue with a key detector component not operating in its nominal configuration. GWOSC data during times that fail CAT1 criteria are replaced by NaN values in the strain time series. For O3, CBC_CAT1, BURST_CAT1, and DATA lead to identical segment lists.
- CAT2
-
(Category 2) Failing a data quality check at this category indicates times when excess noise is present in a sensor with an understood physical coupling to the strain channel (LIGO Scientific Collaboration and Virgo Collaboration, 2016). The fraction of time removed by this category is less than 1% of the data, and is detailed in Table 6.
- CAT3
-
(Category 3) Failing a data quality check at this category indicates times when there is statistical coupling between a sensor/auxiliary channel and the strain channel which is not fully understood. This category was not used in O3 LVK searches, although it was used in previous observing runs (Abbott et al., 2021d).
| Data Quality Flags (Total time in seconds) | |||||||||
|---|---|---|---|---|---|---|---|---|---|
| RUN | DURATION | DETECTOR | DATA | CBC_CAT1 | CBC_CAT2 | CBC_CAT3 | BURST_CAT1 | BURST_CAT2 | BURST_CAT3 |
| H1 | 11218675 | 11218675 | 11177046 | 11177046 | 11218675 | 11125849 | 11125849 | ||
| O3a | 15811200 | L1 | 11956179 | 11956179 | 11943913 | 11943913 | 11956179 | 11879365 | 11879365 |
| V1 | 12038929 | 12038929 | 12038929 | 12038929 | 12038929 | 12038929 | 12038929 | ||
| H1 | 9967195 | 9967195 | 9964945 | 9964945 | 9967195 | 9915276 | 9915276 | ||
| O3b | 12708000 | L1 | 9810816 | 9810816 | 9782946 | 9782946 | 9810816 | 9760960 | 9760960 |
| V1 | 9591207 | 9591207 | 9591207 | 9591207 | 9591207 | 9591207 | 9591207 | ||
| O3GK | 1180800 | G1 | 940133 | 940133 | 940133 | 940133 | 940133 | 940133 | 940133 |
| K1 | 628055 | 628055 | 628055 | 628055 | 628055 | 628055 | 628055 | ||
| Detector | O3a | O3b | ||
|---|---|---|---|---|
| CBC | BURST | CBC | BURST | |
| H1 | 0.37% | 0.83% | 0.02% | 0.52% |
| L1 | 0.01% | 0.64% | 0.28% | 0.51% |
Data quality categories are cascading: a time which fails a given category automatically fails all higher categories. Since CAT3 flags were not used in O3, the CAT3 segment lists are identical to the corresponding CAT2 lists. However, the different analysis groups qualify the data independently: failing BURST_CAT2 does not necessarily imply failing CBC_CAT2. See Table 5 for the amount of time associated with each category.
Simulated signals added to the detectors for testing and calibration are referred to as hardware injections. GWOSC data releases provide a time series with each one second sample representing a bit mask vector of the state of the injection at that time. The injections are categorized according to the type of injected signal relevant to each astrophysical search. There are also injections used for detector characterization (DETCHAR). The injection bitmask marks the injection-free times. The bit corresponding to a given type of injection is defined in Table 4. A bit is set to 1 if there is no injection, otherwise it is set to 0. The full details of the complete set of hardware injections for O3 can be found at https://gwosc.org/O3/o3_inj.
A CBC signal was injected on one occasion in each of the LIGO detectors during O3a, but not in coincidence. The (CBC) injection for H1 took place between GPS 1251662270 (2019-09-04T19:57:32 UTC) and GPS 1251662279 (2019-09-04T19:57:41 UTC), which was during observing mode. The CBC injection for L1 did not take place during observing mode and is thus not present in the released data. No CBC injections were performed during O3b.
No injections of BURST signals were performed during O3a and O3b.
Some signal injections of the DETCHAR type were injected during O3a and O3b for both H1 and L1, while there were none for Virgo. The waveform model used for those injections is , where is the time of the injection. The signal parameters , and were randomly chosen and are documented in separate databases for H1141414See https://gwosc.org/static/injections/o3a/H1_detchar_inj.txt for O3a and https://gwosc.org/static/injections/O3b/inj_o3b_H1.txt for O3b. and for L1151515See https://gwosc.org/static/injections/o3a/L1_detchar_inj.txt for O3a and https://gwosc.org/static/injections/O3b/inj_o3b_L1.txt for O3b..
Four STOCH signals were injected during O3. These hardware injections consisted of a simulated stochastic gravitational-wave background of 13 minutes long duration and were generated using the NAP package (Acernese et al., 2005) and rescaled to have an amplitude of with the default Hubble constant value . Two of these injections were added only in H1 starting at GPS 1249200018 (2019-08-07T08:00:00 UTC) and GPS 1258273818 (2019-11-20T08:30:00). The other two injections were performed coherently at L1 and H1 during O3b starting at GPS 1258345818 (2019-11-21T04:30:00) and GPS 1258353018 (2019-11-21T06:30:00). The detectors were in observing mode for all of these stochastic injections.
CW injections were performed in H1 and L1 during both O3a and O3b, using a set of pulsar parameters provided on the GWOSC website161616https://gwosc.org/O3/O3April1_injection_parameters. Those injections are always present except during defined intervals for O3a171717https://gwosc.org/timeline/show/O3a_16KHZ_R1/H1_NO_CW_HW_INJ*H1_DATA*L1_NO_CW_HW_INJ*L1_DATA/1238166018/15811200 and O3b181818https://gwosc.org/timeline/show/O3b_16KHZ_R1/H1_NO_CW_HW_INJ*H1_DATA*L1_NO_CW_HW_INJ*L1_DATA/1256655618/12708000. No CW injections were performed in V1 during O3a, but there were CW injections in V1 during O3b between GPS 1263945616 (2020-01-24 23:59:58 UTC) and GPS 1266019220 (2020-02-18 00:00:02 UTC). The injected signal was removed a posteriori in the strain data as described in Acernese et al. (2022b). A residual signal after removal may still be present with an amplitude between 20 and 100 times lower than that of the injection. The residual amplitude is smaller than or at most the same order as the calibration uncertainty.
No signal hardware injections of any type were performed during O3GK.
3.3 Alternate versions of the strain data
| Channel name | Description |
|---|---|
| ifo:DCS-CALIB_STRAIN_C01_AR | LIGO calibrated strain, offline calibration |
| ifo:DCS-CALIB_STRAIN_CLEAN_C01_AR | LIGO calibrated strain, after applying linear noise subtraction |
| ifo:DCS-CALIB_STRAIN_CLEAN_SUB60HZ_C01_AR | LIGO calibrated strain, after applying both linear and non-linear noise subtraction. This is the recommended channel (main release) |
| V1:Hrec_hoft_16384Hz_AR | Virgo calibrated strain for most of O3a and O3b (main release) |
| V1:Hrec_hoft_V1O3ARepro1A_16384Hz_AR | Virgo calibrated strain for the last two weeks of Sep 2019, near the end of O3a with an enhanced noise subtraction (main release) |
In addition to the main strain data release described above, the O3 data release includes several alternate strain channels, as described
at https://gwosc.org/O3/O3alt. This alternate data release is available
via both CernVM-FS or streaming via a network data server (NDS2) (Zweizig et al., 2021).
The alternate strain channels reflect different choices for how aggressively to apply noise subtraction strategies to remove different
sources of contamination. Some LVK analyses used different versions of the strain
channels. The alternate strain channel release was designed to reflect the internal formatting
used by the LVK as much as possible. In particular, the release uses only the GWF
file format, does not include any NaN values, and does not include any data quality
information. The channels found in the alternate calibration release are described in Table 7.
4 Online event catalogs
Ninety-three GW transient events or notable candidates were discovered based on the LVK’s analyses of the O3 data (Abbott et al., 2021a, b, c). Data associated with these signals are available online through the GWOSC Event Portal191919https://gwosc.org/eventapi, along with other scientific products. For all events in the Event Portal, snippets of strain data are released in the form of a segment of 4096 seconds around the time of the event. The data snippets are made available no later than when the event discovery becomes public in a refereed, scientific journal. In addition, the Event Portal includes a concise summary of the source properties (i.e., parameters of the compact star binaries associated with each of the detected signals), links to a number of science products (posterior samples), links to any associated low-latency alerts, and a documentation page for each release containing publication information. The list of O3 event data releases is as follows:
- O3_Discovery_Papers
- O3_IMBH_marginal
-
Marginal candidates associated with the search for Intermediate Mass Black Hole (IMBH) binary mergers
- GWTC-2
-
Confident events from the O3a observation run (first search)
- GWTC-2.1-confident
-
Confident events from the O3a observation run (updated search)
- GWTC-2.1-marginal
-
Marginal candidates from the O3a observation run (updated search)
- GWTC-2.1-auxiliary
-
Candidates from GWTC-2 which, based on the updated analysis presented in the GWTC-2.1 catalog paper, do not satisfy the criteria for inclusion in the GWTC-2.1-confident or GWTC-2.1-marginal releases
- GWTC-3-confident
-
Confident events from the O3b observing run
- GWTC-3-marginal
-
Marginal candidates from the O3b observing run
Some events are listed in the database with multiple versions, typically corresponding to the event’s inclusion in multiple releases. The cumulative GWTC catalog includes all confident GW events published by the LVK collaboration, and currently includes 93 events. Events in the GWTC-2.1-confident and GWTC-3-confident releases all have a probability of astrophysical origin greater than 0.5 202020See Abbott et al. (2021c), App. D. 7 for a definition and details about its estimation. in at least one of the search pipelines, and are included in the cumulative GWTC.
The online catalogs are searchable via a web user interface. The Event Portal database can be queried based on specific source properties, namely the primary mass, secondary mass, total mass, chirp mass, final mass (of the merger remnant), luminosity distance, redshift, effective inspiral spin, or other properties associated with the observed signal, such as UTC or GPS event time, detector frame chirp mass, network SNR, false alarm rate and the posterior probability of astrophysical origin. The events can also be selected by identification such as partial event name, release catalog or group of catalogs. The output format can be one of the following: HTML, JSON, CSV or plain ASCII text.
To ease the analysis of multiple events, the catalogs can be queried programmatically with scripts using the REST API that returns all catalog lists in a JSON format. Catalogs can be queried with a GET request. As an example, to request all merger events for which the primary mass is less than , the URL for the GET request would be https://gwosc.org/eventapi/html/query/show?max-mass-1-source=3. A detailed explanation of the query API nodes can be found on the GWOSC website212121https://gwosc.org/apidocs.
4.1 Parameter estimation
For each detected source the Event Portal displays the 90% credible intervals for a selection of parameters that reflect the values given in the relevant publication. Those credible intervals are computed from the posterior samples resulting from Bayesian inference algorithms applied to the data.
In addition to the information provided by GWOSC, the posterior samples are distributed through the Zenodo open repository (LIGO Scientific Collaboration, Virgo Collaboration and KAGRA Collaboration, 2021; LIGO Scientific Collaboration and Virgo Collaboration, 2021c).
They are provided from the single event web page and through the JSON API as downloadable links to the files on Zenodo. The parameter names follow a standard nomenclature222222See https://lscsoft.docs.ligo.org/pesummary/unstable_docs/gw/parameters.html. (Hoy & Raymond, 2021). Parameter estimates may change with different version of the event or catalog release. The parameter sets are denoted by a set of version numbers for each event (depending on the number of releases in which that event appears).
4.2 Low-latency alerts
During O3, public alerts were communicated with low latency to report the occurence of a notable trigger detected in the data232323See https://emfollow.docs.ligo.org/userguide for more details. This userguide is a living document that is being updated in preparation for the upcoming science run O4. Therefore, the informations in this guide may not be necessarily relevant for O3 data.. The alerts are sent with a latency of few minutes after detection. They include a number of preliminary parameter estimations that are useful for the localization of the source through a probability skymap. This information can be used by other, non-GW, instruments to search for potential electromagnetic counterparts in follow-up observations. The complete list of alerts sent during O3 can be found publicly in the GraceDB website242424https://gracedb.ligo.org/superevents/public/O3 and, as described below, in GWOSC.
The Event Portal references the GraceDB entry for the original trigger alert of the event. Links to GraceDB entries are available through the GWOSC web interface and the JSON API. Events first detected offline do not trigger low-latency alerts and thus lack a GraceDB entry.
5 Technical Validation
The O3 GWOSC data release is reprocessed for the broader user community beginning with the internal strain data products used for data analysis by the LIGO, Virgo, and KAGRA Collaborations for publication purposes. The reprocessing produces new GWOSC gwf and hdf5 files containing the previously discussed strain, data quality and hardware injection information for each detector. In addition, versions of these GWOSC files at a reduced sampling rate of 4096 Hz for the strain channel of each detector are also produced. All data for the release are carefully reviewed by the internal GWOSC team and then reviewed by an independent review team made up of members from the LIGO, Virgo, and KAGRA Collaborations. This review process checks that:
-
•
the strain vectors at the maximum sample rate (16 kHz) in the GWOSC hdf and gwf files are identical to machine precision to the corresponding strain vectors of the LVK main archives;
-
•
the strain vectors after resampling at 4 kHz do not have numerical artifacts that may arise from the resampling technique;
-
•
the data quality and injection information located in either the GWOSC hdf and gwf files or the online Timeline tool described in detail in Section 6, agree with all available records.
-
•
the documentation associated with the O3 data products found online is correct and contains comprehensive information for the broader user community.
The data files and accompanying documentation are released to the public on the GWOSC website once all checks have passed at the designated date and time agreed to by the LIGO, Virgo and KAGRA Collaborations.
6 Usage notes
6.1 Salient features of GW data
Working with GW data requires an awareness of the presence of noise in the data. An overview of LIGO/Virgo detector noise and some applicable signal processing methods are described in Abbott et al. (2020c); see also above in Sec. 3.2 and 2.3 for a brief introduction to various classes of detector noise. In addition, as mentioned previously, the data are only valid within a fixed frequency range due to the limits of calibration (Sec. 2.2) as well as due to artifacts from the down-sampling process (Sec. 3). All of these complications need to be considered when searching for astrophysical signals.
6.2 List of observing segments
Segment lists describe times when GW detectors are collecting data
and are operating in a normal condition, as described in Section 3.2.
The GWOSC website provides an online app called Timeline to discover,
plot, and download segment lists252525See https://gwosc.org/timeline.. The Timeline query page allows users to select
observing runs from a drop-down menu, and then view the names of segment lists associated
with the selected run. Segment lists may be downloaded as ASCII text files or
in a JSON format. Alternatively, segment lists may be displayed in an interactive
plot, as seen in Fig. 3. To explore times within a run,
a visitor can use the mouse to scroll and zoom on the Timeline plots. Hovering the mouse
over a segment displays a tool-tip with the exact start and stop time, in both GPS and
UTC time.

6.3 Software and Support
The GWOSC website provides a number of resources for helping investigators learn to work with GW data, including:
-
•
Software libraries262626https://gwosc.org/software: A number of software packages developed for GW analysis are open source. The GWOSC website provides a suggested list of packages, many of which were created by members of the LIGO, Virgo, and KAGRA collaborations. Links to source code and documentation are provided for each package.
-
•
Tutorials272727https://gwosc.org/tutorials: GWOSC provides tutorials to demonstrate the basics of GW data analysis. Most tutorials are in
Python, and provided in notebooks that can be run in the cloud to avoid the necessity for the user to install software. -
•
Workshops and online course282828https://gwosc.org/workshops: Annual Open Data Workshops provide a complete course in working with GW data, including lectures, software tutorials, and challenge problems. Materials from past workshops are available as a free online course; students can enroll at any time. Future workshops will be posted on the GWOSC website, and are open to any interested participants.
-
•
Discussion forum292929https://ask.igwn.org: A public discussion forum for GW topics provides space to ask for help with GW data analysis, discuss LVK papers, post questions about GW science, and connect with other researchers in the field.
7 Summary
The O3 data set described in this paper represents the most sensitive gravitational-wave observations to date. The data contain over 80 compact object merger signals, as described in a number of catalog releases, including GWTC-2 (Abbott et al., 2021a), GWTC-2.1 (Abbott et al., 2021b) and GWTC-3 (Abbott et al., 2021c). O3 includes three main phases: O3a, O3b, and O3GK. O3a and O3b are both joint runs of LIGO and Virgo, while the O3GK run involved KAGRA and GEO 600. Data and documentation for all O3 data are available from the GWOSC website.
Looking ahead, LIGO, Virgo, and KAGRA are planning an O4 run, scheduled to begin in 2023, with improved sensitivity. Data from events discovered in O4 will be released as the events are published, and release of the next large strain data sets are planned for 2025 (LIGO Laboratory, 2022b). This will be followed by the O5 observing run, anticipated to be the first extended observing run with a span of over two years (LIGO Scientific Collaboration, Virgo Collaboration and KAGRA Collaboration, 2022b). Planned instrument upgrades should increase the sensitivity of the network and thus extend the volume of space over which signals may be observed, so that future data sets will include more frequent detections and a corresponding expanded depth of science in this rapidly evolving field.
Acknowledgements
Calibration of the LIGO strain data was performed with GstLAL-based calibration software pipeline (Viets et al., 2018). Calibration of the Virgo strain data was performed with C-based software (Acernese et al., 2022b). Data-quality products and event-validation results were computed using the DMT (John Zweizig, 2006), DQR (LIGO Scientific Collaboration and Virgo Collaboration, 2018), DQSEGDB (Fisher et al., 2021), gwdetchar (Urban et al., 2021), hveto (Smith et al., 2011), iDQ (Essick et al., 2020) and Omicron (Robinet et al., 2020) software packages and contributing software tools. Analyses relied upon the LALSuite software library (LIGO Scientific Collaboration, 2018). PESummary was used to post-process and collate parameter-estimation results (Hoy & Raymond, 2021). For an exhaustive list of the softwares used for searching the GW signals and characterizing their source, see (Abbott et al., 2021c). Plots were prepared with Matplotlib (Hunter, 2007), seaborn (Waskom, 2021) GWSumm (Macleod et al., 2021a) and GWpy (Macleod et al., 2021b). NumPy (Harris et al., 2020) and SciPy (Virtanen et al., 2020) were used in the preparation of the manuscript.
This material is based upon work supported by NSF’s LIGO Laboratory which is a major facility fully funded by the National Science Foundation. The authors also gratefully acknowledge the support of the Science and Technology Facilities Council (STFC) of the United Kingdom, the Max-Planck-Society (MPS), and the State of Niedersachsen/Germany for support of the construction of Advanced LIGO and construction and operation of the GEO 600 detector. Additional support for Advanced LIGO was provided by the Australian Research Council. The authors gratefully acknowledge the Italian Istituto Nazionale di Fisica Nucleare (INFN), the French Centre National de la Recherche Scientifique (CNRS) and the Netherlands Organization for Scientific Research (NWO), for the construction and operation of the Virgo detector and the creation and support of the EGO consortium. The authors also gratefully acknowledge research support from these agencies as well as by the Council of Scientific and Industrial Research of India, the Department of Science and Technology, India, the Science & Engineering Research Board (SERB), India, the Ministry of Human Resource Development, India, the Spanish Agencia Estatal de Investigación (AEI), the Spanish Ministerio de Ciencia e Innovación and Ministerio de Universidades, the Conselleria de Fons Europeus, Universitat i Cultura and the Direcció General de Política Universitaria i Recerca del Govern de les Illes Balears, the Conselleria d’Innovació, Universitats, Ciència i Societat Digital de la Generalitat Valenciana and the CERCA Programme Generalitat de Catalunya, Spain, the National Science Centre of Poland and the European Union – European Regional Development Fund; Foundation for Polish Science (FNP), the Swiss National Science Foundation (SNSF), the Russian Foundation for Basic Research, the Russian Science Foundation, the European Commission, the European Social Funds (ESF), the European Regional Development Funds (ERDF), the Royal Society, the Scottish Funding Council, the Scottish Universities Physics Alliance, the Hungarian Scientific Research Fund (OTKA), the French Lyon Institute of Origins (LIO), the Belgian Fonds de la Recherche Scientifique (FRS-FNRS), Actions de Recherche Concertées (ARC) and Fonds Wetenschappelijk Onderzoek – Vlaanderen (FWO), Belgium, the Paris Île-de-France Region, the National Research, Development and Innovation Office Hungary (NKFIH), the National Research Foundation of Korea, the Natural Science and Engineering Research Council Canada, Canadian Foundation for Innovation (CFI), the Brazilian Ministry of Science, Technology, and Innovations, the International Center for Theoretical Physics South American Institute for Fundamental Research (ICTP-SAIFR), the Research Grants Council of Hong Kong, the National Natural Science Foundation of China (NSFC), the Leverhulme Trust, the Research Corporation, the Ministry of Science and Technology (MOST), Taiwan, the United States Department of Energy, and the Kavli Foundation. The authors gratefully acknowledge the support of the NSF, STFC, INFN and CNRS for provision of computational resources.
This work was supported by MEXT, JSPS Leading-edge Research Infrastructure Program, JSPS Grant-in-Aid for Specially Promoted Research 26000005, JSPS Grant-inAid for Scientific Research on Innovative Areas 2905: JP17H06358, JP17H06361 and JP17H06364, JSPS Core-to-Core Program A. Advanced Research Networks, JSPS Grantin-Aid for Scientific Research (S) 17H06133 and 20H05639 , JSPS Grant-in-Aid for Transformative Research Areas (A) 20A203: JP20H05854, the joint research program of the Institute for Cosmic Ray Research, University of Tokyo, National Research Foundation (NRF), Computing Infrastructure Project of Global Science experimental Data hub Center (GSDC) at KISTI, Korea Astronomy and Space Science Institute (KASI), and Ministry of Science and ICT (MSIT) in Korea, Academia Sinica (AS), AS Grid Center (ASGC) and the National Science and Technology Council (NSTC) in Taiwan under grants including the Rising Star Program and Science Vanguard Research Program, Advanced Technology Center (ATC) of NAOJ, and Mechanical Engineering Center of KEK.
References
- Aasi et al. (2015) Aasi, J., et al. 2015, Class. Quantum Grav., 32, 074001, doi: 10.1088/0264-9381/32/7/074001
- Abadie et al. (2011) Abadie, J., et al. 2011, Nature Phys., 7, 962, doi: 10.1038/nphys2083
- Abbott et al. (2009) Abbott, B. P., et al. 2009, Reports on Progress in Physics, 72, 076901, doi: 10.1088/0034-4885/72/7/076901
- Abbott et al. (2016) —. 2016, Phys. Rev. Lett., 116, 061102
- Abbott et al. (2020a) —. 2020a, Living Rev. Rel., 23, doi: 10.1007/s41114-020-00026-9
- Abbott et al. (2020b) —. 2020b, ApJ Lett., 892, L3, doi: 10.3847/2041-8213/ab75f5
- Abbott et al. (2020c) —. 2020c, Class. Quantum Grav., 37, 055002, doi: 10.1088/1361-6382/ab685e
- Abbott et al. (2021a) —. 2021a, Phys. Rev. X, 11, 021053, doi: 10.1103/PhysRevX.11.021053
- Abbott et al. (2021b) —. 2021b. https://arxiv.org/abs/2108.01045
- Abbott et al. (2021c) —. 2021c, GWTC-3: Compact Binary Coalescences Observed by LIGO and Virgo During the Second Part of the Third Observing Run. https://arxiv.org/abs/2111.03606
- Abbott et al. (2021d) —. 2021d, SoftwareX, 13, 100658, doi: https://doi.org/10.1016/j.softx.2021.100658
- Abbott et al. (2022a) —. 2022a, Progress of Theoretical and Experimental Physics, 2022, 063F01, doi: 10.1093/ptep/ptac073
- Abbott et al. (2020d) Abbott, R., et al. 2020d, Phys. Rev. D, 102, 043015, doi: 10.1103/PhysRevD.102.043015
- Abbott et al. (2020e) —. 2020e, Phys. Rev. Lett., 125, 101102, doi: 10.1103/PhysRevLett.125.101102
- Abbott et al. (2020f) —. 2020f, ApJ Lett., 896, L44, doi: 10.3847/2041-8213/ab960f
- Abbott et al. (2021e) —. 2021e, Phys. Rev. D, 104, 122004, doi: 10.1103/PhysRevD.104.122004
- Abbott et al. (2021f) —. 2021f, Phys. Rev. D, 104, 102001, doi: 10.1103/PhysRevD.104.102001
- Abbott et al. (2021g) —. 2021g, Phys. Rev. D, 104, 022004, doi: 10.1103/PhysRevD.104.022004
- Abbott et al. (2021h) —. 2021h, Phys. Rev. D, 104, 022005, doi: 10.1103/PhysRevD.104.022005
- Abbott et al. (2021i) —. 2021i, ApJ Lett., 915, L5, doi: 10.3847/2041-8213/ac082e
- Abbott et al. (2022b) —. 2022b, Phys. Rev. D, 106, 102008, doi: 10.1103/PhysRevD.106.102008
- Abe et al. (2022) Abe, H., et al. 2022, Progress of Theoretical and Experimental Physics, ptac093, doi: 10.1093/ptep/ptac093
- Acernese et al. (2005) Acernese, F., et al. 2005, Class. Quantum Grav., 22, doi: 10.1088/0264-9381/22/18/S18
- Acernese et al. (2015) —. 2015, Class. Quantum Grav., 32, 024001, doi: 10.1088/0264-9381/32/2/024001
- Acernese et al. (2019) —. 2019, Phys. Rev. Lett., 123, 231108, doi: 10.1103/PhysRevLett.123.231108
- Acernese et al. (2022a) —. 2022a. https://arxiv.org/abs/2205.01555
- Acernese et al. (2022b) —. 2022b, Class. Quantum Grav., 39, 045006, doi: 10.1088/1361-6382/ac3c8e
- Akutsu et al. (2016) Akutsu, T., et al. 2016, Opt. Mater. Express, 6, 1613, doi: 10.1364/OME.6.001613
- Akutsu et al. (2018) —. 2018, Progress of Theoretical and Experimental Physics, 2018, 013F01, doi: 10.1093/ptep/ptx180
- Akutsu et al. (2021) —. 2021, Progress of Theoretical and Experimental Physics, 2021, 05A101, doi: 10.1093/ptep/ptaa125
- Barsotti et al. (2019) Barsotti, L., Harms, J., & Schnabel, R. 2019, Rep. Prog. Phys., 82, 016905, doi: 10.1088/1361-6633/aab906
- Biwer et al. (2017) Biwer, C., et al. 2017, Phys. Rev. D, 95, 062002, doi: 10.1103/PhysRevD.95.062002
- Buikema et al. (2020) Buikema, A., et al. 2020, Phys. Rev. D, 102, 062003, doi: 10.1103/PhysRevD.102.062003
- Chen et al. (2014) Chen, D., Naticchioni, L., Khalaidovski, A., et al. 2014, Class. Quantum Grav., 31, 224001, doi: 10.1088/0264-9381/31/22/224001
- Chen et al. (2021) Chen, H.-Y., et al. 2021, Class. Quantum Grav., 38, 055010, doi: 10.1088/1361-6382/abd594
- Davis et al. (2019) Davis, D., et al. 2019, Class. Quantum Grav., 36, 055011, doi: 10.1088/1361-6382/ab01c5
- Davis et al. (2021) —. 2021, Class. Quantum Grav., 38, 135014, doi: 10.1088/1361-6382/abfd85
- Dooley et al. (2016) Dooley, K. L., et al. 2016, Class. Quantum Grav., 33, 075009, doi: 10.1088/0264-9381/33/7/075009
- Ellis (2012) Ellis, G. 2012, Control System Design Guide (Fourth Edition) (Butterworth-Heinemann), doi: 10.1016/C2010-0-65994-3
- Essick et al. (2020) Essick, R., Godwin, P., Hanna, C., Blackburn, L., & Katsavounidis, E. 2020, Mach. Learn.: Sci. Technol., 2, 015004, doi: 10.1088/2632-2153/abab5f
- Estevez et al. (2019) Estevez, D., Mours, B., Rolland, L., & Verkindt, D. 2019. https://tds.virgo-gw.eu/ql/?c=14486
- Finn & Chernoff (1993) Finn, L. S., & Chernoff, D. F. 1993, Phys. Rev. D, 47, 2198, doi: 10.1103/PhysRevD.47.2198
- Fisher et al. (2021) Fisher, R. P., Hemming, G., Bizouard, M.-A., et al. 2021, SoftwareX, 14, 100677, doi: 10.1016/j.softx.2021.100677
- Harris et al. (2020) Harris, C. R., et al. 2020, Nature, 585, 357, doi: 10.1038/s41586-020-2649-2
- Hoy & Raymond (2021) Hoy, C., & Raymond, V. 2021, SoftwareX, 15, 100765, doi: 10.1016/j.softx.2021.100765
- Hunter (2007) Hunter, J. D. 2007, Comput. Sci. Eng., 9, 90, doi: 10.1109/MCSE.2007.55
- John Zweizig (2006) John Zweizig. 2006, The Data Monitor Tool Project, labcit.ligo.caltech.edu/~jzweizig/DMT-Project.html
- Koziol & Robinson (2018) Koziol, Q., & Robinson, D. 2018, HDF5. https://doi.org/10.11578/dc.20180330.1
- LIGO Laboratory (2022a) LIGO Laboratory. 2022a. https://dcc.ligo.org/LIGO-M1000066/public
- LIGO Laboratory (2022b) —. 2022b, doi: 10.7935/38s2-7g84
- LIGO Scientific Collaboration (2018) LIGO Scientific Collaboration. 2018, LIGO Algorithm Library, doi: 10.7935/GT1W-FZ16
- LIGO Scientific Collaboration & Virgo Collaboration (2021) LIGO Scientific Collaboration, & Virgo Collaboration. 2021, LIGO and Virgo Calibration Uncertainty (O1, O2 and O3), v3. https://dcc.ligo.org/T2100313/public
- LIGO Scientific Collaboration and Virgo Collaboration (2009) LIGO Scientific Collaboration and Virgo Collaboration. 2009, Specification of a Common Data Frame Format for Interferometric Gravitational Wave Detectors, Tech. Rep. VIR-067A-08. https://dcc.ligo.org/LIGO-T970130/public
- LIGO Scientific Collaboration and Virgo Collaboration (2016) —. 2016, Data quality vetoes applied to the analysis of GW150914. https://dcc.ligo.org/LIGO-T1600011/public
- LIGO Scientific Collaboration and Virgo Collaboration (2018) —. 2018, Data quality report user documentation, docs.ligo.org/detchar/data-quality-report/
- LIGO Scientific Collaboration and Virgo Collaboration (2019) —. 2019. https://dcc.ligo.org/LIGO-M060038/public
- LIGO Scientific Collaboration and Virgo Collaboration (2021a) —. 2021a, doi: 10.7935/nfnt-hm34
- LIGO Scientific Collaboration and Virgo Collaboration (2021b) —. 2021b, doi: 10.7935/pr1e-j706
- LIGO Scientific Collaboration and Virgo Collaboration (2021c) —. 2021c, GWTC-2.1: Deep Extended Catalog of Compact Binary Coalescences Observed by LIGO and Virgo During the First Half of the Third Observing Run - Candidate Data Release, v3, Zenodo, doi: 10.5281/zenodo.5759108
- LIGO Scientific Collaboration, Virgo Collaboration and KAGRA Collaboration (2021) LIGO Scientific Collaboration, Virgo Collaboration and KAGRA Collaboration. 2021, GWTC-3: Compact Binary Coalescences Observed by LIGO and Virgo During the Second Part of the Third Observing Run — Candidate data release, Zenodo, doi: 10.5281/zenodo.5546665
- LIGO Scientific Collaboration, Virgo Collaboration and KAGRA Collaboration (2022a) —. 2022a, doi: 10.7935/38s2-7g84
- LIGO Scientific Collaboration, Virgo Collaboration and KAGRA Collaboration (2022b) —. 2022b. https://observing.docs.ligo.org/plan
- Lough et al. (2021) Lough, J., et al. 2021, Phys. Rev. Lett., 126, 041102, doi: 10.1103/PhysRevLett.126.041102
- Macleod et al. (2021a) Macleod, D., et al. 2021a, gwpy/gwsumm, Zenodo, doi: 10.5281/zenodo.4975045
- Macleod et al. (2021b) —. 2021b, gwpy/gwpy, Zenodo, doi: 10.5281/zenodo.597016
- Mukund et al. (2020) Mukund, N., Lough, J., Affeldt, C., et al. 2020, Phys. Rev. D, 101, 102006, doi: 10.1103/PhysRevD.101.102006
- Nyquist (1924) Nyquist, H. 1924, Bell System Technical Journal, 3, 324, doi: 10.1002/j.1538-7305.1924.tb01361.x
- Robinet et al. (2020) Robinet, F., Arnaud, N., Leroy, N., et al. 2020, SoftwareX, 12, 100620, doi: 10.1016/j.softx.2020.100620
- Rolland et al. (2019) Rolland, L., Seglar-Arroyo, M., & Verkindt, D. 2019. https://tds.virgo-gw.eu/ql/?c=15041
- Schnabel et al. (2010) Schnabel, R., Mavalvala, N., Mc Clelland, D. E., & Lam, P. K. 2010, Nat. Commun., 1, 121, doi: 10.1038/ncomms1122
- Smith et al. (2011) Smith, J. R., Abbott, T., Hirose, E., et al. 2011, Class. Quant. Grav., 28, 235005, doi: 10.1088/0264-9381/28/23/235005
- Sun et al. (2020) Sun, L., et al. 2020, Class. Quantum Grav., 37, 225008, doi: 10.1088/1361-6382/abb14e
- Sun et al. (2021) —. 2021. https://arxiv.org/abs/2107.00129
- Tse et al. (2019) Tse, M., et al. 2019, Phys. Rev. Lett., 123, 231107, doi: 10.1103/PhysRevLett.123.231107
- Urban et al. (2021) Urban, A., et al. 2021, gwdetchar/gwdetchar, Zenodo, doi: 10.5281/zenodo.597016
- Vajente et al. (2020a) Vajente, G., et al. 2020a, Phys. Rev. D, 101, 042003, doi: 10.1103/PhysRevD.101.042003
- Vajente et al. (2020b) —. 2020b, Phys. Rev. D, 101, 042003, doi: 10.1103/PhysRevD.101.042003
- Viets et al. (2018) Viets, A., et al. 2018, Class. Quant. Grav., 35, 095015, doi: 10.1088/1361-6382/aab658
- Virtanen et al. (2020) Virtanen, P., et al. 2020, Nature Meth., 17, 261, doi: 10.1038/s41592-019-0686-2
- Waskom (2021) Waskom, M. 2021, J. Open Source Softw., 6, doi: 10.21105/joss.03021
- Weisberg & Huang (2016) Weisberg, J. M., & Huang, Y. 2016, ApJ, 829, 55, doi: 10.3847/0004-637X/829/1/55
- Weitzel et al. (2017) Weitzel, D., Bockelman, B., Brown, D. A., et al. 2017, in Proceedings of the Practice and Experience in Advanced Research Computing 2017 on Sustainability, Success and Impact No. 24, doi: 10.48550/arXiv.1705.06202
- Zweizig et al. (2021) Zweizig, Z., Maros, E., Hanks, J., & Areeda, J. 2021. https://wiki.ligo.org/Computing/NDSClient/