Broadband X-ray properties of black holes GRS 1758258 and 1E 1740.72942: AstroSat and NuSTAR results
Abstract
We present the results on broadband X-ray properties of persistent black hole binaries GRS 1758258 and 1E 1740.72942 using AstroSat, NuSTAR and Swift-XRT observations carried out during 20162022. We perform spectral modeling of both sources after eliminating the contamination in their LAXPC spectra from nearby X-ray sources. Preliminary spectral modelling using Comptonization and line emission ( 6.4 keV) models suggest that GRS 1758258 occupies both dim-soft state ( keV, , of Eddington luminosity LEdd) and hard state (, =445 keV, =15% LEdd) that requires a multi-colour disc blackbody model ( keV) occasionally. 1E 1740.72942 instead is found only in hard state (=1.672.32, =516 keV, =12% LEdd). Reflection properties of both sources are studied by applying relativistic reflection model RELXILL to the broadband spectra. Our results from AstroSat and NuSTAR consistently unveiled the presence of a Comptonizing region along with an ionized reflection region (ionization parameter =2.73.8 and 2.74.7 erg cm s-1 in GRS 1758258 and 1E 1740.72942 respectively) in both sources. Reflection modeling revealed GRS 1758258 to have a high metal abundance ( times solar metal abundance) and inclination angle () of . In case of 1E 1740.72942, is constrained to be . Finally, we discuss the implication of our findings in the context of accretion dynamics by comparing our results with the previous studies.
keywords:
accretion, accretion disks – black hole physics – X-rays: binaries – radiation: dynamics – stars : black holes – stars: individual: GRS 1758258 – stars: individual: 1E 1740.729421 Introduction
Stellar mass Black Holes (BHs) in our Galaxy are found to be in binary systems. They accrete matter from the companion and forms an accretion disc, which radiates X-rays. Such systems are known as X-ray binaries (XRBs), which are broadly classified either as Low Mass X-ray binaries (LMXBs) or as High Mass X-ray binaries (HMXBs) depending on the mass of the companion (Tanaka & Lewin, 1995; Tetarenko et al., 2016a; Jonker et al., 2021). Some of these XRBs exhibit continuous X-ray emission and hence can be classified as persistent binaries, while others undergo sudden outbursts lasting for months (Chen et al. 1997; Sreehari et al. 2019; Baby et al. 2020 and references therein) and they are classified as transient sources. A few sources exhibit repeated transient behavior without periodicity and may not return to quiescent level for long periods of time (Remillard & McClintock, 2006; Tetarenko et al., 2016b). Some transient LMXBs are observed to show consistent brightness following their outburst for decades and also exhibit aperiodic variability in their light curves (Castro-Tirado et al., 1994; Sreehari et al., 2019, 2020; Kushwaha et al., 2021; Athulya et al., 2022). A catalog of all these sources and their salient characteristics are discussed by Corral-Santana et al. (2016); Tetarenko et al. (2016b).
The black hole binaries exhibit different spectral and temporal variabilities by occupying low/hard, intermediate, or high/soft spectral states (Homan et al., 2001; Homan & Belloni, 2005; Remillard & McClintock, 2006; Nandi et al., 2012; Radhika & Nandi, 2014; Nandi et al., 2018; Sreehari et al., 2019; Sreehari & Nandi, 2021). The softer region of the energy spectrum is generally characterized by a multi-colored black body emission from the standard thin accretion disc (Shakura & Sunyaev, 1973), while the high energy part is formed from the Comptonization of soft photons from a hot corona that exists around the BH (Sunyaev & Titarchuk 1980; Chakrabarti & Titarchuk 1995; Iyer et al. 2015 and references therein). The spectrum often shows additional re-emission features formed by the radiation reflected off the disc. Such reflection signature is found in the form of Fe-emission line at keV (Fabian et al., 1989) and Compton hump keV (Fabian, 2016) in the energy spectrum. Persistent sources occupy either a low/hard or high/soft state for long periods of time. These sources are usually HMXBs that accrete by means of stellar wind (King & Lynden Bell, 1995; Tetarenko et al., 2016b) or very rarely by Roche-lobe overflow (Orosz et al., 2014). They also exhibit variability in their light curves. The power density spectra (PDS) obtained for such systems generally has low frequency breaks (Belloni & Hasinger, 1990) and Quasi-periodic Oscillation (QPO) features (Van der Klis, 1989). These BHs are observed to show spectral state changes on timescales of weeks to months (e.g.: Cyg X-1; Gierliński et al. 1999; Zdziarski et al. 2002a; Kushwaha et al. 2021) as well as seconds to minutes (e.g.: GRS 1915+105; Belloni et al. 2000; Rao et al. 2000; Athulya et al. 2022; Majumder et al. 2022). LMC X1 is a persistent source that has been observed to remain steadily in soft state (Ebisawa et al., 1989; Schmidtke et al., 1999; Bhuvana et al., 2021; Bhuvana et al., 2022), while state transitions have been reported in LMC X-3 (Boyd et al. 2000; Wilms et al. 2001; Bhuvana et al. 2022). Some of these persistent sources have bright lobes in relativistic jets that emit in radio and such sources are termed as ‘microquasars’ (Mirabel & Rodríguez, 1994; Heindl et al., 1994).
The black hole binary GRS 1758258 is one of the brightest persistent X-ray sources, which was discovered by GRANAT in 1990 (Sunyaev et al., 1991). It was recognized as a microquasar based on the detection of its radio counterpart (Rodriguez et al., 1992; Martí et al., 2017). Distance to this source is estimated to be kpc by considering Jet-ISM interaction (Tetarenko et al., 2020). In contrast to a typical persistent source, GRS 1758258 is a LMXB that accretes matter via Roche lobe overflow from its companion star (Luque-Escamilla et al., 2014). Based on the long term observations performed by RXTE, the hydrogen column density () along the source line of sight is found to be 1022 atoms cm-2 (Mereghetti et al., 1997). Such a high Galactic absorbs optical and infrared radiation from the system, because of which there has been no dynamical estimate of the BH mass yet. However, the luminosity-mass relation suggests that the system harbors a BH with mass M⊙ (Keck et al., 2001). GRS 1758258 is mostly found in the hard state with the occasional transition into intermediate and dim-soft states (Goldwurm et al., 2001; Miller et al., 2002; Soria et al., 2011). During the most commonly observed hard state, X-ray spectra consist of power-law component with photon index with an exponential cut-off at energies keV (Main et al., 1999; Lin et al., 2000; Sidoli & Mereghetti, 2002; Soria et al., 2011; Filothodoro & Lubińsk, 2019). Soft state and intermediate state observations are found to have a disc component present in the spectra where the photon index is greater than 2 (Soria et al., 2011; Hirsch et al., 2020). During the soft state, the black body temperature is observed to be 0.40.5 keV (Soria et al., 2011) which is low in comparison with the typical soft state disc temperature of keV. Transition to this state leads to a drop in by a factor of 3 when compared to hard state luminosity, which is unusual, and hence this state is usually referred to as dim-soft state (Smith et al., 2001a; Miller et al., 2002; Pottschmidt et al., 2006). Such peculiar spectral evolution of the source is not very well understood and hence needs to be explored in detail.
The source 1E 1740.72942 is also a persistent black hole which is in a LMXB system that is considered as a microquasar (Mirabel et al., 1992). It was discovered by the Einstein observatory (Hertz & Grindlay, 1984) and is located in a crowded region i.e., closer to the Galactic center at a distance of kpc (Tetarenko et al., 2020). It has high of 121022 atoms cm-2 along the source line of sight due to the presence of a dense molecular cloud near the source (Sheth et al., 1996; Yan & Dalgarno, 1997; Gallo & Fender, 2002). The source is typically found in its hard state, occasionally softening to intermediate and soft states (Main et al., 1999; Smith et al., 2002a; Del Santo et al., 2005; Reynolds & Miller, 2010). Long-term observations performed by RXTE suggest that the spectral photon index varies from 1.37 to 1.76 with the presence of an exponential cut-off at high energies (Main et al., 1999). The energy spectrum is also reported to have the presence of Fe emission line and Compton hump due to the reflection of photons in the hard state along with cool disc and Comptonization components (Del Santo et al., 2005; Castro et al., 2014; Stecchini et al., 2020). The soft state of the source is similar to that of GRS 1758258, where the spectrum consists of a disc blackbody with temperature keV, steep power-law component with index and low bolometric flux (Del Santo et al., 2005). Recent study of broadband X-ray observations from XMM Newton, NuSTAR and INTEGRAL revealed that the system has a high inclination angle , high spin, and BH mass of M⊙ (Stecchini et al., 2020). Power spectral study using longer duration RXTE observations has shown the signature of QPOs with the PDS usually having a flat-top noise (Main et al., 1999).
Broadband spectral coverage along with excellent timing capabilities sets out AstroSat (0.380 keV) (Agrawal, 2001, 2017) and NuSTAR (379 keV) (Harrison et al., 2013) as ideal observatories to study different characteristics of stellar-mass black hole binaries. Swift-XRT (0.210 keV) has observed GRS 1758258 simultaneously with NuSTAR. Therefore, we use observations from these X-ray missions to carry out a spectral and temporal study of GRS 1758258 and 1E 1740.72942. We explore the evolution of broadband energy spectrum during different Epochs of AstroSat and NuSTAR observations within the period of 20162022. We look into the spectral properties of both sources along with spectral state transition of GRS 1758258. We look for the evidence of reflection signature in their energy spectrum and find the relativistic reflection signature in both GRS 1758258 and 1E 1740.72942. From the study of reflection spectra, we constrain the ionization parameter of the reflecting region as well as the inclination angle of both sources.
This paper is organized as follows. We discuss the AstroSat and NuSTAR observations considered in this work and data reduction procedure in Section 2. In Section 3, we discuss the possible sources of contamination of the data and the procedure followed to eliminate it. Then in Section 4, we discuss the spectral analysis and different modeling procedures with results. Finally, in Section 5, we discuss and conclude the implications of the results obtained from this analysis.
2 Observations and Data Reduction
| Source | Date | Mission | Observation ID | Epoch |
|
|||||
| SXT | LAXPC | Swift-XRT | NuSTAR | |||||||
| GRS 1758258 | 15-10-2016 | AstroSat | AS1.1 | 58.6 | 12.2 | |||||
| 28-07-2017 | AS1.2 | 43.4 | 37.2 | |||||||
| 20-09-2017 | AS1.3 | 48.2 | 7.1 | |||||||
| 08-04-2018 | AS1.4 | 7.5 | 7.4 | |||||||
| 28-09-2018 | Swift-XRT | 00088767001 | NU1.5 | 1.72 | ||||||
| NuSTAR | 30401030002 | 84.5 | ||||||||
| 27-02-2022 | Swift-XRT | 00089378001 | NU1.6 | 1.69 | ||||||
| NuSTAR | 90801302002 | 23.9 | ||||||||
| 1E 1740.72942 | 28-06-2016 | AstroSat | AS2.1 | 88.6 | 67.2 | |||||
| 06-10-2016 | AS2.2 | 70.0 | 67.2 | |||||||
| 05-06-2018 | G08_045T01_9000001920 | AS2.3 | 77.2 | 73.9 | ||||||
| 11-05-2018 | AS2.4 | 68.6 | 67.0 | |||||||
| 12-05-2018 | A04_229T01_9000002096 | AS2.5 | 94.5 | 64.6 | ||||||
| 14-05-2021 | NuSTAR | NU2.6 | 43.9 | |||||||
In this work, we make use of observations of the BH sources GRS 1758258 and 1E 1740.72942 by Soft X-ray Telescope (SXT) and Large Area X-ray Proportional Counter (LAXPC) on-board AstroSat. We have also made use of two NuSTAR observations of GRS 1758258 and one observation of 1E 1740.72942. Along with these, we also consider two Swift-XRT observations of GRS 1758258 that are simultaneous with NuSTAR. AstroSat data are obtained through ISRO’s archival web-page 111https://astrobrowse.issdc.gov.in/astro_archive/archive/Home.jsp hosted at ISSDC. We obtain the publicly available NuSTAR and Swift-XRT data observed within 20182022 from HEASARC database. We classify the considered observations of the sources into different Epochs as given in Table 1.
2.1 NuSTAR Data Reduction
NuSTAR (Harrison et al., 2013) observes the X-ray sources using two Focal Plane Modules, i.e., FPMA and FPMB, simultaneously in the energy band 379 keV. GRS 1758258 has been observed during two occasions on 28-09-2018 and 27-02-2022, and 1E 1740.72942 is observed once on 14-05-2021 by NuSTAR. We obtain these observations from the HEASARC database and process the data using NuSTAR data analysis software NuSTARDAS v 0.4.8 following standard reduction procedure222https://heasarc.gsfc.nasa.gov/docs/nustar/analysis/. A cleaned event file is generated by using nupipeline module where screening of data is carried out by applying standard selection criteria. Latest NuSTAR calibration database is used (CALDB version 20200813) to obtain the event file. From the cleaned event file, we obtain the source image using XSELECT tool and select a circular source region of radius 1.5′ and a background region of 3′ radius from a source free region. We extract source lightcurve and spectrum from this selected region using nuproducts module from both FPMA and FPMB (see Radhika et al. 2018; Bhuvana et al. 2022). Response Matrix File (rmf) and Ancillary Response File (arf) required for the spectral fitting are also obtained using nuproducts. The background subtracted NuSTAR spectra are regrouped to have a minimum signal-to-noise ratio of 10 in each bin.
2.2 Swift-XRT Data Reduction
The Swift X-ray Telescope (XRT) has observed GRS 1758258 in 0.310 keV energy band, contemporaneously with the two NuSTAR observations listed in Table 1. Both of these XRT observations are carried out in Windowed Timing (WT) mode. We make use of standard data reduction pipeline associated with HEASoft v6.30.1 to reduce the data. Since the source is not bright enough to cause pileup, we extracted the source spectrum from a circular region of radius 47 (20 pixel: 1 pixel=2.36). The background spectrum is extracted from a circular region of same radius in a source free region. We make use of these observations along with NuSTAR to have wide-band coverage. The XRT spectra are set to have minimal signal-to-noise ratio of 10 per bin after subtracting the background.
2.3 SXT Data Reduction
The SXT on-board AstroSat observes the sources in 0.38.0 keV energy band. Both GRS 1758258 and 1E 1740.72942 have been observed by SXT in the Photon Counting (PC) mode. We make use of the cleaned event file of the Level-2 data. We create a merged cleaned event file taking all the individual orbit files into account, using the event merger python routine333https://www.tifr.res.in/~astrosat_sxt/dataanalysis.html based on Julia v 1.1.1. We select the single-pixel events by applying a grade filter to the event file to avoid the optical data leakage and to increase the signal-to-noise ratio (Singh et al., 2021). From this merged and filtered event file, we generate the source image with the help of XSELECT. We select a circular region of 10 around the source coordinates from which source spectra and lightcurves are extracted (see Sreehari et al. 2019; Baby et al. 2021). The maximum count rate of both sources is well within the pile-up limit444https://www.tifr.res.in/~astrosat_sxt/pdf/AstroSat-Handbook-v1.10.pdf for PC mode of 40 counts s-1. The light curve for each orbit is generated considering the minimum bin time of 2.4 sec from the source region. We then choose only those data segments where the observation is continuous, thereby excluding the duration of South Atlantic Anomaly (SAA) and Earth occultation. For both sources, we make use of the sky background spectrum and the response provided by the SXT team555https://www.tifr.res.in/~astrosat_sxt/dataanalysis.html. Using the specific python-based tool of sxtarfmodule, we obtain the ARF for individual observations considering the selected source region. The background subtracted spectrum is re-binned to have a minimum signal-to-noise ratio of 5 in each bin.
2.4 LAXPC Data Reduction
The LAXPC consists of three identical proportional counter detector units LAXPC10, LAXPC20, and LAXPC30 covering the energy range 380 keV (Yadav et al., 2016; Agrawal, 2017; Antia et al., 2017). We obtain Level-1 data from the ISSDC data archive, and extract the Level-2 files of energy spectrum, background spectrum and response matrix file using the latest version of single routine LAXPC software LaxpcSoftversion3.4.3 666http://www.tifr.res.in/~astrosat_laxpc/LaxpcSoft.html following Antia et al. 2017; Sreehari et al. 2019; Baby et al. 2020; Katoch et al. 2021. For all the observations of both sources, we have considered only LAXPC20, as it has a steady gain. For each observation, the source and background spectra and lightcurves are extracted from the top layer of the LAXPC unit, considering a single event to minimize the instrument effects beyond 30 keV (see also Agrawal et al. 2018; Katoch et al. 2021). The background subtracted LAXPC spectra are grouped to have a minimum signal-to-noise ratio of 5 in each bin.
Since both GRS 1758258 and 1E 1740.72942 are located close to the crowded field of the Galactic center, the possibility of other X-ray sources incidentally appearing within the wide LAXPC field of view (FOV) is very high. As this could contaminate the high energy LAXPC observations, before proceeding into further analysis, observational data of both sources should be checked and filtered for any possible contamination. Thus, in the following section, we discuss the appropriate methodology to quantify and exclude such contamination in these two sources.
3 Contamination from nearby X-ray sources
3.1 GRS 1758-258
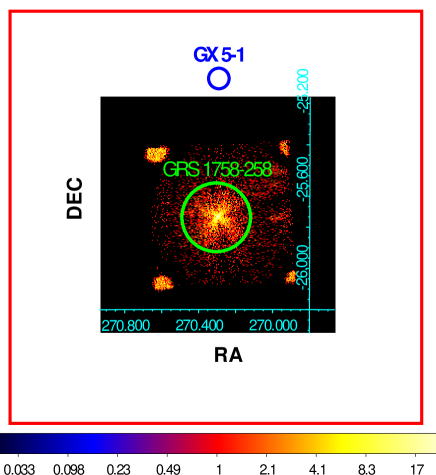
The source GRS 1758258 is located in close proximity within an angular distance of from a persistent neutron star binary GX 51. Figure 1 shows the SXT image of GRS 1758258 along with GX 51 in the background during Epoch AS1.1. The green circle has a radius of from the central position corresponding to RA and Dec of GRS 1758258, and it represents the SXT region of selection. The nearby source GX 51 has been marked in a blue circle for reference. We have represented the LAXPC FOV of (since its FWHM is ) as a red square. It is evident that the source region of GX 51 is not close to the selected region in SXT image of GRS 1758258, implying there is no contamination of its SXT observations. However, we cannot rule out any possible contamination of its LAXPC observations since GX 51 lies within LAXPC FOV. NuSTAR and Swift-XRT observations on the other hand are contamination-free because of their small FOV i.e., ()777https://heasarc.gsfc.nasa.gov/docs/nustar/NuSTAR_observatory_guide-v1.0.pdf and ()888https://swift.gsfc.nasa.gov/about_swift/xrt_desc.html respectively within which no other X-ray sources lie. At an angular separation of , of LAXPC detector efficiency is expected (Antia et al., 2017; Katoch et al., 2021). Therefore, for any further analysis of the LAXPC spectrum, the contamination issue needs to be resolved.
In order to eliminate the contamination of LAXPC spectrum of GRS 1758258 by GX 51, we adapt the spectral subtraction method following Baby et al. (2020) and Katoch et al. (2021). In this method, contamination is quantified by simulating the spectrum of contaminating sources using an off-axis response file. The simulated spectrum thus produced is used as the background spectrum along with the primary background during the fitting of the source spectrum. For this purpose, we generate a fake spectrum of contaminating source i.e., GX 51 during different Epochs when GRS 1758258 was observed following the procedure explained below.
3.1.1 Simulation of Contamination from GX 51
GX 51 is a Z-type neutron star binary that can occupy different spectral states in its various branches (Van der Klis et al., 1991) i.e., Horizontal Branch (HB), Upper Normal Branch (UNB), Lower Normal Branch (LNB), and Flaring Branch (FB) of Hardness Intensity Diagram (HID) within timescales of a few kilo seconds (Homan et al., 2018; Bhulla et al., 2019). In order to isolate the contamination by this source, it is necessary to simulate its spectrum, which entails understanding the spectral characteristic of the source. We simulate the LAXPC spectrum of GX 51 for its several spectral states i.e., UNB, HB, LNB and FB by making use of spectral parameters obtained by Homan et al. (2018) using the model combination TBabs(diskbb+bbodyrad+cutoffpl). A LAXPC off-axis response file for an off-axis angle of 40′ provided by instrument team999https://www.tifr.res.in/~astrosat_laxpc/LaxpcSoft_v1.0/ is used for these simulations. The off-axis spectrum of GX 5-1 thus obtained, is then subtracted from the spectrum of target source by using it as background spectrum.
The variable source GX 51 could be in any of the above mentioned spectral states during our observations of GRS 1758258. It is not possible to determine its exact spectral state during each of the AstroSat Epochs as the source was not observed by any X-ray instruments during these periods. Hence, we determine the most appropriate state during each Epoch by including the individual GX 51 simulated spectrum of various states as background during the spectral fit and compare the LAXPC spectral parameters with those obtained from uncontaminated SXT in their overlapping energy range of 38 keV (see Appendix A.1). From this, we find that the LAXPC fit parameters are consistent with SXT when background source is considered to be in UNB in all observations except Epoch AS1.1 (see Table 6), where the contamination is either over-corrected or under-corrected when different backgrounds are used. Therefore, for further analysis of Epoch AS1.1 observation, we ignore the LAXPC and consider only the SXT spectrum. For rest of the Epochs, we consider the contaminating source to be in UNB while carrying out the spectral analysis.
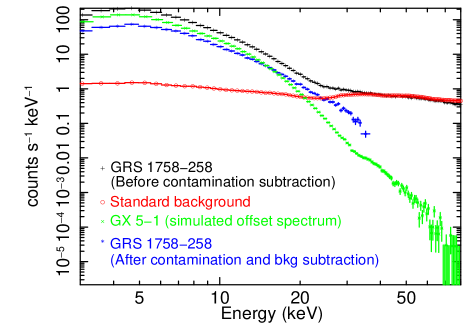
The contamination free LAXPC spectra are found to have significant data in high energy upto 3040 keV in Epoch AS1.2, AS1.3 and AS1.4. We find the flux contribution of GX 51 in 330 keV to be , , and of the total flux from GRS 1758258 during Epoch AS1.2, AS1.3 and AS1.4 respectively. In Figure 2, we illustrate this by plotting the contaminated LAXPC spectrum of GRS 1758258 during Epoch AS1.3 (black) along with standard LAXPC background spectrum for this observation (red), the simulated offset spectrum of GX 51 (green) as well as the source spectrum after the removal of standard background and contamination by GX 51 (blue).
3.2 1E 1740.7-2942
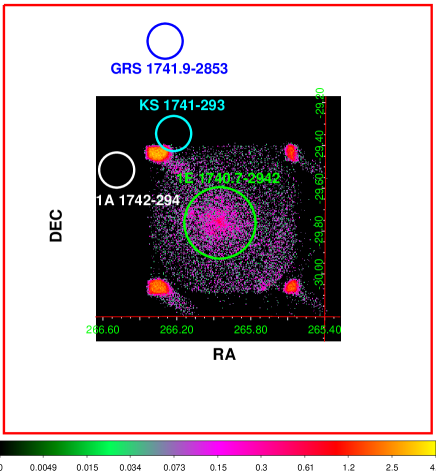
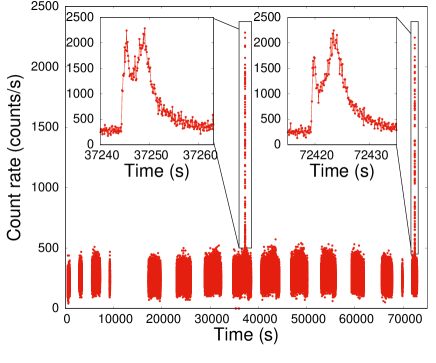
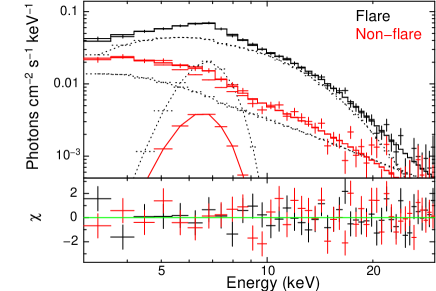
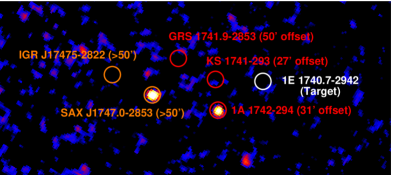
We also investigate the background X-ray sources in the vicinity of 1E 1740.72942, considering its proximity to the Galactic center. We find three neutron star (NS) binaries from the database of INTEGRAL Galactic bulge survey101010http://hea.iki.rssi.ru/integral/nine-years-galactic-survey/index.php?key=GAL-Survey-GC namely, KS 1741293, 1A 1742294 and GRS 1741.92853 that are positioned at an angular distance of , and respectively from 1E 1740.72942 (see Appendix A.2). Hence, they are identified as potential contaminators of 1E 1740.72942. In Figure 3, we show the SXT image of 1E 1740.72942 plotted along with KS 1741293 (cyan circle), 1A 1742294 (white circle) and GRS 1741.92853 (blue circle). It can be seen that these sources are located outside the region of selection of 1E 1740.72942 in SXT FOV but well within the LAXPC FOV, and hence we can expect the LAXPC observations to be contaminated. Therefore, we inspect the LAXPC lightcurve of 1E 1740.72942 and found it to have an occasional rapid increase in source count rate that lasts for a short period of sec. Such burst-like feature in the LAXPC lightcurve is observed to appear in every Epoch. However, no such traits are seen in the simultaneously observed SXT lightcurves. Upon closer inspection of these bursts, it is observed to follow a fast rise and exponential decay burst profile with a duration of sec. While some of these bursts show a single peak, a few others are found to have double peaks. This is illustrated in Figure 4, where we plot the source lightcurve during Epoch AS2.2 along with the expanded plots of burst profiles with double peaks in the inset. Such a profile is a characteristic signature of type-I thermonuclear burst from neutron stars (see Lewin et al. 1993 for details), which is not expected in a black hole system. Furthermore, we compare the spectral properties of flaring and non-flaring segments of LAXPC data. We model the burst spectrum of 20 sec exposure period using TBabs(bbodyrad+nthComp+gauss) in 330 keV energy range. Here, bbodyrad models the spectrum as blackbody with single temperature, nthComp models the Comptonization of the thermal radiation and gauss is used to model the Fe-line emission present at keV. While fitting, we tie up the blackbody temperature from bbodyrad and seed photon temperature from nthComp. This fitting resulted in a blackbody temperature of keV and a spectral index of . We then generate a spectrum from a 20 sec data segment just prior to the onset of the burst during Epoch AS2.2 and carry out its modeling in 330 keV. We find that this spectrum can be fitted using TBabs(nthComp+gauss) without the requirement of bbodyrad. The seed photon temperature is fixed to 0.1 keV, as it could not be constrained. This fit resulted in a spectral index of and Fe-line emission at keV. In Figure 5, we plot the unfolded energy spectra during a flare (black) and non-flare (red), which demonstrates an evident difference in the spectrum. Presence of a single temperature blackbody component in the burst spectrum that models the emission originating from the surface of the neutron star confirms the external origin of the flares. Even though the above mentioned nearby NS systems often undergo type-I burst with a similar burst profile (Kouzu et al., 2010; Kuulkers et al., 2013), we don’t have enough evidence to prove which of these NS is the source of these bursts. Therefore, to avoid this contamination during the analysis of 1E 1740.72942, we extract the spectrum and lightcurve by excluding those segments with flaring signatures. There is a possibility of the nearby NSs being active during non-flare periods also, which can cause contamination of LAXPC spectrum of 1E 1740.72942. To identify the possibility of contamination, we study the spectral properties of each of the nearby neutron stars.
KS 1741293 is a Very Faint X-ray Transient (VFXT) NS (Bahramian et al., 2021) source located at an angular distance of from 1E 1740.72942. The source is detectable in X-ray only when it undergoes an outburst during which the peak luminosity can reach erg s-1 (De Cesare et al., 2007; Chelovekov & Grebenev, 2011; Degenaar et al., 2012). However, during the Epochs AS2.1AS2.5, the source was in a quiescent/low-flux state, which is determined by referring to its JEM-X lightcurve data.
1A 1742294 is a NS-XRB that is located at a distance of from 1E 1740.72942 and is bright, persistent and exhibits type-I X-ray bursts. Because of its persistent nature and its brightness, the possibility of it causing contamination of LAXPC data of 1E 1740.72942 is high. In order to remove this undesired data, we simulate LAXPC offset spectrum of 1A 1742294 using offset response file. For the simulation, we use model combination TBabs(bremsstrahlung) with cm-2, keV and flux (in 220 keV) erg s-1 by referring Sidoli et al. (1999). Contribution of flux from 1A 1742294 to the total photons in 1E 1740.72942 spectrum in 330 keV are quantified to be 13.4%, 10.9%, 10.5%, 11.5% and 11.5% during the Epochs AS2.1AS2.5 respectively.
GRS 1741.92853 is a bursting NS-XRB located at a distance of from 1E 1740.72942. It is a faint transient that emits luminosity of erg s-1 (Wijnands et al., 2005; Pike et al., 2021) during an outburst. We quantify the possible contamination from this source by using offset LAXPC response file for the simulation, where we use the spectral parameters obtained by Pike et al. (2021) using the model combination TBabs(bbodyrad+nthComp+gauss). Contribution of GRS 1741.92853 is found to be 1.6%, 1.4%, 1.3%, 1.5%, and 1.5% to the total flux of 1E 1740.72942 (in 330 keV) during Epoch AS2.1AS2.5 respectively. The simulated spectrum of GRS 1741.92853 is added to the 1A 1742294 offset spectrum using mathpha tool which is then used as background along with the standard LAXPC background. We see the total flux contribution from these NSs to be 15.1%, 12.3%, 12.9%, 11.5% and 12.2% in 330 keV during the Epochs AS2.1AS2.5 respectively.
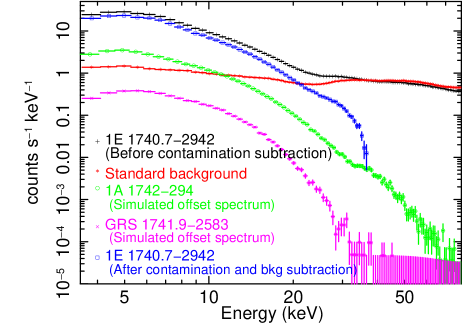
To ensure the effective removal of contamination in LAXPC spectra, we compare the LAXPC and SXT spectra of the target source in their overlapping energy band (i.e., 38 keV) in Appendix A.3. We see that the flux and index in LAXPC spectrum after the removal of contamination is close to that of SXT (see Table 7). This confirms the absence of overestimation/underestimation of contamination in LAXPC spectrum of the target source. In Figure 6, we plot the contaminated source spectrum of 1E 1740.72942 (black) of Epoch AS2.1 along with standard LAXPC background belonging to this observation (red), simulated offset spectra of both 1A 1742294 (green) and GRS 1741.92853 (magenta) as well as the target source spectrum after the removal of contamination and standard background (blue).
4 Spectral Analysis and Results
The spectral analysis is performed using XSpec v 12.12.1 package of HEAsoft v6.30. A systematic error of 2% is considered for all the AstroSat spectral fits (Leahy & Chen, 2019; Sreehari et al., 2019). We incorporate gain corrections to all the SXT fittings by using gain fit command in XSpec with fixed slope of 1 to correct for the instrumental residue at 1.8 and 2.2 keV. For those fitting where gain fit does not account for this residue, we use edge models at 1.8 and 2.2 keV instead. All the AstroSat spectral fits include gauss at keV to account for Xenon edge arising from the instrument (Antia et al., 2017, 2021). We use TBabs to account for the absorption of soft X-rays by neutral hydrogen in the interstellar medium. To estimate hydrogen column density , abundance is set as per Wilms et al. (2000). A cross-normalization constant is used between SXT and LAXPC which is fixed to unity in SXT and is allowed to vary freely in LAXPC data set whose value is found to be close to 1 in all the fits. Similarly, a cross-normalization is also used between XRT, FPMA and FPMB for Swift-XRT NuSTAR fitting by fixing FPMA to unity. We find minimal cross normalization difference of between FPMA and FPMB which is well within NuSTAR accepted limit (Madsen et al., 2015).
| Model | Parameter | Epoch AS1.1 | Epoch AS1.2 | Epoch AS1.3 | Epoch AS1.4 | Epoch NU1.5 | Epoch NU1.6 | ||
| TBabs |
|
||||||||
| diskbb | (keV) | - | - | - | - | - | |||
| - | - | - | - | - | |||||
| nthComp | (keV) | ||||||||
| (keV) | |||||||||
| gauss | (keV) | ||||||||
| (keV) | |||||||||
|
1.61 | 3.81 | 4.60 | 8.04 | 2.46 | 1.58 | |||
|
1.23 | 2.92 | 3.52 | 6.16 | 1.89 | 1.21 | |||
| /dof | 5787.97/4796 | ||||||||
f Frozen parameters
∗ Error couldn’t be estimated
† Bolometric flux derived in the energy range 0.3100 keV
‡ Bolometric luminosity calculated using by assuming distance to the BH as 8 kpc (Tetarenko et al., 2020)
| Model | Parameter | Epoch AS2.1 | Epoch AS2.2 | Epoch AS2.3 | Epoch AS2.4 | Epoch AS2.5 | Epoch NU2.6 | ||
|---|---|---|---|---|---|---|---|---|---|
| TBabs | (atoms cm-2) | ||||||||
| nthComp | (keV) | ||||||||
| (keV) | |||||||||
| gauss | (keV) | ||||||||
| (keV) | |||||||||
|
2.26 | 1.45 | 1.48 | 1.49 | 1.45 | 0.65 | |||
|
1.73 | 1.11 | 1.13 | 1.14 | 1.11 | 0.50 | |||
| /dof | 2574.04/2239 | ||||||||
f Frozen parameters
† Bolometric flux derived in the energy range 0.3100 keV
‡ Bolometric luminosity calculated using by assuming distance to the BH as 8 kpc (Tetarenko et al., 2020)
4.1 Preliminary Spectral Analysis
We model the simultaneous SXT and LAXPC energy spectra of GRS 1758258 observed during four different Epochs and Swift-XRT NuSTAR spectra during two Epochs (see Table 1). We use the standard LAXPC background spectrum as we all as the simulated offset spectrum of GX 51 (see Section 3.1) as background file for the source spectra. As mentioned in Section 3.1.1, we consider only SXT spectrum (0.68 keV) for the analysis of Epoch AS1.1 while rest of the fitting is carried out using combined SXT and LAXPC spectra in the energy range of 0.630 keV. High energy data bins are ignored as the source strength is weak and the background model is insensitive beyond 30 keV. Joint fitting of Swift-XRT and NuSTAR spectral fitting is carried out in the wideband energy range of 0.379 keV.
We begin the spectral modeling of GRS 1758258 by adapting the basic thermal Comptonization model nthComp (Zdziarski et al., 1996; Życki et al., 1999). The nthComp model describes the high energy continuum, which is originated from the process of up-scattering of seed photons coming from the disc. Here, the seed photons are modeled as multi-color disc blackbody. Photon index , electron temperature and seed photon temperature are the free parameters. Fitting this model to the AstroSat and NuSTAR energy spectra of GRS 1758258 resulted in residual that shows a conspicuous structure of iron emission line at keV (see also Appendix B) in all of its LAXPC and NuSTAR spectra. We add a gauss component to fit this emission feature. No such feature is observed in SXT spectrum of Epoch AS1.1 due to limited spectral response beyond 6 keV. Hence, we attempt to derive an upper limit to the flux of possible presence of emission line by fixing line energy at 6.4 keV and line width () at 1 keV. While the Comptonization model along with gauss provides a good fit for most of the observation, it is seen that an additional thermal disc model is required to fit the lower energy only for Epoch NU1.6 spectrum (see Appendix B). Thus, the preliminary spectral analysis of the source is carried out using (nthComp+gauss) for Epoch AS1.1-NU1.5 and (diskbb+nthComp+gauss) for Epoch NU1.6. Here, the parameters are tied across the Epochs while rest of the parameters are allowed to vary independently. We could not constrain source electron temperature during Epoch AS1.1 due to the unavailability of high energy data. Therefore, we freeze its value to keV as the fit remains unchanged beyond this value. The parameter in nthComp is allowed to vary freely for Epoch AS1.1 whereas for Epoch AS1.2NU1.5, when left free, hits the lower limit and hence we freeze its value to 0.1 keV in these Epochs. In Epoch NU1.6, is tied to the of diskbb which is left to vary freely. While fitting the gauss model, line energy is limited to be within 67 keV. The is left to vary independently across AstroSat and NuSTAR spectra but are tied within all the AstroSat epochs. Leaving the unconstrained, the AstroSat spectral fits were resulting in a large value of keV. Hence, we limit its value to be within 0.51.0 keV based on previous results by RXTE-PCA observations (see Hirsch et al. 2020) since PCA has a spectral resolution comparable to that of LAXPC. We list the parameters obtained from these fits during all six Epochs in Table 2.
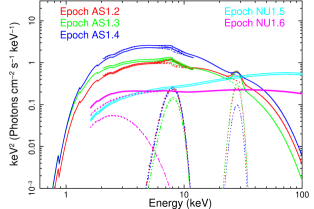
From this preliminary fit, we find the value to be atoms cm-2. This value is slightly greater than the value reported by Mereghetti et al. 1997 ( atoms cm-2) which is due to the consideration of distinct abundance i.e., from Anders & Grevesse 1989 (see also Jana et al. 2022). The Fe-line energy is found to be within keV during these Epochs. The in AstroSat spectra results to upper limit of 1 keV whose 90% confidence error couldn’t be constrained, whereas in Epoch NU1.5 and NU1.6 resultant is keV and 1.42 keV respectively. We obtain value of keV for Epoch AS1.1, where the spectrum is found to be very steep with . The 90% upper-limit to the Gaussian flux in this Epoch is erg cm-1 s-1. Unabsorbed source bolometric flux in 0.3100 keV during this Epoch is found to be erg cm-2 s-1. While thermal disc component is absent during Epoch AS1.2NU1.5, it is present during Epoch NU1.6 where its temperature, is found to be keV. We find relatively harder during Epochs AS1.2NU1.6 whose value varies within . The value during these Epochs is found to be within keV. For Epoch NU1.6, we fix to 50 keV as it could not be constrained when left free. during AS1.2NU1.5 is estimated to be within erg cm-2 s-1. During Epoch NU1.6, the overall flux is found to be erg cm-2 s-1. Total flux in this Epoch is dominated by Comptonized flux whose contribution is . In Figure 7, we plot the log data of the energy spectra during all six Epochs of GRS 1758258. From this, it is evident that the energy spectrum during Epoch AS1.1 is much steeper than the other spectra. A cooler disc temperature and steeper , along with a relatively lower flux value obtained during this Epoch suggests that the source is in a dim-soft state in this observation. Absence of disc component and presence of significant high energy contribution in the energy spectra of Epoch AS1.2NU1.5 clearly indicate that the source was in a hard state during these periods. Although a disc component is seen during Epoch NU1.6, the spectrum is still hard, and moreover, the dominant Comptonized flux implies that this Epoch too belongs to a hard spectral state.
We perform spectral analysis of 1E 1740.72942 by fitting TBabs(nthComp+gauss) model to the broadband SXT and LAXPC spectra belonging to Epoch AS2.1AS2.5 and NuSTAR spectrum belonging to Epoch NU2.6. As explained in Section 3.2, we have excluded all those segments in LAXPC data that has burst signature while obtaining the energy spectrum. Background subtracted LAXPC spectrum has data points till 3040 keV in most of the observations. However, we carried out fitting of all the AstroSat spectra in 0.830 keV ignoring the high energy bins for the same reason as mentioned for GRS 1758258. NuSTAR spectrum is modelled in the energy range 379 keV. Merged LAXPC offset spectrum of 1A 1742294 and GRS 1741.92853 is used as background along with standard LAXPC background in all the AstroSat spectral fits.
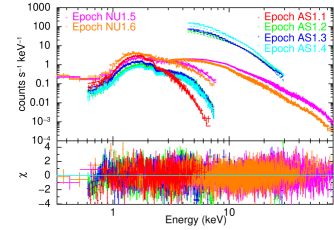
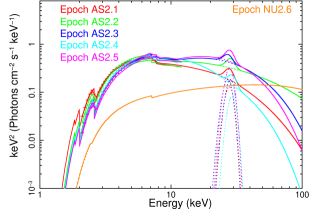
We find that the disc component is absent during all Epochs of 1E 1740.72942 (F-test111111https://heasarc.gsfc.nasa.gov/xanadu/xspec/manual/node81.html probability of 0.34 for diskbb). The parameters obtained by this spectral modeling during different Epochs are listed in Table 3. The parameter is found to be atoms cm-2. We fix the to keV as it reaches a minimum value during all the Epochs. is found to vary in the range . couldn’t be constrained during Epoch AS2.2 and AS2.5 therefore, we fix it to keV as fit remained unchanged beyond this value. During the rest of the Epochs, is found to be within keV. In this source unlike GRS 1758258, could be constrained from AstroSat spectra without limiting its value. We find of keV and keV from AstroSat and NuSTAR spectra respectively. during these observations are within the range of erg cm-2 s-1. The absence of a disc component in the spectrum and the flatter spectrum indicates that the source is in a hard state during all six observations. To illustrate the spectral fitting of AstroSat and NuSTAR observations, we plot the model fitted log data of spectra belonging to different Epochs in the top panel along with its residual in the bottom panel of Figure 8, which resembles the typical hard state spectra of a BH-XRB.
4.2 Relativistic Reflection Modeling
In order to examine the reflection properties of GRS 1758258 and 1E 1740.72942, we attempt to model the broadband AstroSat and NuSTAR spectra using several non-relativistic reflection models such as compPS (Poutanen & Svensson, 1996), pexriv and pexrav (Magdziarz & Zdziarski, 1995). Details of these modeling along with the results are discussed in Appendix C. The resultant non-zero values of the reflection parameter, i.e., from these models implies the presence of a reflection component in the spectra of both sources. Further, the presence of broadened Fe-line in the source spectrum due to gravitational effects indicate the closeness of the inner disc region to the radius of the innermost circular orbit () even during a hard state. As the relativistic effect has a significant influence on radiation from the region close to , in the present work, we focus on understanding the relativistic reflection properties of both sources. Thus, we model the source spectra obtained from AstroSat and NuSTAR using the relativistic reflection models belonging to relxill (v.2.0) family (Dauser et al., 2022) that considers unconstrained coronal geometry. We fit the hard state spectra belonging to Epoch AS1.2 NU1.6 of GRS 1758258 and Epoch AS2.1 NU2.6 of 1E 1740.72942 using self-consistent reflection model relxillCp that includes both thermalized Compton emission from corona and the reprocessed emission from the disc. In this fit, we assume a single Comptonized emission by considering the equal emissivity indices () with the break radius fixed at standard value of 15 (). Inner disc radius is assumed to be extended all the way till and outer disc radius is fixed at default value of Rg. The parameters , inclination angle () and disc iron abundance () are tied across the Epochs since these parameters do not vary over time. The spectral index (), electron temperature (), ionization parameter () and reflection fraction () are allowed to vary freely. The electron density parameter is frozen at the standard value of 15 as keeping it free did not yield any higher value. Along with relxillCp, we use diskbb for Epoch NU1.6 observation to account for thermal disc component. A gauss model is used in all the AstroSat observations to account for Xe emission at 30 keV. Along with these models, an additional gauss is fitted at keV in those observations where relxillCp alone doesn’t account for the complete Fe emission.
While fitting this model to GRS 1758258, we assume the source to be maximally rotating in nature. Such an assumption is made based on the correlation between jet power in a BH and its spin (Blandford, 1990). Since GRS 1758258 has a powerful jet (Tetarenko et al. 2020 and references therein), we consider it to be a maximally spinning BH. Therefore, fitting is carried out by fixing spin parameter () to while allowing , , and to vary freely. We list the model fitted parameters obtained during different Epochs in Table 4. It can be seen that for Epoch NU1.5 and NU1.6, additional gauss is not required as relxillCp alone accounts for the entire Fe emission line. From this reflection fitting, we find that the accretion disc in this system is partially ionized with the log value varying from 2.753.82 erg cm s-1 during different Epochs. The value is found to be keV during Epoch AS1.2AS1.4 and had to be frozen to 50 keV during Epoch NU1.5 and NU1.6. The , which is the ratio of radiation emitted by corona towards the disc to the reflected intensity, is left to vary independently across the Epochs. Its value is found to be i.e., 3.815.30 during Epoch AS1.2AS1.4 which indicates presence of strong reflection whereas, i.e., and during Epoch NU1.5 and NU1.6 respectively indicating a weaker reflection during these Epochs. The abundance of iron in accretion disc is found to be times the solar abundance. We also constrain the inclination angle () of this system to be . We find that the reflection parameters obtained from AstroSat and NuSTAR spectral modelling are consistent with each other. In Figure 9, we show the TBabs(relxillCp+gauss) model fit components present in AstroSat and NuSTAR spectra of GRS 1758258 during different Epochs.
The additional gauss component needed for three observations i.e., Epoch AS1.2, AS1.3 and AS1.4 could be a signature of distant reflection. To confirm this, we tried to replace gauss with non-relativistic reflection model xillverCp. However, two reflection models are too complicated for the data and as a result, most of the parameters couldn’t be constrained. Therefore, we model the additional feature using gauss model, whose line energy is found to be at keV in all three observations. Similar to preliminary modelling, we restricted to be within 0.51 keV which also resulted to its upper limit of 1 keV.
| Spectral components | Parameter | Epoch AS1.2 | Epoch AS1.3 | Epoch AS1.4 | Epoch NU1.5 | Epoch NU1.6 |
| TBabs | (atoms cm-2) | |||||
| relxillCp | ||||||
| (keV) | ||||||
| norm | ||||||
| diskbb | (keV) | |||||
f Frozen parameter
Errors are insignificant
| Spectral components | Parameter | Epoch AS2.1 | Epoch AS2.2 | Epoch AS2.3 | Epoch AS2.4 | Epoch AS2.5 | Epoch NU2.6 |
| TBabs | (atoms cm-2) | ||||||
| relxillCp | |||||||
| (keV) | |||||||
| norm | 0.37 | ||||||
f Frozen parameter
Errors are insignificant
‡ Parameter reaching hard limit
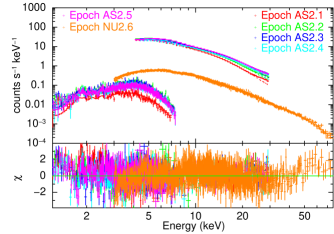
We carry out the reflection modeling of AstroSat and NuSTAR energy spectra of 1E 1740.72942 in a similar way, using TBabs(relxillCp). In these observations, relxillCp alone describes the entire spectrum without the need for an additional gauss. In order to simplify the fitting, we fix the value of at twice the solar abundance in all fits based on results by Reynolds & Miller (2010). The parameters obtained from these fits are listed in Table 5. We assume the source to be maximally spinning BH (Stecchini et al., 2020). This allowed us to constrain the inclination angle of the system to be .The from relxillCp is found to be in the range 2.74.7 erg cm s-1 and to be 1.134.13 during different Epochs. During most of these observations, had to be frozen as we couldn’t constrain its values. In Figure 10, we plot the total spectrum along with individual components fitted to AstroSat and NuSTAR spectra during different Epochs.
5 Discussions and Conclusions
In this paper, we have presented the spectral analysis of the persistent BH-XRBs GRS 1758258 and 1E 1740.72942 using the broadband observations carried out by AstroSat, Swift-XRT and NuSTAR during the period of 20162022. Here, we mainly discuss the source properties in different spectral states using nthComp+gauss models and its reflection properties using relxillCp model.
We find a bright NS source GX 51 located within LAXPC FOV of GRS 1758258 (see Figure 1) which could contaminate its LAXPC spectra. Therefore, before proceeding with the spectral modeling, we eliminate the possible contamination of GRS 1758258 spectra as discussed in Section 3.1. Preliminary spectral analysis of the uncontaminated data reveals the source to be in a dim-soft state during Epoch AS1.1 and a hard state during the rest of the Epochs. The hard state spectra are characterized by a Comptonization component along with Fe-line emission during Epoch AS1.2NU1.5 with an additional disc component in Epoch NU1.6 (see Section 4.1). Hard state spectrum is also found to have a relativistic reflection component (see Section 4.2). The abnormally high (), low inner disc photon temperature ( keV) and low flux ( erg cm-2 s-1) in its dim-soft state during Epoch AS1.1 is consistent with the previously observed dim-soft state of the source (Miller et al., 2002; Pottschmidt et al., 2006). Such a soft state is significantly different from the typical soft state of Galactic BHBs, which usually has a disc temperature of keV with a substantially higher flux than that in hard state (e.g., Cyg X-1; Zdziarski et al. 2002b; Kushwaha et al. 2021, IGR J17093624; Radhika et al. 2018, LMC X-3; Bhuvana et al. 2022). Presence of dim-soft state has been interpreted by Smith et al. (2001b); Smith et al. (2002b) as source having a distinct mechanism of spectral state change when compared to typical BHs like Cyg X-1. State change in GRS 1758258 is understood to be due to a change in corona rather than a change in the accretion disc. Such scenario is explained by Smith et al. (2001b); Smith et al. (2002b) based on Two-Component Accretion Flow (TCAF) model (Chakrabarti & Titarchuk, 1995), where the BH source has independent accretion flow, i.e., Keplerian (thin disc) and sub-Keplerian (hot halo) disc which accretes the matter at different timescales. The change in the accretion rate affects the sub-Keplerian disc immediately, and the Keplerian disc catches up after weeks which forms a temporary soft state, i.e., a sudden drop in mass accretion is resulting in a dim-soft state. In addition to this argument, Pottschmidt et al. 2006 has discussed that the occurrence of a dim-soft state could be related to the orientation of the disc, i.e., dim-soft state is observed if the system orientation is close to edge-on which allows only a small fraction of flux from disc to reach the observer. The relatively lower value of inclination angle found in this study (see section 4.2) rules out this possibility.
During Epoch AS1.2NU1.5, the hard state spectrum of GRS 1758258 consists of only Comptonization component with cooler seed photon temperature ( keV) and a flatter spectrum (). Hard spectra with low seed photon temperature attained in this source are consistent with the typical hard state behavior of Galactic BHs (Zdziarski & Gierliński, 2004; Remillard & McClintock, 2006; Baby et al., 2021; Bhuvana et al., 2022; Athulya et al., 2022). Hard state occurrence during Epoch NU1.6 is different from rest of the hard states because of the presence of a thermal disc component. While seed photon temperature or disc temperature is keV in the hard state of the former kind, it is found to be keV in the latter. The Lbol of 0.009 LEdd (considering the mass of BH to be M⊙) during Epoch NU1.6 is slightly lesser than what is observed in the previous Epoch, i.e., 0.01 LEdd and times lesser than the brightest hard state (Epoch AS1.4) in which L LEdd. Both detection and non-detection of thermal disc components during the hard state of this source are consistent with the previous findings (Pottschmidt et al., 2006; Soria et al., 2011). The disc temperature ( keV) that is observed during hard state is also consistent with previously observed disc temperature of hard state in this source. Mere presence of thermal disc unlike other hard state observations in this study does not allow us to classify it to be an intermediate state, as such classification is made only when the contribution of the disc component is significant (Goldwurm et al., 2001; Soria et al., 2011). However, in our observation, flux contribution from the disc is weak (i.e., ) and hence is considered as hard state. The drastic change in (445 keV) during the Epochs AS1.2NU1.5 can be associated with the variability seen within the hard states. During Epoch NU1.5, when the source is in ‘canonical’ hard state, the source exhibits low luminosity and high (see Table 2). Similarly, when emitted luminosity is the highest, i.e., during Epoch AS1.4, is found to have attained the lowest value (see Table 2). Thus, variation in can be attributed to the variation within hard state which is also observed in other typical BH-XRBs such as GX 3394, v404 Cyg etc., (Poutanen & Vurm, 2009; Yan et al., 2020). The variation in luminosity within the hard state in this source is also reported by Soria et al. (2011), where a flux difference of a factor of 2 is present between the hard state observed during 20012003 and 20082009. In fact, the hard state luminosity during 20082009 was slightly lesser than the dim-soft state of 20012003. Soria et al. (2011) interprets this as change in the spectral state not driven by mass accretion rate alone, which further supports the TCAF scenario. Such behavior is imitated during our observations as well, by exhibiting slightly lower flux during hard state of Epoch NU1.6 than during the dim-soft state of Epoch AS1.1 (see Table 2).
Driven by the presence of Fe-line feature in the source spectrum during hard states, we explore the possibility of the presence of high energy relativistic reflection component in the spectrum of GRS 1758258. On this account, we model the source spectra obtained from AstroSat and NuSTAR using relxillCp, that fits the continuum and broadened Fe-emission line, along with an additional gauss whenever required (see Section 4.2, Figure 9). Here, relxillCp models the flux from a single Comptonizing region with an unconstrained geometry that is reflected off the disc. Results obtained by fitting this model combination to the AstroSat and NuSTAR spectral fits suggest that the disc is partially ionized by resulting in erg cm s-1 which is responsible for the strong Fe-line emission. The resultant positive value of (see Section 4.2) obtained from this fit indicates the light-bending effect on reflected radiation that deflects the rays back to the disc (Dauser et al., 2014; Dauser et al., 2016). The low value () of obtained during Epoch NU1.5 and NU1.6 indicates the presence of relatively weaker reflection during these Epochs. We constrain the inclination angle of the system to be (see Table 4). This value is in close agreement with the jet inclination angle of this source estimated by Luque-Escamilla et al. (2020). We find a high metal abundance of the accretion disc, i.e., in this source relative to solar iron abundance. Thus, relativistic reflection modeling implies that GRS 1758258 has a partially ionized region in the accretion disc with high iron abundance, closer to the compact object, reflecting off the corona’s radiation. The presence of contamination in this source’s high-energy X-ray spectrum made it challenging to identify the reflection factor in the previous studies. However, careful detection and removal of contamination in this work helped us to model and constrain its parameters. Moreover, the reflection parameters obtained are found to be consistent across AstroSat and NuSTAR observations which consolidates the detection.
1E 1740.72942, often known as the twin source of GRS 1758258 because of their identical properties, is also located around the Galactic center and hence has a high possibility of contamination of its observational data by any nearby X-ray sources. Presence of burst profiles in LAXPC lightcurve of the source indicates such contamination from a nearby neutron star binaries (Figure 3, see also Figure 4). We identify and eliminate contamination from nearby NS sources 1A 1742294 and GRS 1741.92853 during the non-flaring period and ignore the LAXPC data segments that show flaring features. Modeling these AstroSat spectra along with the recent observation done by NuSTAR shows that the source is in hard state during all six Epochs (see Figure 8, Section 4.1). The hard state energy spectra consist of a Comptonization component with and keV, a distinct Fe-emission line feature at keV, along with a high energy reflection component. Our detection of Fe-line is consistent with the previous Suzaku (Reynolds & Miller, 2010) and XMM-Newton (Castro et al., 2014) observations. During these hard states, is found to be 0.010.02 LEdd considering the mass of the BH to be 5 M⊙ and distance to be 8 kpc. Previous studies of the source using Suzaku (Reynolds & Miller, 2010), NuSTAR (Natalucci et al., 2015), XMM Newton and INTEGRAL (Castro et al., 2014) have shown the presence of disc component in the hard state where the inner radius of the disc is positioned close to the compact object (Reynolds & Miller, 2010; Stecchini et al., 2020). However, in our study, we did not find disc component in any of the Epochs. Truncation of the disc at larger radii could not be the reason for the absence of the disc, as we observe distinct disc reflection features in the spectrum. Other possible explanation for the non-detection of the thermal disc component could be the obscuration of accretion disc by corona in hard state. Smith et al. (2002b) also favors this scenario to explain the geometry of the BH system based on the viscous timescale of spectral state change.
Previous studies of 1E 1740.72942 using NuSTAR and Suzaku have reported the presence of weak reflection feature (Reynolds & Miller, 2010; Stecchini et al., 2020) in the energy spectrum. In our study, modeling the spectra from AstroSat and NuSTAR with a blurred reflection model reveals the presence of relativistic reflection signature in the source (see Section 4.2). Model demonstrates that the source accretion disc is ionized having log erg cm s-1. By obtaining , the reflected radiation is found to be affected by the extreme gravity in the region close to the compact object analogous to GRS 1758258. Although we could not constrain the spin value from this modeling, we constrain the inclination angle of the disc to be (see Table 5). This is consistent with the results obtained by Stecchini et al. (2020) where, modeling the broadband spectra of 1E 1740.72942 resulted in high inclination () and maximum spin. Further, obtained inclination angle is consistent with the jet inclination angle in this system estimated by Luque-Escamilla et al. (2015).
We have also modelled the source spectra using different non-relativistic models to understand the basic properties of reflecting and Comptonizing regions (see Appendix C). From Comptonization model compPS which also accounts for reflection, we find the Comptonizing region in GRS 1758258 to have large optical depth of and has a temperature of keV. We also estimate the value by calculating the Compton y-parameter using the relationship between and the y-parameter (see Kobayashi et al. 2019 for details). Using the and obtained from compPS fitting, we obtain the y-parameter for Epoch NU1.5. Using this y-parameter, we calculate using the relation mentioned by Sunyaev & Titarchuk (1980). From this, we estimate to be , which is consistent with the observed value. Model pexriv and pexrav gives similar fits resulting in of and respectively. By fitting reflection models to the energy spectrum of 1E 1740.72942, from pexriv and pexrav, we find the amount of reflection from the disc in this source to be within 0.60.9 which is consistent with the previous studies (Natalucci et al., 2014; Stecchini et al., 2020). The Comptonizing region is found to have optical depth of (see Table 10). These parameter values are close to that obtained by Stecchini et al. (2020) by fitting same model to the spectra obtained from NuSTAR, XMM-Newton and INTEGRAL. Thus, using non-relativistic reflection models, we compute the physical parameters of the source that could not be estimated from the primary spectral fits.
We also looked into the timing features of both sources using NuSTAR observations. Power spectra constructed using lightcurve in 379 keV energy band for the frequency range of 0.0011 Hz. PDS is found to have flat-top noise till Hz, after which the power decays. Power spectrum modeled using Lorentzian yields total RMS of 13.2% in GRS 1758258 and 10.8% in 1E 1740.72942. Timing studies of these sources using any of the AstroSat observations are not attempted because of the possible contamination of its LAXPC lightcurve.
Our findings from this study can be summarized as follows:
We present a detailed analysis of persistent, Galactic BH-XRBs GRS 1758258 and 1E 1740.72942 using the X-ray observations from AstroSat and NuSTAR. From the spectral analysis, we find the sources to have the following properties:
-
•
GRS 1758258 is found to occupy two different spectral states i.e., dim-soft and hard states with of 1% LEdd in the former state and 15% LEdd in the latter. Thermal Comptonization model alone describes the dim-soft state spectrum of the source. The hard state spectrum is characterized by a Comptonization component and an excess line emission at keV along with occasional appearance of thermal disc component.
-
•
Relativistic reflection feature is found in the AstroSat and NuSTAR energy spectrum of GRS 1758258. Fitting the reflection spectra using relxillCp allowed us to constrain the ionization parameter of the reflecting region to be log erg cm s-1 with an iron abundance of times solar iron abundance. It also revealed the disc inclination angle to be .
-
•
Hard state spectrum of 1E 1740.72942 is found to be similar to that of GRS 1758258, which has a Comptonized component, Fe emission line, and reflection component. during these hard states is found to be in the range 12 % LEdd.
-
•
1E 1740.72942 is also found to have relativistic reflection features in the energy spectrum, and modeling the same suggests that the source has ionized accretion disc with erg cm s-1. Inclination angle of the system is revealed to be .
Acknowledgment
We acknowledge the anonymous reviewer for providing useful comments and suggestions regarding our work that helped to improve the quality of the manuscript. We acknowledge the financial support of Indian Space Research Organization (ISRO) under AstroSat archival data utilization program Sanction order No. DS-2B-13013(2)/13/2019-Sec.2. BGR thanks Dr. Baishali Garai, the PI of this project for providing constant support to carry out this research. This publication uses data from the AstroSat mission of the ISRO archived at the Indian Space Science Data Centre (ISSDC). This work also made use of data from the NuSTAR mission by the National Aeronautics and Space Administration. This work has been performed utilizing the calibration databases and auxiliary analysis tools developed, maintained and distributed by AstroSat-SXT team with members from various institutions in India and abroad. Also, this research made use of software provided by the High Energy Astrophysics Science Archive Research Center (HEASARC) and NASA’s Astrophysics Data System Bibliographic Services. This research also made use of JEM-X lightcurve data provided by INTEGRAL Galactic Bulge Monitoring program. We also acknowledge the copyright holders of Astronomy & Astrophysics journal for providing permission to modify and reprint a published from Kuulkers et al. 2007. AU acknowledges the financial support from ISRO sponsored project (DS_2B-13013(2)/5/2020-Sec.2). VKA, AN also thank GH, SAG, DD, PDMSA and Director, URSC for encouragement and continuous support to carry out this research. TK acknowledge support of the Department of Atomic Energy, Government of India, under project no. 12 R&DTFR5.020200.
Facilities: AstroSat, NuSTAR, INTEGRAL
Data Availability
This paper uses the AstroSat archival data available in ISSDC website https://astrobrowse.issdc.gov.in/astro_archive/archive/Home.jsp. JEM-X data is available at http://integral.esac.esa.int/BULGE/SOURCES/ and NuSTAR at https://heasarc.gsfc.nasa.gov/cgi-bin/W3Browse/w3browse.pl.
References
- Agrawal (2001) Agrawal P. C., 2001, in Inoue H., Kunieda H., eds, Astronomical Society of the Pacific Conference Series Vol. 251, New Century of X-ray Astronomy. p. 512
- Agrawal (2017) Agrawal P. C., 2017, Journal of Astrophysics and Astronomy, 38, 27
- Agrawal et al. (2018) Agrawal V. K., Nandi A., Girish V., Ramadevi M. C., 2018, MNRAS, 477, 5437
- Anders & Grevesse (1989) Anders E., Grevesse N., 1989, Geochimica Cosmochimica Acta, 53, 197
- Antia et al. (2017) Antia H. M., et al., 2017, ApJS, 231, 10
- Antia et al. (2021) Antia H. M., et al., 2021, Journal of Astrophysics and Astronomy, 42, 32
- Athulya et al. (2022) Athulya M. P., Radhika D., Agrawal V. K., Ravishankar B. T., Naik S., Mandal S., Nandi A., 2022, MNRAS, 510, 3019
- Baby et al. (2020) Baby B. E., Agrawal V. K., Ramadevi M. C., Katoch T., Antia H. M., Mandal S., Nand i A., 2020, MNRAS, 497, 1197
- Baby et al. (2021) Baby B. E., Bhuvana G. R., Radhika D., Katoch T., Mandal S., Nandi A., 2021, MNRAS, 508, 2447
- Bahramian et al. (2021) Bahramian A., et al., 2021, MNRAS, 501, 2790
- Belloni & Hasinger (1990) Belloni T., Hasinger G., 1990, A&A, 227, L33
- Belloni et al. (2000) Belloni T., Klein-Wolt M., Méndez M., van der Klis M., van Paradijs J., 2000, A&A, 355, 271
- Bhulla et al. (2019) Bhulla Y., Misra R., Yadav J. S., Jaaffrey S. N. A., 2019, Research in Astronomy and Astrophysics, 19, 114
- Bhuvana et al. (2021) Bhuvana G. R., Radhika D., Agrawal V. K., Mandal S., Nandi A., 2021, MNRAS, 501, 5457
- Bhuvana et al. (2022) Bhuvana G. R., Radhika D., Nandi A., 2022, Advances in Space Research, 69, 483
- Blandford (1990) Blandford R. D., 1990, in Blandford R. D., Netzer H., Woltjer L., Courvoisier T. J. L., Mayor M., eds, Active Galactic Nuclei. pp 161–275
- Boyd et al. (2000) Boyd P. T., Smale A. P., Homan J., Jonker P. G., van der Klis M., Kuulkers E., 2000, ApJ, 542, L127
- Castro-Tirado et al. (1994) Castro-Tirado A. J., Brandt S., Lund N., Lapshov I., Sunyaev R. A., Shlyapnikov A. A., Guziy S., Pavlenko E. P., 1994, ApJS, 92, 469
- Castro et al. (2014) Castro M., D’Amico F., Braga J., Maiolino T., Pottschmidt K., Wilms J., 2014, A&A, 569, A82
- Chakrabarti & Titarchuk (1995) Chakrabarti S., Titarchuk L. G., 1995, ApJ, 455, 623
- Chelovekov & Grebenev (2011) Chelovekov I. V., Grebenev S. A., 2011, Astronomy Letters, 37, 597
- Chen et al. (1997) Chen W., Shrader C. R., Livio M., 1997, ApJ, 491, 312
- Corral-Santana et al. (2016) Corral-Santana J. M., Casares J., Muñoz-Darias T., Bauer F. E., Martínez-Pais I. G., Russell D. M., 2016, A&A, 587, A61
- Dauser et al. (2014) Dauser T., Garcia J., Parker M. L., Fabian A. C., Wilms J., 2014, MNRAS, 444, L100
- Dauser et al. (2016) Dauser T., García J., Walton D. J., Eikmann W., Kallman T., McClintock J., Wilms J., 2016, A&A, 590, A76
- Dauser et al. (2022) Dauser T., García J. A., Joyce A., Licklederer S., Connors R. M. T., Ingram A., Reynolds C. S., Wilms J., 2022, MNRAS, 514, 3965
- De Cesare et al. (2007) De Cesare G., Bazzano A., Martínez Núñez S., Stratta G., Tarana A., Del Santo M., Ubertini P., 2007, MNRAS, 380, 615
- Degenaar et al. (2012) Degenaar N., Wijnands R., Cackett E. M., Homan J., in’t Zand J. J. M., Kuulkers E., Maccarone T. J., van der Klis M., 2012, A&A, 545, A49
- Del Santo et al. (2005) Del Santo M., et al., 2005, A&A, 433, 613
- Ebisawa et al. (1989) Ebisawa K., Mitsuda K., Inoue H., 1989, PASJ, 41, 519
- Fabian (2016) Fabian A. C., 2016, Astronomische Nachrichten, 337, 375
- Fabian et al. (1989) Fabian A. C., Rees M. J., Stella L., White N. E., 1989, MNRAS, 238, 729
- Filothodoro & Lubińsk (2019) Filothodoro A., Lubińsk P., 2019, Mem. Soc. Astron. Italiana, 90, 100
- Gallo & Fender (2002) Gallo E., Fender R. P., 2002, MNRAS, 337, 869
- Gierliński et al. (1999) Gierliński M., Zdziarski A. A., Poutanen J., Coppi P. S., Ebisawa K., Johnson W. N., 1999, MNRAS, 309, 496
- Goldwurm et al. (2001) Goldwurm A., Israël D., Goldoni P., Ferrando P., Decourchelle A., Mirabel F. I., Warwick R. S., 2001, in Ritz S., Gehrels N., Shrader C. R., eds, American Institute of Physics Conference Series Vol. 587, Gamma 2001: Gamma-Ray Astrophysics. pp 61–65 (arXiv:astro-ph/0106310), doi:10.1063/1.1419372
- Harrison et al. (2013) Harrison F. A., et al., 2013, ApJ, 770, 103
- Heindl et al. (1994) Heindl W. A., Prince T. A., Grunsfeld J. M., 1994, ApJ, 430, 829
- Hertz & Grindlay (1984) Hertz P., Grindlay J. E., 1984, ApJ, 282, 118
- Hirsch et al. (2020) Hirsch M., et al., 2020, A&A, 636, A51
- Homan & Belloni (2005) Homan J., Belloni T., 2005, Ap&SS, 300, 107
- Homan et al. (2001) Homan J., Wijnands R., van der Klis M., Belloni T., van Paradijs J., Klein-Wolt M., Fender R., Méndez M., 2001, ApJS, 132, 377
- Homan et al. (2018) Homan J., Steiner J. F., Lin D., Fridriksson J. K., Remillard R. A., Miller J. M., Ludlam R. M., 2018, ApJ, 853, 157
- Iyer et al. (2015) Iyer N., Nandi A., Mandal S., 2015, ApJ, 807, 108
- Jana et al. (2022) Jana A., Chang H.-K., Chatterjee A., Naik S., Safi-Harb S., 2022, ApJ, 936, 3
- Jonker et al. (2021) Jonker P. G., Kaur K., Stone N., Torres M. A. P., 2021, ApJ, 921, 131
- Katoch et al. (2021) Katoch T., Baby B. E., Nandi A., Agrawal V. K., Antia H. M., Mukerjee K., 2021, MNRAS, 501, 6123
- Keck et al. (2001) Keck J. W., et al., 2001, ApJ, 563, 301
- King & Lynden Bell (1995) King I. R., Lynden Bell D., 1995, The Observatory, 115, 343
- Kobayashi et al. (2019) Kobayashi S. B., Nakazawa K., Makishima K., 2019, MNRAS, 489, 366
- Kouzu et al. (2010) Kouzu T., Terada Y., Ebisawa K., Tashiro M. S., Saitou K., 2010, in The Energetic Cosmos: from Suzaku to ASTRO-H. pp 222–223
- Kushwaha et al. (2021) Kushwaha A., Agrawal V. K., Nandi A., 2021, MNRAS, 507, 2602
- Kuulkers et al. (2007) Kuulkers E., et al., 2007, A&A, 466, 595
- Kuulkers et al. (2013) Kuulkers E., et al., 2013, The Astronomer’s Telegram, 4840, 1
- Leahy & Chen (2019) Leahy D. A., Chen Y., 2019, ApJ, 871, 152
- Lewin et al. (1993) Lewin W. H. G., van Paradijs J., Taam R. E., 1993, Space Sci. Rev., 62, 223
- Lin et al. (2000) Lin D., Smith I. A., Böttcher M., Liang E. P., 2000, ApJ, 531, 963
- Luque-Escamilla et al. (2014) Luque-Escamilla P. L., Martí J., Muñoz-Arjonilla Á. J., 2014, ApJ, 797, L1
- Luque-Escamilla et al. (2015) Luque-Escamilla P. L., Martí J., Martínez-Aroza J., 2015, A&A, 584, A122
- Luque-Escamilla et al. (2020) Luque-Escamilla P. L., Martí J., Martínez-Aroza J., 2020, A&A, 643, A150
- Madsen et al. (2015) Madsen K. K., et al., 2015, ApJS, 220, 8
- Magdziarz & Zdziarski (1995) Magdziarz P., Zdziarski A. A., 1995, MNRAS, 273, 837
- Main et al. (1999) Main D. S., Smith D. M., Heindl W. A., Swank J., Leventhal M., Mirabel I. F., Rodríguez L. F., 1999, ApJ, 525, 901
- Majumder et al. (2022) Majumder S., Sreehari H., Aftab N., Katoch T., Das S., Nandi A., 2022, MNRAS, 512, 2508
- Martí et al. (2017) Martí J., Luque-Escamilla P. L., Bosch-Ramon V., Paredes J. M., 2017, Nature Communications, 8, 1757
- Mereghetti et al. (1997) Mereghetti S., Cremonesi D. I., Haardt F., Murakami T., Belloni T., Goldwurm A., 1997, ApJ, 476, 829
- Miller et al. (2002) Miller J. M., Wijnands R., Rodriguez-Pascual P. M., Ferrando P., Gaensler B. M., Goldwurm A., Lewin W. H. G., Pooley D., 2002, ApJ, 566, 358
- Mirabel & Rodríguez (1994) Mirabel I. F., Rodríguez L. F., 1994, Nature, 371, 46
- Mirabel et al. (1992) Mirabel I. F., Rodriguez L. F., Cordier B., Paul J., Lebrun F., 1992, Nature, 358, 215
- Nandi et al. (2012) Nandi A., Debnath D., Mandal S., Chakrabarti S. K., 2012, A&A, 542, 56
- Nandi et al. (2018) Nandi A., et al., 2018, Ap&SS, 363, 90
- Natalucci et al. (2014) Natalucci L., et al., 2014, ApJ, 780, 63
- Natalucci et al. (2015) Natalucci L., Fiocchi M., Bazzano A., Ubertini P., Roques J.-P., Jourdain E., 2015, ApJ, 813, L21
- Orosz et al. (2014) Orosz J. A., Steiner J. F., McClintock J. E., Buxton M. M., Bailyn C. D., Steeghs D., Guberman A., Torres M. A. P., 2014, ApJ, 794, 154
- Pike et al. (2021) Pike S. N., et al., 2021, ApJ, 918, 9
- Pottschmidt et al. (2006) Pottschmidt K., Chernyakova M., Zdziarski A. A., Lubiński P., Smith D. M., Bezayiff N., 2006, A&A, 452, 285
- Poutanen & Svensson (1996) Poutanen J., Svensson R., 1996, ApJ, 470, 249
- Poutanen & Vurm (2009) Poutanen J., Vurm I., 2009, ApJ, 690, L97
- Radhika & Nandi (2014) Radhika D., Nandi A., 2014, Advances in Space Research, 54, 1678
- Radhika et al. (2018) Radhika D., Sreehari H., Nandi A., Iyer N., Mandal S., 2018, Ap&SS, 363, 189
- Rao et al. (2000) Rao A. R., Yadav J. S., Paul B., 2000, ApJ, 544, 443
- Remillard & McClintock (2006) Remillard R. A., McClintock J. E., 2006, ARA&A, 44, 49
- Reynolds & Miller (2010) Reynolds M. T., Miller J. M., 2010, ApJ, 716, 1431
- Rodriguez et al. (1992) Rodriguez L. F., Mirabel I. F., Marti J., 1992, ApJ, 401, L15
- Schmidtke et al. (1999) Schmidtke P. C., Ponder A. L., Cowley A. P., 1999, AJ, 117, 1292
- Shakura & Sunyaev (1973) Shakura N. I., Sunyaev R. A., 1973, A&A, 24, 337
- Sheth et al. (1996) Sheth S., Liang E., Luo C., Murakami T., 1996, ApJ, 468, 755
- Sidoli & Mereghetti (2002) Sidoli L., Mereghetti S., 2002, A&A, 388, 293
- Sidoli et al. (1999) Sidoli L., Mereghetti S., Israel G. L., Chiappetti L., Treves A., Orlandini M., 1999, ApJ, 525, 215
- Singh et al. (2021) Singh K. P., Stewart G., Chandra S., Dewangan G. C., Bhattacharyya S., Kamble N. S., Vishwakarma S., Koyande J. G., 2021, Journal of Astrophysics and Astronomy, 42, 77
- Smith et al. (2001a) Smith D. M., Heindl W. A., Swank J. H., Markwardt C. B., 2001a, The Astronomer’s Telegram, 66, 1
- Smith et al. (2001b) Smith D. M., Heindl W. A., Markwardt C. B., Swank J. H., 2001b, ApJ, 554, L41
- Smith et al. (2002a) Smith D. M., Heindl W. A., Markwardt C. B., Swank J. H., 2002a, The Astronomer’s Telegram, 94, 1
- Smith et al. (2002b) Smith D. M., Heindl W. A., Swank J. H., 2002b, ApJ, 569, 362
- Soria et al. (2011) Soria R., Broderick J. W., Hao J., Hannikainen D. C., Mehdipour M., Pottschmidt K., Zhang S.-N., 2011, MNRAS, 415, 410
- Sreehari & Nandi (2021) Sreehari H., Nandi A., 2021, MNRAS, 502, 1334
- Sreehari et al. (2019) Sreehari H., Ravishankar B. T., Iyer N., Agrawal V. K., Katoch T. B., Mandal S., Nand i A., 2019, MNRAS, 487, 928
- Sreehari et al. (2020) Sreehari H., Nandi A., Das S., Agrawal V. K., Mandal S., Ramadevi M. C., Katoch T., 2020, MNRAS, 499, 5891
- Stecchini et al. (2020) Stecchini P. E., D’Amico F., Jablonski F., Castro M., Braga J., 2020, MNRAS, 493, 2694
- Sunyaev & Titarchuk (1980) Sunyaev R. A., Titarchuk L. G., 1980, A&A, 500, 167
- Sunyaev et al. (1991) Sunyaev R., et al., 1991, Pisma v Astronomicheskii Zhurnal, 17, 116
- Tanaka & Lewin (1995) Tanaka Y., Lewin W. H. G., 1995, X-ray Binaries, pp 126–174
- Tetarenko et al. (2016a) Tetarenko B. E., Sivakoff G. R., Heinke C. O., Gladstone J. C., 2016a, ApJS, 222, 15
- Tetarenko et al. (2016b) Tetarenko B. E., Sivakoff G. R., Heinke C. O., Gladstone J. C., 2016b, ApJS, 222, 15
- Tetarenko et al. (2020) Tetarenko A. J., Rosolowsky E. W., Miller-Jones J. C. A., Sivakoff G. R., 2020, MNRAS, 497, 3504
- Van der Klis (1989) Van der Klis M., 1989, ARA&A, 27, 517
- Van der Klis et al. (1991) Van der Klis M., Kitamoto S., Tsunemi H., Miyamoto S., 1991, MNRAS, 248, 751
- Wijnands et al. (2005) Wijnands R., et al., 2005, The Astronomer’s Telegram, 512, 1
- Wilms et al. (2000) Wilms J., Allen A., McCray R., 2000, ApJ, 542, 914
- Wilms et al. (2001) Wilms J., Nowak M. A., Pottschmidt K., Heindl W. A., Dove J. B., Begelman M. C., 2001, MNRAS, 320, 327
- Yadav et al. (2016) Yadav J. S., et al., 2016, ApJ, 833, 27
- Yan & Dalgarno (1997) Yan M., Dalgarno A., 1997, ApJ, 481, 296
- Yan et al. (2020) Yan Z., Xie F.-G., Zhang W., 2020, ApJ, 889, L18
- Zdziarski & Gierliński (2004) Zdziarski A. A., Gierliński M., 2004, Progress of Theoretical Physics Supplement, 155, 99
- Zdziarski et al. (1996) Zdziarski A. A., Johnson W. N., Magdziarz P., 1996, MNRAS, 283, 193
- Zdziarski et al. (2002a) Zdziarski A. A., Poutanen J., Paciesas W. S., Wen L., 2002a, ApJ, 578, 357
- Zdziarski et al. (2002b) Zdziarski A. A., Poutanen J., Paciesas W. S., Wen L., 2002b, ApJ, 578, 357
- Życki et al. (1999) Życki P. T., Done C., Smith D. A., 1999, MNRAS, 309, 561
Appendix A Contamination of LAXPC spectrum
A.1 Determination of spectral state of GX 51
The highly variable background source GX 51 could be in any of its different spectral states during the Epochs when GRS 1758258 was observed by AstroSat (see section 3.1.1). Since the determination of its exact spectral state is not possible, we identify the most appropriate state that reproduces the contamination in LAXPC spectrum, by comparing the flux and spectral parameters obtained from SXT and LAXPC with different background in their overlapping energy band of 38 keV. For this, we fit the 38 keV SXT and LAXPC energy spectra using an absorbed powerlaw+gauss model, considering different LAXPC contamination spectrum i.e., UNB, HB, LNB and FB. In Table 6, we list the parameters obtained from these fits for different observations. It is evident that, the powerlaw index () of LAXPC spectrum has remained more or less constant across different background states. However, the flux in LAXPC spectrum changes significantly with different background. But, it is to be noted that the LAXPC and SXT fluxes are consistent with each other when background is considered to be in UNB during Epoch AS1.2, AS1.3 and AS1.4. However, during Epoch AS1.1, the LAXPC flux is significantly lesser than SXT when background spectrum is considered to be UNB, HB and LNB indicating over-estimation of level of contamination, whereas for FB, flux in LAXPC is higher than SXT implying under-estimation of contamination.
| Epoch | Flux () | |||||||||
|---|---|---|---|---|---|---|---|---|---|---|
| SXT | LAXPC | SXT | LAXPC | |||||||
| UNB | HB | LNB | FB | UNB | HB | LNB | FB | |||
| AS1.1 | 16.8 | |||||||||
| AS1.2 | 17.0 | 16.8 | ||||||||
| AS1.3 | 18.8 | 19.1 | ||||||||
| AS1.4 | 40.0 | 41.9 | ||||||||
A.2 Neutron stars nearby 1E 1740.7-2942
1E 1740.72942 is located in the midst of many outbursting neutron stars. In Figure 11, we show the INTEGRAL/JEM-X image of Galactic centre obtained by Kuulkers et al. (2007) with the marked nearby X-ray binaries. KS 1741293 is the closest one that is at an angular distance of from the target source. 1A 1742294 is located at a distance of and GRS 1741.92853 at . Other nearby X-ray sources IGR J174752822 and SAX J1747.02853 are at distance and hence lie outside the FOV of LAXPC. Therefore, there would be no contamination from these two sources.
A.3 Comparison of SXT and LAXPC spectra of 1E 1740.72942 in their overlapping energy band
In case of 1E 1740.72942, the background sources 1A 1742294 and GRS 1741.92853 are considered to be in their brightest states. We did not account for the flux variability of these contaminating sources as the nature of 1A 1742294 during non-burst emission is not very well studied and GRS 1741.92853 is a very faint source whose variability doesn’t affect the source flux significantly. Yet, we compare the LAXPC spectral parameters with that of SXT in 38 keV to check for overestimation/underestimation of level of contamination. We list the parameters obtained by fitting absorbed powerlaw+gauss model to the individual SXT and LAXPC spectra during different Epochs in Table 7. The power-law index as well as flux values obtained from LAXPC spectrum remains consistent with that from SXT, which demonstrates the effective removal of contamination in LAXPC spectra of 1E 1740.72942.
| Epoch | Flux () | |||
|---|---|---|---|---|
| SXT | LAXPC | SXT | LAXPC | |
| AS2.1 | 7.76 | 7.54 | ||
| AS2.2 | 13.7 | 12.3 | ||
| AS2.3† | 9.32 | 10.9 | ||
| AS2.4† | 9.67 | 9.90 | ||
| AS2.5† | 8.97 | 10.8 | ||
† Fitting is carried out in 3.58 keV because of large variation in LAXPC data point below 3.5 keV.
Appendix B Testing the need for additional spectral components
In this section, we demonstrate the presence of additional components such as Fe emission line and thermal disk component in the Comptonization continuum of the energy spectra of both GRS 1758258 and 1E 1740.72942. To validate the authenticity of the emission line, we show the improvement of the preliminary fit with the inclusion of gauss, by comparing of the preliminary fit with and without considering gauss component in Table 8. The significant improvement in the proves the need for Fe-line model in the fit. In Figure 12, we plot the preliminary fit residual without gauss for AstroSat (left) and NuSTAR (right) spectra. The stronger emission feature in all the AstroSat spectra when compared to NuSTAR is due to high source flux emitted by the source during these Epochs (see Table 2 and 3).
We also provide the confirmation for the presence of thermal disc component in NU1.6 spectrum. In Figure 13, we plot the residual of the preliminary model fit without (top panel) and with (bottom panel) considering the diskbb component. The improves significantly from 2.7 to 1.08, when diskbb component is added. The presence of soft excess in the fit residual when diskbb component is not considered, and the improvement of fit quality with the addition of diskbb clearly indicates the need for a disc component in the lower energy.
| Epoch |
|
|
||||
|---|---|---|---|---|---|---|
| GRS 1758258 | ||||||
| AS1.2 | ||||||
| AS1.3 | ||||||
| AS1.4 | ||||||
| NU1.5 | ||||||
| NU1.6 | ||||||
| 1E 1740.72942 | ||||||
| AS2.1 | ||||||
| AS2.2 | ||||||
| AS2.3 | ||||||
| AS2.4 | ||||||
| AS2.5 | ||||||
| NU2.6 | ||||||
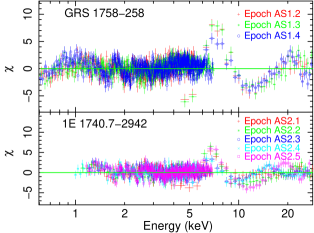
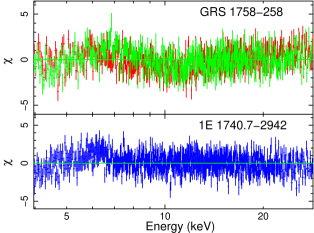
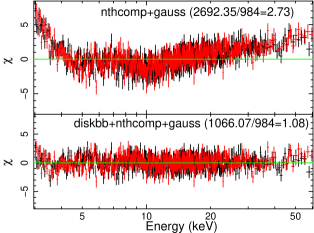
Appendix C Non-relativistic Reflection Modeling
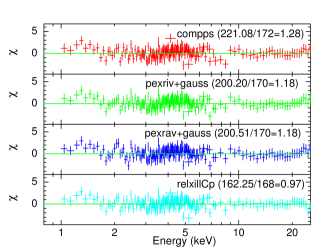
| Parameter | nthComp+gauss | pexriv+gauss | pexrav+gauss | compPS |
|---|---|---|---|---|
| (keV) | ||||
| lineE (keV) | ||||
| () | ||||
| Parameter | nthComp+gauss | pexriv+gauss | pexrav+gauss | compPS | ||
|---|---|---|---|---|---|---|
|
||||||
| (keV) | ||||||
| lineE (keV) | ||||||
| () | ||||||
f Frozen parameter
This section explains the details of modeling carried out using different non-relativistic reflection models. Initially, we model the spectra of both source using the non-relativistic reflection models such as pexriv and pexrav (Magdziarz &
Zdziarski, 1995). While pexrav accounts for reflection in the spectrum by assuming a neutral-disc (), pexriv considers disc to be ionized ( is free parameter). Here, we show the results obtained by fitting these models to Epoch NU1.5 spectrum of GRS 1758258 (Table 9) and AS2.3 spectrum of 1E 1740.72942 (Table 10). During these fits, we fix the cosine of inclination angle to 0.6. Fe abundance of GRS 1758258 is assumed to be the same as that of solar abundance, whereas that of 1E 1740.72942 is 2 times solar metal abundance. As we could not constrain the parameter from pexriv, we fixed its value to 1000 erg cm s-1 assuming a partially ionized disc. Since these two models do not include line emission, we added gauss at keV. pexriv and pexrav resulted in of and respectively in case of GRS 1758258 and and in case of 1E 1740.72942. We then model the same spectrum using compPS model (Poutanen &
Svensson, 1996) that computes the Comptonization spectra for different geometries which also accounts for reflection. The reflected radiation from the cool disc is quantified by the parameter in the units of . Here, the seed photons are assumed to be in the form of a disc blackbody with the optical depth as a free parameter. In all our fits, we consider a Maxwellian distribution of electrons in plasma with a spherical geometry. The seed photon temperature is fixed to 0.1 keV. The disc is assumed to be partially ionized ( erg cm s-1) and to have an inclination angle of in both sources. This model provides constraint on of GRS 1758258 to be keV and that of 1E 1740.72942 to be keV. Optical depth () of GRS 1758258 and 1E 1740.72942 are constrained to be and respectively.
Even though the non-relativistic models provide a good fit, we employ relxillCP model to describe the reflection properties of both BHs because of its large spectral flexibility that allows us to constrain physical parameters. The relativistic reflection model is preferred also because of the inclusion of fundamental physical processes that are generally absent in non-relativistic models. In order to have a statistical comparison of different reflection models, we compare the residuals and the reduced chi-square () of the spectral fits using these models for all the observations. From this, we find that pexiv/pexrav+gauss model yields a better fit in few observations (Example: Epoch NU1.5, Table 9) while in others, best-fit is obtained by relxillCp. As an example, we plot the residual of different models along with the for Epoch AS2.3 observation in Figure 14 where we see that relxillCp yields better fit when compared to all other models in this observation.