LA-UR-22-24121
The Los Alamos evaluation of 239Pu neutron-induced reactions in the fast energy range
Abstract
A major revision of the evaluation of 239Pu neutron-induced reaction cross sections is reported in the fast energy range. The evaluation starts at 2.5 keV incident neutron energy and has been extended up to 30 MeV. Several other notable changes are included in this evaluation since the release of ENDF/B-VIII.0 including the adoption of the Standards fission cross section, inclusion of new radiative capture data of Mosby et al., inclusion of the () data of Méot et al., in addition to advances in the treatment of reaction modeling. In contrast to previous evaluation efforts, this evaluation is reproducible with detailed information stored chronologically utilizing a Git repository. The final evaluation results have been compiled into an ENDF-formatted file, which has been processed successfully through NJOY, checked for internal consistency, benchmarked versus older evaluations and validated against a suite of critical assemblies and pulsed-spheres.
I Introduction
Accurate and reliable nuclear data are mandated by modern applications. The neutron-induced reaction data of 239Pu have a major impact on nuclear reactor design, fuel-cycle analysis and stockpile stewardship, to name but a few [1, 2, 3].
Recently, new experimental data as well as theoretical model advances have become available that justify revisiting the current ENDF/B-VIII.0 evaluation [4]. First of all, new fission cross sections were provided by the Standard committee under the auspices of the IAEA [5, 6], and in part motivated by the release of fissionTPC data [7]. A new evaluation of the Prompt Fission Neutron Spectrum was performed recently [8], making use of recent Chi-Nu and CEA data taken at LANSCE [9, 10, 11] that cover for the first a broad incident and outgoing neutron energy range with high precision. Also, a new, high-precision average prompt fission neutron multiplicity measurement by the CEA/ NNSA collaboration [12] was included, together with modeling from the CGMF fission event generator [13], leveraging a new evaluation by LANL collaborators (Neudecker, Lovell, Talou) [14]. A new measurement of the capture cross sections was performed at LANL by Mosby et al. [15] and additional experimental results became available for the () reaction by Méot [16]. The resolved resonance region (RRR) and unresolved resonance region (URR) parameters have been updated by M. Pigni et al. [17] since ENDF/B-VIII.0. These important changes are combined with advances in nuclear reaction theory modeling in the fast energy range such as including M1 scissors mode in the gamma emission, Engelbrecht-Weidenmueller transformation accounting for the interference between direct and compound nucleus mechanisms. The availability of new data and upgraded theoretical efforts afford essential improvements to the evaluation of 239Pu cross sections.
The new cross sections in the fast neutron range were calculated using modern reaction code CoH [18, 19, 20] with input parameters carefully adjusted to reproduce experimental data. The whole procedure was encapsulated in Python scripts and is perfectly reproducible. This is essential for extending this evaluation procedure to other Pu isotopes using a consistent set of parameters when experimental data are scarce.
The impact of those expected improvements in the fundamental nuclear data stored in evaluated libraries has been carefully studied against a suite of critical assemblies as well as LLNL pulsed-spheres, which are reviewed at the end of this document.
II Evaluation Methodology
We evaluate neutron induced cross sections of 239Pu by combining together differential experimental datasets with theoretical modeling. Reaction cross section data are obtained primarily from the EXFOR repository of experimental data [21]. More recent individual datasets not yet available in EXFOR are also included on a case-by-case basis. We tabulate the individual datasets used for the evaluation of each reaction channel in the sections that follow.
To model cross sections, we employ the Los Alamos statistical Hauser-Feshbach code, CoH [18, 19, 20]. Nuclear structure properties are included from the RIPL-3 database [22]. This code supports an extension of the Hauser-Feshbach theory to the coupled-channels scheme for deformed nuclei, as is the case with the target system, 239Pu. Direct and semi-direct reaction mechanisms, as well as the pre-equilibrium process are also supported in this code.
A Bayesian approach is taken to fit model cross sections to experimental data following the generalized techniques outlined in Hobson et al. (2002) [23]. Individual datasets, enumerated by the variable , are assumed to be independent. Overall the total fit to data is minimized by considered the model discrepancy with each dataset,
| (1) |
where is a measured cross section, is its expected value from a model and is the covariance matrix. The likelihood for each dataset is defined as
| (2) |
The represent a weighting for how important a particular individual dataset is to the fit. It is the choice of the evaluator how to handle . Some datasets are very important in which case they make take on large values, while a relatively inconsequential dataset exhibit smaller values of . A value of represents a dataset that is not included in the fit.
The total likelihood of independent datasets is a product,
| (3) |
where is the set of model parameters, denotes the number of measured data points in the -th dataset, and is the mathematical function defined as . Bayes’ theorem is invoked to find the posterior distribution,
| (4) |
where is the aforementioned total likelihood and is the prior distribution. In this derivation, it is assumed that experimental data uncertainties follows a normal distribution. Using this methodology, there is a strict hierarchy of importance: experimental data is valued above all else, followed by model, followed by derived data that implicitly use model(s) to ascertain a value.
The procedure outlined above is computationally demanding, where Monte Carlo techniques are generally invoked. In order to maintain model consistency throughout the evaluation, we use an incremental approach. We first begin by fitting the model to available total cross section data. This procedure fixes the associated optical model parameters and the resulting neutron transmission coefficients used in the Hauser-Feshbach model. Next, we set fission parameters to closely match the Standards fission cross section of Neudecker et al. [5, 6]. Although the final evaluated fission cross section present in our ENDF-formatted file is taken from the Standards, it is important to calculate this channel relatively well as it impacts all other competing channels computed in CoH. We then study and fix subsequent parameters of the remaining channels in a procedural fashion. When the model is not sufficient to describe differentiate data, as in the case of the (n,) channel, the model may be used as a Bayesian prior in the above framework to generate an evaluated cross section. Model parameters are optimized in the fit so that they may serve as a basis for future evaluation efforts along the Pu isotopic chain where data is sparse.
Our evaluation effort is recorded incrementally using Git version control. Each decision is encapsulated in a single ‘commit’ of the repository and reflects a major choice/change in the evaluation. As an example, a single commit may be an update to model parameters. Another commit may contain information relevant to the inclusion or exclusion of particular data. The different codes of the evaluation are tied together using version 3 of the Los Alamos NEXUS computational nuclear data platform [24]. NEXUS is written in the Python programming language and provides the interface between codes and data. With this methodology it is possible to transfer, run and reproduce the evaluation on any modern computer.
III Total
The target nucleus, 239Pu, is deformed in its ground state and has therefore to be treated in the coupled-channel formalism [19]. The total cross section is calculated with the CoH code with coupling between the ground state and the first six excited states ( keV through keV). These values are listed in Table 1.
| Level number | Excitation Energy (MeV) | Spin-Parity (Jπ) |
| 1 | 0.000000 | |
| 2 | 0.007861 | |
| 3 | 0.057275 | |
| 4 | 0.075705 | |
| 5 | 0.163760 | |
| 6 | 0.192800 | |
| 7 | 0.318500 |
The static quadrupole deformation is set to , slightly lower than the FRDM-calculated value of 0.236 [25]. This value remains fixed during the optimization of the coupled channels calculation. The Soukhovitskii potential is used as the basis for the optical model [26, 27]. The total cross section is the first channel to be fit in our hierarchical modeling procedure.
To optimize the calculated total cross section with respect to available data, , a Metropolis random-walk algorithm is used to probe the optical model parameter space. The parameter space consists of six parameters, including the potential depths, diffuseness and radii. All other model parameters are held fixed during this optimization. It was determined that holding the optical model deformation fixed, rather than letting it vary during the optimization was ideal for approximating the global minimum.
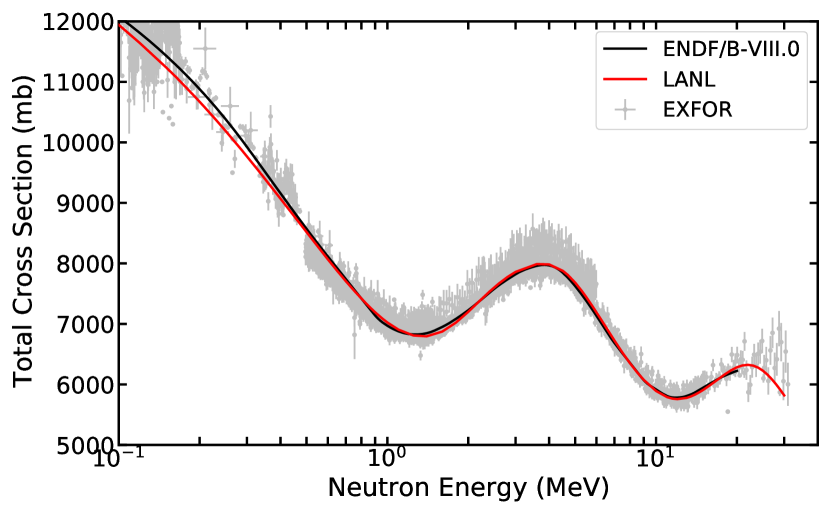
The optimal fit is found by looping over the selected experimental datasets listed in Table 2 and minimizing the chi-square goodness of fit via Bayesian hyperparameter optimization, see e.g. Ref. [23]. The weight of each dataset to the overall fit is approximately determined by the inverse of its mean reported uncertainty in the energy region. The previous ENDF/B-VIII.0 evaluation of the total cross section is also included in the fit and given the highest relative weighting.
This procedure leads to the total cross section fit as shown in Figure 1. An excellent reproduction of the previous ENDF/B-VIII.0 evaluation is observed. Slight modifications are seen relative to ENDF/B-VIII.0 below 30 keV where the reported uncertainties of the datasets pull down the fit to the total cross section. A similar modification, albeit to a much smaller effect, can be found between 1 and 2 MeV near the local minimum of .
| First Author | Energy Range (MeV) | Year | Reference | EXFOR # |
| R.L. Henkel | 0.041-20.5 | 1952 | [28] | 12396005 |
| J.H. Coon | 14.12-14.12 | 1952 | [29] | 12524002 |
| C.T. Hibdon | 0.00115-0.159 | 1954 | [30] | 11002006 |
| P.A. Egelstaff | 2.25-0.07933 | 1958 | [31] | 21032002 |
| A. Bratenahl | 7.05-14.25 | 1958 | [32] | 11155035 |
| J.M. Peterson | 17.3-28.9 | 1960 | [33] | 11108041 |
| D. G.Foster | 2.258-14.965 | 1971 | [34] | 10047100 |
| J. Cabe | 1.105-1.07 | 1973 | [35] | 20480022 - 20480023 |
| K.A. Nadolny | 0.5-30.984 | 1973 | [36] | 10589002 |
| A.B. Smith | 0.65055-1.499 | 1973 | [37] | 10212002 |
| R.B. Schwartz | 0.496-15.17 | 1974 | [38] | 10280007 |
| W.P. Poenitz | 0.048-4.807 | 1981 | [39] | 10935008 |
| W.P. Poenitz | 1.818-20.91 | 1983 | [40] | 12853056 |
| R.R. Spencer | 3.2977-0.016387 | 1987 | [41] | 12941006 |
| J.A. Harvey | 2.8049-0.01553 | 1988 | [42] | 13632002 - 13768011 |
IV Fission
The neutron-induced fission cross section is taken from the Standard evaluation work of D. Neudecker et al. [5, 6]. To avoid repetition, we refer the reader to these external documents for appropriate details. Here, we discuss the parameters used in our modeling that closely reproduce the total fission cross section.
The transmission coefficient for fission is approximated using the Hill-Wheeler formula assuming transmission through a parabolic barrier [43],
| (5) |
where is the fission barrier height, is the associated curvature and is the relative excitation energy of the compound nucleus. The fission barrier parameters (height and curvature) set the form of the inverted parabolic barrier. These parameters are listed in the Table 3. The effective transmission coefficient for fission depends on the number of fission barriers adopted for the particular nucleus. In this work we use a double humped barrier for each nucleus and thus the effective fission transmission coefficient is,
| (6) |
where and are the first and second fission transmission coefficients for each barrier respectively.
| Nucleus | Inner / outer barrier | Barrier height (MeV) | Curvature () |
| 240Pu | inner | 5.76 | 0.44 |
| 240Pu | outer | 5.03 | 0.77 |
| 239Pu | inner | 5.75 | 0.52 |
| 239Pu | outer | 5.45 | 0.68 |
| 238Pu | inner | 5.55 | 0.60 |
| 238Pu | outer | 5.20 | 0.80 |
| 237Pu | inner | 5.80 | 0.80 |
| 237Pu | outer | 5.80 | 0.52 |
| 236Pu | inner | 6.00 | 1.04 |
| 236Pu | outer | 5.00 | 0.60 |
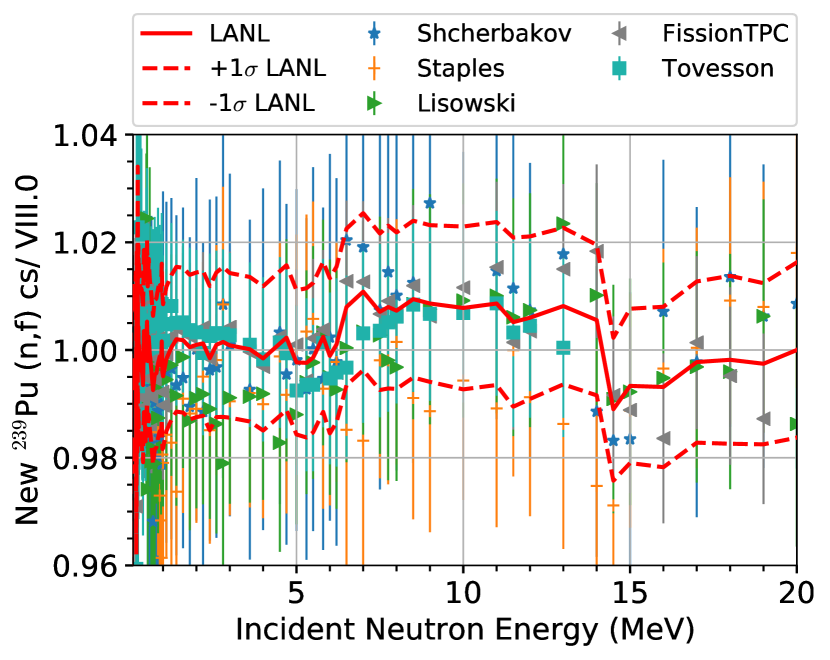
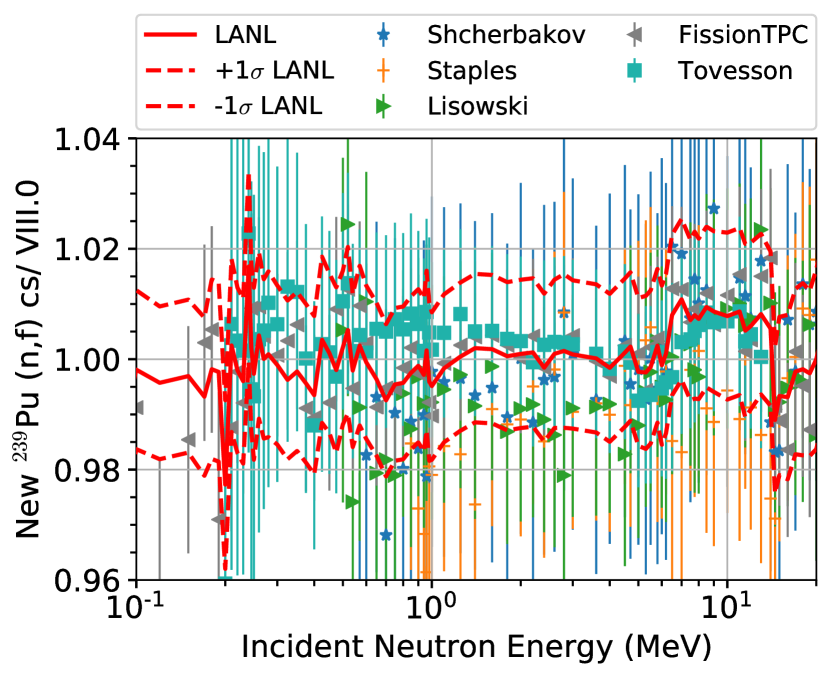
The ratio of the fission cross section with respect to ENDF/B-VIII.0 is shown in Figure 2 across the entire incident energy range considered in ENDF/B-VIII.0. The effect of the FissionTPC and Tovesson data has been to increase the fission cross section, particularly between 7 and 14 MeV. The lower incident energy dependence can be observed by using a log scale on the X-axis as in Figure 3.
V Elastic & Inelastic
A recent theoretical improvement in the treatment of the direct reaction channels in a coupled-channel calculation is the diagonalization of the S-matrix using the Engelbrecht-Weidenmüller (EW) transformation [44]. This development was implemented [45] in the CoH code, resulting in a more realistic treatment of the inelastic cross sections when the direct channels are strongly coupled, which is the case in the study of low-energy neutron-induced reactions on 239Pu.
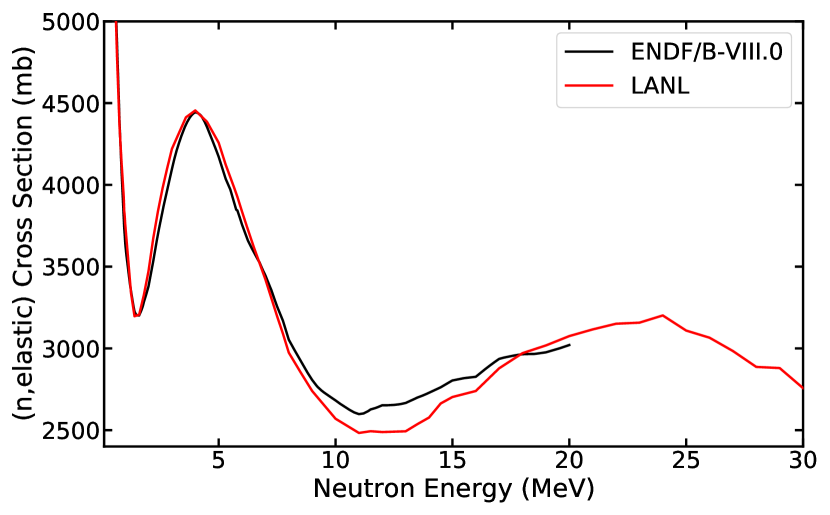
The elastic cross section for 239Pu is shown in Figure 4. In general, our evaluation closely follows ENDF/B-VIII.0. Between 8 and 18 MeV incident energy, the cross section is slightly lower than ENDF/B-VIII.0 owing to a relatively stronger inelastic channel.
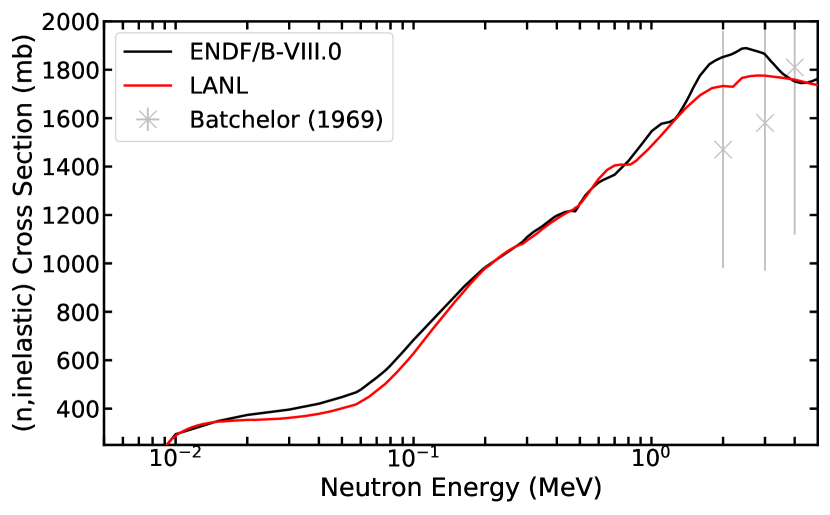
The inelastic cross section is shown in Figure 5 over the entire energy range. Good agreement is found between our evaluation and ENDF/B-VIII.0 with the most notable deviations arising at the missing ENDF hump near 2 MeV and our cross section being larger above 10 MeV. The first deviation can be seen better in Figure 6, which highlights the behavior of the evaluation near threshold.
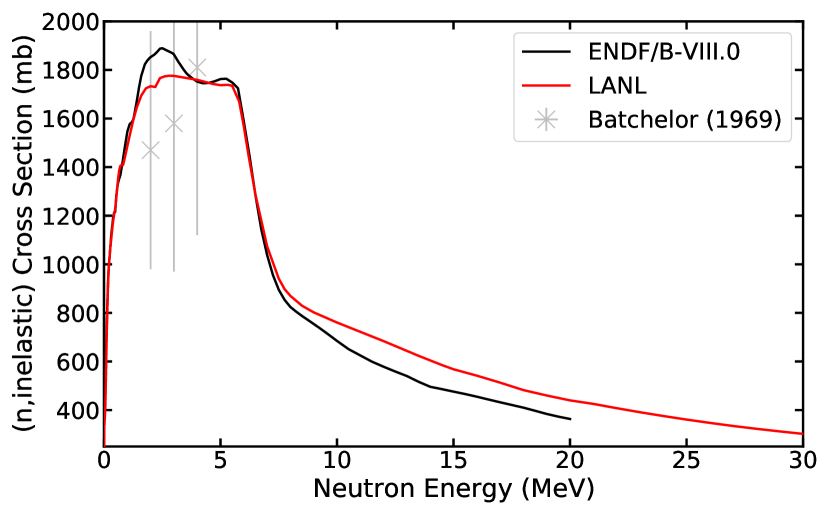
It is well known that deformed nuclei at relatively low excitation energies exhibit a collective nature. This observation can be modeled by the Quasi-particle Random Phase Approximation (QRPA), as shown by Kerveno et al. [46]. The collective excitation can be interpreted as an effective enhancement in the partial state density for 1-particle-1-hole configurations. We therefore update the base CoH model calculation to include a modification to the pre-equilibrium level density. Specifically, the collective enhancement is added to the 1-particle-1-hole state density in the exciton model. The strength of this enhancement is governed by a single parameter which is fit to LLNL pulsed-sphere neutron-leakage spectra [47].
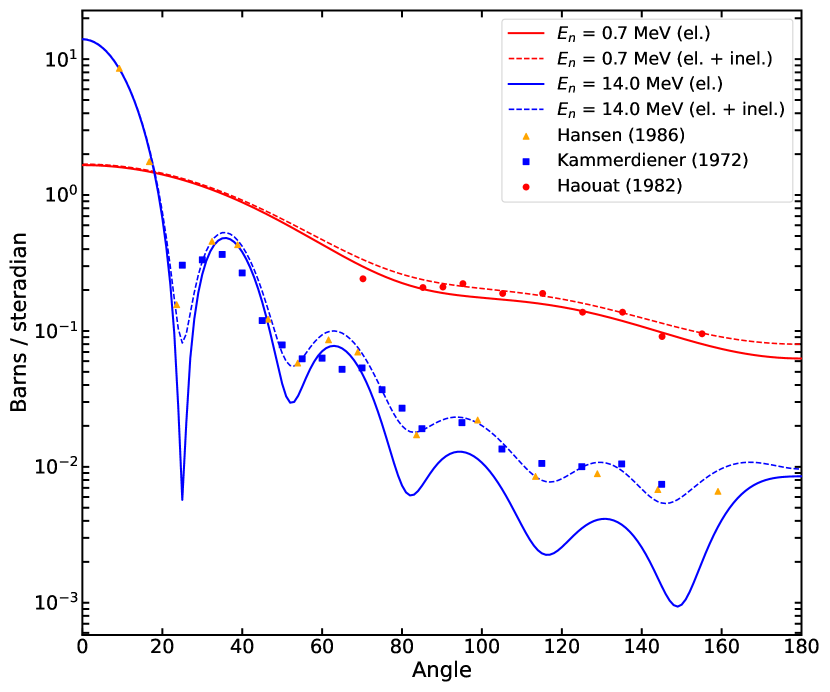
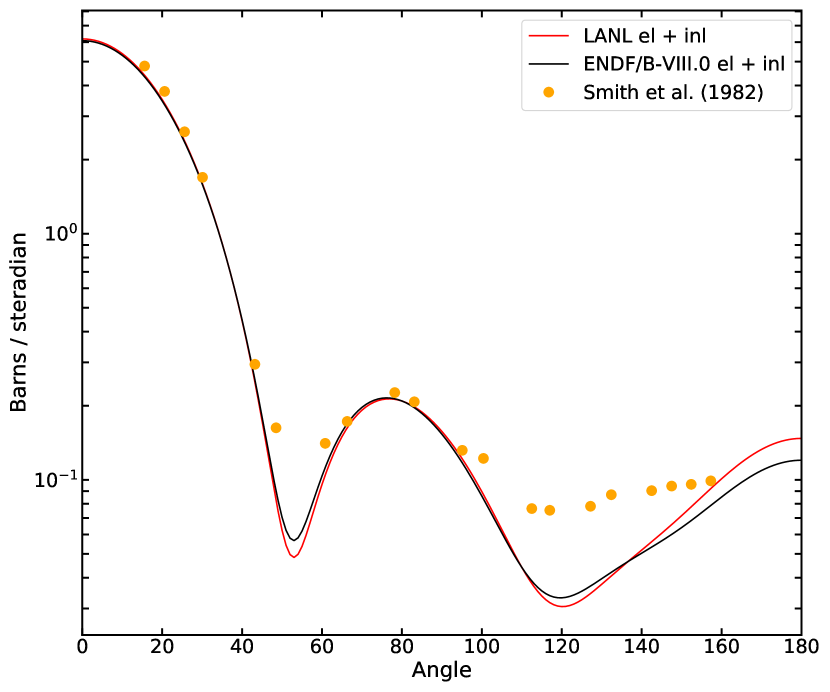
Comparisons are made with select datasets to showcase the the evaluated elastic and inelastic cross sections. Figure 7 shows the angular distributions at incident neutron energies of and MeV. Note that inclusion of the first inelastic level, as shown by the dashed curves, greatly improves the match to the measured data of Haouat et al. (1982) [48] at 0.7 MeV and Hansen et al. (1986) [49] and Kammerdiener et al. (1972) [50] at 14 MeV.
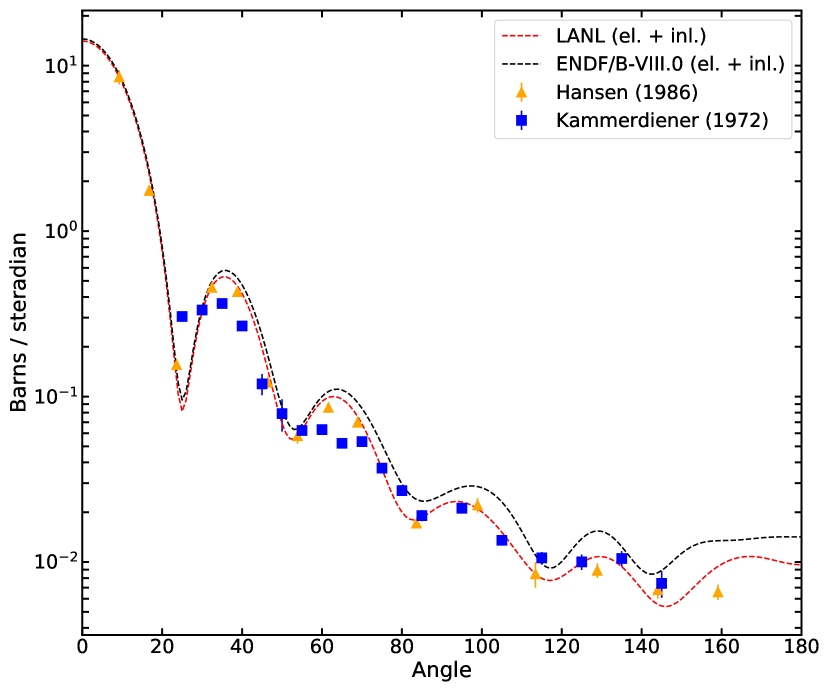
The angular distribution at 14 MeV is plotted again in Figure 8, this time comparing with ENDF/B-VIII.0. Here there is clear improvement over ENDF/B-VIII.0, which generally overshoots data.
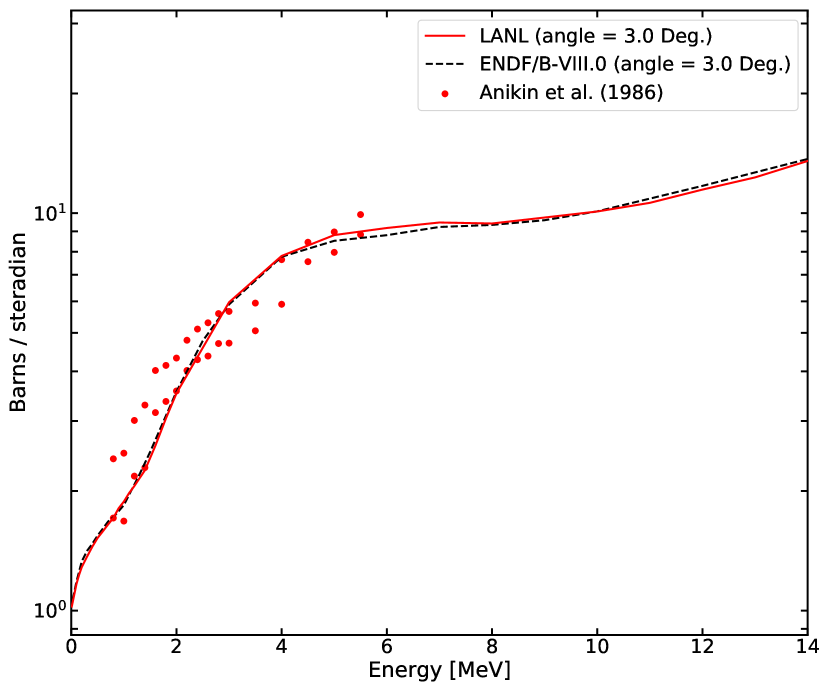
The elastic angular distribution at fixed forward angle of 3 degrees is shown in Figure 9. Overall the new evaluation and ENDF/B-VIII.0 perform similarly. A slight shift upwards relative to ENDF/B-VIII.0 is noted around 5 MeV which brings the evaluation in closer alignment with the data of Anikin et al. (1986) [51].
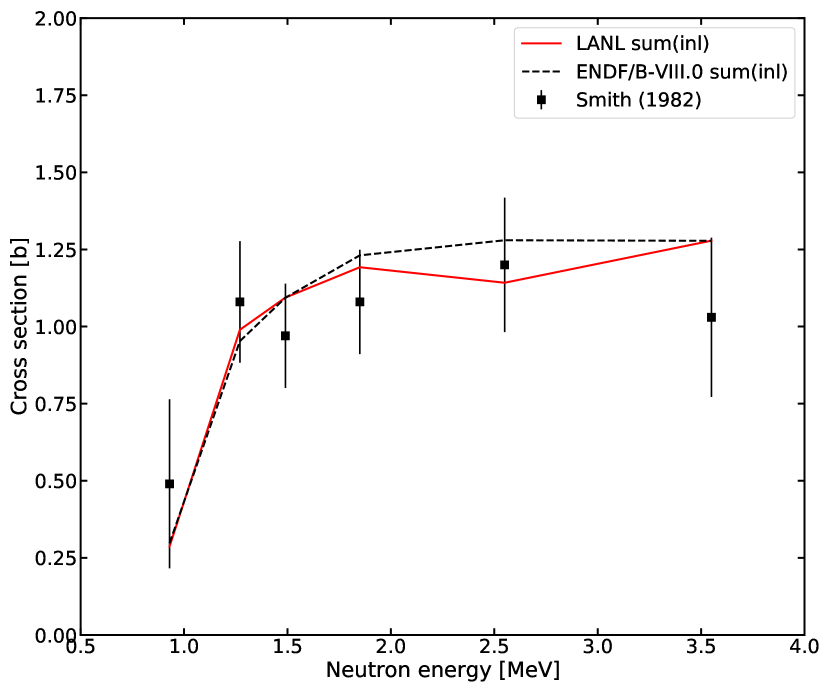
The inelastic cross section constrained by energy level, keV, is shown in Figure 10. This well reproduces the data of Smith et al. (1982) [52]. The angular distribution under the same constraint is shown in Figure 11.
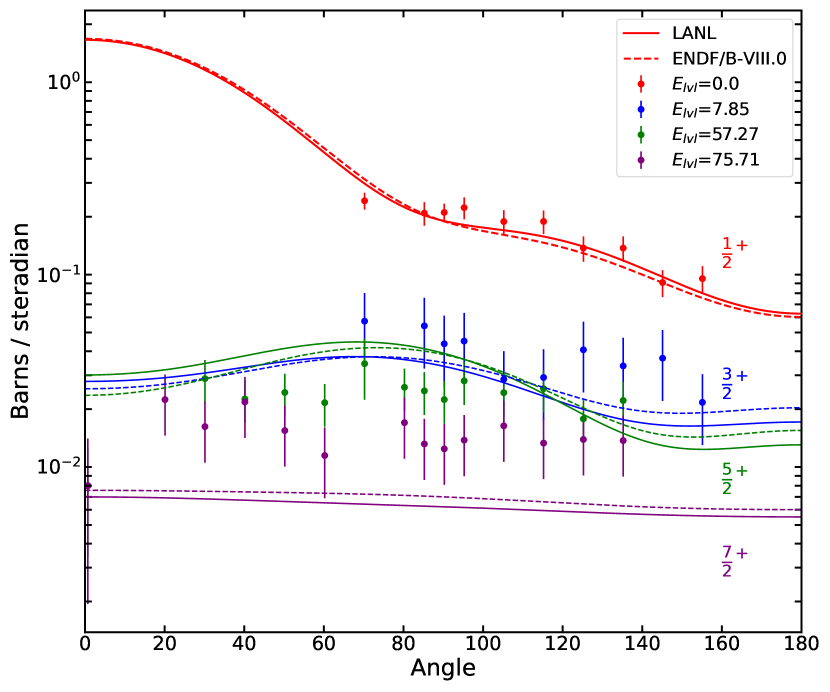
The angular distribution of particular levels in 239Pu are shown in Figure 12. Here the evaluation (solid lines) performs similarly to ENDF/B-VIII.0 (dashed lines).
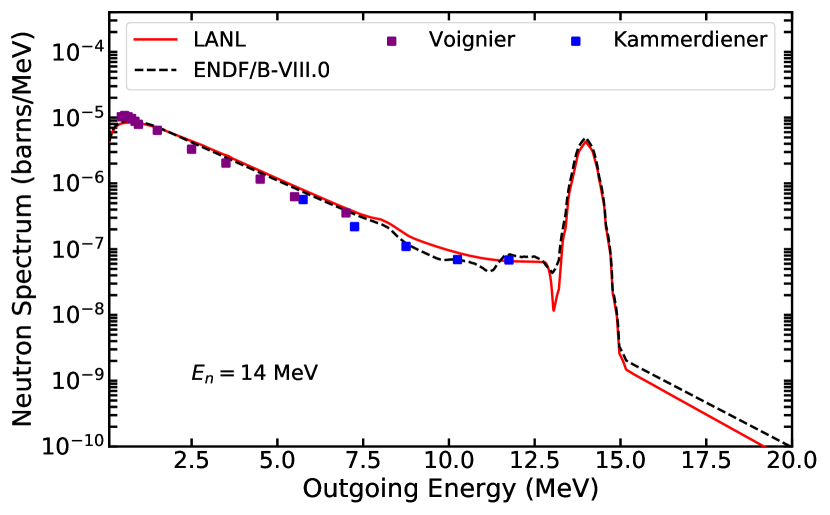
The outgoing neutron spectrum of 239Pu(n,x), where x is any channel is plotted in Figure 13. Here the evaluation is also on par with ENDF/B-VIII.0 albeit slightly higher than Kammerdiener data between 6 and 11 MeV.
VI Radiative Capture
Since the last evaluation of 239Pu in ENDF/B-VIII.0, the most significant experimental development in the capture channel has been the release of the Mosby data [53, 15]. In the fast energy range this dataset fills in a dense region of incident energy points extending up to 1.33 MeV [15]. The data is in good agreement with that of Hopkins et al. (1962) [54] and Gwin et al. (1976) [55]. However, the Mosby data is in tension with Kononov et al. (1975) [56] between 25 and 700 keV, and we therefore reduce the relative weight of the Kononov dataset in our evaluation. The data included in the evaluation are summarized in Table 4.
| First Author | Energy Range (MeV) | Year | Reference |
| J.C. Hopkins | 0.03-1.0 | 1962 | [54] |
| J.A. Farrell | 2.003-0.4318 | 1970 | [57] |
| M.G. Schomberg | 0.00015-0.0275 | 1970 | [58] |
| R. Gwin | 7.5-0.150 | 1976 | [55] |
| V.N. Kononov | 0.015-0.075 | 1975 | [56] |
| S. Mosby | 0.00106-1.333 | 2018 | [15] |
The theoretical model of capture includes the M1 scissors mode enhancement to the capture cross section for 239Pu. This idea comes from the study of Ullmann et al. (2014) [59] who deduced the M1 scissors strength from the experimental capture cross section as well as the -ray multiplicity distributions measured with the DANCE (Detector for Advanced Neutron Capture Experiment) spectrometer at LANSCE (Los Alamos Neutron Science Center). A similar improvement when adding the M1 scissors mode was also reported by Guttormsen et al. (2014) for other nearby actinides [60].
We compute the M1 enhancement by adding a small Lorentzian to the M1 -strength function,
| (7) |
In this equation, is the energy of the -ray and the other quantities are parameters of the scissors mode. For the location of M1 scissors, we assume a mass-dependence proportional to . We also assume that the oscillation amplitude is proportional to the deformation parameter, , in the compound nucleus. From the previous study on 238U [59], we have
| (8) |
which is similar to the theoretical prediction of , where is the Nilsson deformation [61]. More information on this procedure can be found in Ref. [62]. The M1 enhancement removes the artificial scaling factor used in previous evaluations of the (n,) cross section. The result is an improvement of the physical description of capture that is based on measured actinide data. We summarize the parameters of the -strengths used in Table 5.
| Multipole | Energy | Width | Sigma |
| E1 | 11.47 | 3.1 | 310.770 |
| E1 | 14.02 | 5.5 | 401.410 |
| M1 | 6.59 | 4.0 | 1.540 |
| M1 | 2.71 | 1.5 | 1.250 |
| E2 | 10.14 | 3.2 | 6.790 |
| M2 | 6.60 | 4.0 | 0.001 |
| E3 | 10.13 | 3.2 | 0.005 |
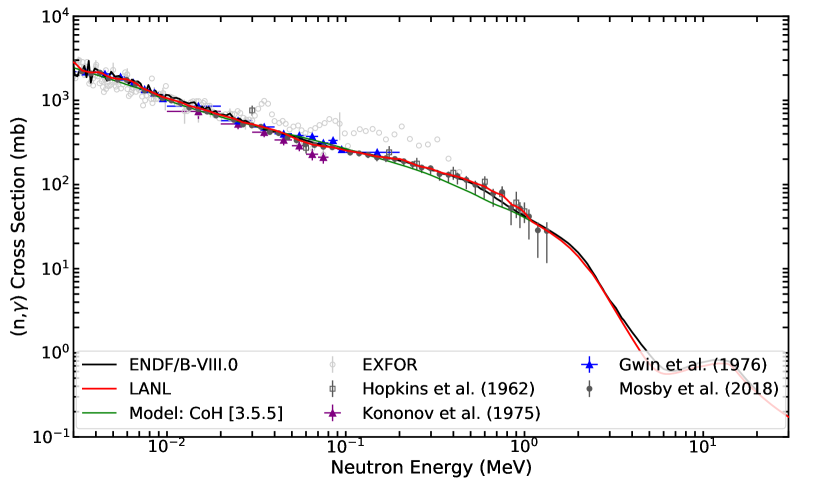
The results of our evaluation for capture are shown in Figure 14. Capture from the model (green curve) represents a good fit to data, but not of sufficient quality for an evaluation. To this end, we use the model as a Bayesian prior and update the cross sections taking into account the high quality data of Mosby, Hopkins and Gwin. This produces the final evaluated (n,) cross section (red curve) shown in Figure 14.
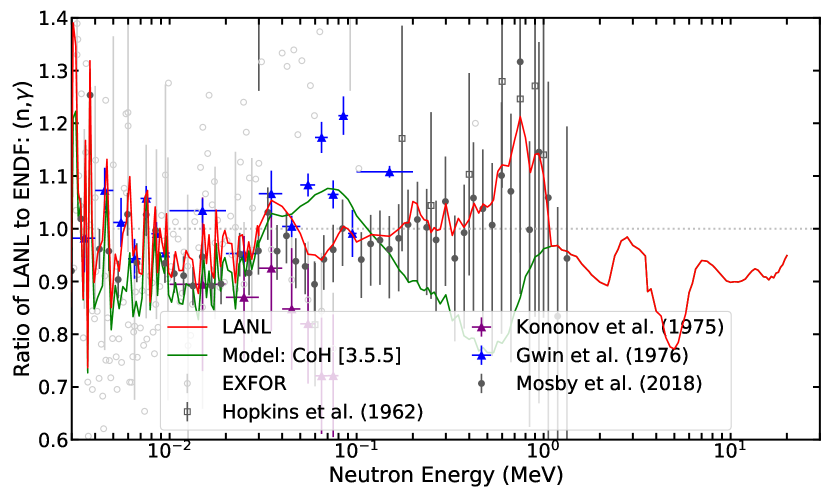
To better understand the changes relative to past work and the CoH model, it is instructive to plot the evaluation in ratio to ENDF/B-VIII.0. As seen in Figure 15, the Mosby data is very influential over nearly the entire energy range. The data of Gwin and Hopkins are influential only in the lower and upper energy ranges respectively. The largest changes relative to the CoH model are found in the energy range between 200 keV and 1 MeV. This region is approximately where the M1 enhancement has been applied; the model being even more deficient in the region without the enhancement. It is therefore of utmost importance to investigate in a similar manner as was done in the case of uranium isotopes (e.g. see [59]) whether or not an even stronger enhancement may be warranted in this case by looking at associated multiplicities. Future studies in this vein are related to better constraining the static quadruple deformation.
As can be verified from inspection of Figure 14, the evaluated cross section is smooth as a function of incident neutron energy (red curve). The same evaluation in Figure 15 shows an oscillatory behavior due to the artificial oscillations in the ENDF/B-VIII.0 evaluation below approximately 40 keV. Modern data disfavors this oscillatory behavior in preference for a smoother trend, which is exhibited by the current effort. Reassuringly, similar behavior is found in other modern evaluations of 239Pu capture [63]; this file may be downloaded by following the link in Ref. [64].
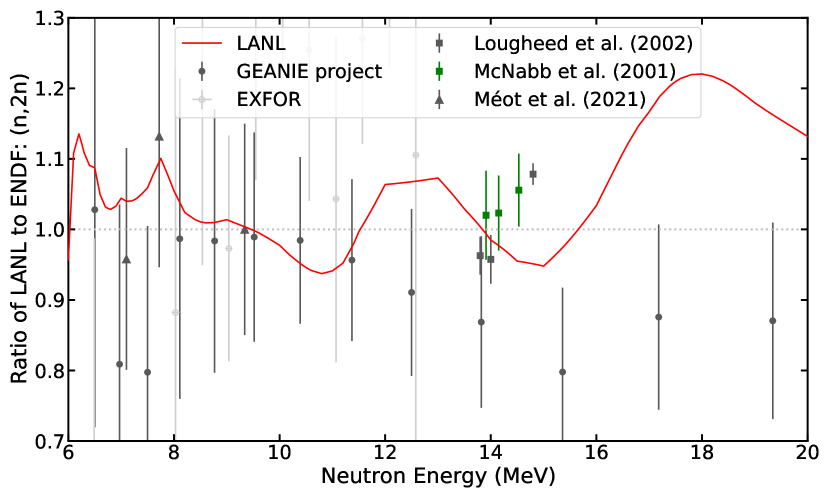
VII (n,2n)
Despite its importance for applications, relatively large uncertainties remain in the behavior of the (n,2n) cross section across the fast energy range. This situation arises due to the high degree of difficulty in performing measurements of this channel.
The primary datasets considered in our evaluation include the work of Bernstein et al. (2002) [65] (GEANIE project), Lougheed et al. (2002) [66] and McNabb et al. (2001) [67]. The remainder of the datasets considered in the evaluation of (n,2n) are listed in Table 6.
Recently, Méot and colleagues reported three new data points in the 7-9 MeV region [16]. The highest incident energy data point was arbitrarily normalized to ENDF/B-VIII.0 at 9.52 MeV which carries an uncertainty of %. This provides two new data points of interest around 7 MeV. Subsequent analysis from Bouland et al. questions the behavior of the (n,2n) cross section rise above threshold [68]. Using statistical model calculations, these authors suggest that the Méot et al. (2021) [16] data in fact be re-normalized with a constant factor of 1.24, thus providing an even faster rise from threshold. Bouland et al. quote a maximum uncertainty on their calculation of %. The precise behavior of the cross section in this energy region and at higher incident energies is under continual scrutiny.
Because data is not sufficiently constraining, the (n,2n) cross section is modeled with the Los Alamos CoH code. Statistical model codes tend to overshoot the (n,2n) cross section in the fast energy range. We found it was necessary to include a modification to the pre-equilibrium level density in order to evaluate this channel. We added a collective enhancement to the 1-particle 1-hole state density in the exciton model. The addition of this enhancement results in a decrease to the (n,2n) cross section, while simultaneously allowing for a description of fission [69]. The value of the collective enhancement parameter was set to 10 in accordance with pulsed spheres integral data. The results of our pulsed spheres simulations are discussed in Section IX. No other model parameter adjustments were required to match available data.
| First Author | Energy Range (MeV) | Year | Reference |
| D.S. Mather | 6.5-9.0 | 1972 | [70] |
| J. Frehaut | 6.49-13.09 | 1986 | [71] |
| L.A. Bernstein | 6.5-21.96 | 2002 | [72, 65] |
| McNabb | 13.8-14.8 | 2001 | [67] |
| R.W. Lougheed | 13.8-14.8 | 2002 | [66] |
| V. Méot | 7.1-9.3 | 2021 | [16] |
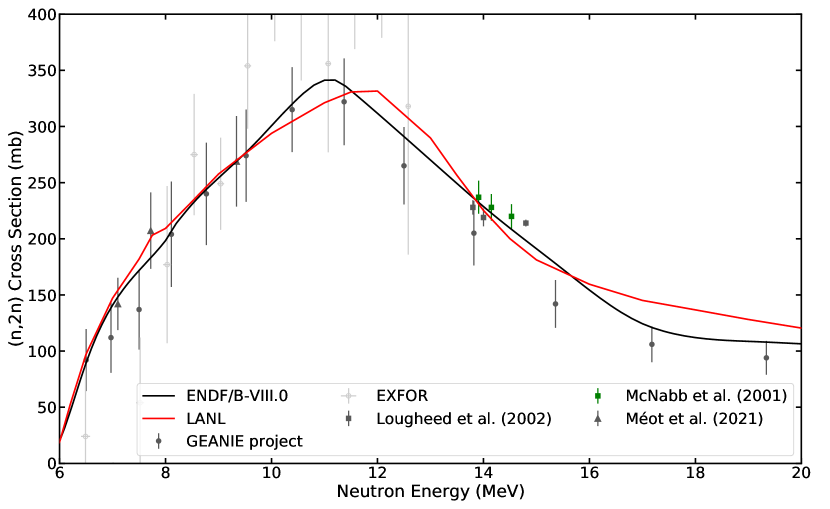
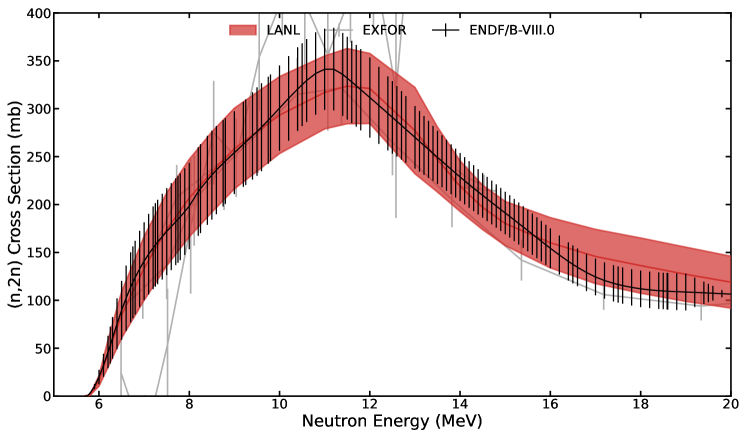
The result of our (n,2n) evaluation procedure is shown in Figure 16. Just above threshold, the evaluation favors the newer Méot data, and generally tracks ENDF/B-VIII.0, albeit slightly higher around 8 MeV. The peak of (n,2n) shifts in our evaluation relative to ENDF/B-VIII.0. The down turn now occurs near 12 MeV, in conjunction with the rise in second chance fission. In contrast, the ENDF/B-VIII.0 evaluation implemented a straight line linear fit from a peak at roughly 11 MeV through the Lougheed and McNabb data. While the cross section value remains the same near 14 MeV, the slope in the current evaluation is more negative, providing a stronger decrease as a function of incident energy. Taken together, these two changes above 12 MeV exhibit a more physical behavior between competing channels as compared with ENDF/B-VIII.0.
The ratio of the (n,2n) evaluation relative to ENDF/B-VIII.0 is shown in Figure 17. Above threshold to approximately 11 MeV, the evaluation closely tracks GEANIE and Méot data. At 14 MeV the Lougheed and McNabb data are favored over GEANIE. Above 15 Mev, the current evaluation is above GEANIE data. However, this dataset can be tracked better with further parameter refinement.
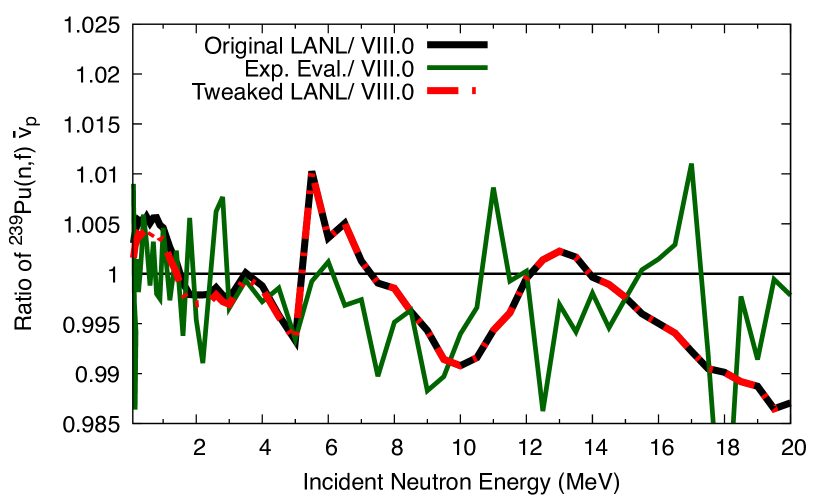
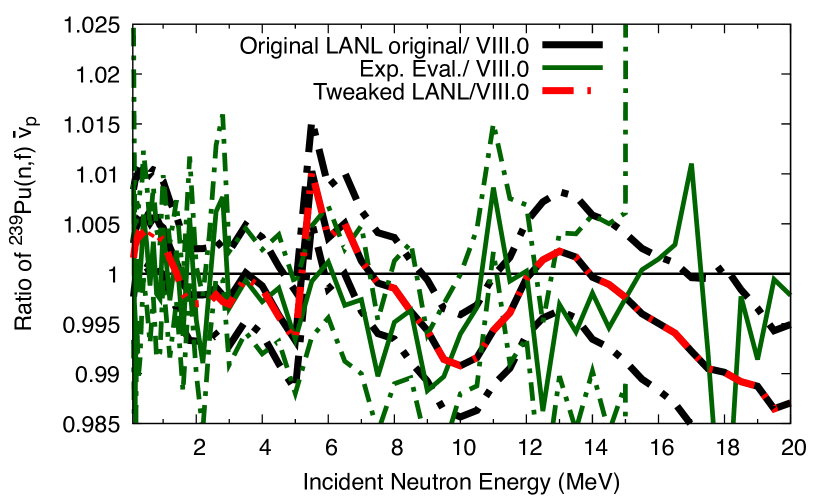
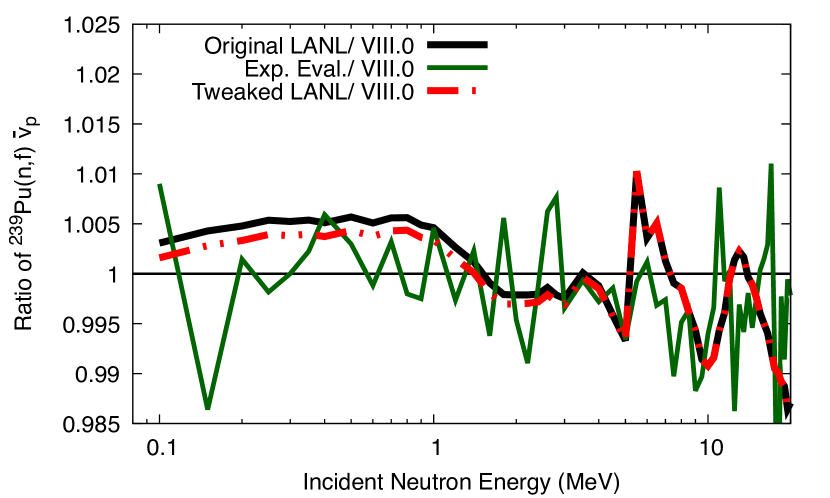
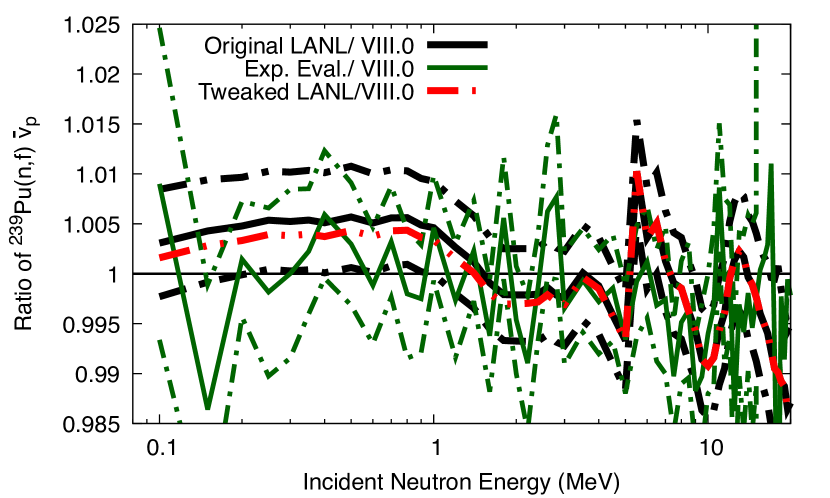
VIII Prompt Fission Neutron Multiplicity ()
The average prompt fission neutron multiplicity () is shown in ratio to ENDF/B-VIII.0 in Figure 18. The black curve represents the evaluation effort of Neudecker, Lovell and Talou [14]; it includes a complete new uncertainty quantification of past experimental data, a new experiment measured by a CEA/ NNSA collaboration [12] and modeling via the CGMF fission event generator [13]. The green curve shows an evaluation based on only experimental data that allows us to study the impact of including the model in the evaluation. The red curve represents the modification enacted to improve the prediction of PU-MET-FAST and PU-MET-INT ICSBEP values.
This modification linearly decreases the as a function of energy, with the largest change occurring at the end of the resonance range, where no constraining experimental data were found and is zero at 5 MeV. This change is well within uncertainties, as can be verified from Fig. 19. A log-scale of these figures are repeated in Figs. 20 and 21 respectively.
IX Integral Benchmarks
Validation results for two different evaluations are discussed and were taken from Ref. [73]:
-
1.
ENDF/B-VIIII.0 [4], and
-
2.
ENDF/B-VIII.0 except for the new 239Pu LANL file from 4/21/2022.
This new file contains the cross section and angular distributions described above. The PFNS was taken from Refs. [8] for 0.5–30 MeV; at thermal, the INDEN evaluation was used. The (n,f) cross section includes updates from Refs. [5, 6] (including experimental covariances updated according to templates of expected measurement uncertainties and fissionTPC data). A modified from Ref. [14] was adopted where there is little constraining experimental data. Otherwise, ENDF/B-VIII.0 239Pu was carried over unchanged from ENDF/B-VIII.0. All validation results were obtained by running MCNP-6.2 [74]. ENDF/B-VIII.0 was used for all other isotopes than 239Pu.
It should be mentioned that ENDF/B-VIII.0 ACE files of 2020 were used including those for thermal-scattering-law kernels. This choice was taken to keep consistency for validation results that started to be calculated in 2020. However, some ACE files changed since then, especially, those for thermal-scattering-law kernels. Default ACE files will be used for ENDF/B-VIII.0 once this file is delivered to CSEWG.
IX.1 Neutron Multiplication Factor of Selected Fast ICSBEP Critical Assemblies
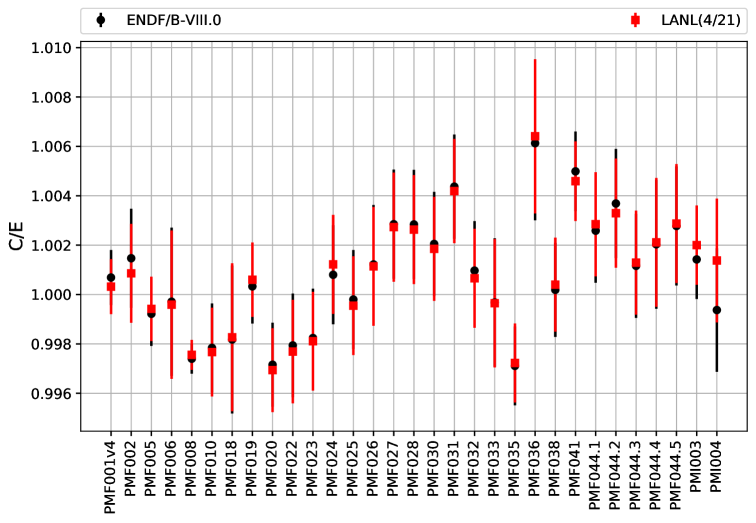
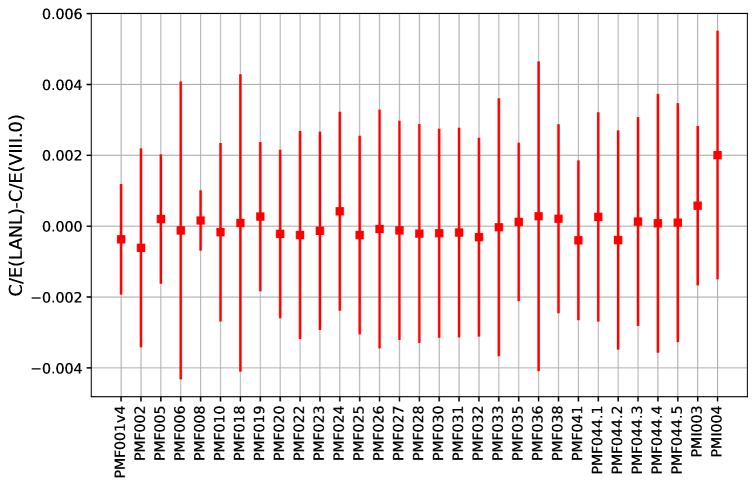
It is shown in Fig. 22 that simulated values of the effective neutron multiplication factor, , of ICSBEP critical assemblies [75] using the new 239Pu file are close to ENDF/B-VIII.0 values for most benchmarks; this is reflected also in a similar mean bias across values simulated with these two evaluated files: The mean bias is 78 pcm for ENDF/B-VIIII.0, while it is 81 pcm for the LANL file. The mean uncertainty on the bias is approximately 10 pcm.
The mean bias is slightly higher (but within the Monte Carlo (MC) uncertainties) for the new file, partially owing to the worse prediction of PMI003 and PMI004 values. However, values of critical assemblies with comparably harder spectra (PMF001v4, PMF002, PMF005, PMF006, etc.) are better described with the new file than ENDF/B-VIII.0. Notably, the difference between simulated Jezebel (PMF001v4) and Flattop values got smaller by 25 pcm for the new file compared to ENDF/B-VIII.0.
IX.2 Effective Delayed Neutron Fraction of Selected Fast Plutonium ICSBEP Critical Assemblies
The effective neutron multiplication factor is one integral quantity that is frequently used to validate nuclear data. Another integral quantity that can be examined is the effective delayed neutron fraction, . The effective delayed neutron fraction has significance in criticality experiments and nuclear reactor applications. This integral quantity describes the fraction of delayed neutrons that contribute to the criticality of the system. This quantity can be calculated with
| (9) |
where is the neutron multiplication factor, and is the prompt neutron multiplication factor. This quantity was calculated with MCNP6.2 [74] using the KOPTS card. The calculated nuclear data library results presented in Table 7 are produced using this method. The measured values are retrieved from the International Reactor Physics Evaluation Project (IRPhEP). The results are presented for two criticality experiments: (1) Jezebel, and (2) Flattop with plutonium core. These two benchmarks have the International Criticality Safety Benchmark Evaluation Project (ICSBEP) handbook denotation of PU-MET-FAST-001v4 and PU-MET-FAST-006, respectively. The results in Table 7 show that the LANL 239Pu evaluation is in better agreement with measured values than ENDF/B VIII.0.
| Calculated | Calculated | ||
| Benchmark | Measured | ENDF/B VIII.0 | LANL |
| PU-MET-FAST-001v4 (Jezebel) | 0.00195(19) | 0.00183(0)* | 0.00185(0)* |
| PU-MET-FAST-006 (Flattop, Pu Core) | 0.00276(23) | 0.00284(4) | 0.00275(4) |
IX.3 Spectral Indexes in Jezebel and Flattop Critical Assemblies
Spectral indexes in the Jezebel critical assembly were calculated with the two combinations of files, ENDF/B-VIII.0, and ENDF/B-VIII.0 including the LANL file, and are shown in Table 8. The aim here was to test how close these values are to those predicted with ENDF/B-VIII.0. Simulated values using the new evaluations are close to ENDF/B-VIII.0 for 239Pu(n,2n)/239Pu(n,f), 238U(n,f)/235U(n,f), 233U(n,f)/235U(n,f), and 239Pu(n,f)/235U(n,f) in Jezebel.
| Observable | VIII.0 | VIII.0+LANL |
| 1.00069(1) | 1.00036(1) | |
| 0.00230(5) | 0.00229(8) | |
| 0.0345(2) | 0.0361(4) | |
| 0.212(1) | 0.211(2) | |
| 0.9768(5) | 0.9706(8) | |
| 1.566(7) | 1.566(11) | |
| x | 1.427(6) | 1.424(10) |
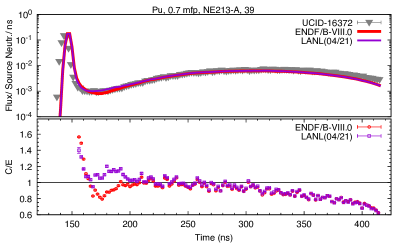
IX.4 LLNL Pulsed-sphere Neutron-leakage Spectra
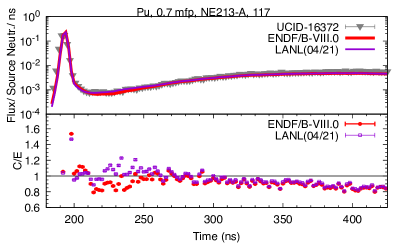
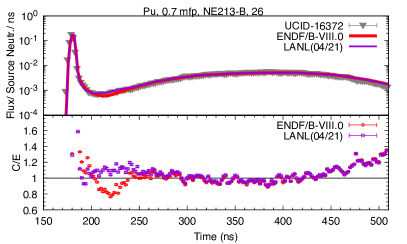
LLNL pulsed spheres [76] allow us to validate 239Pu nuclear data from approximately 10–15 MeV. While the peak of the neutron-leakage spectrum is mostly sensitive to elastic and discrete inelastic scattering, the valley after the peak is strongly influenced by continuum inelastic scattering. After the valley, fission plays a dominant role, especially the PFNS [77]. The new continuum scattering data lead to an improved description of the valley of the neutron-leakage spectra in Fig. 23, while the new PFNS lead to negligible changes for times 270 ns.
X Covariances
The complete covariances may be estimated using the Bayesian fit techniques. The computation of covariances in this technique requires not only high performance computing but also sufficient storage space to store all of the parameter changes and model outputs. These computations are underway. In the meantime, an assumption of a linear response to the parameter changes can be made [78]. In this technique, the posterior covariances for parameters take the form,
| (10) |
where is the prior model parameter covariance matrix, is the experimental data covariance matrix, and is the linear response model sensitivity matrix [79]. The final covariance matrix (function of energy) is,
| (11) |
where is the final parameter covariances computed after looping over all datasets.
For each major reaction channel we show below the variance derived from this procedure, along with the correlation matrix and relative uncertainties.
Figure 24 shows the variances (square root of the diagonal entries of the covariance matrix) along the evaluated total cross section. Figure 25 (a) shows the correlation matrix for the evaluated total cross section and (b) shows the relative uncertainties as a function of incident neutron energy for the evaluated total cross section.
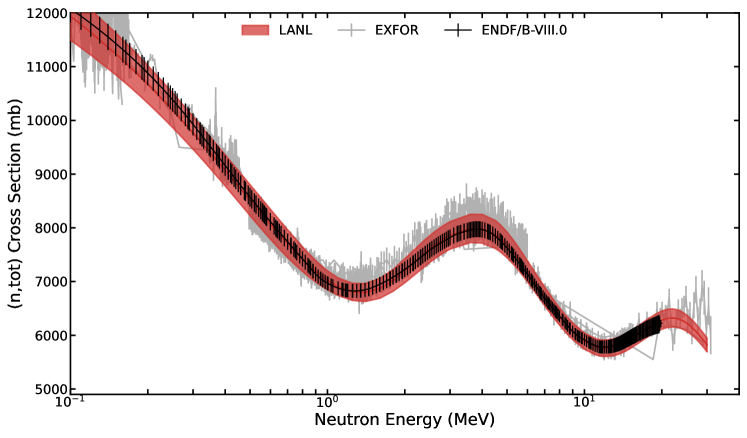
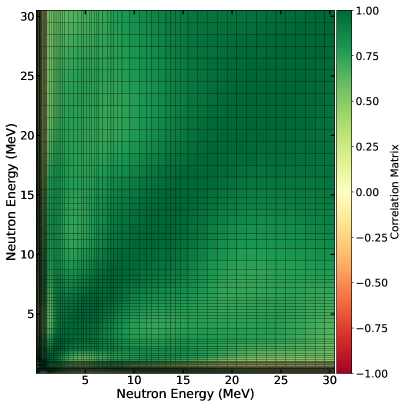
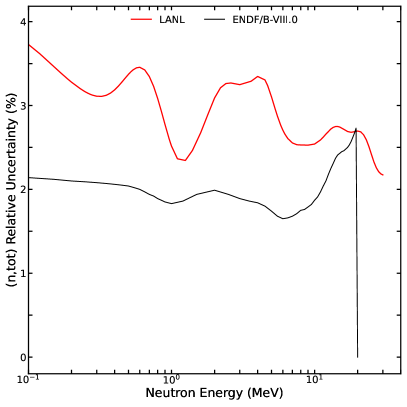
Figure 26 shows the variances (square root of the diagonal entries of the covariance matrix) along the evaluated inelastic cross section. Figure 27 (a) shows the correlation matrix for the evaluated inelastic cross section and (b) shows the relative uncertainties as a function of incident neutron energy for the evaluated inelastic cross section.
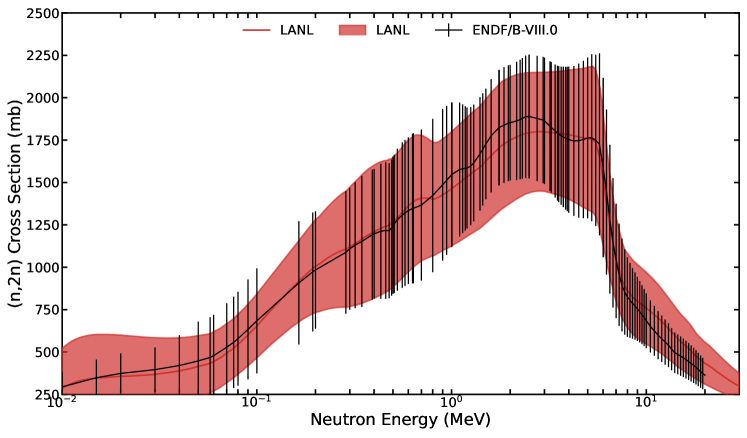
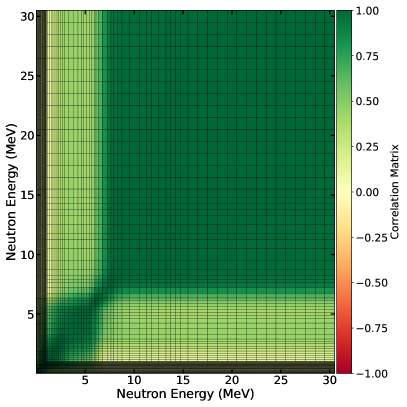
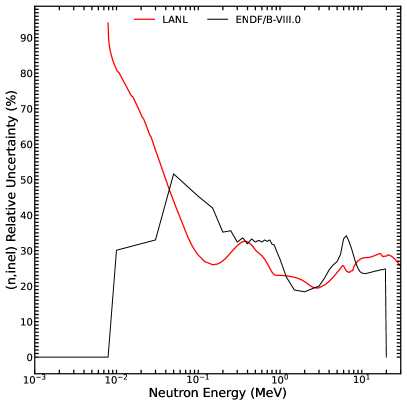
Figure 28 shows the variances (square root of the diagonal entries of the covariance matrix) along the evaluated (n,) cross section. Figure 29 (a) shows the correlation matrix for the evaluated (n,) cross section and (b) shows the relative uncertainties as a function of incident neutron energy for the evaluated (n,) cross section.
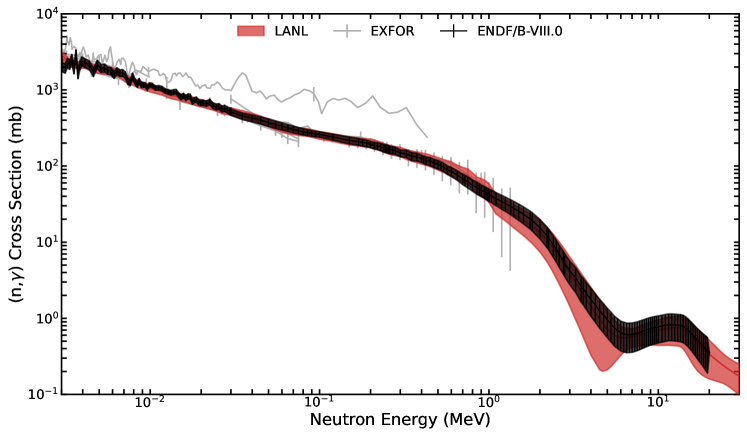
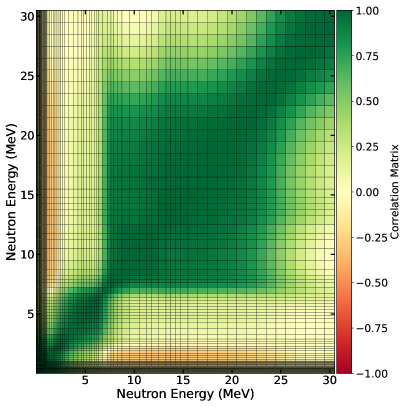
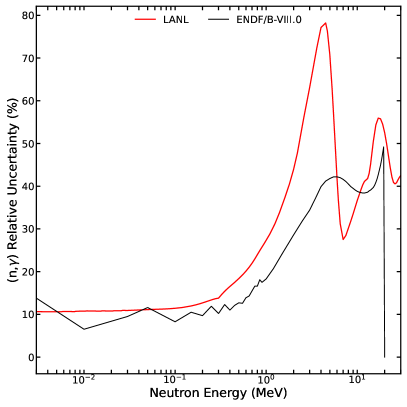
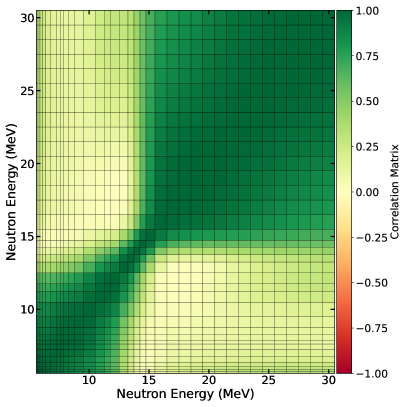
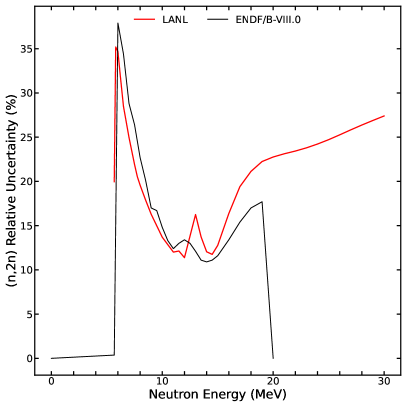
Figure 30 shows the variances (square root of the diagonal entries of the covariance matrix) along the evaluated (n,2n) cross section. Figure 31 (a) shows the correlation matrix for the evaluated (n,2n) cross section and (b) shows the relative uncertainties as a function of incident neutron energy for the evaluated (n,2n) cross section. Note the slight decrease to the relative uncertainties due to the inclusion of the new Meot data.
XI Points of contact
MRM is responsible for the evaluation methodology. TK is the point of contact for the Los Alamos statistical Hauser-Feshbach code, CoH. DN and NK performed the validation and testing. DN evaluated the (n,f) cross section, and PFNS included in the file that was validated, while DN, AEL and PT evaluated the . AEL and IS assisted with covariance and uncertainty methodologies.
XII Acknowledgments
MM thanks R. Capote for valuable discussions. MM thanks M. B. Chadwick for emphasizing the importance of measured data. Work at LANL was carried out under the auspices of the National Nuclear Security Administration (NNSA) of the U.S. Department of Energy (DOE) under contract 89233218CNA000001.
References
- [1] P. Talou, B. Becker, T. Kawano, M. B. Chadwick, and Y. Danon. Advanced monte carlo modeling of prompt fission neutrons for thermal and fast neutron-induced fission reactions on 239-pu. Phys. Rev. C, 83:064612, Jun 2011.
- [2] J. L. Ullmann, E. M. Bond, T. A. Bredeweg, A. Couture, R. C. Haight, M. Jandel, T. Kawano, H. Y. Lee, J. M. O’Donnell, A. C. Hayes, I. Stetcu, T. N. Taddeucci, P. Talou, D. J. Vieira, J. B. Wilhelmy, J. A. Becker, A. Chyzh, J. Gostic, R. Henderson, E. Kwan, and C. Y. Wu. Prompt -ray production in neutron-induced fission of 239pu. Phys. Rev. C, 87:044607, Apr 2013.
- [3] B. Becker, P. Talou, T. Kawano, Y. Danon, and I. Stetcu. Monte carlo hauser-feshbach predictions of prompt fission gamma-rays. Phys. Rev. C, 87:014617, Jan 2013.
- [4] D. A. Brown, M. B. Chadwick, R. Capote, A. C. Kahler, A. Trkov, M. W. Herman, A. A. Sonzogni, Y. Danon, A. D. Carlson, M. Dunn, D. L. Smith, G. M. Hale, G. Arbanas, R. Arcilla, C. R. Bates, B. Beck, B. Becker, F. Brown, R. J. Casperson, J. Conlin, D. E. Cullen, M. A. Descalle, R. Firestone, T. Gaines, K. H. Guber, A. I. Hawari, J. Holmes, T. D. Johnson, T. Kawano, B. C. Kiedrowski, A. J. Koning, S. Kopecky, L. Leal, J. P. Lestone, C. Lubitz, J. I. Márquez Damián, C. M. Mattoon, E. A. McCutchan, S. Mughabghab, P. Navratil, D. Neudecker, G. P. A. Nobre, G. Noguere, M. Paris, M. T. Pigni, A. J. Plompen, B. Pritychenko, V. G. Pronyaev, D. Roubtsov, D. Rochman, P. Romano, P. Schillebeeckx, S. Simakov, M. Sin, I. Sirakov, B. Sleaford, V. Sobes, E. S. Soukhovitskii, I. Stetcu, P. Talou, I. Thompson, S. van der Marck, L. Welser-Sherrill, D. Wiarda, M. White, J. L. Wormald, R. Q. Wright, M. Zerkle, G. Žerovnik, and Y. Zhu. Endf/b-viii.0: The 8th major release of the nuclear reaction data library with cielo-project cross sections, new standards and thermal scattering data. Nuclear Data Sheets, 148:1 – 142, 2018.
- [5] D. Neudecker, D.L. Smith, F. Tovesson, R. Capote, M.C. White, N.S. Bowden, L. Snyder, A.D. Carlson, R.J. Casperson, V. Pronyaev, S. Sangiorgio, K.T. Schmitt, B. Seilhan, N. Walsh, and W. Younes. Applying a template of expected uncertainties to updating 239pu(n,f) cross-section covariances in the neutron data standards database. Nuclear Data Sheets, 163:228–248, 2020.
- [6] Denise Neudecker, Vladimir G. Pronyaev, and Luke Snyder. Including 238u(n,f)/235u(n,f) and 239pu(n,f)/235u(n,f) niffte fission tpc cross-sections into the neutron data standards database. 6 2021.
- [7] L. A. Snyder. Preliminary 235u(n,f)/6li(n,t)a cross section ratio data and update on the 239pu(n,f)/235u(n,f) cross section ratio (fissiontpc fy2019 report). 9 2019.
- [8] D. Neudecker, K.J. Kelly, and P. Marini. Release of Evaluated 239Pu(n,f) Prompt Fission Neutron Spectra Including the CEA and Chi-Nu High-precision Experimental Data. Technical Report LA-UR-22-23754, Los Alamos National Laboratory, 2022.
- [9] K. J. Kelly, M. Devlin, J. M. O’Donnell, J. A. Gomez, D. Neudecker, R. C. Haight, T. N. Taddeucci, S. M. Mosby, H. Y. Lee, C. Y. Wu, R. Henderson, P. Talou, T. Kawano, A. E. Lovell, M. C. White, J. L. Ullmann, N. Fotiades, J. Henderson, and M. Q. Buckner. Measurement of the prompt fission neutron spectrum from 10 kev to 10 mev induced by neutrons of energy 1–20 mev. Phys. Rev. C, 102:034615, Sep 2020.
- [10] P. Marini, J. Taieb, B. Laurent, G. Belier, A. Chatillon, D. Etasse, P. Morfouace, M. Devlin, J. A. Gomez, R. C. Haight, K. J. Kelly, J. M. O’Donnell, and K. T. Schmitt. Prompt-fission-neutron spectra in the reaction. Phys. Rev. C, 101:044614, Apr 2020.
- [11] K.J. Kelly, P. Marini, J. Taieb, M. Devlin, D. Neudecker, R.C. Haight, G. Bélier, B. Laurent, P. Morfouace, J.M. O’Donnell, E. Bauge, M.B. Chadwick, A. Chatillon, D. Etasse, P. Talou, M.C. White, C.Y. Wu, and E.A. Bennett. Comparison of results from recent nnsa and cea measurements of the 239pu(n, f) prompt fission neutron spectrum. Nuclear Data Sheets, 173:42–53, 2021. Special Issue on Nuclear Reaction Data.
- [12] P. Marini, J. Taieb, D. Neudecker, G. Bélier, A. Chatillon, D. Etasse, B. Laurent, P. Morfouace, B. Morillon, M. Devlin, J. A. Gomez, R. C. Haight, K. J. Kelly, and J. M. O’Donnell. Energy dependence of prompt fission neutron multiplicity in the 239pu() reaction, 2021.
- [13] P. Talou, I. Stetcu, P. Jaffke, M.E. Rising, A.E. Lovell, and T. Kawano. Fission fragment decay simulations with the CGMF code. Computer Physics Communications, 269:108087, dec 2021.
- [14] D. Neudecker, A.E. Lovell, and P. Talou. Producing endf/b-quality evaluations of 239pu(n,f) and 235u(n,f) average prompt neutron multiplicities using the cgmf model. Technical Report LA-UR-21-29906, Los Alamos National Laboratory, 20221.
- [15] S. Mosby, T.A. Bredeweg, A. Couture, M. Jandel, T. Kawano, J. Ullmann, R.A. Henderson, and C.Y. Wu. 239pu(n,) from 10 ev to 1.3 mev. Nuclear Data Sheets, 148:312–321, 2018. Special Issue on Nuclear Reaction Data.
- [16] Vincent Méot, Olivier Roig, Benoit Laurent, Pascal Morel, Jean Aupiais, Olivier Delaune, Gérard Haouat, and Olivier Bouland. cross section measurement using a recoil method. Phys. Rev. C, 103:054609, May 2021.
- [17] Pigni M., R. Capote, and A. Trkov. Inden - international nuclear data evaluation network network managed by the international atomic energy agency. https://www-nds.iaea.org/INDEN/.
- [18] Toshihiko Kawano. Unified coupled-channels and hauser-feshbach model calculation for nuclear data evaluation, 2019.
- [19] Toshihiko Kawano. Unified description of the coupled-channels and statistical Hauser-Feshbach nuclear reaction theories for low energy neutron incident reactions. European Physical Journal A, 57(1):16, January 2021.
- [20] Toshihiko Kawano. Coh3: The coupled-channels and hauser-feshbach code. In Jutta Escher, Yoram Alhassid, Lee A. Bernstein, David Brown, Carla Frohlich, Patrick Talou, and Walid Younes, editors, Compound-Nuclear Reactions, pages 27–34, Cham, 2021. Springer International Publishing.
- [21] N. Otuka, E. Dupont, V. Semkova, B. Pritychenko, A.I. Blokhin, M. Aikawa, S. Babykina, M. Bossant, G. Chen, S. Dunaeva, R.A. Forrest, T. Fukahori, N. Furutachi, S. Ganesan, Z. Ge, O.O. Gritzay, M. Herman, S. Hlavač, K. Katō, B. Lalremruata, Y.O. Lee, A. Makinaga, K. Matsumoto, M. Mikhaylyukova, G. Pikulina, V.G. Pronyaev, A. Saxena, O. Schwerer, S.P. Simakov, N. Soppera, R. Suzuki, S. Takács, X. Tao, S. Taova, F. Tárkányi, V.V. Varlamov, J. Wang, S.C. Yang, V. Zerkin, and Y. Zhuang. Towards a more complete and accurate experimental nuclear reaction data library (exfor): International collaboration between nuclear reaction data centres (nrdc). Nuclear Data Sheets, 120:272–276, 2014.
- [22] R. Capote, M. Herman, P. Obložinský, P.G. Young, S. Goriely, T. Belgya, A.V. Ignatyuk, A.J. Koning, S. Hilaire, V.A. Plujko, M. Avrigeanu, O. Bersillon, M.B. Chadwick, T. Fukahori, Zhigang Ge, Yinlu Han, S. Kailas, J. Kopecky, V.M. Maslov, G. Reffo, M. Sin, E.Sh. Soukhovitskii, and P. Talou. Ripl – reference input parameter library for calculation of nuclear reactions and nuclear data evaluations. Nuclear Data Sheets, 110(12):3107–3214, 2009. Special Issue on Nuclear Reaction Data.
- [23] M. P. Hobson, S. L. Bridle, and O. Lahav. Combining cosmological data sets: hyperparameters and Bayesian evidence. MNRAS, 335(2):377–388, September 2002.
- [24] M. R. Mumpower, M. Verriere, A. E. Lovell, T. Kawano, I. Stetcu, and P. Talou. The Los Alamos fission yield evaluation pipeline. In European Physical Journal Web of Conferences, volume 242 of European Physical Journal Web of Conferences, page 05002, October 2020.
- [25] P. Möller, A. J. Sierk, T. Ichikawa, and H. Sagawa. Nuclear ground-state masses and deformations: FRDM(2012). At. Data Nucl. Data Tables, 109:1, 2016.
- [26] E. Sh. Soukhovitskii, R. Capote, J. M. Quesada, and S. Chiba. Dispersive coupled-channel analysis of nucleon scattering from up to 200 mev. Phys. Rev. C, 72:024604, Aug 2005.
- [27] R. Capote, E. Sh. Soukhovitskii, J. M. Quesada, and S. Chiba. Is a global coupled-channel dispersive optical model potential for actinides feasible? Phys. Rev. C, 72:064610, Dec 2005.
- [28] R. L. Henkel, L. Cranberg, R.B. Day, G. A. Jarvis, and J. E. Perry R. Nobles. Total neutron cross sections for 235u, normal uranium, 239pu. Technical report, 1952.
- [29] J. H. Coon, E. R. Graves, and H. H. Barschall. Total cross sections for 14-mev neutrons. Phys. Rev., 88:562–564, Nov 1952.
- [30] C. T. Hibdon and A. Langsdorf. Total neutron cross sections in the kev region. Technical report, 1954.
- [31] The slow-neutron resonance behavior of plutonium isotopes. Journal of Nuclear Energy, 6:303, 1958.
- [32] A. Bratenahl, J. M. Peterson, and J.P. Stoering. Neutron total cross sections in the 7- to 14-mev region. Physical Review, 110:927, 1958.
- [33] J. M. Peterson, A. Bratenahl, and J.P. Stoering. Neutron total cross sections in the 17- to 29-mev region. Physical Review, 120:521, 1960.
- [34] D. Graham Foster and Dale W. Glasgow. Neutron total cross sections, 2.5-15 mev. i. experimental. Phys. Rev. C, 3:576–603, Feb 1971.
- [35] J. Cabe and M. Cance. Measurements of the neutron total cross-sections of be,b-11,c,al,si,s,ti,v,ni,u-235,u-238,pu-239 between 100 kev and 6 mev. CEA-R-4524, 1973.
- [36] K.A. Nadolny, F.L. Green, and P. Stoler. Total neutron cross section of 239pu. Prog: Report to the U.S. Nuclear Data Comm., 1973.
- [37] A Smith, P Guenther, and J Whalen. Total and elastic scattering neutron cross sections of 239pu. J. Nucl. Energy, v. 27, no. 5, pp. 317-325, 5 1973.
- [38] R. B. Schwartz, R. A. Schrack, and H. T. Heaton II. Total neutron cross sections of u-235, u-238 and pu-239. Nuclear Science and Engineering, 54:322, 1974.
- [39] W. P. Poenitz, J. F. Whalen, and A. B. Smith. Total neutron cross sections of heavy nuclei. Nuclear Science and Engineering, 78(4):333–341, 1981.
- [40] W P Poenitz and J F Whalen. Neutron total cross section measurements in the energy region from 47 kev to 20 mev. 5 1983.
- [41] R. Spencer, J. A. Harvey, N. W. Hill, and L. W. Weston. Parameters of the 1.056-ev resonance in 240pu and the 2200 m/s neutron total cross sections of 235u, 239pu, and 240pu. Nuclear Science and Engineering, 96(4):318–329, 1987.
- [42] John A. Harvey, N. W. Hill, F. G. Perey, G. L. Tweed, and Luiz C. Leal. High-resolution neutron transmission measurements on 235/u, 239pu, and 238u. 1988.
- [43] D. L. Hill and J. A. Wheeler. Nuclear Constitution and the Interpretation of Fission Phenomena. Physical Review, 89:1102–1145, March 1953.
- [44] C. A. Engelbrecht and Hans A. Weidenmüller. Hauser-feshbach theory and ericson fluctuations in the presence of direct reactions. Phys. Rev. C, 8:859–862, Sep 1973.
- [45] T. Kawano, R. Capote, S. Hilaire, and P. Chau Huu-Tai. Statistical hauser-feshbach theory with width-fluctuation correction including direct reaction channels for neutron-induced reactions at low energies. Phys. Rev. C, 94:014612, Jul 2016.
- [46] M. Kerveno, M. Dupuis, A. Bacquias, F. Belloni, D. Bernard, C. Borcea, M. Boromiza, R. Capote, C. De Saint Jean, P. Dessagne, J. C. Drohé, G. Henning, S. Hilaire, T. Kawano, P. Leconte, N. Nankov, A. Negret, M. Nyman, A. Olacel, A. J. M. Plompen, P. Romain, C. Rouki, G. Rudolf, M. Stanoiu, and R. Wynants. Measurement of ) cross section data and their impact on reaction models. Phys. Rev. C, 104:044605, Oct 2021.
- [47] C. Wong, J. Anderson, P. Brown, L. F. Hansen, J. L. Kammerdiener, C. Logan, and B. Pohl. Livermore pulsed sphere program: Program summary through july 1971. LLNL UCRL-51144 Rev. 1, 1972.
- [48] G. Haouat, J. Lachkar, Ch. Lagrange, J. Jary, J. Sigaud, and Y. Patin. Nuclear science and engineering, 81:491–511, 1982.
- [49] L. F. Hansen, B. A. Pohl, C. Wong, R. C. Haight, and Ch. Lagrange. Measurements and calculations of neutron scattering in the actinide region. Phys. Rev. C, 34:2075–2083, Dec 1986.
- [50] John Luther Kammerdiener. Neutron spectra emitted by 239pu, 238u, 235u, pb, nb, ni, al, and c irradiated by 14 mev neutrons. 7 1972.
- [51] G. V. Anikin and I. I. Kotukhov. Cross sections for the forward scattering of fast neutrons by238u and239pu nuclei. Soviet Atomic Energy, 60(1):66–70, Jan 1986.
- [52] A.B. Smith and P.T. Guenther. On neutron inelastic-scattering cross sections of 232th, 233u, 235u, 238u, 239pu and 240pu. Technical Report ANL-NDM-63, 1982.
- [53] S. Mosby, T. A. Bredeweg, A. Chyzh, A. Couture, R. Henderson, M. Jandel, E. Kwan, J. M. O’Donnell, J. Ullmann, and C. Y. Wu. Improved neutron capture cross section of . Phys. Rev. C, 89:034610, Mar 2014.
- [54] J. C. Hopkins and B. C. Diven. Neutron capture to fission ratios in u233, u235, pu233. Nuclear Science and Engineering, 12(2):169–177, 1962.
- [55] R. Gwin, E. G. Silver, R. W. Ingle, and H. Weaver. Measurement of the neutron capture and fission cross sections of 239pu and 235u, 0.02 ev to 200 kev, the neutron capture cross sections of 197au, 10 to 50 kev, and neutron fission cross sections of 233u, 5 to 200 kev. Nuclear Science and Engineering, 59(2):79–105, 1976.
- [56] V.N. Kononov, E.D. Poletayev, and B.D. Yurlov. The measurement of alpha, neutron fission and capture cross sections for uranium-235 and plutonium-239 for neutron energies from 10 to 80 kev. At.Energ., 38:82, 1975.
- [57] J A Farrell, G F Auchampaugh, M S Moore, and P A Seeger. Simultaneous measurement of the fission, capture, scattering, and total cross-sections of pu. pp 543-50 of Nuclear Data for Reactors. Vol. I. Vienna International Atomic Energy Agency (1970)., 1 1970.
- [58] M G Schomberg, M G Sowerby, D A Boyce, K J Murray, and D L Sutton. Ratio of the capture and fission cross-sections of pu in the energy range 100 ev to 30 kev. pp 315-30 of Nuclear Data for Reactors. Vol. I. Vienna International Atomic Energy Agency (1970)., 1 1970.
- [59] J. L. Ullmann, T. Kawano, T. A. Bredeweg, A. Couture, R. C. Haight, M. Jandel, J. M. O’Donnell, R. S. Rundberg, D. J. Vieira, J. B. Wilhelmy, J. A. Becker, A. Chyzh, C. Y. Wu, B. Baramsai, G. E. Mitchell, and M. Krtička. Cross section and -ray spectra for (,) measured with the dance detector array at the los alamos neutron science center. Phys. Rev. C, 89:034603, Mar 2014.
- [60] M. Guttormsen, L. A. Bernstein, A. Görgen, B. Jurado, S. Siem, M. Aiche, Q. Ducasse, F. Giacoppo, F. Gunsing, T. W. Hagen, A. C. Larsen, M. Lebois, B. Leniau, T. Renstrøm, S. J. Rose, T. G. Tornyi, G. M. Tveten, M. Wiedeking, and J. N. Wilson. Scissors resonance in the quasicontinuum of , , and isotopes. Phys. Rev. C, 89:014302, Jan 2014.
- [61] D. R. Bes and R. A. Broglia. Rotational isovector mode in deformed nuclei. Physics Letters B, 137(3):141 – 144, 1984.
- [62] M. R. Mumpower, T. Kawano, J. L. Ullmann, M. Krtička, and T. M. Sprouse. Estimation of M1 scissors mode strength for deformed nuclei in the medium- to heavy-mass region by statistical Hauser-Feshbach model calculations. Phys. Rev. C, 96(2):024612, August 2017.
- [63] R. Capote. Inden - international nuclear data evaluation network network managed by the international atomic energy agency. https://www-nds.iaea.org/INDEN/.
- [64] R. Capote. Inden - international nuclear data evaluation network network managed by the international atomic energy agency. https://nds.iaea.org/INDEN/data/pu239e80p49a_ENDF.zip.
- [65] L. A. Bernstein, J. A. Becker, P. E. Garrett, W. Younes, D. P. McNabb, D. E. Archer, C. A. McGrath, H. Chen, W. E. Ormand, M. A. Stoyer, R. O. Nelson, M. B. Chadwick, G. D. Johns, W. S. Wilburn, M. Devlin, D. M. Drake, and P. G. Young. cross section deduced using a combination of experiment and theory. Phys. Rev. C, 65:021601, Jan 2002.
- [66] R. W. Lougheed, W. Webster, M. N. Namboodiri, D. R. Nethaway, K. J. Moody, J. H. Landrum, R. W. Hoff, R. J. Dupzyk, J. H. McQuaid, R. Gunnink, and E. D. Watkins. 239pu and 241am (n, 2n) cross-section measurements near en = 14 mev. Radiochimica Acta, 90(12):833–843, 2002.
- [67] D P McNabb, J D Anderson, R W Bauer, J A Becker, F Dietrich, P Navratil, M B Chadwick, and P G Young. Evaluation of the 239pu(n,2n) integrated cross section. UCRL-ID-143328, 1 2001.
- [68] O. Bouland, V. Meot, and O. Roig. Questioning the 239pu(n,2n)238pu cross section shape above emission threshold, 2022.
- [69] M.R. Mumpower, D. Neudecker, T. Kawano, A. E. Lovell, H Sasaki, I. Stetcu, and P. Talou. Collective enhancement in the exciton model. 2022.
- [70] D S Mather, P F Bampton, R E Coles, G James, and P J Nind. Measurement of (n,2n) cross sections for incident energies between 6 and 14 mev. 1 1972.
- [71] J. Fréhaut, A. Bertin, B. Bois, E. Gryntakis, and C. A. Philis. (n,2n) cross sections of 2h and 239pu. Radiation Effects, 96(1-4):219–223, 1986.
- [72] J A Beacker, L A Bernstein, W Younes, D P McNabb, P E Garrett, D Archer, C A McGrath, M A Stoyer, H Chen, W E Ormand, R O Nelson, M B Chadwick, G D Johns, D Drake, P G Young, M Devlin, N Fotiades, and W S Wilburn. Partial (gamma)-ray cross sections for the reaction 239pu(n,2n(gamma)i) and the 239pu(n,2n) cross section. 9 2001.
- [73] D. Neudecker. Validating 235u and 239pu iaea inden and lanl 239pu files from april 2022. Technical Report LA-UR-22-23747, Los Alamos National Laboratory, 2022.
- [74] C. Werner, J. Armstrong, F. Brown, J. Bull, L. Casswell, L. Cox, D. Dixon, R.A. Forster, J. Goorley, H.G. Hughes, J. Favorite, R. Martz, S. Mashnik, M. Rising, C. Solomon, A. Sood, J. Sweezy, A. Zukaitis, C. Anderson, J. Elson, J. Durkee, R. Johns, G. McKinney, G. McMath, J. Hendricks, D. Pelowitz, R. Prael, T. Booth, M. James, M. Fensin, T. Wilcox, and B. Kiedrowski. MCNP Users Manual - Code Version 6.2. Technical Report LA-UR-17-29981, Los Alamos National Laboratory, 2017.
- [75] International handbook of evaluated criticality safety benchmark experiments/nuclear energy agency. Technical Report (NEA;7328), Paris: OECD Nuclear Energy Agency, 2019.
- [76] C. Wong, J. Anderson, P. Brown, L. F. Hansen, J. L. Kammerdiener, C. Logan, and B. Pohl. Livermore pulsed sphere program: Program summary through july 1971. LLNL UCRL-51144 Rev. 1, 1972.
- [77] D. Neudecker, O. Cabellos, A.R. Clark, W. Haeck, R. Capote, A. Trkov, Morgan C. White, and Michael E. Rising. Which nuclear data can be validated with llnl pulsed-sphere experiments? Ann. Nucl. Energy, 159:108345, 2021.
- [78] T. Kawano, K. M. Hanson, S. Frankle, P. Talou, M. B. Chadwick, and R. C. Little. Evaluation and propagation of the 239pu fission cross-section uncertainties using a monte carlo technique. Nuclear Science and Engineering, 153(1):1–7, 2006.
- [79] M. E. Rising, P. Talou, T. Kawano, and A. K. Prinja. Evaluation and uncertainty quantification of prompt fission neutron spectra of uranium and plutonium isotopes. Nuclear Science and Engineering, 175(1):81–93, 2013.