

Neural Document Unwarping using Coupled Grids
Abstract.
Restoring the original, flat appearance of a printed document from casual photographs of bent and wrinkled pages is a common everyday problem. In this paper we propose a novel method for grid-based single-image document unwarping. Our method performs geometric distortion correction via a deep fully convolutional neural network that learns to predict the 3D grid mesh of the document and the corresponding 2D unwarping grid in a multi-task fashion, implicitly encoding the coupling between the shape of a 3D object and its 2D image. We additionally create and publish our own dataset, called UVDoc, which combines pseudo-photorealistic document images with ground truth grid-based physical 3D and unwarping information, allowing unwarping models to train on data that is more realistic in appearance than the commonly used synthetic Doc3D dataset, whilst also being more physically accurate. Our dataset is labeled with all the information necessary to train our unwarping network, without having to engineer separate loss functions that can deal with the lack of ground-truth typically found in document in the wild datasets. We include a thorough evaluation that demonstrates that our dual-task unwarping network trained on a mix of synthetic and pseudo-photorealistic images achieves state-of-the-art performance on the DocUNet benchmark dataset. Our code, results and UVDoc dataset will be made publicly available upon publication.
1. Introduction
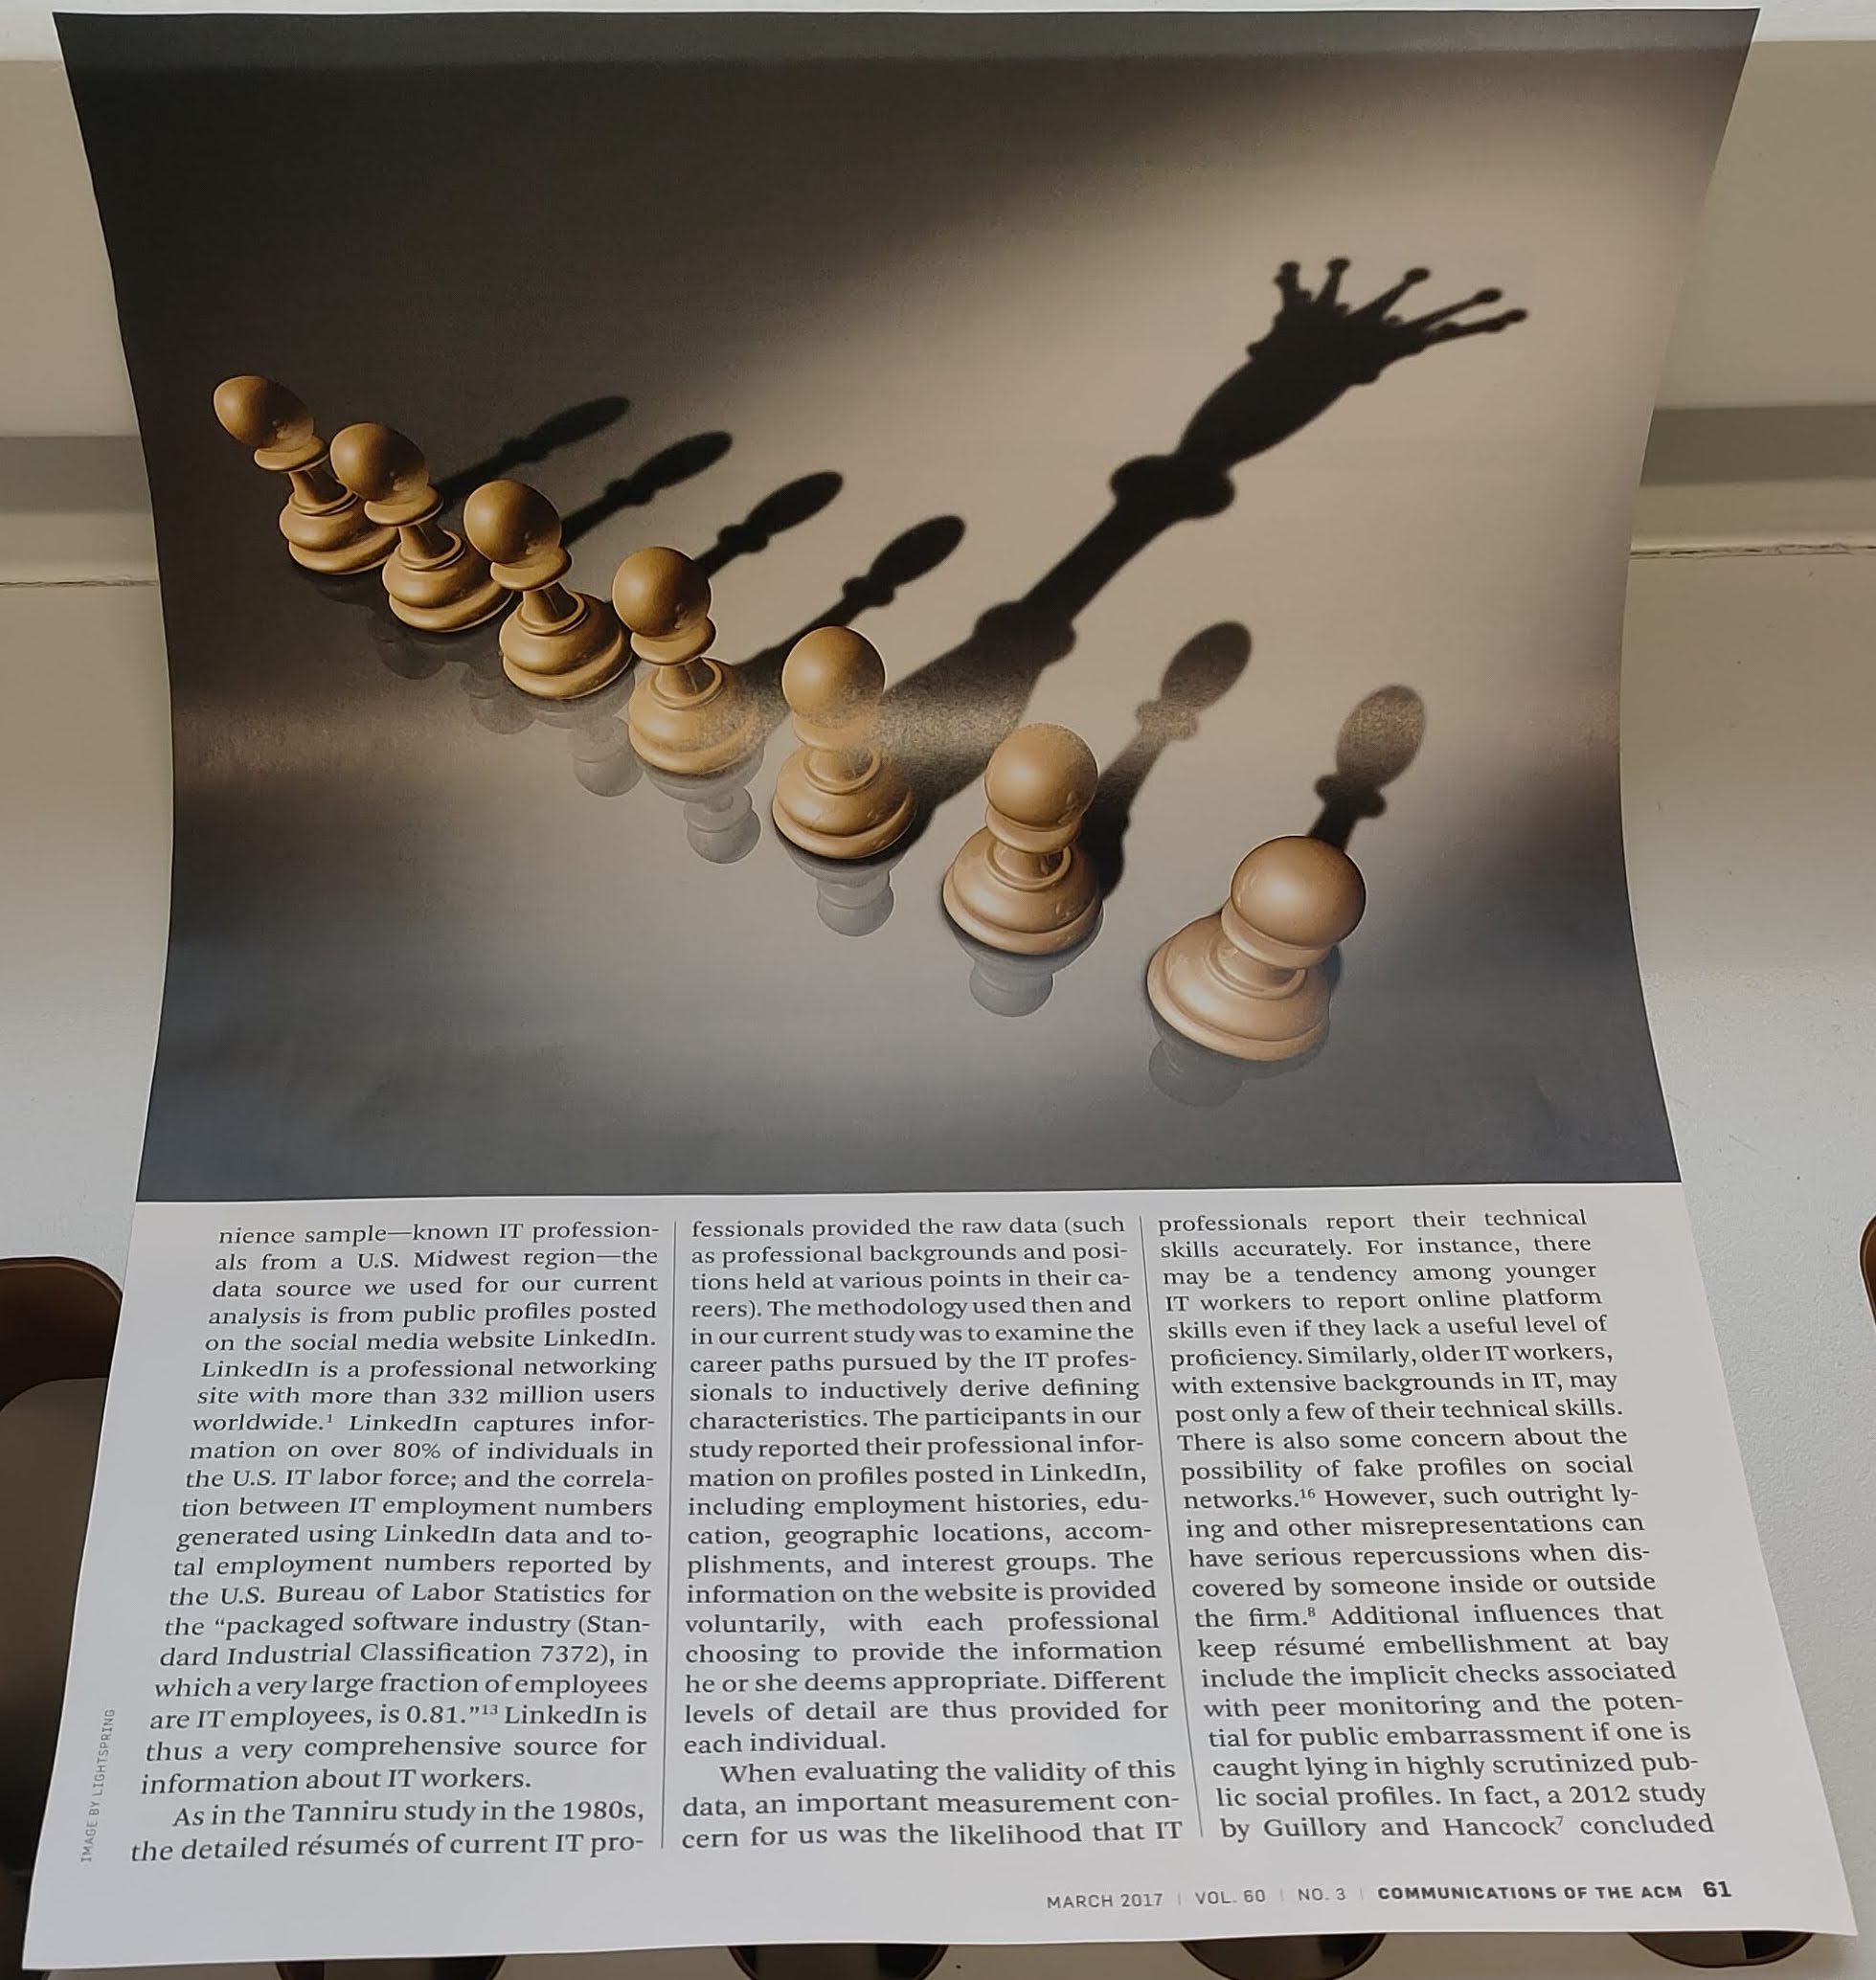
The task of physical document digitization, e.g. for financial administration, is increasingly being done in a casual setting with the use of smartphones rather than the more traditional in-office flatbed scanners. However, the appearance of these casually captured images usually differs greatly from flatbed-scans due to varying camera angles, unconstrained illumination conditions and physical deformations of the paper, such as folding, crumpling and curving. These appearance variations pose a problem for post-processing steps, such as Optical Character Recognition (OCR). Document image rectification is therefore an important step in the modernized document digitization pipeline, making layout extraction and OCR performance comparable to that of the traditional pipeline.
Several research efforts have been undertaken to tackle the problem of document unwarping using either model- or data-driven approaches. The model-driven approaches typically try to fit a constrained, piecewise-smooth surface to the imaged document. This geometric optimization is generally slow and has limited approximation capabilities, making it unsuitable for practical applications. Data-driven approaches instead rely on training a neural network to perform the unwarping. These methods are fast at runtime but typically require a large amount of high-quality training data, which can be difficult to obtain. The available training data can roughly be categorized as either synthetic or in the wild document images. The former group is generated by rendering images using dense 3D scans of real document geometries, whilst the latter simply consists of photographs of actual deformed documents. The synthetic category has the problem that dense 3D capture is often noisy and rendering photorealistic paper can be challenging, making the appearance of the generated data samples non-realistic as a result. The challenge with the latter category is that ground truth data, most notably the ground truth unwarping function, is difficult to obtain.
We use a neural approach, as it is more suited for everyday real-time applications and only requires a single RGB image as runtime input, whereas state-of-the-art model-driven approaches typically require multi-view images or additional 3D input data. We circumvent the training data problem by devising a custom data capture pipeline that allows efficient generation of pseudo-photorealistic images with registered ground truth 3D and unwarping information.
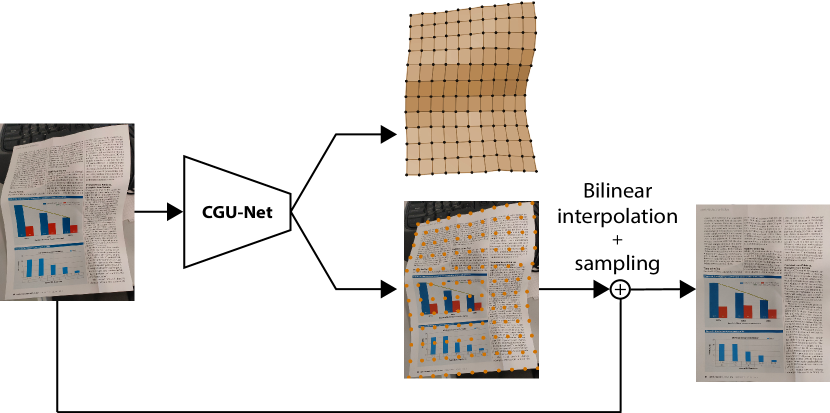
Our main contribution is CGU-Net (Coupled Grids Unwarping Net), a deep convolutional network that performs document image unwarping from a single RGB image. It uses a dual-head approach to predict both a 3D grid mesh representing the 3D shape of the document, as well as a 2D unwarping grid representing a coarse backward map that can be used to perform the document unwarping. This dual-task approach encodes an implicit coupling between the 2D and the 3D grid, just like there is a physical coupling between the 3D document shape and its 2D image. Because we learn a coarse 2D unwarping grid instead of a dense unwarping flow, our network size is greatly reduced compared to state-of-the-art methods.
To decrease the domain gap between the synthetic Doc3D dataset (Ma et al., 2018), usually used to train models for the task of document unwarping, and real document photographs, we present our own dataset, which contains 10,000 pseudo-photorealistic images of documents, equipped with all the required information to train a coarse grid-based neural document unwarping neural net. We achieve a photorealistic appearance by using image compositing instead of rendering, thereby retaining the shading and material appearance from the original image capture. Because our dataset is tailored to a coarse grid-based approach, it is easy to produce even though it includes numerous ground-truth annotations. We combine training on the large Doc3D synthetic dataset with our own custom data and obtain state-of-the-art performance on the DocUNet benchmark for most evaluation criteria.
2. Related Work
Document image unwarping is a widely-studied topic, with contributions coming both from the fields of geometry processing as well as computer vision. We here divide previous work into two categories; namely those using a model-based approach and those using a data-driven approach.
2.1. Model-based document unwarping
Early works take a geometry processing approach and try to unwarp document images by first creating a 3D reconstruction of the document surface, which then is flattened to the plane using some optimization problem. These related works commonly obtain an estimate of the 3D document surface with the help of some piece of auxiliary equipment. These setups include structured light (Brown and Seales, 2001, 2004), two structured laser beams (Meng et al., 2014) and laser range scanners (Zhang et al., 2008). Other model-based methods also rely on 3D reconstruction as a first step in the document unwarping process, but they use multi-views images instead of additional hardware to estimate the 3D shape of the document surface (Yamashita et al., 2004; Ulges et al., 2004; Tsoi and Brown, 2007; Koo et al., 2009; You et al., 2018).
Once a 3D reconstruction of the document surface is in place, different methods are used to flatten it to the plane. Brown and Seales (2001; 2004) and Zhang et al. (2008) flatten the document surface using a simulation of a stiff mass-spring system falling down to a plane under gravity. Another common technique is to fit a (piecewise-) smooth parametric surface to the estimated 3D document surface, and flatten it according to some parameterization. This approach can be done with generalized cylinders (Koo et al., 2009; Zhang et al., 2004; Kim et al., 2015; Kil et al., 2017; Meng et al., 2018), generalized ruled surfaces (Tsoi and Brown, 2007; Meng et al., 2014), smooth developable surfaces (Liang et al., 2005, 2008) and NURBS-like surfaces (Yamashita et al., 2004; Zhang and Tan, 2005).
Often times these parametric approaches rely heavily on the texture flow of the text lines in the document to estimate parametric line directions, making them less suitable for documents that only contain sparse text. Additionally, due to their smooth nature, they cannot capture and accurately correct fine details like crumpling and folding. Finally, their optimization nature makes them slow and unsuitable for real-time applications, and their dependence on auxiliary equipment makes their use in real-world scenarios inconvenient and costly.
2.2. Data-driven document unwarping
The second group of document unwarping methods works directly on a single RGB image of the document, employing deep learning approaches to infer 2D displacement fields or coarse grids that are used to transform the distorted image into the unwarped one.
Ma et al. (2018) proposed such a network that predicts the forward mapping from a distorted document image to its unwarped version through two chained U-Nets (the first estimates an initial guess, and the second refines this). Their method is fast in comparison to the geometrical approaches described in Sec. 2.1 but does not perform well on real-world data since it is trained on a synthetic dataset generated using non-physically plausible 2D deformations. DewarpNet (Das et al., 2019) used a more realistic synthetic dataset that contains renderings of 3D scanned physically deformed documents. They employ two chained networks, the first one inferring 3D coordinates from an image of the warped document, and the second inferring the backward mapping from the predicted 3D world coordinates.
Both Li et al. (2019) and Das et al. (2021) have used a patch-based approach trying to predict the displacement field independently on different parts of the image. The distortions in each individual patch of the image being less complex than the distortion of the document as a whole, these methods allow a better handling of local distortions at the cost of having to properly stitch the different patches together.
Rather than predicting the complete deformation field in one go, Marior (Zhang et al., 2022) and DocScanner (Feng et al., 2021b) use an iterative refinement approach, where they progressively refine the predicted warping flow field. They additionally predict a foreground-segmentation mask before starting this iterative rectification process, removing the burden of localizing the document boundaries in the image from the unwarping network.
DocGeoNet (Feng et al., 2022) also removes the background before feeding the image into the network. This work trains one network to predict the 3D shape of the document and one to predict the locations of textlines inside the image. A concatenation of these two features, which encodes the link between the warped and unwarped image, is fed into a network that predicts the displacement map. Textline and document information detected by a network is also used by Jiang et al. (2022) as explicit constraints of an optimization problem that computes the forward map.
Recently, Xie et al. (2021) and Xue et al. (2022) followed the approach of predicting a coarse grid of control points rather than a dense deformation field, which they combine with a thin-plate spline interpolation to unwarp document images. Xue et al. (2022) additionally use a Fourier filtering step to enable direct comparison of the unwarped image with the ground-truth flatbed scan of the document, whilst removing the effect of differing lighting conditions, allowing it to be trained on real data with no backward mapping ground-truth. PaperEdge (Ma et al., 2022) uses a network architecture that can learn both from synthetic data (Doc3D dataset) as well as in the wild captured images. They predict an initial coarse unwarping using the edges of the document, which then gets refined in an image-to-image style network that is trained using a siamese loss on pairs of slightly perturbed images.
A variety of different network architecture styles have also been implemented, showing various performances and efficiency. Liu et al. (2020) use a pyramid encoder-decoder network to predict the unwarping field at multiple resolutions. Xie et al. (2020) use a fully convolutional neural network to learn the displacement field and perform background segmentation in a post-processing step. DocTr (Feng et al., 2021a) uses transformer architectures, aiming to capture the global nature of the unwarping task.
All of these data-driven methods use the Doc3D dataset proposed by Das et al. (2019) for training. Even though the 3D shapes of the dataset are more realistic than those in (Ma et al., 2018) since they are based on depth captures of actual deformed papers, they are heavily smoothed compared to the original document shapes. Also, the rendered appearance is not very realistic, which causes performance degradation when using the network on real photos. In contrast, our dataset, made of real captured sheets of paper, is more realistic both visually and geometrically. Additionally, our dual-task-based network architecture enforces the model to predict physically plausible shapes and unwarping grids. Our CGU-Net processes input images in a single stage without any segmentation pre-processing and predicts a coarse backward mapping rather than a dense displacement field, making it very efficient.
 |
3. Method
In order to be able to completely unwarp the document, we assume that the input photograph is taken from a camera position in which the document’s 3D shape can be represented as a height field, i.e., the entire document is visible and there are no occlusions and foldovers.
We use a multi-head network to predict a 2D unwarping grid containing pixel coordinates, and a grid mesh of 3D shape coordinates from a warped 488-by-712 input image . We decided on this grid aspect ratio to approximate the aspect ratio of A4 paper in portrait mode, the most common paper type that documents are printed on. Compared to the commonly used square grid resolution, this allows for higher approximation power for the horizontal lines of text, which are visually perceived stronger than the spacing of individual characters within a line. As illustrated in Fig. 2, the 2D unwarping grid encodes the deformation that leads to the unwarped document: grid-point holds the pixel coordinates (relative to the image, in the range ) of the pixel that will be placed at position in the unwarped image (up to constant scaling). The grid can also be seen as a coarse backward mapping. The grid is bilinearly interpolated before applying the unwarping, to achieve a full-resolution unwarped image.
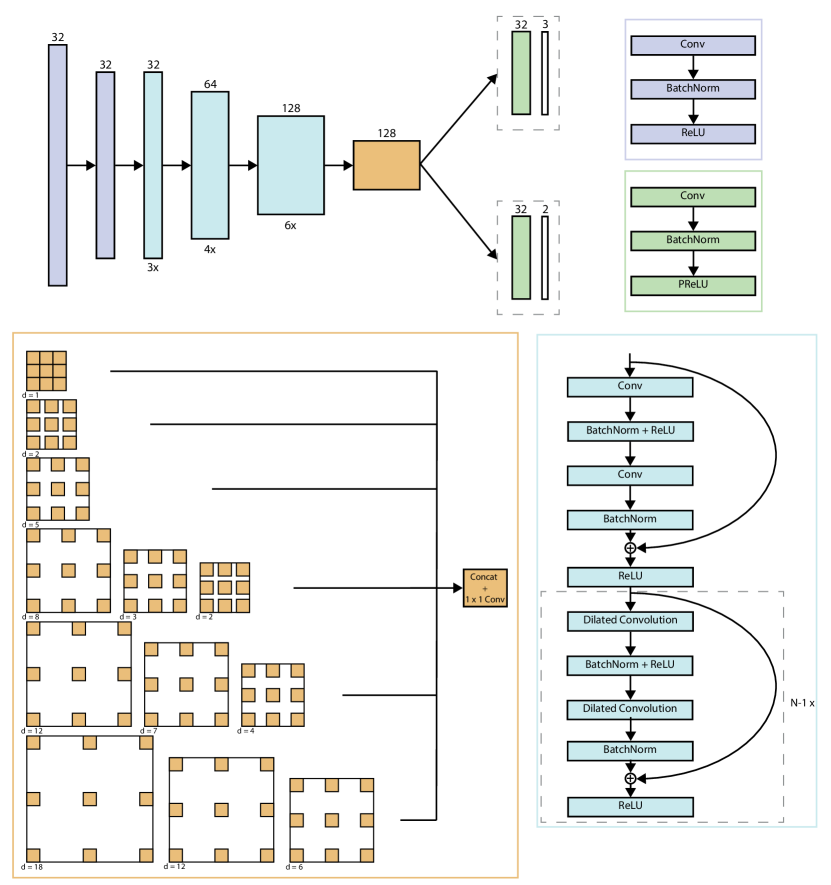
3.1. Network architecture
CGU-Net is a multi-head fully-convolutional encoder architecture inspired by the encoder part of the architecture used in (Xie et al., 2020). The input image goes through two convolutional downsampling layers that each use a kernel and reduce the image size by a factor of two. This is followed by three dilated residual blocks, which lead to a spatial pyramid with stacked dilated convolutions. At the end, two heads with two convolutional layers predict and , respectively. Fig. 6 gives a detailed graphical overview of our architecture.
3.2. Training loss
We now denote ground-truth variables as their regular symbols (e.g., ) and their predicted counterparts with a hat (e.g., ). Our training loss is a combination of mean-squared error (MSE) losses on both the 2D unwarping grid and the 3D grid mesh :
| (1) |
We obtain the ground-truth and for the Doc3D dataset by sampling the ground truth backward maps at a regular grid of points covering the entire backward map. For our UVDoc dataset (see Sec. 4) we slice the available high resolution ground truths with factor 2.
3.3. Training details
We use the ADAM optimizer (Kingma and Ba, 2015) with a batch size of 8. The initial learning rate is set to 0.001 for 10 epochs and linearly decays to 0 over 5 further epochs. We alternate optimization steps based on a batch of Doc3D data with a batch of our UVDoc data, using the same loss function on both of them.
We visually augment both the Doc3D and our data with noise, color changes and other appearance transformations. Additionally, we augment our data with rotations, since our images are captured from a more uniform angle than the Doc3D data. All images are tightly cropped before being fed to the network.
4. The UVDoc dataset
We create our own dataset, UVDoc, containing 10,000 pseudo-photorealistic images of warped documents. Our motivation is to obtain a dataset of photorealistic document images that has more ground truth information available than document in the wild images, and more realistic appearance than synthetically generated renderings. This allows us to have a stronger supervision signal than what is available for general document in the wild data, whilst also benefiting from more realistic appearance. We compare the main characteristics of our dataset against other available datasets in Table 1.
| Dataset | # Samples | Type | BM |
|---|---|---|---|
| Doc3D (Das et al., 2019) | 100,000 | Synthetic | ✓ |
| DIW (Ma et al., 2022) | 5,000 | Real | ✗ |
| WarpDoc (Xue et al., 2022) | 1,020 | Real | ✗ |
| Ours | 10,000 | Pseudo-real | ✓ |
Capture
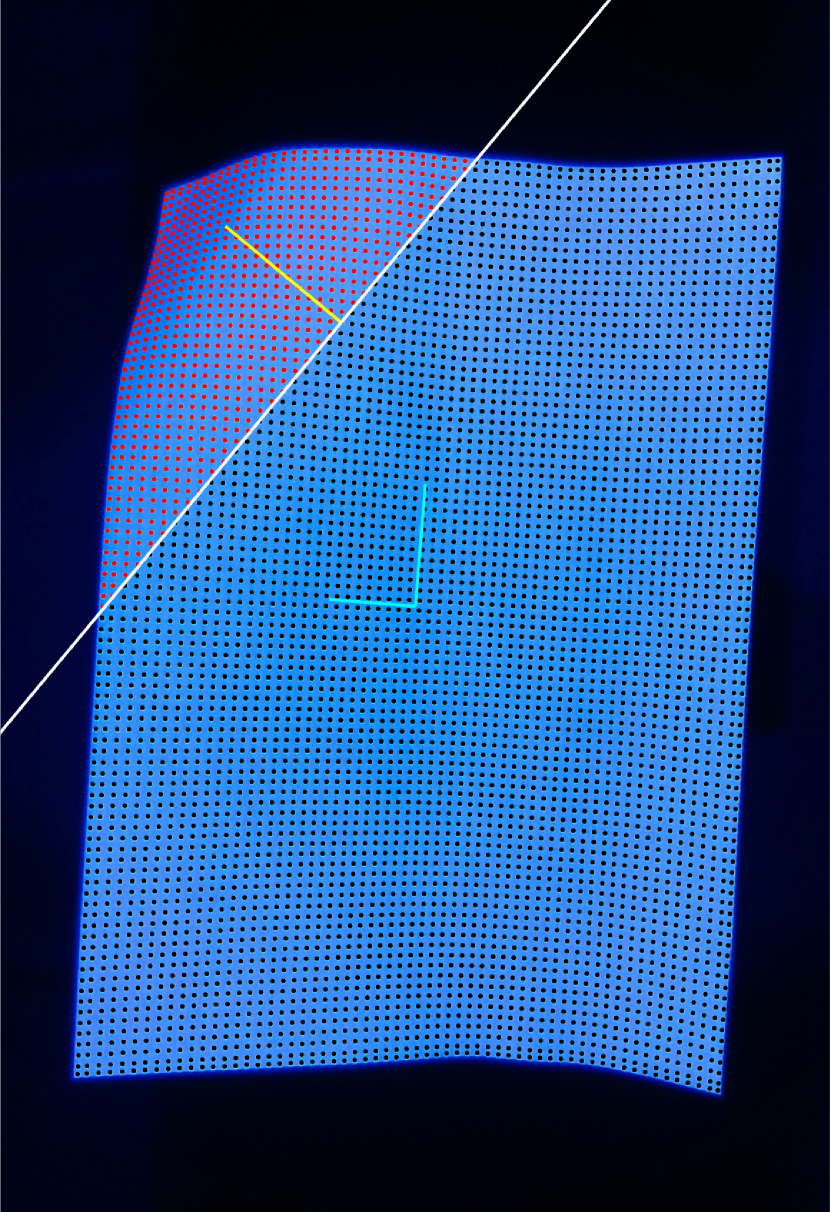
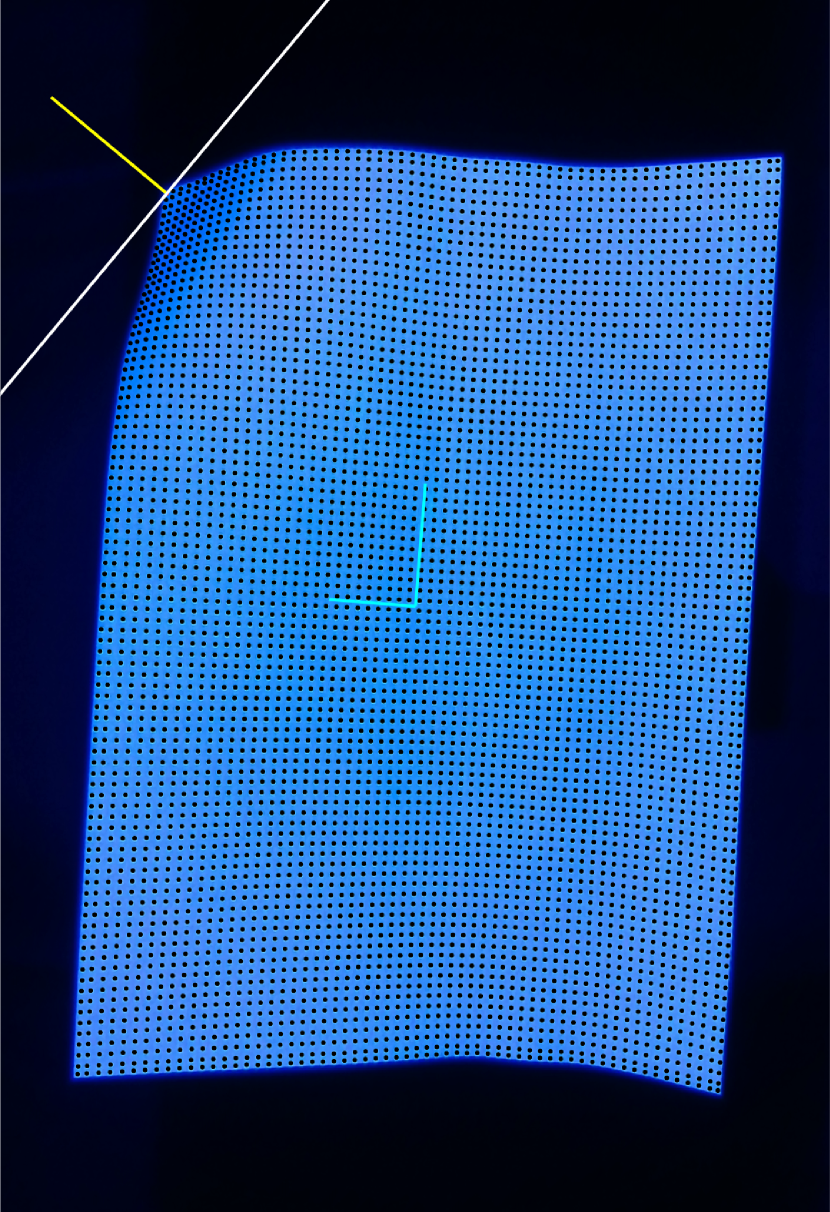
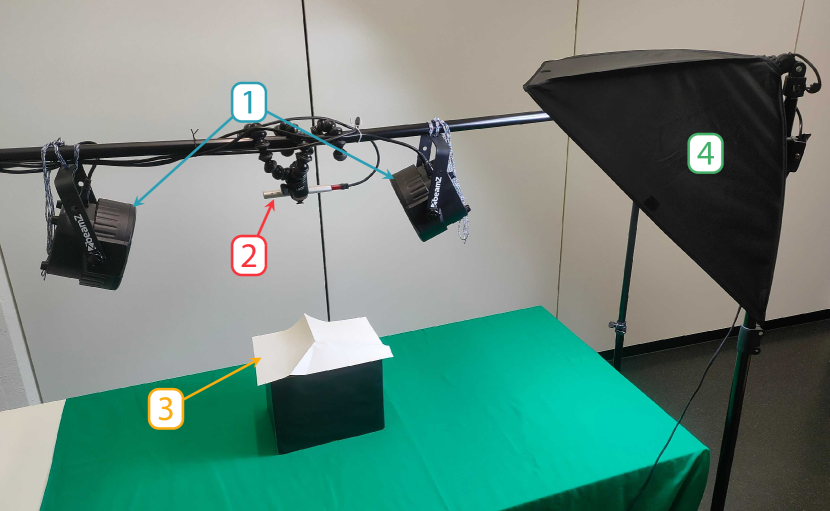
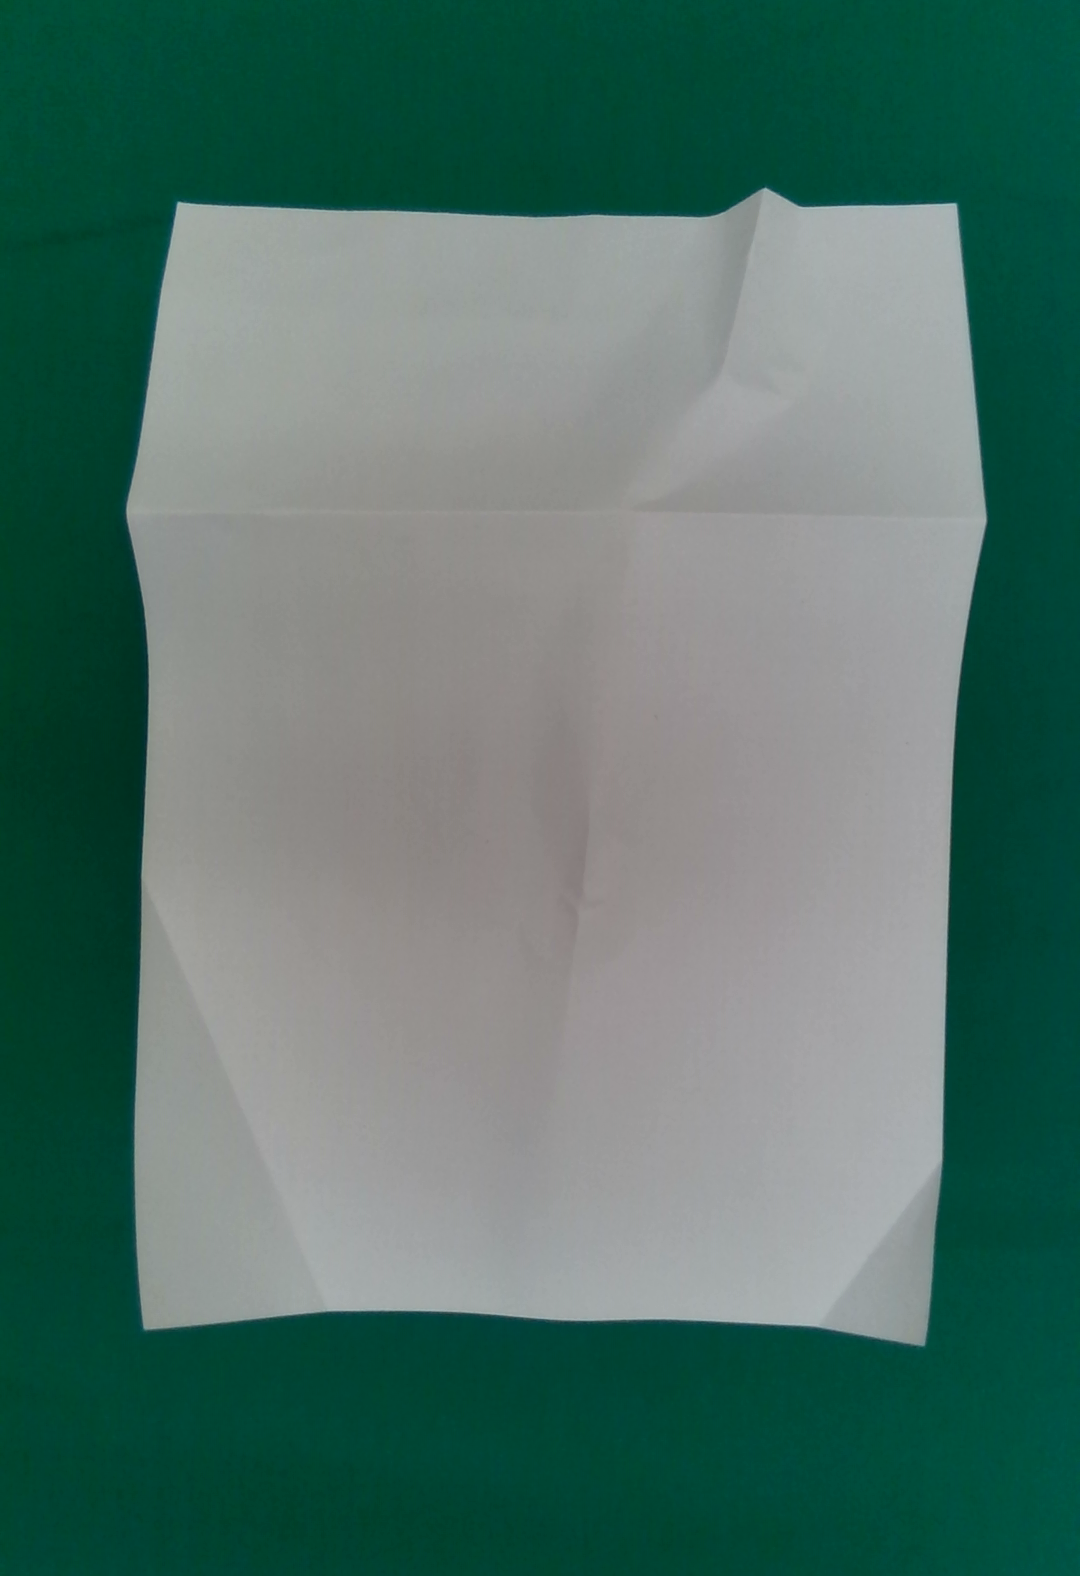
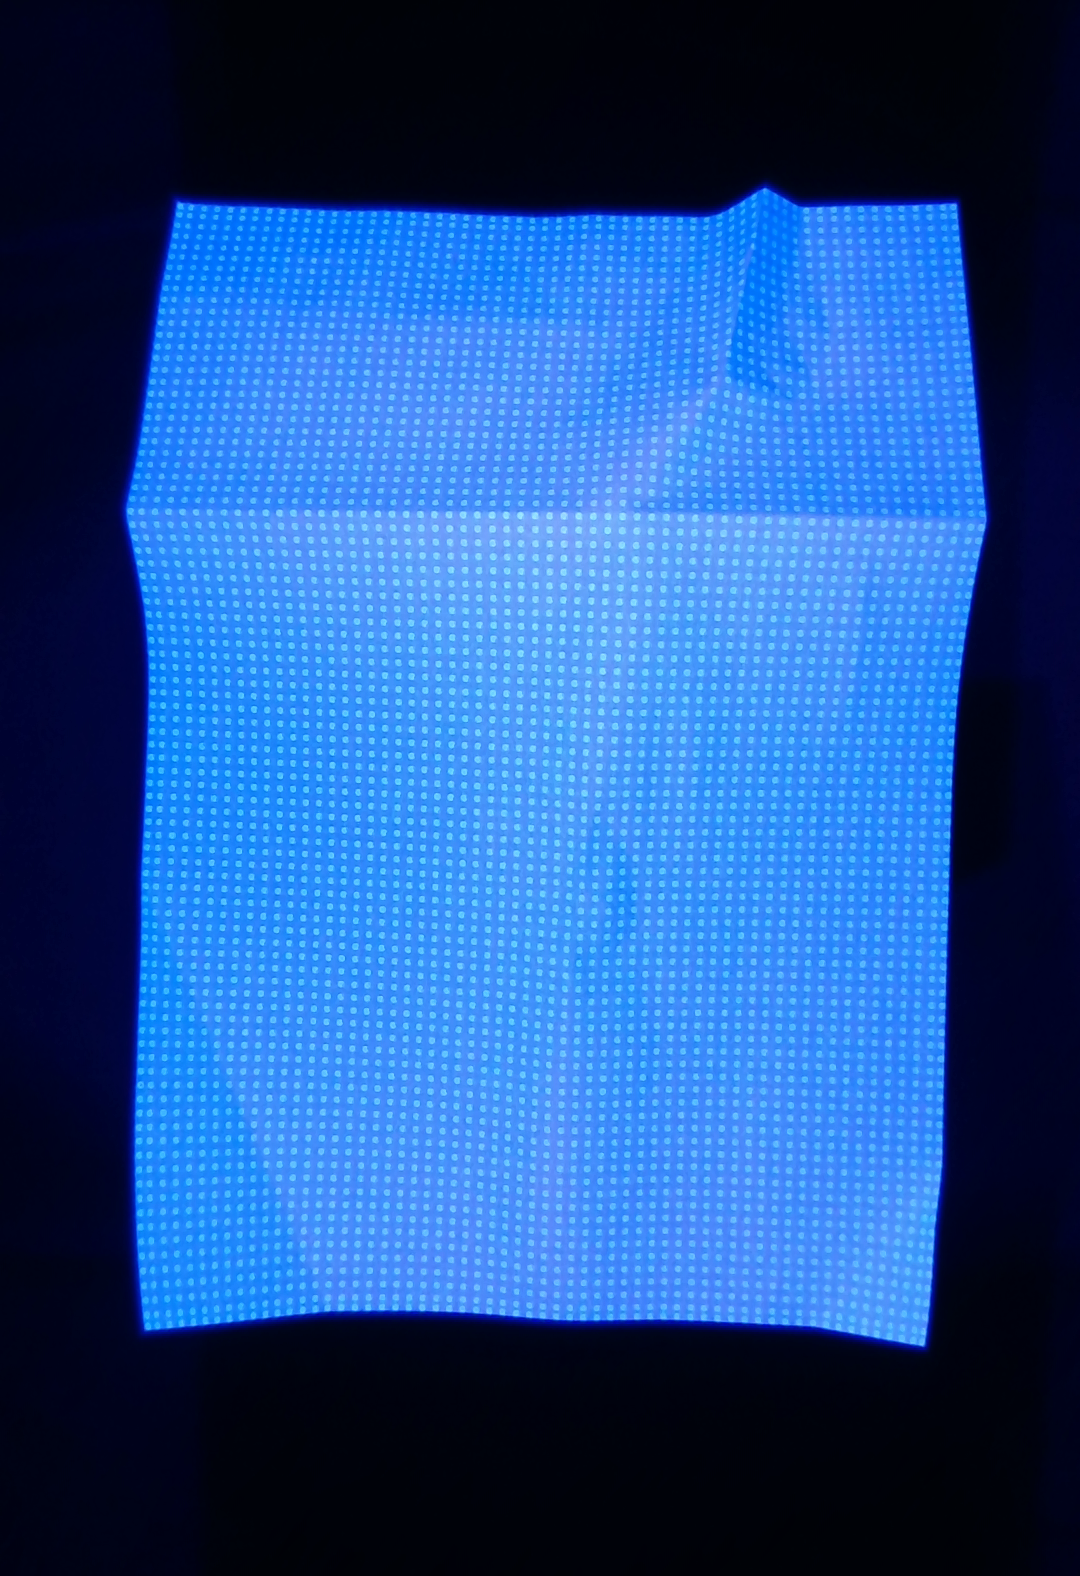
We print regular grids of dots, with grid size of , on A4-sized pieces of paper using an inkjet printer with UV ink that is invisible to an RGB camera in regular light, but becomes visible in UV light in an otherwise dark room. Note that on the paper boundary we deviate slightly from a perfectly regular grid by offsetting the border dots a little, so that they fully fit on the paper and can be detected more easily. Importantly, we use recycled paper, as it has fewer brightening agents that react with the UV light, giving a higher contrast grid pattern, which is easier to detect in the UV-lit image. We fold and bend the pieces of paper in various ways to emulate common deformations. We then capture pairs of RGB-D images of deformed papers using the Intel RealSense SR305 depth camera: one image in regular lighting and one in UV lighting (Fig. 3(b)). We used two commercially-available 30 W, 395 nm UV lamps to reduce the amount of shadows in the UV-lit image. We control the camera and the lights using a laptop and remote switches, so that there is no movement between the two captured frames, and the depth and pixel information is aligned. We capture various types of deformed paper, such as curved, folded, or crumpled, and we also vary the lighting conditions. The dataset contains a total of 388 distinct geometries, which we augment to 1552 geometries by applying horizontal and/or vertical flips to each sample.
Recovering the grid
Using the UV-lit image, where the printed grid is visible, we obtain the pixel coordinates of the grid points on the deformed piece of paper. To detect them we use OpenCV’s SimpleBlobDetector, coupled with manual annotation for extreme cases where the automatic detection fails. Once all points have been detected, we compute their correspondences to the vertices of a regular grid, which is equivalent to ordering them as an grid. The technical details of solving this ordering problem are described in the appendix.
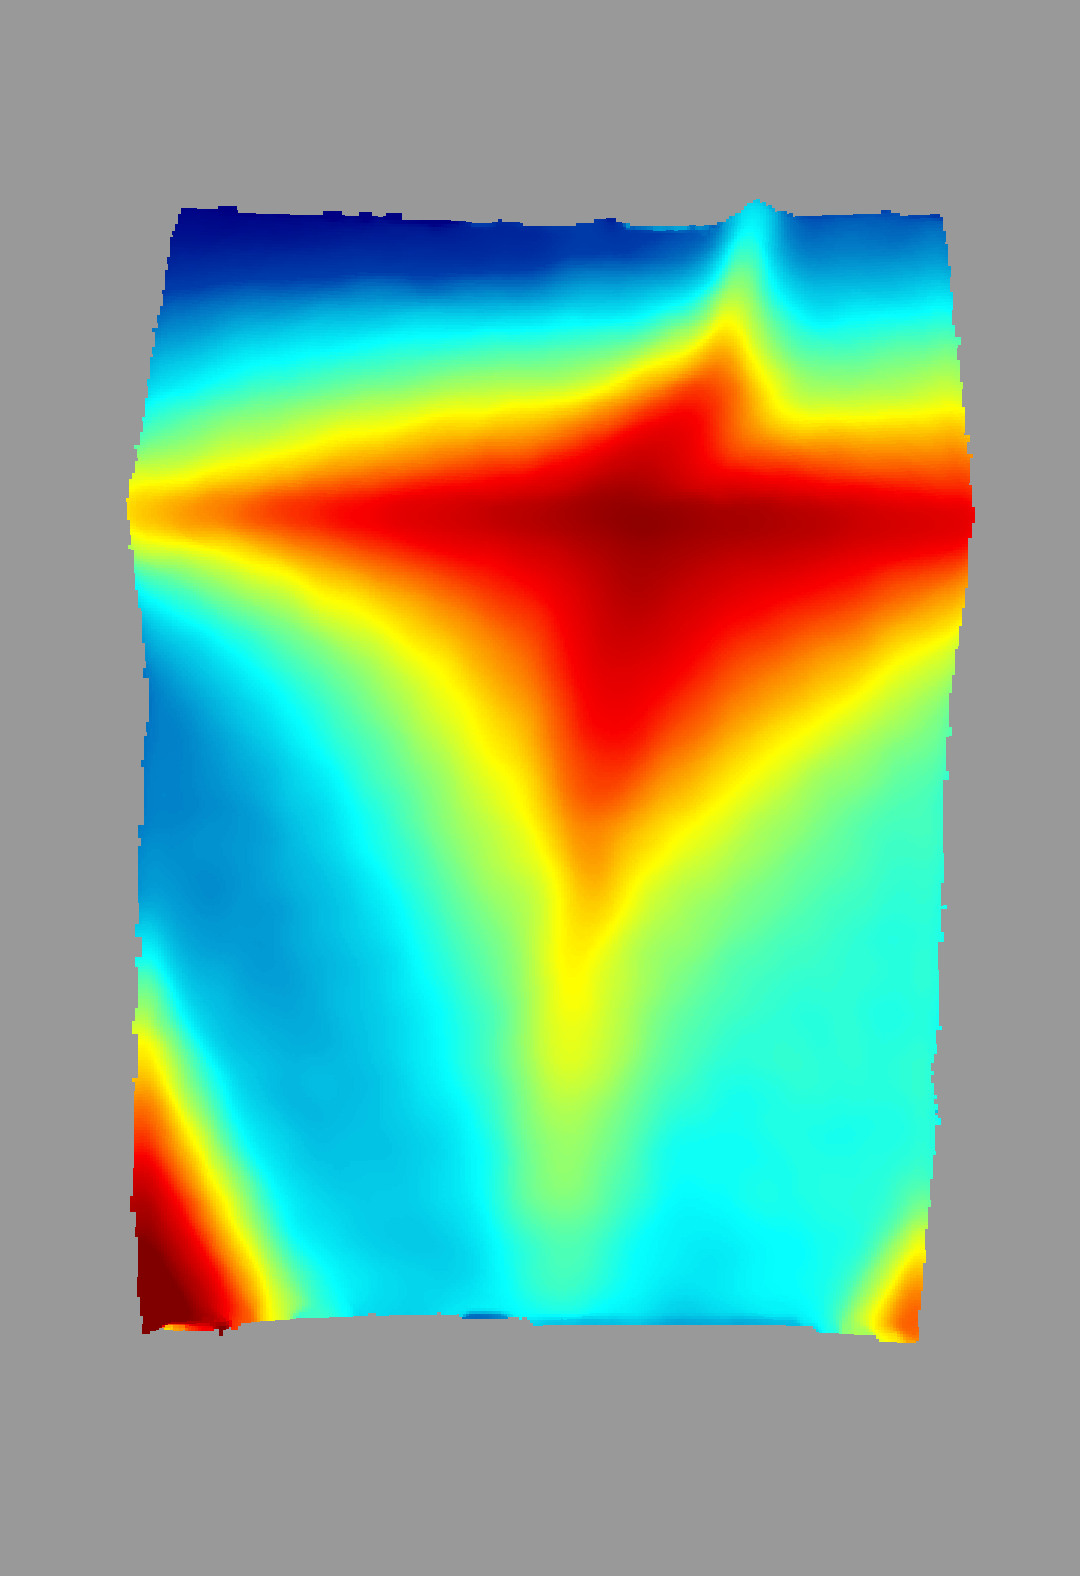
We call the ordered grid the 2D unwarping grid. Combining the coordinates of the 2D unwarping grid with the depth values at these same pixel coordinates and the intrinsics of the camera, we construct a 3D grid mesh corresponding to the 3D shape of the piece of paper.
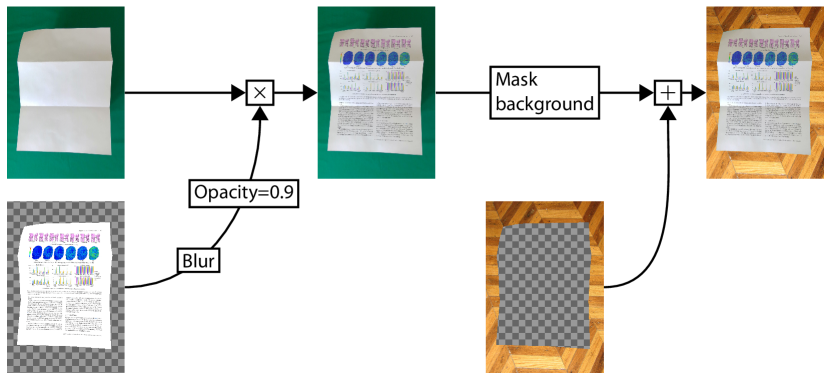
Pseudo-photorealistic image generation
Since we have a known mapping between the 2D unwarping grid and the original regular 2D grid, we can construct a coarse -parameterization of the 3D grid mesh. We use bilinear interpolation for the -parameterization when applying a texture to the geometry and for the 2D unwarping grid when performing the unwarping, to obtain a full-resolution, dense backward mapping.
The -parameterization is used to apply a document texture on top of the image of the blank warped document. As illustrated in Fig. 4, we blend the document texture with the lighting-baked blank document image by multiplying the two images. This gives a pseudo-photorealistic combination between the lighting and the texture. We also replace the background in the image with a background sampled from the Describable Textures dataset (Cimpoi et al., 2014). Using this approach, we create a dataset of 10,000 images in total. We provide the original lighting-baked blank document image along with the -parameterization, so users of the dataset can easily replace the document and the background textures if desired.
At the end of our data capture pipeline we are equipped with a ground-truth 2D unwarping grid, a -parameterization and a 3D grid mesh for each sample in our dataset. The full UVDoc dataset will be made publicly available upon publication.
5. Experiments
5.1. Evaluation metrics
We evaluate our method based on image similarity metrics as well as optical character recognition (OCR) performance. Following (Ma et al., 2018) and (Das et al., 2019), we use multi-scale structural similarity (MS-SSIM) and local distortion (LD) as metrics for the image similarity evaluation. We also evaluate our method using the aligned distortion (AD) metric, which corrects some of the flaws of the previous metrics. We evaluate OCR performance using the character error rate (CER) and edit distance (ED).
The structural similarity measure (SSIM) (Wang et al., 2004) quantifies the visual similarity between two images by measuring the similarity of mean pixel values and variance within image patches between the two images. The multi-scale variant (MS-SSIM) repeats this process at multiple scales using a Gaussian pyramid and computes a weighted average over the different scales as its final measure. We use the same weights as described in the original implementation (Wang et al., 2003).
LD is computed using a dense SIFT flow mapping (Liu et al., 2008) from the ground truth image to the rectified image. Using this registration, LD is computed as the mean distance between mapped pixels (You et al., 2018), essentially measuring the average local deformation of the unwarped image.
Aligned distortion (AD) is a more robust variant of the LD metric, introduced in (Ma et al., 2022). In contrast to LD, AD eliminates the error caused by a global translation and scaling of the image by factoring out the optimal affine transformation out of the SIFT flow distortion. Such a global affine transformation can cause large LD values but does not greatly impact human readability of the image. Additionally, AD weighs the error according to the magnitude of the gradient in the image, emphasizing interesting areas, such as text or image edges, rather than the background.
Prior to computing these similarity metrics, we resize all images, both rectified and ground-truth, to a 598,400-pixel area, as suggested in (Ma et al., 2018).
In addition to the image similarity metrics, we evaluate OCR performance based on character error rate (CER) and editing distance (ED) (Navarro, 2001). The CER is defined as the ratio between the ED (the edit distance between the recognized and reference text) and the number of characters in the reference text. We obtain the reference text by extraction from the flatbed scans of the documents. The full definition for the CER then becomes: , where are the number of substitutions, insertions and deletions, respectively, and is the number of characters in the reference text.
5.2. Evaluation
We evaluate our CGU-Net on the DocUNet benchmark dataset (Ma et al., 2018). It is composed of 65 documents. For each of them, 2 deformed images in a real-world scenario are provided. The ground truth flatbed-scans are also provided for comparison. Note that similarly to Feng et al. (2022) we exclude the two images of document 64, as the real world images are rotated by 180 degrees. We also exclude this image when computing the quantitative results for previous works.
Quantitative evaluation
We compare our method with several state-of-the-art deep learning methods. For each of them, we use the DocUNet result images published by the authors. All metric scores are evaluated using Tesseract v4.0.0, pytesseract v0.3.10, MATLAB R2022a, Levenshtein v0.20.8 and jiwer v2.5.1. The results are presented in Table 2.
Comparing to previous works, our CGU-Net achieves state-of-the-art LD and AD performance and a second-best MS-SSIM score. Our method ranks third based on the CER metric, but nevertheless achieves a state-of-the-art ED score. In our experience, the performance on the OCR metrics is highly unstable and shows large variance, whereas the visual evaluation metrics (MS-SSIM, LD and AD) are far more stable over repeated experiments (see Table 3 and Table 4). Since the differences in CER and ED scores between our method and previous works are relatively small compared to the size of the respective standard deviations that we observe during our ablation study, we put less emphasis on these metrics than on the visual ones.
Our approach builds on a grid-based unwarping method, thanks to which our network is significantly smaller in size than current state-of-the-art methods, whilst still achieving state-of-the-art performance. We compare our network size to previous works in the last column of Table 2.
| Method | MS-SSIM | LD | AD | CER | ED | Para. |
|---|---|---|---|---|---|---|
| DewarpNet | 0.472 | 8.38 | 0.396 | 0.217 | 834.32 | 86.9M |
| DispFlow | 0.432 | 7.62 | 0.395 | 0.292 | 1216.34 | 23.6M |
| DocTr | 0.509 | 7.78 | 0.366 | 0.181 | 711.96 | 26.9M |
| PW Unwarping | 0.490 | 8.64 | 0.431 | 0.253 | 987.02 | - |
| DDCP | 0.473 | 8.93 | 0.423 | 0.278 | 1117.92 | 13.3M |
| FDRNet | 0.543 | 8.08 | 0.396 | 0.214 | 878.02 | - |
| RDGR | 0.495 | 8.50 | 0.432 | 0.171 | 732.36 | - |
| Marior | 0.476 | 7.37 | 0.404 | 0.199 | 797.00 | - |
| PaperEdge | 0.472 | 7.98 | 0.367 | 0.193 | 763.48 | 36.6M |
| DocGeoNet | 0.504 | 7.70 | 0.378 | 0.190 | 735.82 | 24.8M |
| Ours | 0.513 | 7.18 | 0.352 | 0.184 | 689.54 | 8M |
Qualitative evaluation
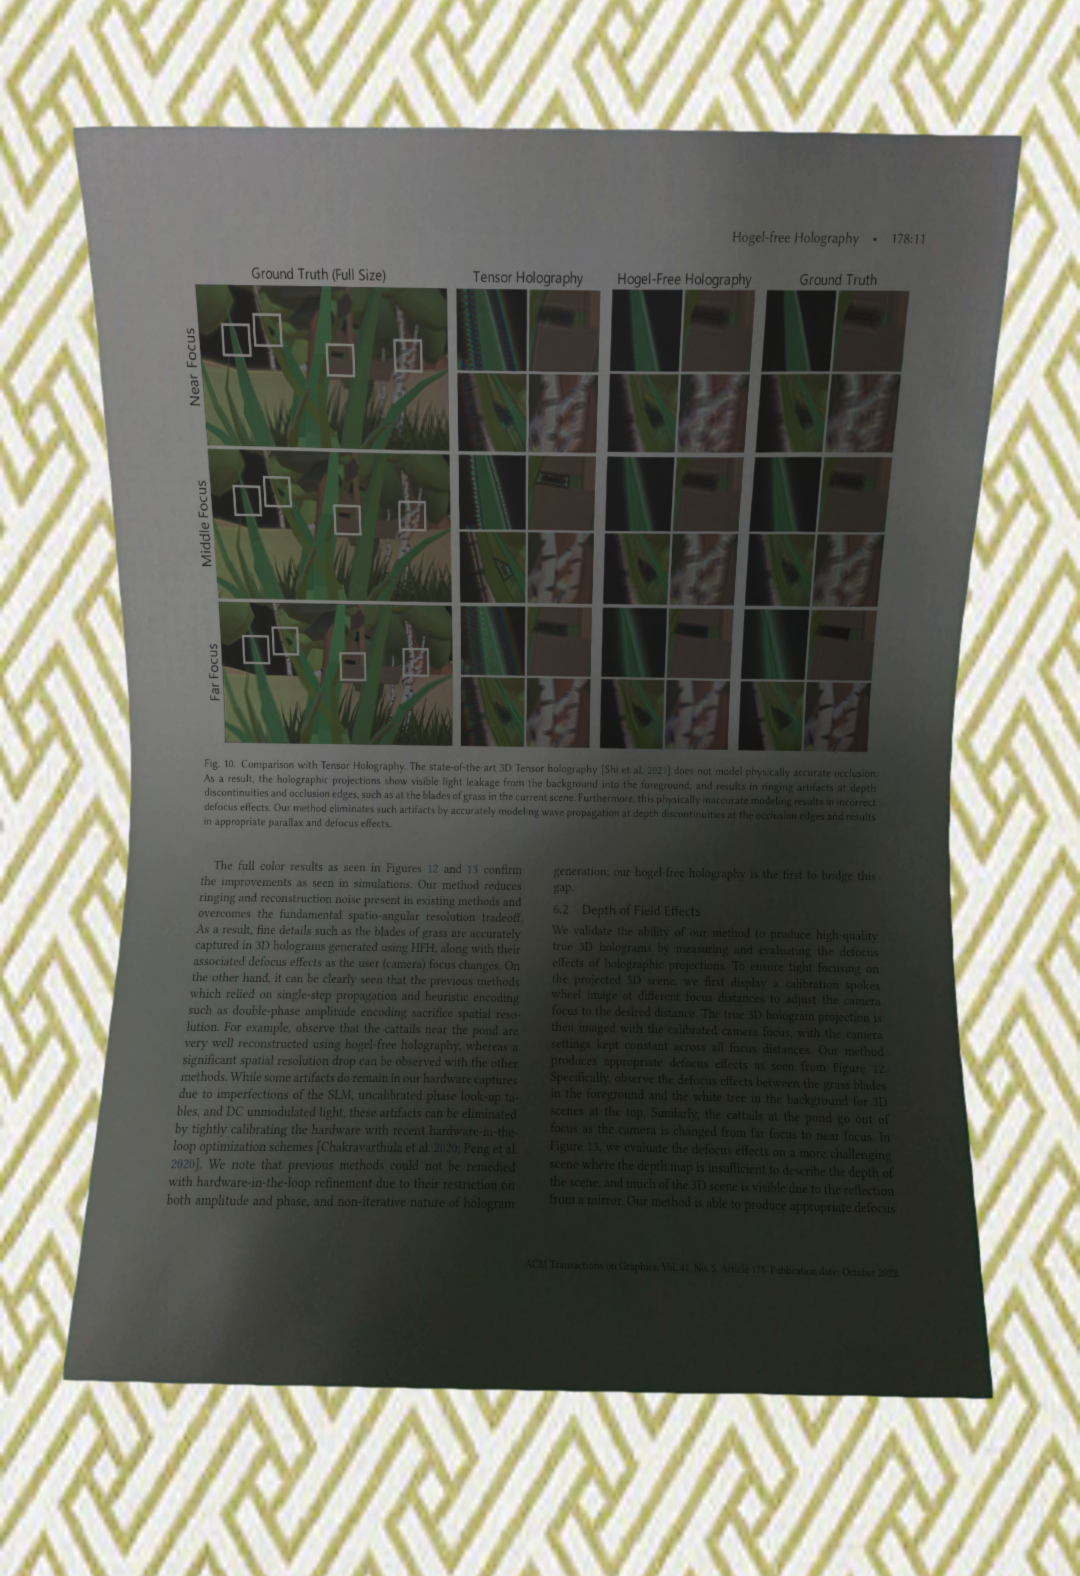
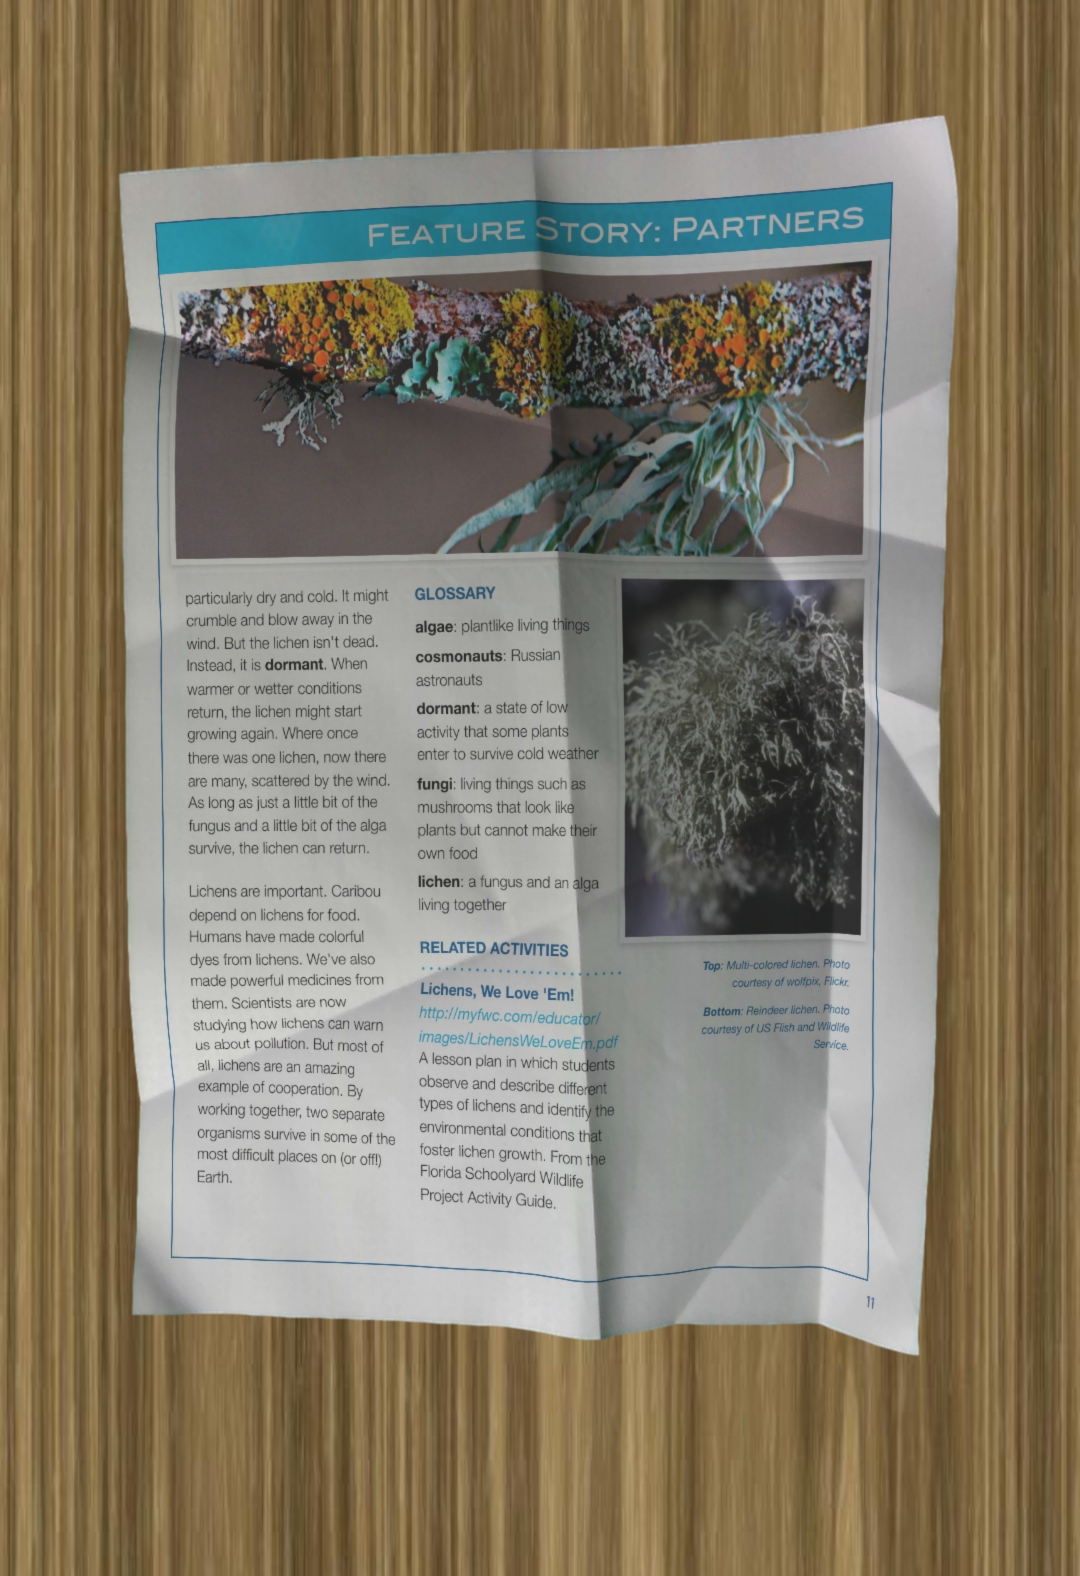
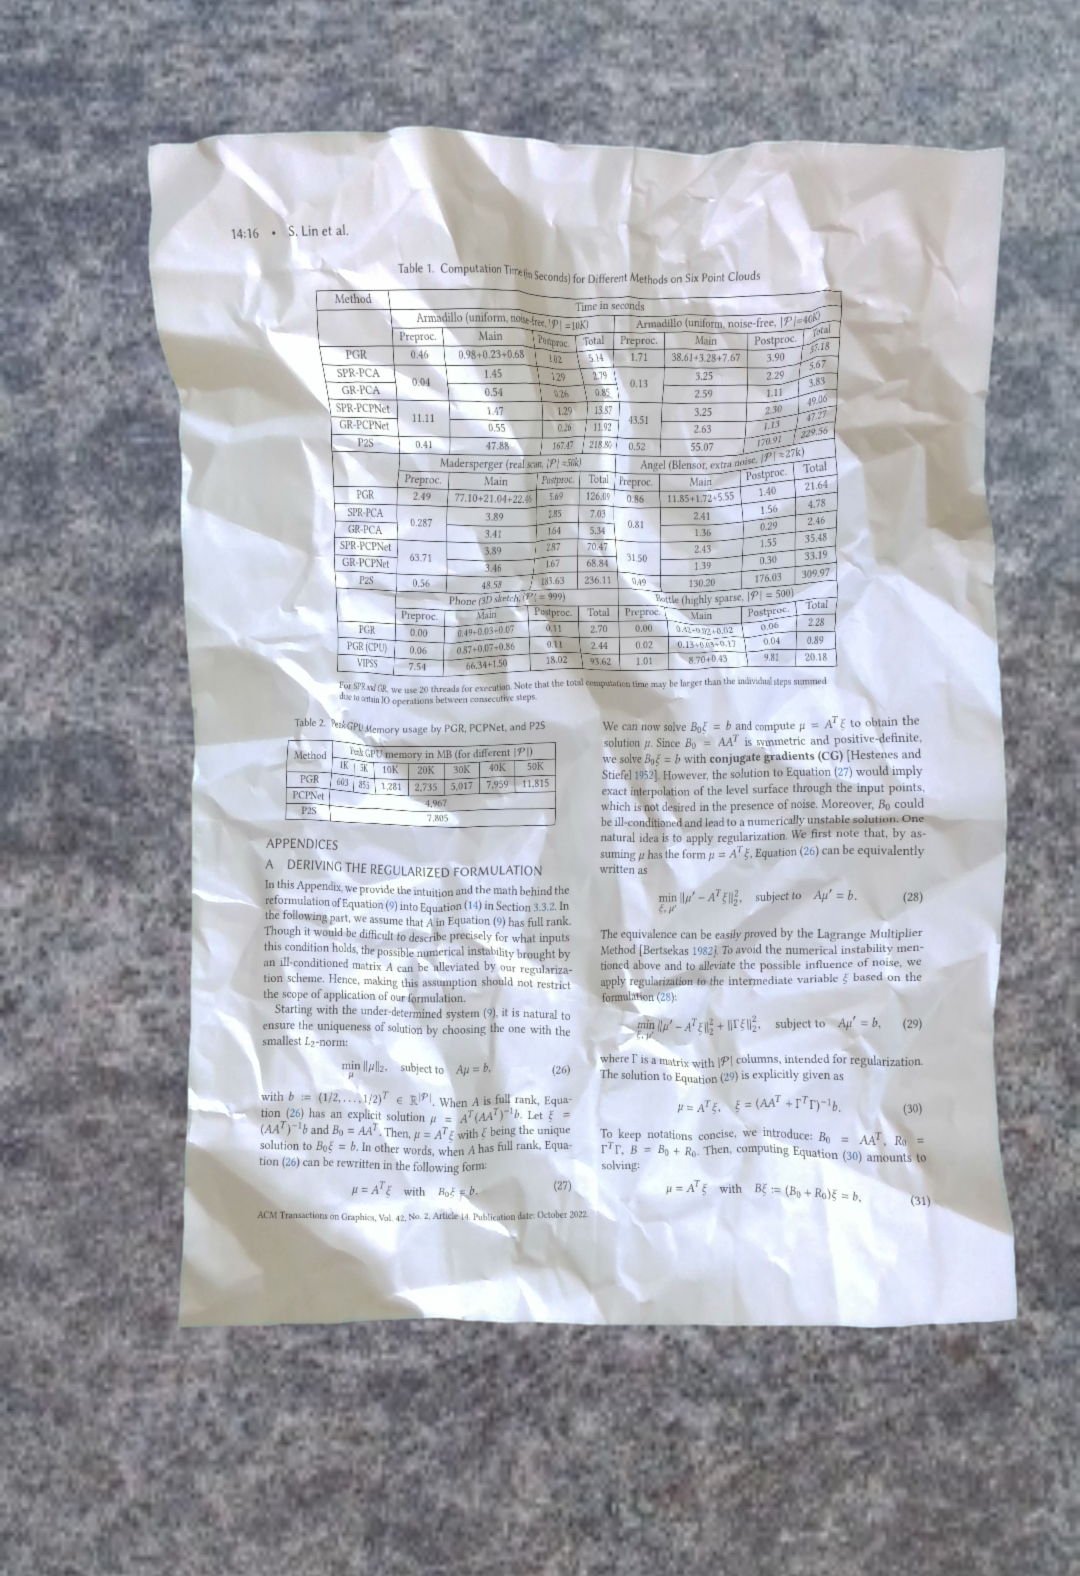
In addition to the quantitative comparisons made in the previous section, we provide a qualitative comparison to previous works. We show a side-by-side comparison of unwarped images by several methods in Fig. 5. The left-most column of input images are all images from the ”crop” subset. The images unwarped by our method are perceptually of high quality and have good unwarping at the borders of the document as well, even though we do not include explicit handling of borders or segmentation, in contrast to (Feng et al., 2021a; Ma et al., 2022; Zhang et al., 2022; Feng et al., 2022). Our method is also able to produce convincing unwarpings of images containing non-Latin characters. We present more qualitative results on real-world images in Figure 1. We include the unwarped images for all items in the DocUNet benchmark in the supplemental material.
5.3. Ablation study
We show the effectiveness of the dual task learning, i.e., combining predicting the 3D and the 2D grid meshes in the training process, as well as the benefit of combined training on both Doc3D and our UVDoc dataset, via ablation experiments. As we notice large variance in the OCR performance during our experiments, here we use averages of 10 repeated experiments with constant settings to perform the ablation study.
We first show that the dual task of learning the 3D grid along with the 2D grid improves the performance by comparing it against our full model but with the loss on removed. Table 3 shows that including the MSE loss on greatly improves the MS-SSIM, LD and AD metrics. On average MS-SSIM improves by 4.7%, LD by 8.8% and AD by 3.3%. These improvements are statistically significant, as indicated by the -values (one-tailed unpaired t-test) of , , , respectively. The average CER and ED scores degrade slightly, but these changes are not statistically significant, as indicated by the -values ( and , respectively).
| Method | MS-SSIM | LD | AD | CER | ED |
|---|---|---|---|---|---|
| Excl. 3D grid | 0.486 0.004 | 8.03 0.15 | 0.367 0.005 | 0.202 0.014 | 798 61 |
| Incl. 3D grid | 0.509 0.005 | 7.32 0.18 | 0.355 0.005 | 0.212 0.018 | 807 78 |
| Method | MS-SSIM | LD | AD | CER | ED |
|---|---|---|---|---|---|
| On Doc3D only | 0.487 0.003 | 7.92 0.18 | 0.364 0.005 | 0.202 0.011 | 770 44 |
| On Doc3D + UVDoc | 0.509 0.005 | 7.32 0.18 | 0.355 0.005 | 0.212 0.018 | 807 78 |
We show in Table 4 that training on a combination of the Doc3D and UVDoc datasets significantly improves the performance on all metrics, compared to training only on the Doc3D data. To ensure a fair comparison between the two, we double the number of epochs for the Doc3D-only training (both the number of epochs at a constant learning rate, as well as the number of epochs with linearly decaying learning rate), such that they process the same number of samples and have an equal amount of optimizer steps. Adding the UVDoc data to the training process leads to improvements of 4.5% for MS-SSIM, 7.6% for LD and 2.5% for AD ( and ). For CER and ED there is a small decrease in performance, but this change is not statistically significant ( and ). We attribute the improvement in visual metrics performance to the fact that our data (UVDoc) is closer in appearance to the real document photographs in the DocUNet dataset, as well as the fact that the 3D ground-truth data in our dataset is more physically accurate (albeit coarser), since we do not apply any smoothing to it.
 |
 |
 |
 |
 |
 |
 |
 |
 |
 |
 |
 |
 |
 |
 |
 |
 |
 |
 |
 |
 |
 |
 |
 |
 |
 |
 |
 |
 |
 |
 |
 |
 |
 |
 |
 |
 |
 |
 |
 |
 |
 |
 |
 |
 |
 |
 |
 |
 |
 |
 |
 |
 |
 |
 |
 |
 |
 |
 |
 |
 |
 |
 |
 |
 |
 |
 |
 |
 |
 |
 |
 |
| input | (Das et al., 2019) | (Feng et al., 2021a) | (Jiang et al., 2022) | (Xue et al., 2022) | (Ma et al., 2022) | (Zhang et al., 2022) | (Feng et al., 2022) | ours |
6. Conclusion
We presented CGU-Net, a multi-task deep learning approach to document image unwarping that implicitly encodes the coupling between the document’s 3D shape and its appearance in a 2D photograph. Our grid-based approach to document unwarping leverages a new dataset that is pseudo-photorealistic in appearance and includes numerous ground truth annotations, enabling a strong supervision signal during training. We demonstrate that the OCR metrics that are typically used in evaluation studies of document unwarping methods can be volatile and should be used with care. We achieve state-of-the-art performance on the DocUNet document unwarping benchmark using our dual-task network, trained on a combination of synthetic and pseudo-photorealistic data whilst also showing state-of-the-art efficiency. Our network sometimes can fail to recover small displacements, partially due to the coarse grid-based approach we use; in future work we wish to explore ways to refine the unwarping. Additionally, we would like to devise illumination correction on top of the geometric correction, to alleviate the shape-from-shading effect that makes some unwarped documents appear more distorted to the human eye than they geometrically are. We believe that this task could also benefit from the 3D representation learned by our network.
 |
References
- (1)
- Brown and Seales (2001) M.S. Brown and W.B. Seales. 2001. Document restoration using 3D shape: a general deskewing algorithm for arbitrarily warped documents. In Proceedings Eighth IEEE International Conference on Computer Vision. ICCV 2001, Vol. 2. 367–374 vol.2. https://doi.org/10.1109/ICCV.2001.937649
- Brown and Seales (2004) M.S. Brown and W.B. Seales. 2004. Image restoration of arbitrarily warped documents. IEEE Transactions on Pattern Analysis and Machine Intelligence 26, 10 (2004), 1295–1306. https://doi.org/10.1109/TPAMI.2004.87
- Cimpoi et al. (2014) Mircea Cimpoi, Subhransu Maji, Iasonas Kokkinos, Sammy Mohamed, and Andrea Vedaldi. 2014. Describing Textures in the Wild. In Proceedings of the 2014 IEEE Conference on Computer Vision and Pattern Recognition (CVPR ’14). IEEE Computer Society, USA, 3606–3613. https://doi.org/10.1109/CVPR.2014.461
- Das et al. (2019) Sagnik Das, Ke Ma, Zhixin Shu, Dimitris Samaras, and Roy Shilkrot. 2019. DewarpNet: Single-Image Document Unwarping With Stacked 3D and 2D Regression Networks. In Proceedings of the IEEE/CVF International Conference on Computer Vision (ICCV). 131–140. https://doi.org/10.1109/ICCV.2019.00022
- Das et al. (2021) Sagnik Das, Kunwar Yashraj Singh, Jon Wu, Erhan Bas, Vijay Mahadevan, Rahul Bhotika, and Dimitris Samaras. 2021. End-to-end Piece-wise Unwarping of Document Images. In Proceedings of the IEEE/CVF International Conference on Computer Vision. 4268–4277.
- Feng et al. (2021a) Hao Feng, Yuechen Wang, Wengang Zhou, Jiajun Deng, and Houqiang Li. 2021a. DocTr: Document Image Transformer for Geometric Unwarping and Illumination Correction. In Proceedings of the 29th ACM International Conference on Multimedia (MM ’21). Association for Computing Machinery, New York, NY, USA, 273–281. https://doi.org/10.1145/3474085.3475388
- Feng et al. (2021b) Hao Feng, Wengang Zhou, Jiajun Deng, Qi Tian, and Houqiang Li. 2021b. DocScanner: Robust Document Image Rectification with Progressive Learning. https://doi.org/10.48550/ARXIV.2110.14968
- Feng et al. (2022) Hao Feng, Wengang Zhou, Jiajun Deng, Yuechen Wang, and Houqiang Li. 2022. Geometric Representation Learning for Document Image Rectification. In Computer Vision – ECCV 2022: 17th European Conference, Tel Aviv, Israel, October 23–27, 2022, Proceedings, Part XXXVII. Springer-Verlag, Berlin, Heidelberg, 475–492. https://doi.org/10.1007/978-3-031-19836-6_27
- Jiang et al. (2022) Xiangwei Jiang, Rujiao Long, Nan Xue, Zhibo Yang, Cong Yao, and Guisong Xia. 2022. Revisiting Document Image Dewarping by Grid Regularization. 2022 IEEE/CVF Conference on Computer Vision and Pattern Recognition (CVPR) (2022), 4533–4542.
- Kil et al. (2017) Taeho Kil, Wonkyo Seo, Hyung Il Koo, and Nam Ik Cho. 2017. Robust Document Image Dewarping Method Using Text-Lines and Line Segments. In 2017 14th IAPR International Conference on Document Analysis and Recognition (ICDAR), Vol. 01. 865–870. https://doi.org/10.1109/ICDAR.2017.146
- Kim et al. (2015) Beom Su Kim, Hyung Il Koo, and Nam Ik Cho. 2015. Document dewarping via text-line based optimization. Pattern Recognition 48, 11 (2015), 3600–3614. https://doi.org/10.1016/j.patcog.2015.04.026
- Kingma and Ba (2015) Diederik P Kingma and Jimmy Ba. 2015. Adam: A Method for Stochastic Optimization. ICLR, San Diego (2015).
- Koo et al. (2009) Hyung Il Koo, Jinho Kim, and Nam Ik Cho. 2009. Composition of a Dewarped and Enhanced Document Image From Two View Images. IEEE Transactions on Image Processing 18, 7 (2009), 1551–1562. https://doi.org/10.1109/TIP.2009.2019301
- Li et al. (2019) Xiaoyu Li, Bo Zhang, Jing Liao, and Pedro V. Sander. 2019. Document rectification and illumination correction using a patch-based CNN. ACM Transactions on Graphics (TOG) 38 (2019), 1 – 11.
- Liang et al. (2005) Jian Liang, D. DeMenthon, and D. Doermann. 2005. Flattening curved documents in images. In 2005 IEEE Computer Society Conference on Computer Vision and Pattern Recognition (CVPR’05), Vol. 2. 338–345 vol. 2. https://doi.org/10.1109/CVPR.2005.163
- Liang et al. (2008) Jian Liang, Daniel DeMenthon, and David S. Doermann. 2008. Geometric Rectification of Camera-Captured Document Images. IEEE Transactions on Pattern Analysis and Machine Intelligence 30 (2008), 591–605.
- Liu et al. (2008) Ce Liu, Jenny Yuen, Antonio Torralba, Josef Sivic, and William T Freeman. 2008. Sift flow: Dense correspondence across different scenes. In European conference on computer vision. Springer, 28–42.
- Liu et al. (2020) Xiyan Liu, Gaofeng Meng, Bin Fan, Shiming Xiang, and Chunhong Pan. 2020. Geometric rectification of document images using adversarial gated unwarping network. Pattern Recognit. 108 (2020), 107576.
- Ma et al. (2022) Ke Ma, Sagnik Das, Zhixin Shu, and Dimitris Samaras. 2022. Learning From Documents in the Wild to Improve Document Unwarping. In ACM SIGGRAPH 2022 Conference Proceedings (SIGGRAPH ’22). Association for Computing Machinery, New York, NY, USA, Article 34, 9 pages. https://doi.org/10.1145/3528233.3530756
- Ma et al. (2018) Ke Ma, Zhixin Shu, Xue Bai, Jue Wang, and Dimitris Samaras. 2018. DocUNet: Document Image Unwarping via a Stacked U-Net. 2018 IEEE/CVF Conference on Computer Vision and Pattern Recognition (2018), 4700–4709.
- Meng et al. (2018) Gaofeng Meng, Yuanqi Su, Ying Wu, Shiming Xiang, and Chunhong Pan. 2018. Exploiting Vector Fields for Geometric Rectification of Distorted Document Images. In Computer Vision – ECCV 2018: 15th European Conference, Munich, Germany, September 8-14, 2018, Proceedings, Part XVI. Springer-Verlag, Berlin, Heidelberg, 180–195. https://doi.org/10.1007/978-3-030-01270-0_11
- Meng et al. (2014) Gaofeng Meng, Ying Wang, Shenquan Qu, Shiming Xiang, and Chunhong Pan. 2014. Active Flattening of Curved Document Images via Two Structured Beams. In 2014 IEEE Conference on Computer Vision and Pattern Recognition. 3890–3897. https://doi.org/10.1109/CVPR.2014.497
- Navarro (2001) Gonzalo Navarro. 2001. A Guided Tour to Approximate String Matching. ACM Comput. Surv. 33, 1 (mar 2001), 31–88. https://doi.org/10.1145/375360.375365
- Tsoi and Brown (2007) Yau-Chat Tsoi and Michael S. Brown. 2007. Multi-View Document Rectification using Boundary. In 2007 IEEE Conference on Computer Vision and Pattern Recognition. 1–8. https://doi.org/10.1109/CVPR.2007.383251
- Ulges et al. (2004) Adrian Ulges, Christoph H. Lampert, and Thomas Breuel. 2004. Document Capture Using Stereo Vision. In Proceedings of the 2004 ACM Symposium on Document Engineering (DocEng ’04). Association for Computing Machinery, New York, NY, USA, 198–200. https://doi.org/10.1145/1030397.1030434
- Wang et al. (2004) Zhou Wang, Alan C Bovik, Hamid R Sheikh, and Eero P Simoncelli. 2004. Image quality assessment: from error visibility to structural similarity. IEEE transactions on image processing 13, 4 (2004), 600–612.
- Wang et al. (2003) Z. Wang, E.P. Simoncelli, and A.C. Bovik. 2003. Multiscale structural similarity for image quality assessment. In The Thrity-Seventh Asilomar Conference on Signals, Systems Computers, 2003, Vol. 2. 1398–1402 Vol.2. https://doi.org/10.1109/ACSSC.2003.1292216
- Xie et al. (2020) Guo-Wang Xie, Fei Yin, Xu-Yao Zhang, and Cheng-Lin Liu. 2020. Dewarping Document Image by Displacement Flow Estimation with Fully Convolutional Network. In Document Analysis Systems, Xiang Bai, Dimosthenis Karatzas, and Daniel Lopresti (Eds.). Springer International Publishing, Cham, 131–144.
- Xie et al. (2021) Guo-Wang Xie, Fei Yin, Xu-Yao Zhang, and Cheng-Lin Liu. 2021. Document Dewarping with Control Points. In Document Analysis and Recognition – ICDAR 2021, Josep Lladós, Daniel Lopresti, and Seiichi Uchida (Eds.). Springer International Publishing, Cham, 466–480.
- Xue et al. (2022) C. Xue, Z. Tian, F. Zhan, S. Lu, and S. Bai. 2022. Fourier Document Restoration for Robust Document Dewarping and Recognition. In 2022 IEEE/CVF Conference on Computer Vision and Pattern Recognition (CVPR). IEEE Computer Society, Los Alamitos, CA, USA, 4563–4572. https://doi.org/10.1109/CVPR52688.2022.00453
- Yamashita et al. (2004) A. Yamashita, A. Kawarago, T. Kaneko, and K.T. Miura. 2004. Shape reconstruction and image restoration for non-flat surfaces of documents with a stereo vision system. In Proceedings of the 17th International Conference on Pattern Recognition, 2004. ICPR 2004., Vol. 1. 482–485 Vol.1. https://doi.org/10.1109/ICPR.2004.1334171
- You et al. (2018) Shaodi You, Yasuyuki Matsushita, Sudipta Sinha, Yusuke Bou, and Katsushi Ikeuchi. 2018. Multiview Rectification of Folded Documents. IEEE Transactions on Pattern Analysis and Machine Intelligence 40, 2 (2018), 505–511. https://doi.org/10.1109/TPAMI.2017.2675980
- Zhang et al. (2022) Jiaxin Zhang, Canjie Luo, Lianwen Jin, Fengjun Guo, and Kai Ding. 2022. Marior: Margin Removal and Iterative Content Rectification for Document Dewarping in the Wild. In Proceedings of the 30th ACM International Conference on Multimedia (MM ’22). Association for Computing Machinery, New York, NY, USA, 2805–2815. https://doi.org/10.1145/3503161.3548214
- Zhang and Tan (2005) L. Zhang and C.L. Tan. 2005. Warped image restoration with applications to digital libraries. In Eighth International Conference on Document Analysis and Recognition (ICDAR’05). 192–196 Vol. 1. https://doi.org/10.1109/ICDAR.2005.252
- Zhang et al. (2008) Li Zhang, Yu Zhang, and Chew Tan. 2008. An Improved Physically-Based Method for Geometric Restoration of Distorted Document Images. IEEE Transactions on Pattern Analysis and Machine Intelligence 30, 4 (2008), 728–734. https://doi.org/10.1109/TPAMI.2007.70831
- Zhang et al. (2004) Zheng Zhang, Chew Lim Tan, and Liying Fan. 2004. Restoration of curved document images through 3D shape modeling. In Proceedings of the 2004 IEEE Computer Society Conference on Computer Vision and Pattern Recognition, 2004. CVPR 2004., Vol. 1. I–I. https://doi.org/10.1109/CVPR.2004.1315007
Appendix A Recovering the grid
Using the UV-lit image, where the printed grid is visible, we obtain the pixel coordinates of the grid points on the deformed piece of paper. We then need to compute their correspondences to the vertices of a regular grid, which is equivalent to ordering them as an grid. We solve the ordering problem in 3 steps:
-
(1)
Finding top-left corner. We first find the top-left corner of the grid. We compute the two principal components of the detected grid points and define the diagonal direction of the grid as the sum of these two components. Then on each point, we draw a line orthogonal to this diagonal direction and we count the number of points on each side of the line. The top-left corner is then the point that has exactly zero points to its left. The process is illustrated in Fig. 7.
-
(2)
Ordering border points. Next we want to find all border points. For this we use a segmentation of the paper that we obtain by thresholding the UV-lit image. Based on this segmentation, we use OpenCV’s findContours function to extract an ordered contour polyline. For each contour vertex, we find the nearest neighbor point in the set of grid points. Then we define our grid border points as the 296 grid points — the number of points on the border of the grid — that are most frequently found as nearest neighbor.
Finally, because the contour extracted using OpenCV is ordered, we can also order the detected grid border points.
-
(3)
Ordering interior points. The final step is to order the points that lie in the interior of the grid. We iteratively identify all points in row-major ordering, starting from point (the top-left interior grid point). We do this (for point ) by finding the three nearest yet-unordered grid points for each of the previously-ordered points , , and (the points to the top-left, top and left of the point we are currently trying to identify). The point that is in the intersection of these three nearest-neighbor sets is chosen as point (using the average distance to the three reference points as a tiebreaker in case the intersection contains multiple points). This point is then considered ordered, and we continue with the next point.