Simulation tumor growth in heterogeneous medium based on diffusion equation
Abstract
In the present article the diffusion equation is used to model the spatio-temporal dynamics of a tumor, taking into account the heterogeneous of the medium. This approach makes it possible to take into account the complex geometric shape of the tumor in modeling. The main purpose of the work is demonstration the applicability of this approach by comparing the obtained results with the data of clinical observations. We used an algorithm based on an explicit finite-difference approximation of differential operators for solve the diffusion equation. The ranges of possible values that the input parameters of the model can take to match the results of clinical observations are obtained. It is concluded that the heterogeneity of the physical parameters of the model, in particular the diffusion coefficient, has a significant effect on shape of tumor.
Keywords: tumor modeling, diffusion equation, spatiotemporal dynamics of tumor, tumor growth, simulations
1 Introduction
The incidence of cancer according to the World Health Organization (WOS) is the second most common reason of death in the world, as it accounts for approximately 10 million deaths, or one in six deaths [1]. Tumors arise due to the deformation of genes as a result of damage to the DNA of the body under the influence of various factors inherited by the body or acquired in the course of life. Benign tumors are a group of pathological cells limited by a certain cavity [2, 3]. They become malignant when the area of the tumor lesion extends beyond the cavity, going beyond the basement membrane. For the vital activity of pathological cells, a greater amount of nutrients and oxygen is required than in healthy cells, which is provided by their transportation through blood vessels. The phenomenon of angiogenesis is based on the formation of new blood vessels around cancer cells [4, 5]. In addition, metastasis is a significant problem. With the transfer of blood or lymph, malignant cells form a lesion in a new area of the body. Metastases are one of the main causes of cancer mortality [6]. Tumor diseases are classified by the type of cells involved in the disease process and by the tissues in which they are formed. Currently, there are various approaches to cancer treatment. For example, radiation therapy, hormone therapy, tumor surgery, chemotherapy, immunotherapy, etc. [7, 8, 9, 10, 11]. Each of these methods has its disadvantages, advantages and limits of applicability (including depending on the type of tumor itself). Moreover, the evaluation of the effectiveness of treatment by one of the methods or a combination of them is carried out for each individual neoplasm, taking into account a set of individual qualities of the organism that affect the tumor. With the passage of time and the development of the disease, the possible effectiveness and applicability of the chosen therapy naturally decreases. As cell populations accumulate more and more changes, they acquire characteristics that allow them to persist in biological tissues for a long time [12, 13]. Often, with unsuccessful attempts to stop the spread of the tumor, when treatment becomes a complex process with the onset of the last stages, the moment of its uncontrolled growth begins, in which the probability of recovery is extremely small and rapidly decreases every day. The natural resistance of the organism to the disease in question is completely insufficient to slow down the effect of cancer cells on healthy cells and their spread. In addition, it is quite problematic to detect a tumor in the early stages. Therefore, this disease is considered one of the most dangerous.
To solve some of the above problems, methods of mathematical and numerical modeling are widely used, which consist in simulating growth at all stages of its development, when it is possible to predict how accurately the development of therapy will be and to identify a neoplasm in the disease. An important aspect is the prediction of the spread of pathological processes in cells in biological tissues, as well as stopping or slowing down this process. One of the works on the statistics of statistics is [14]. It predicts the dynamics of growth and endothelium. In [15] the proposed model is expanded and analyzed in a wider range of applications. finding that angiogenic therapy, as one of the research methods, is sufficient. Model-based studies have been encountered to derive composite structures and processes in cancer [16, 17] and have been used to propose new experiments to develop different detection methods as well as disease risk analysis [18, 19]. Quantitative descriptions of the mechanisms that lead to cancer at different scales of space and time lead to new problems, which are solved by conducting new experiments and applying mathematical models based on empirical data. In the work [20] the identification of a periodic mathematical model of cancer treatment by radiation therapy with the identification of chemo-therapy. The obtained solutions make it possible to find conditions under which successful cancer treatment is possible.
At present, general mathematical models of tumors consider and take into account the structural nature of the tissue and the need of a growing tumor to involve blood vessels, due to which, from a certain moment, the neoplasm spreads. There are several groups of mathematical models for describing tumor diseases. There are multiphase models based on the fact that conventionally a tumor consists of at least three components: cells, extracellular matrix, and extracellular fluid. In such cases, the structure of the tumor is often simplified, considering it as a liquid, less often a solid substance [21]. There are also nested models, the essence of which is to study the system at the cellular or tissue level. Here much attention is paid to the chemical characteristics of the considered medium [22]. A model based on the dynamic interaction of a large number of cells should take into account, among other things, the physical properties of individual cells (volume, properties of various mechanical effects, etc.). Ordinary differential equations and partial differential equations [23] are used together to model the growth of a metastatic tumor. In particular, such models are used to study lung cancer and breast cancer. Finally, hybrid models are used that combine the paradigms of both the discrete structure of the tumor and the continuum [24, 25].
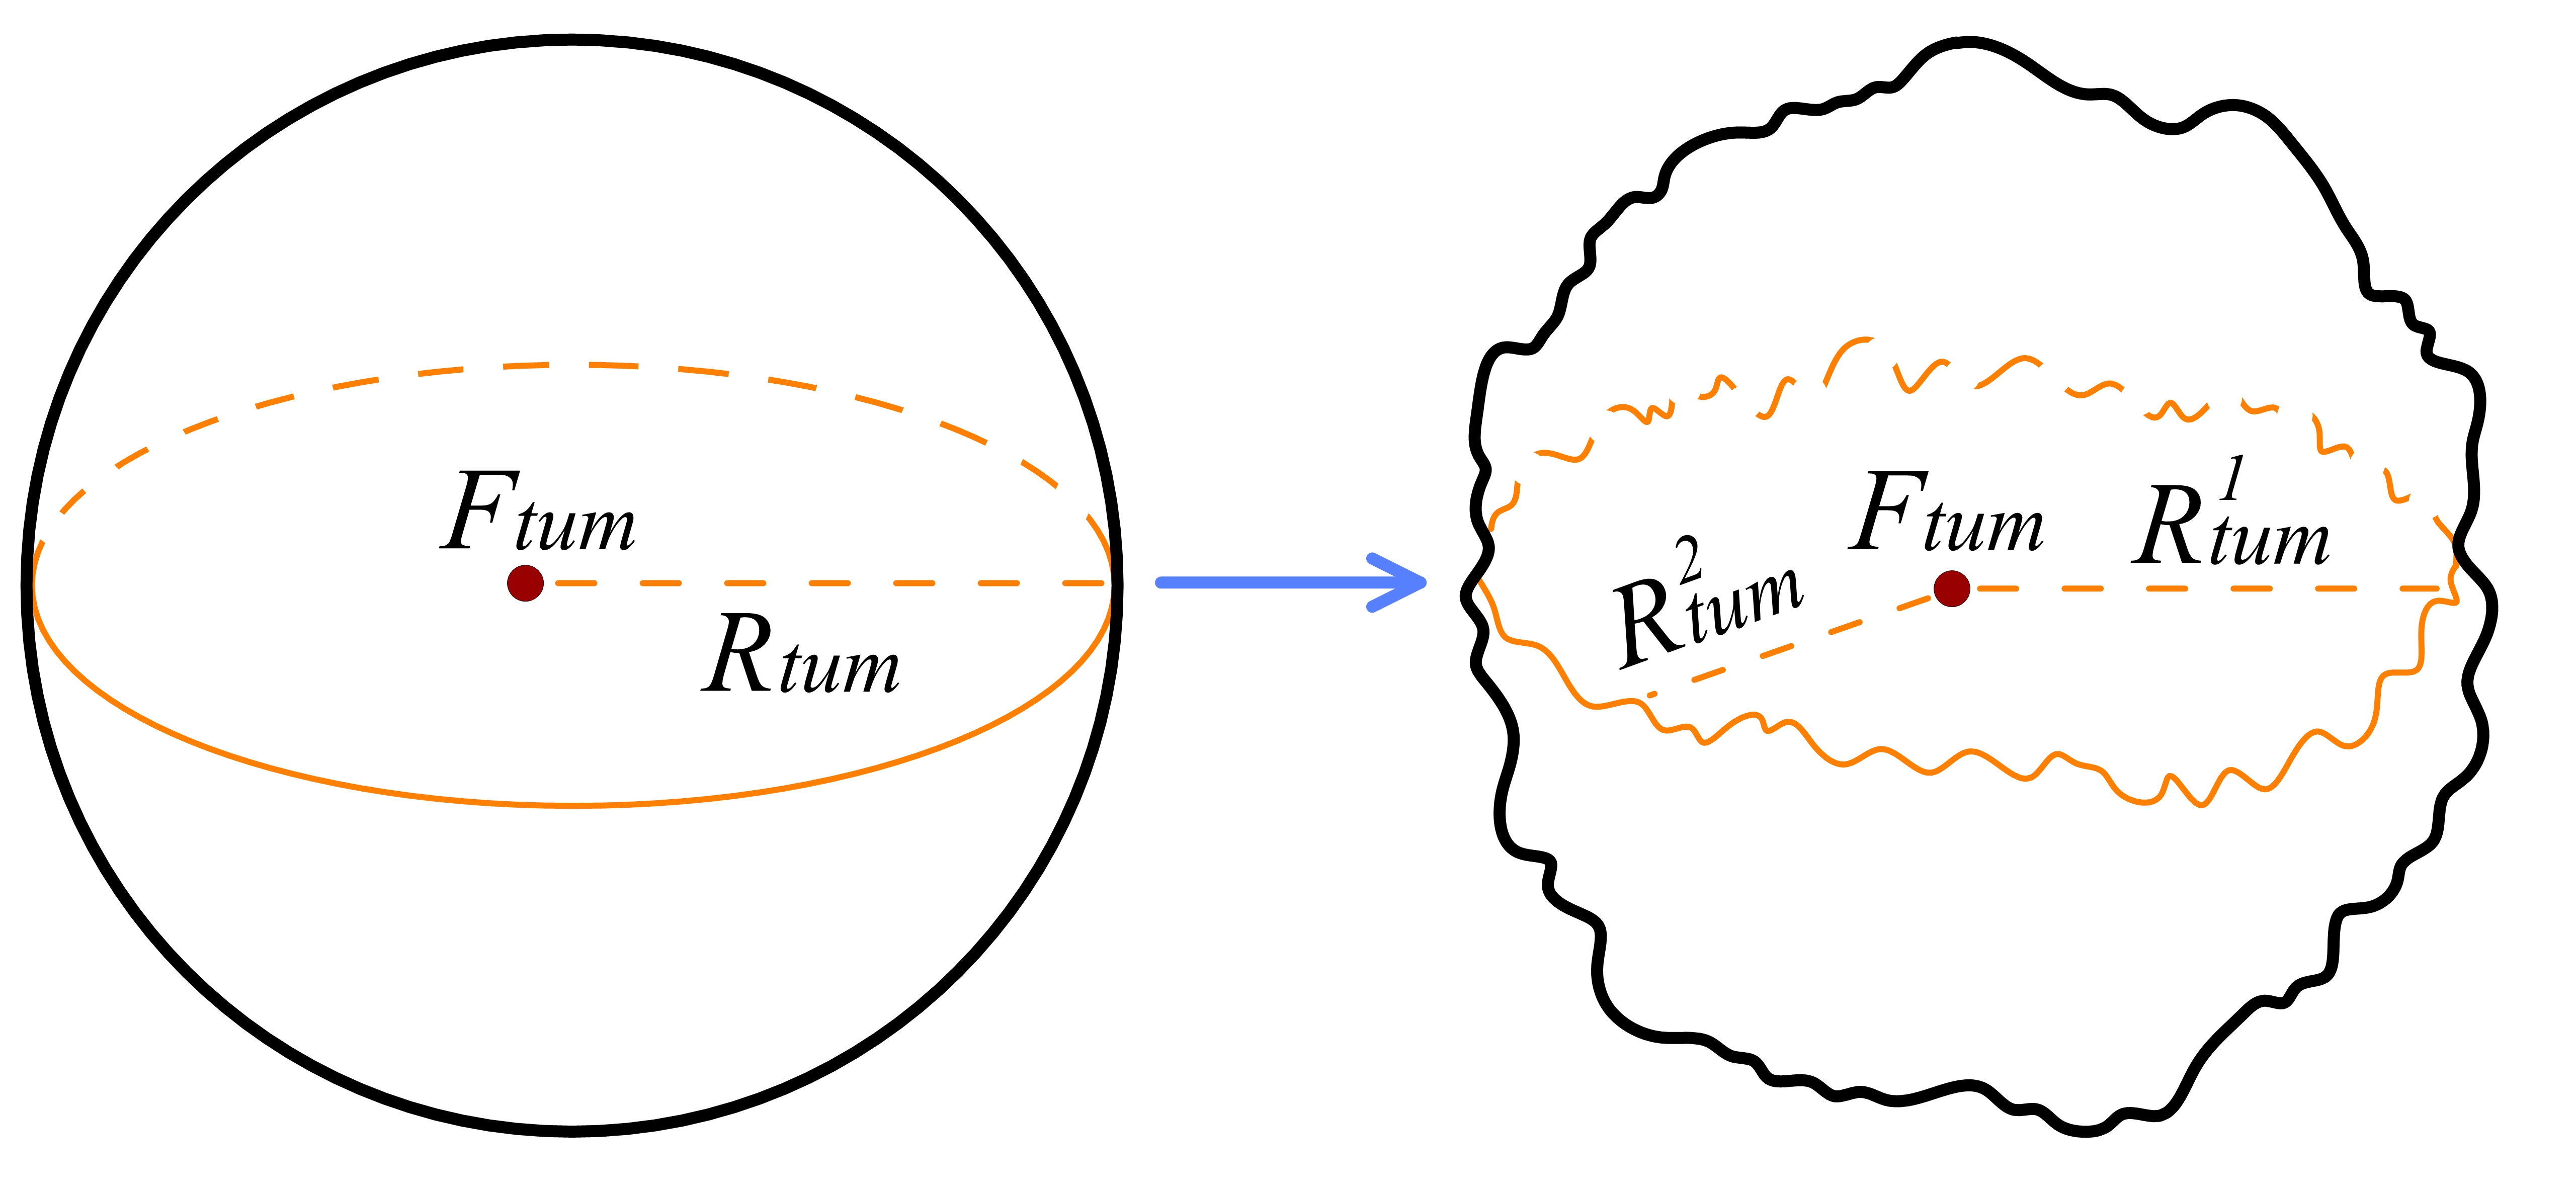
In many works (see for example [14, 26]), the mathematical model of tumor dynamics is based on systems of ordinary differential equations, where the volume of healthy tissue, the volume of tissue affected by a cancerous tumor and some others are used as calculated quantities. One of the assumptions of this approach is to take into account the tumor as a spherical object, although in reality the form of cancerous tumors has a much more complex spatial structure. One of the goals of developing our model is the transition from a spherical tumor model to a spatially heterogeneous one (Fig. 1).
In the work [27], a mathematical model of cancer development is proposed, according to which a growing tumor is described as a poroelastic medium consisting of solid and liquid components. In this mechanical description of the dynamics of tumor growth, the basic equations of tumor growth are introduced and combined with deformations and substantially nonlinear factors determining the physical process in order to increase the accuracy and efficiency of the modeling process. The study of the role of the internal heterogeneity of the cells of the body, arising from variations in the parameters of the cell cycle and apoptosis, is an important step towards better information about the drugs used. Such models [28] allow taking into account an antimitotic drug whose effect on cell dynamics is to cause mitosis to stop, increasing the average duration of the cell cycle. A special place in the study of this problem is occupied by models of tumor growth based on cellular automata. Based on the data of mathematical models in [29], the process of growth of a malignant brain tumor is investigated. It has been shown that the macroscopic behavior of a tumor can be realistically modeled using microscopic parameters. Based on such models, it is possible to predict the composition and dynamics of the tumor at specified points in time, which is sufficiently consistent with medical data. The article [30] offers a mathematical model of triple negative breast cancer. The mathematical model includes the interaction between tumor cells, innate and adaptive immune cells, programmed cell death protein, programmed death ligand and immune checkpoint inhibitor.
We note separately a class of inverse problems that allow us to determine the free parameters of the model by comparing the observed data and the simulation results. For example, in the work [31], the coefficient of thermal conductivity and the specific heat capacity of biological tissues, including tumor tissue, are calculated by optimization methods based on known distributions of breast temperature. A similar approach is also applicable for calculating the parameters of a cancerous tumor, according to the known dependencies of the dynamics of diameter and volume obtained on the basis of medical measurements.
In this article, we propose a method for modeling the spatial dynamics of a cancerous tumor based on the diffusion equation. This approach is applicable to the description of porous media, which is the system under study [32]. Software has been developed for calculating the spatio-temporal dynamics of cancerous tumors based on grid numerical methods. We investigate the problem of selecting coefficients for the diffusion mass transfer equation describing the process of cancer tumor growth based on numerical modeling methods and using the results of medical examinations. In addition, ranges of values of the free parameters of the model satisfying the observed data are obtained. The analysis of the results confirms the applicability of the approach proposed in the work for modeling tumor growth.
Prefixing the presentation of our research results in Section 1, we give a brief overview of the achievements in the study of the dynamics of cancer tumors both in medicine in general and in the field of mathematical modeling. Section 2 describes a mathematical model, numerical methods and algorithms for solving the resulting dynamic system. In Section 3, we present the results of our set of simulations and the degree to which they correspond to the observed data, and also give the limits of the applicability of the model. We summarize and discuss our results in Section 4.
2 Mathematical model and methods for numerical analysis of growth process of a cancerous tumor
2.1 Mathematical model of spatio-temporal dynamics of a cancerous tumor
As a basic model for describing spatial dynamics of a cancerous tumor, we will use diffusion equation, since it allows us to take into account the nonlinearity of spatial distribution and the gradual damage to new areas of still healthy cells [33, 34]. The direction of propagation is given by a constant coefficient. The process of spreading cancer cells in healthy tissues at a given rate in a three-dimensional coordinate system is described by the equation
| (1) |
where , , is rate of spread of a cancerous tumor in space along corresponding axes of the Cartesian coordinate system, is degree of tissue damage in some area, is propagation factor, is function that characterizes focus of disease , is resistance parameter of the organism to tumor development. The value specifies the dependence of the system on use of any therapy, or the natural resistance of the disease of the immune system, or clearance.
2.2 Clinical study data
We used the data published in the article [35] to validate our mathematical and numerical models. The presented data contain information about change in size of cancerous tumors for 10 patients. The measurements were carried out on basis of serial magnetic resonance imaging (MRI) studies. Tumor volumes were determined by manual segmentation on serial image to study natural course and growth of lesion. The data obtained have an error due to both applied method of medical examination and image processing algorithms. Nevertheless, data obtained qualitatively describe well the process of tumor tissue volume growth.
2.3 Numerical methods and computational technologies
A three-dimensional multilayer scheme is used for numerical solution of the equation Eq. 2.1. We consider problem in the Cartesian coordinate system . The integration region under consideration is covered by a spatially fixed (Eulerian) computational three-dimensional grid, which is a set of rectangular cells with sides equal to the length , and . Computational grid is uniform, that is, cell size is constant throughout area of problem. Center of cell, respectively, will be located at point with coordinates , and , which are integers. Variables are discrete and are associated with nodes of spatial grid, which is given in form and with nodes of time grid, which is represented in form . The time grid step varies, i.e. it is non-uniform (), in contrast, as already noted, step in space does not change from time step (). In the process of approximating Eq. (2.1) being solved, we obtain an explicit difference scheme for solving it with respect to desired value in the Cartesian coordinate system () for each cell in it ():
| (2) |
Variables with fractional indices here refer to boundaries of calculated cells, and are defined as follows:
| (3) |
| (4) |
| (5) |
It is necessary to set the parameters, in particular, the values of to be correct for given problem being solved, for a sufficient description of dynamic system at considered level of detail and approximation. We present a finite-difference approximation for the values of the coefficients for our problem
| (6) |
| (7) |
| (8) |
| (9) |
| (10) |
| (11) |
where , and . Flows through boundaries of the constructed Euler cells, due to force transfer, are expressed in this scheme through the value .
This numerical scheme (2.3) is only conditionally stable, like any explicit scheme. Analysis of stability of scheme (6) gives exact limit of its application:
| (12) |
where is Courant number. In all the cases presented in this article, the calculations were carried out for the values of the Courant number , which was selected on basis of experiments performed.
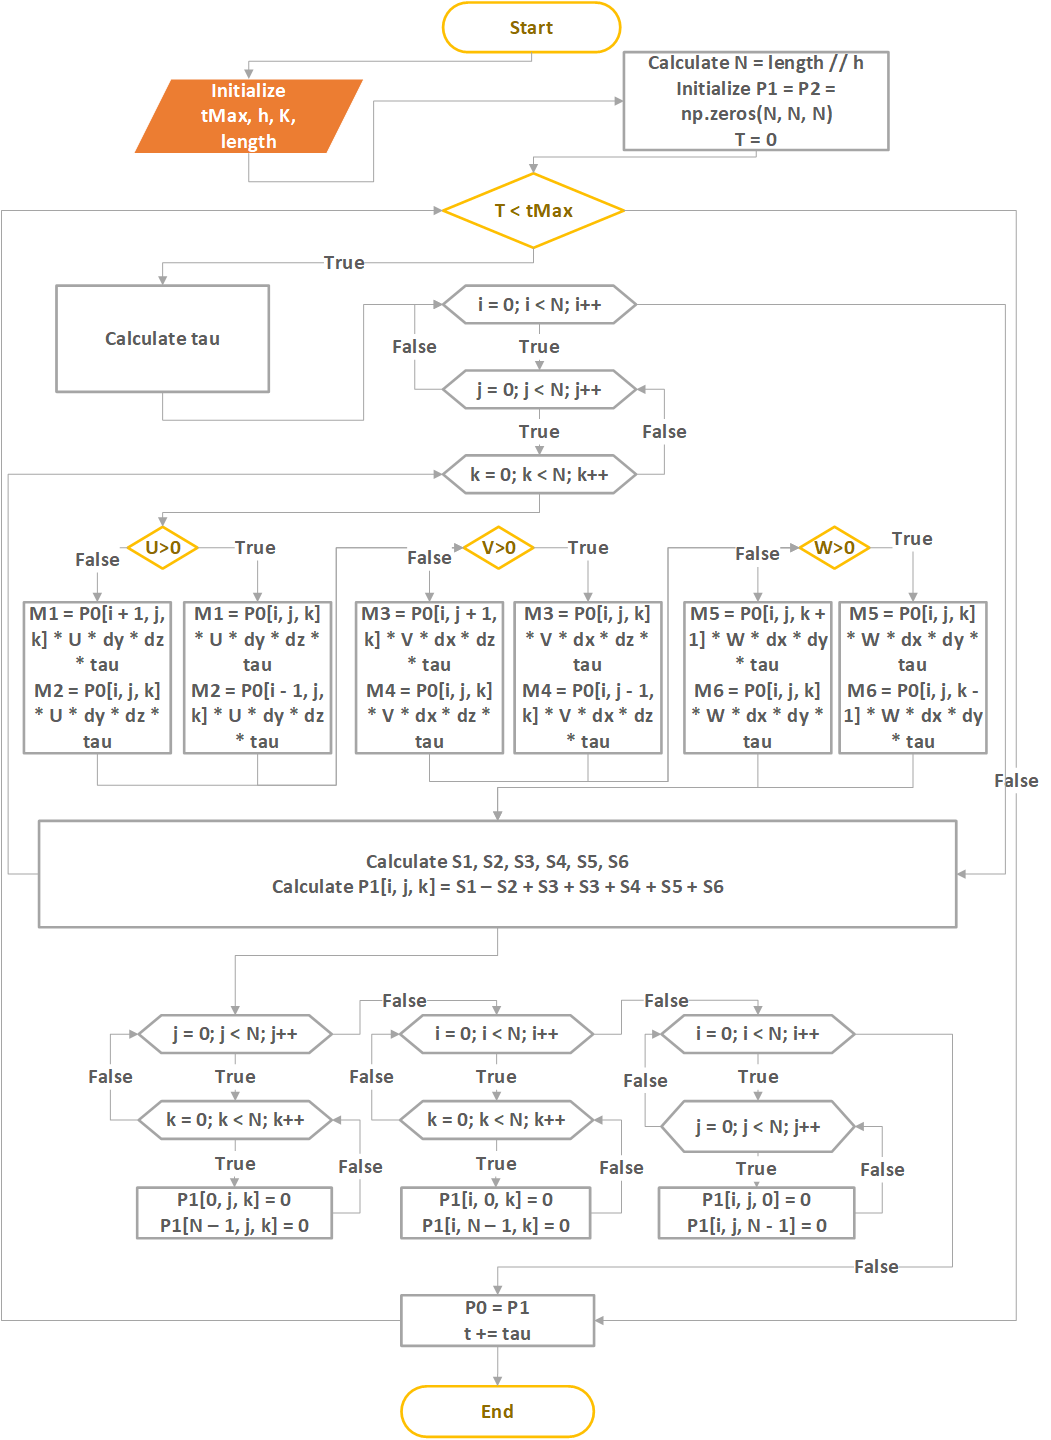
Software was developed in programming languages C# and Python for numerical solution of the Eq. 2.1 based on given finite difference approximation. The block diagram of developed software package is shown in Fig. 2.
Number of cells is calculated after initializing input parameters of model based on the spatial step . Next, a time loop is started, which is executed until time reaches the specified value . In cycle intermediate values of finite difference scheme are calculated. At output we get the concentration of cancer cells in some area using these values.
3 Results of computational experiments on simulation tumor growth
3.1 Search for initial parameters of a mathematical model based on clinical observation data
We define the boundaries of the variable parameters used to study tumor growth in this section. We find the parameter , which determines rate of spread of disease. This parameter may depend on many factors, such as the patient’s age, gender, genetic predisposition, etc. We will compare simulation results with data from patients who have been diagnosed with glioma, a primary brain tumor [36]. It has many subtypes, which are not taken into account in the mathematical model at this stage. The risk criteria for a family of such tumors should also include, among other things, astrocytoma subtype and presence of a neurological deficit [37]. In the article[35], according to the Mann-Whitney statistical test, it was found that in people under 50 years of age, development of disease proceeds much more slowly [38]. Trends towards lower growth rates compared to male patients were also observed in female patients.
Analysis of changes in tumor volume is more informative than analysis of changes in its diameter. This follows from the fact that tumor, at the time of its discovery and over time, is not strictly geometric, although in general terms it is ellipsoid and oblong. Diameter analysis does not give us the accuracy of measurements that volume analysis does, since it also does not take into account sufficiently strong roughness of tumor boundaries (see Fig. 1). It should be noted that we will not consider study of disease with variation in the general direction of tumor development, since disease can develop in those directions that are very difficult to predict. That is, direction is given randomly in our approximation. In addition, rate of spread of disease in different tissues of body can also vary significantly. We also determine the diffusion coefficient , which is a free parameter in our model.
We apply the least squares method to find the parameters and . This method is based on minimizing sum of squared deviations of simulation results from the results of clinical examination of patient at each point in time. As a result, the values of initial parameters of models were obtained for 10 patients (Table 1).
| (mkm2/s) | (mkm/s) | |
|---|---|---|
| Model 1 (a) | 2.2 | 1.9 |
| Model 2 (b) | 2.45 | 2.36 |
| Model 3 (c) | 1.88 | 2.34 |
| Model 4 (d) | 3.73 | 3.14 |
| Model 5 (e) | 3.51 | 2.88 |
| Model 6 (f) | 3.67 | 3.22 |
| Model 7 | 1.81 | 1.8 |
| Model 8 | 2.51 | 1.69 |
| Model 9 | 3.89 | 2.79 |
| Model 10 | 3.47 | 2.96 |
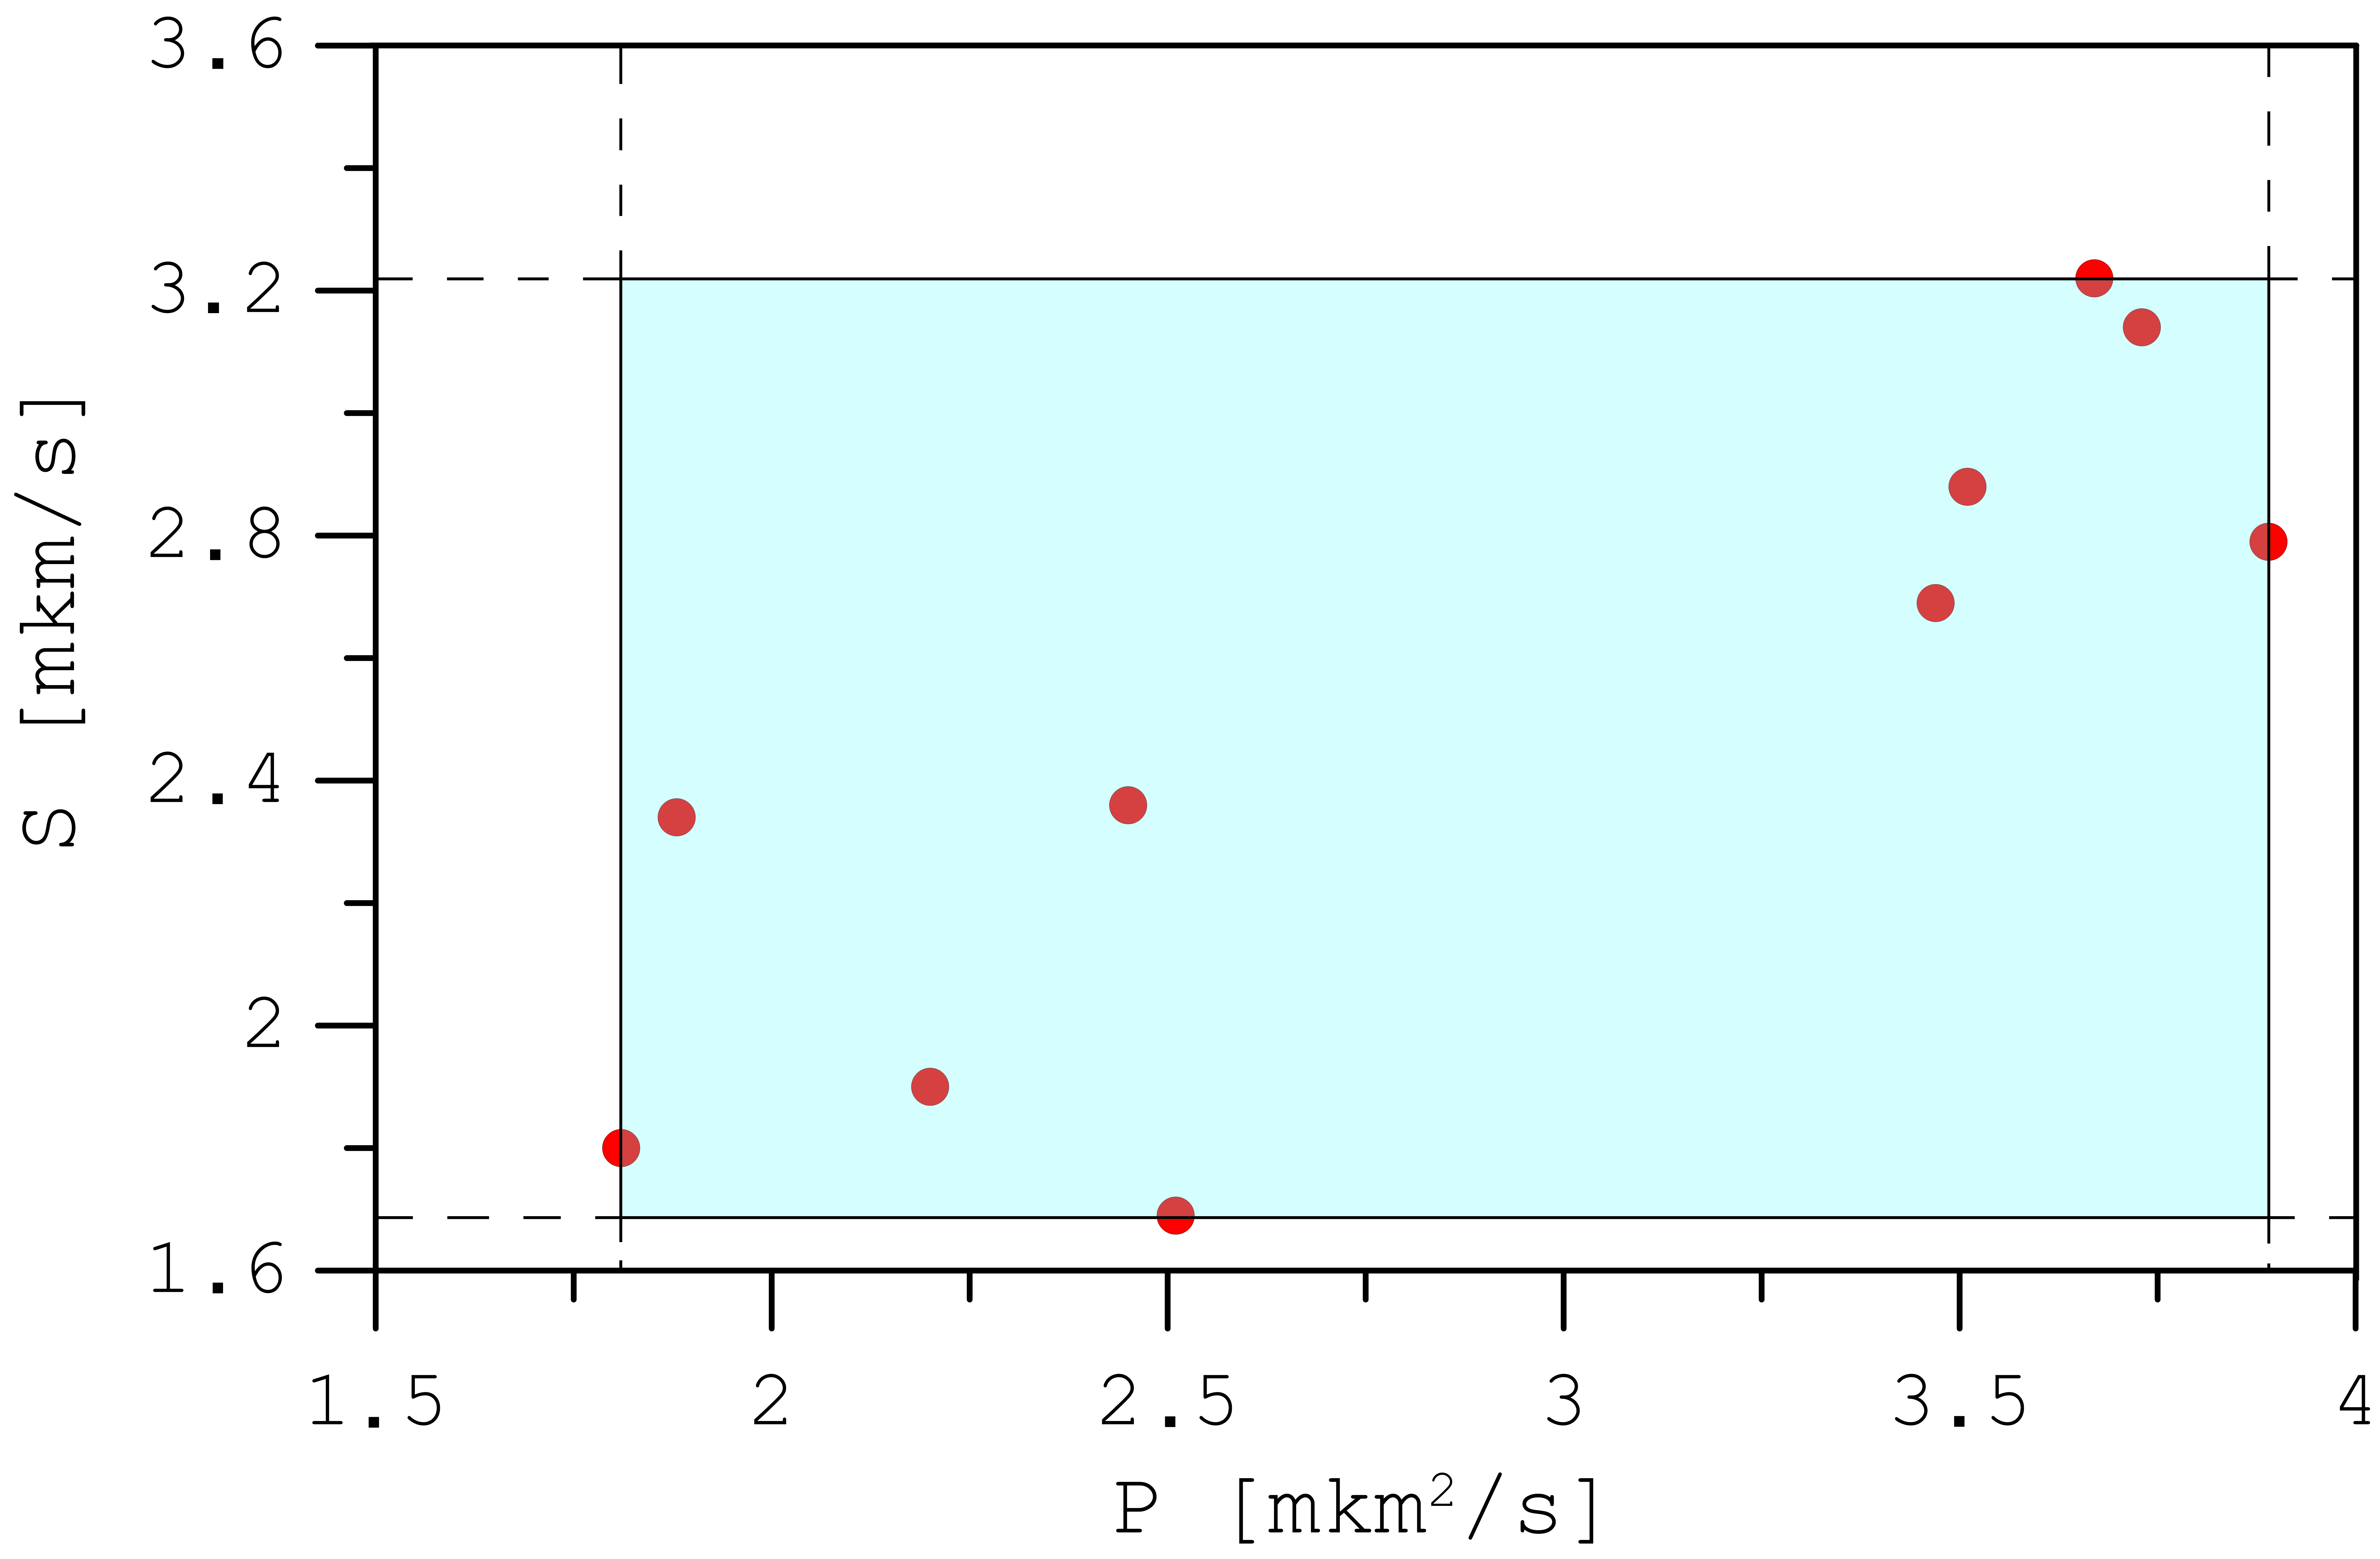
Note the limits within which values of free parameters of model can lie. The blue color in the Fig. 3 shows area in which the values of and for the 10 considered patients may lie. As a result, we get that range of values for the modulus of speed : 1.69 mkm/s 3.22 mkm/s, and for the values of tumor spread coefficient : 1.81 mkm2/s 3.89 mkm2/s.
The mean sample values of the parameters for a ”typical” patient are equal to 2.9 mkm2/s, and the rate of spread of disease 2.5 mkm/s. This model can be used to study the dynamics of cancer, knowing limits of the values of these parameters.
3.2 Study of tumor volume dynamics
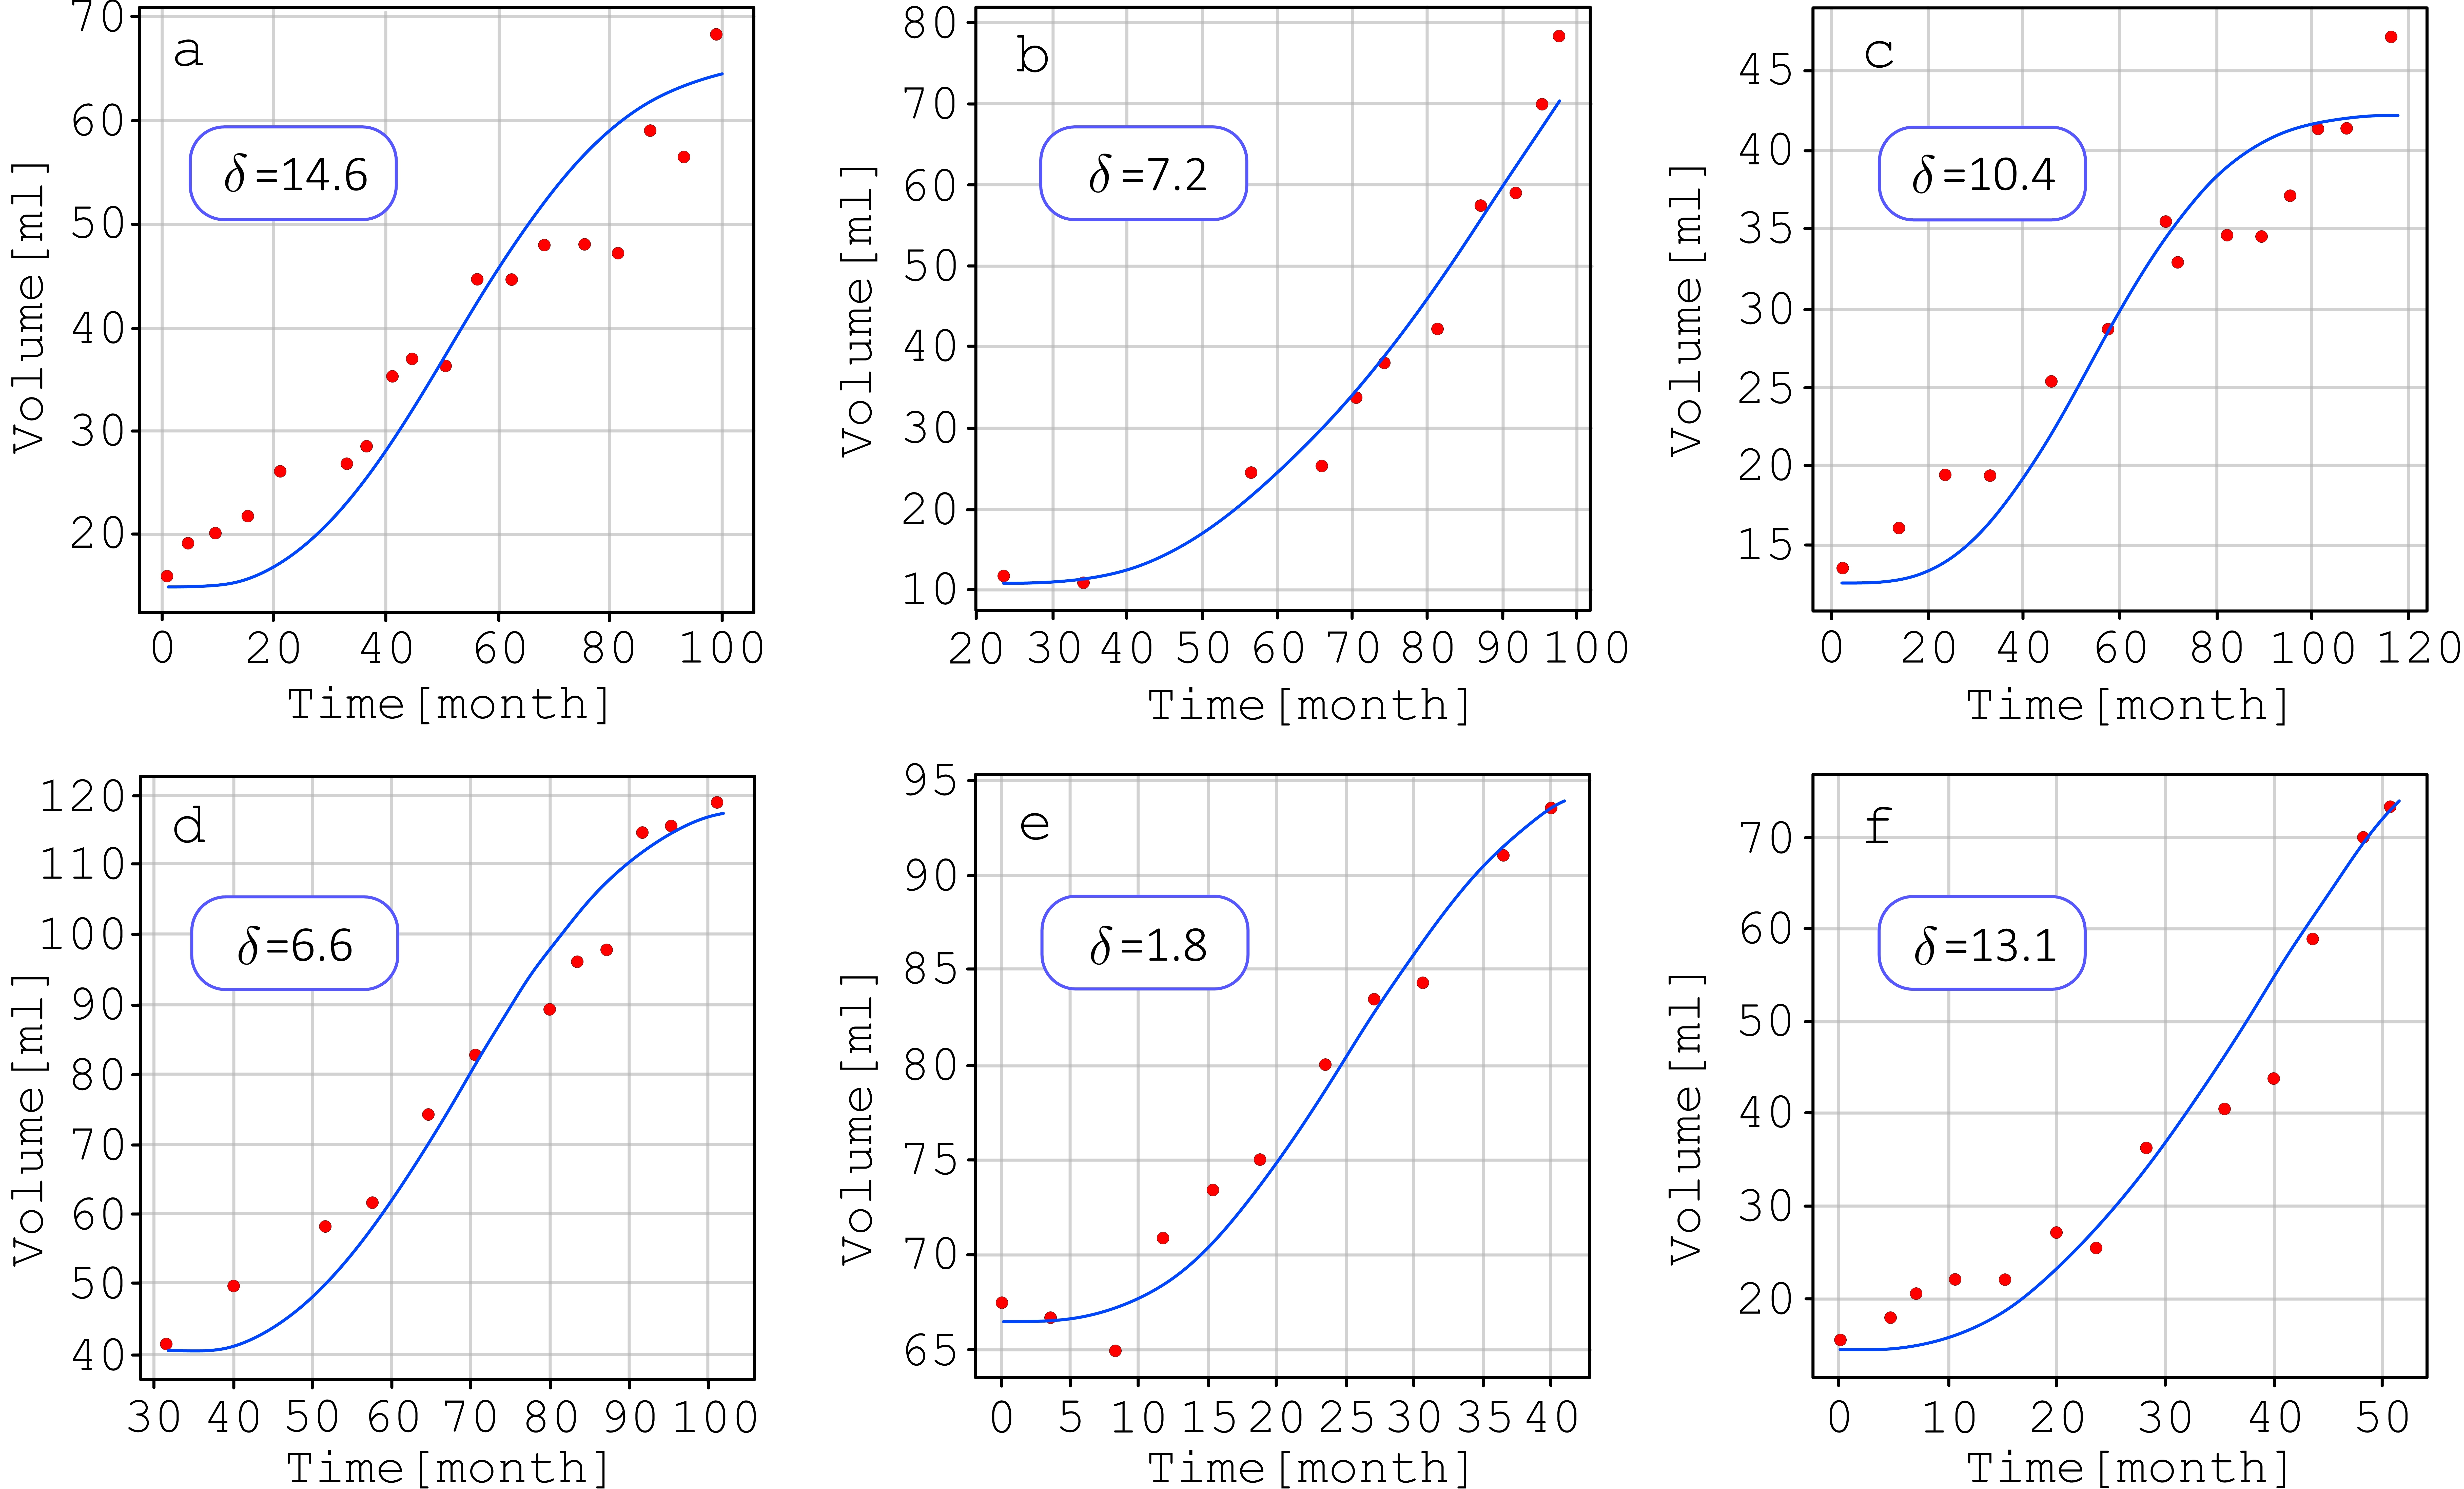
Time intervals corresponding to the period of disease development in clinical data were set in computational experiments to study dynamics of tumor volume. Red dots correspond to each recorded patient condition (Fig. 4). Observations of changes in tumor volume in all cases were carried out before the start of treatment. Note that there are no data on further dynamics of tumor volume.
The relative error was calculated for each computational experiment based on the given clinical cases
| (13) |
where is simulated value of tumor volume in moment of time, is the value of tumor volume for data of clinical observations in moment of time, is number of observations.
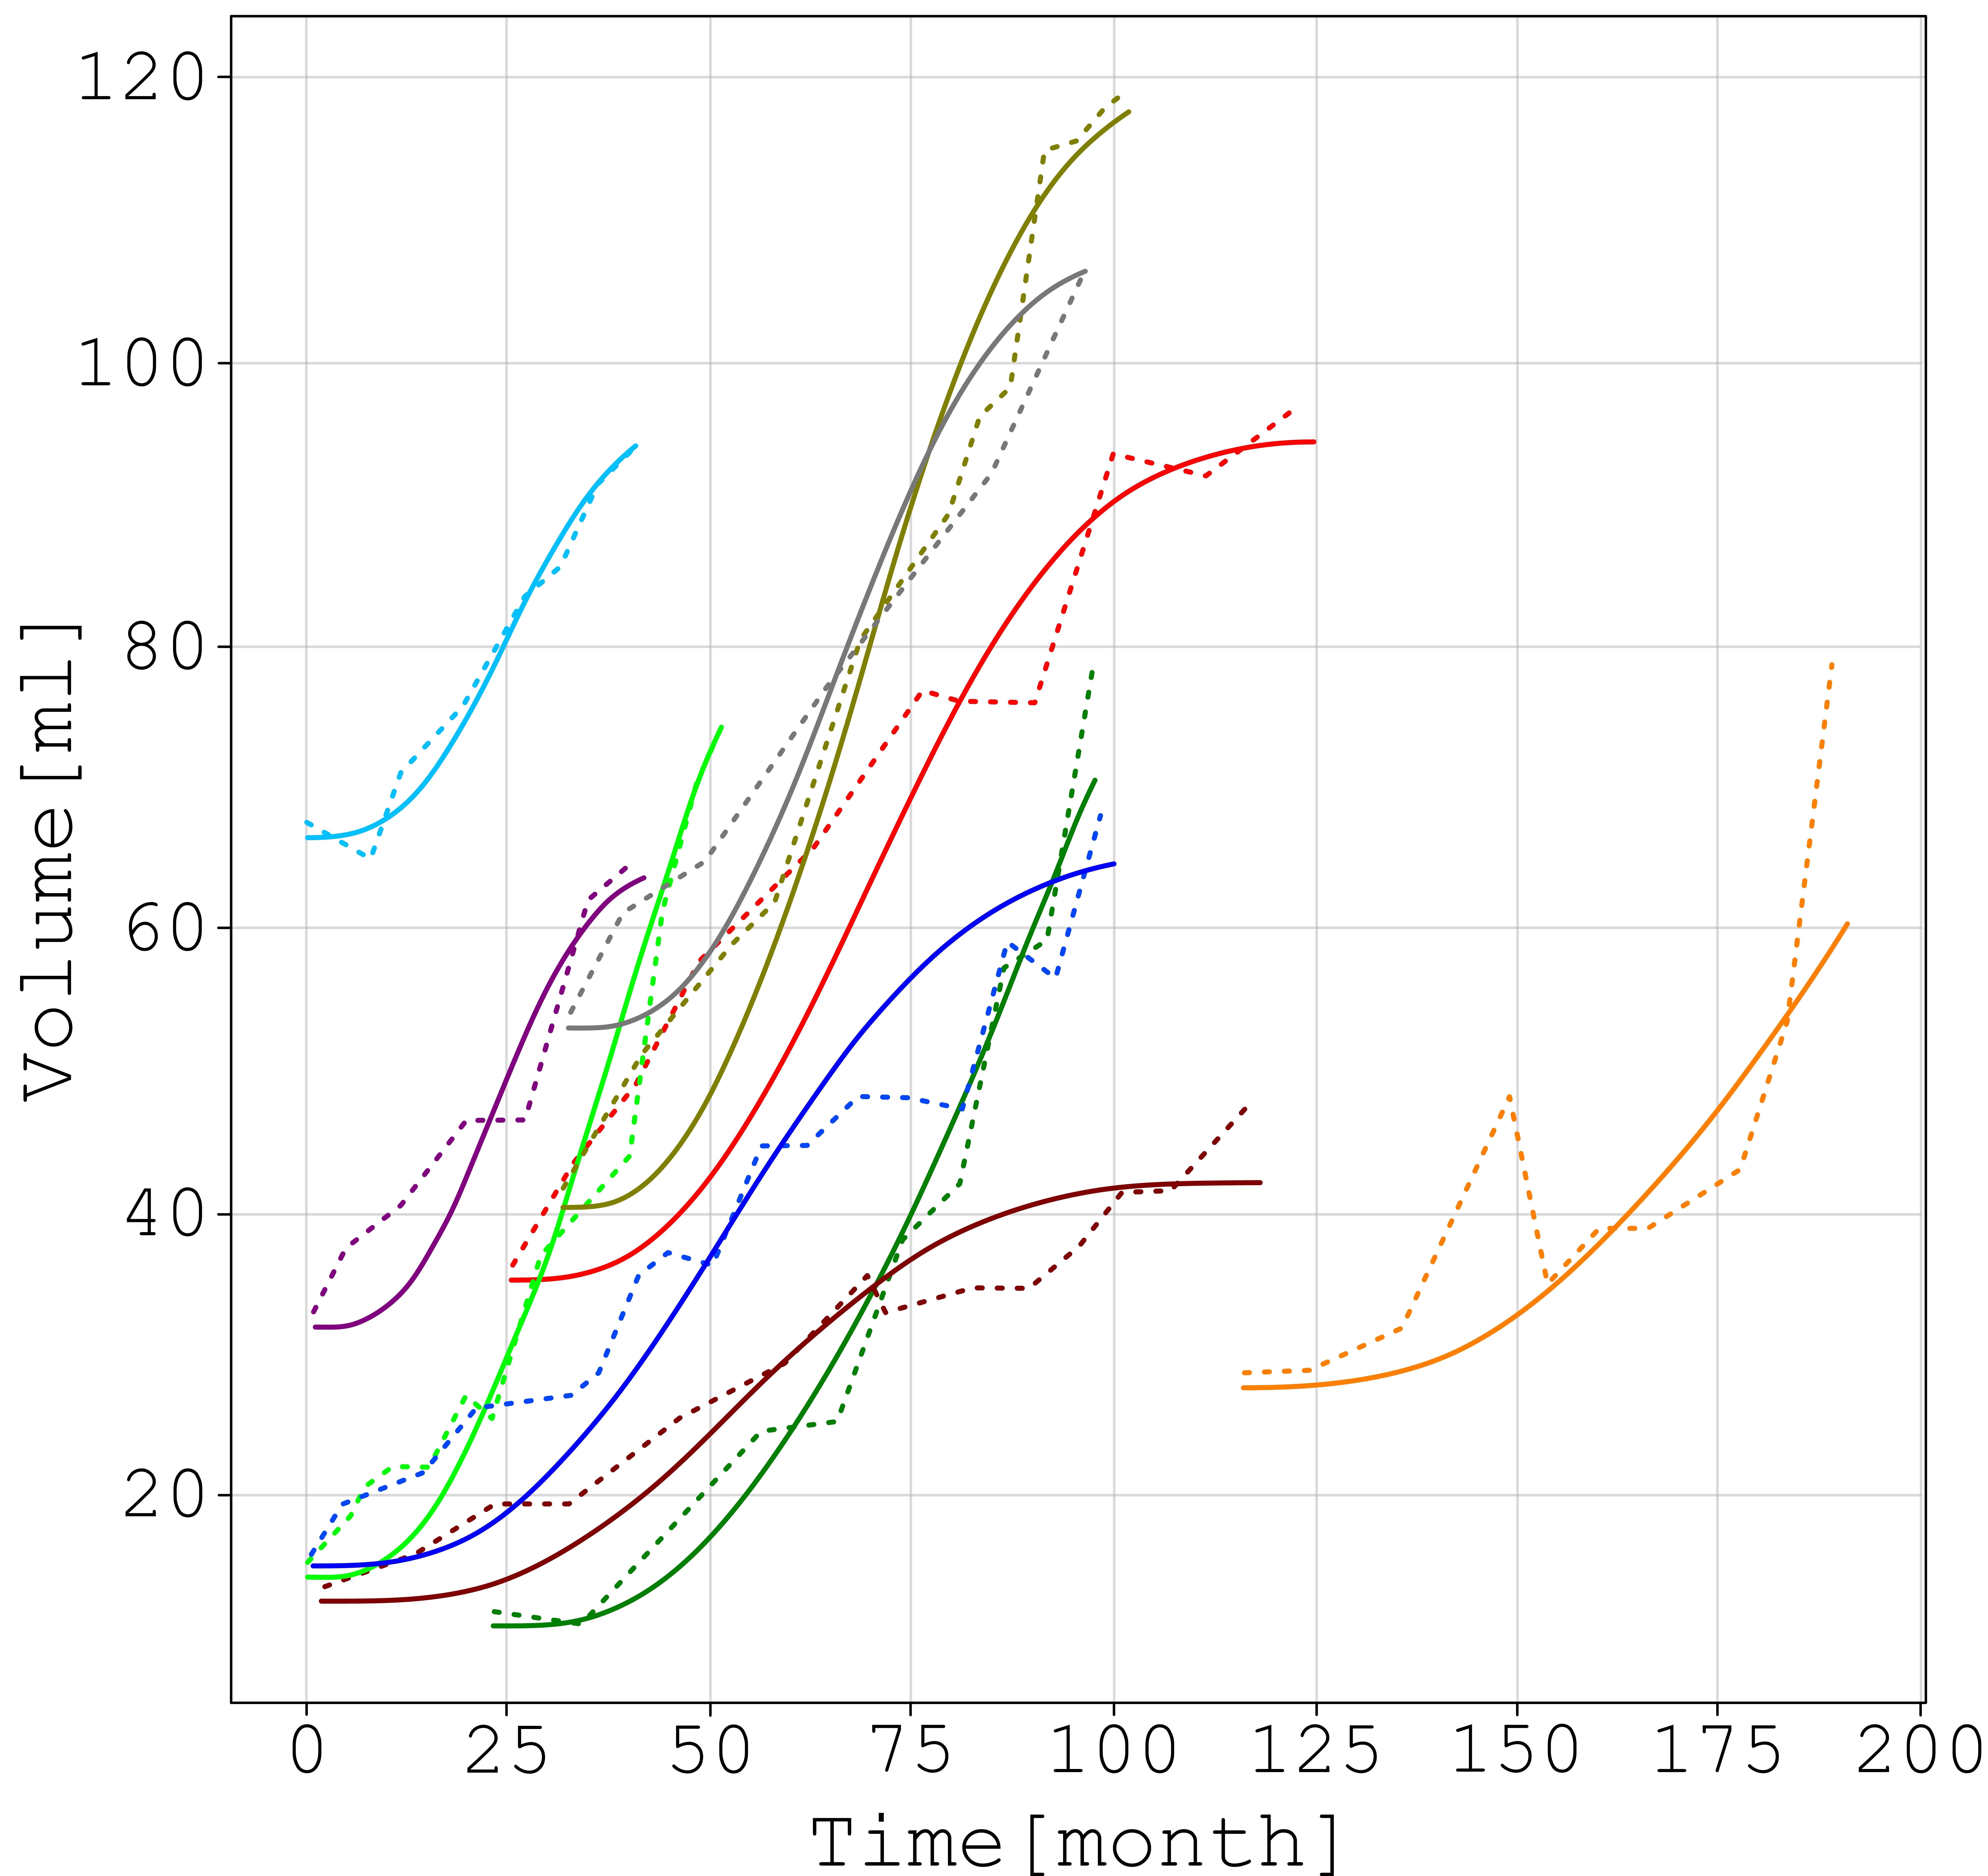
Based on constructed solutions, we observe that cases a and f are characterized by largest discrepancy between simulated data and data from real clinical trials. A sharp unpredictable change in the trend towards tumor growth, which manifests itself at different points in time, is present in these cases. The largest deviation is observed for the case a. This patient is characterized by the slowest spread of the disease, which changes its speed at about the 70th month from the start of observations. However, even here deviation at the beginning of observations is practically absent, and at the end of observations it does not exceed ml. The most accurate results are observed in the case e. For clarity, we also give a general summary of dynamics of disease in patients (see Fig. 5) compared with clinical data.
3.3 Study of spatial structure of tumor
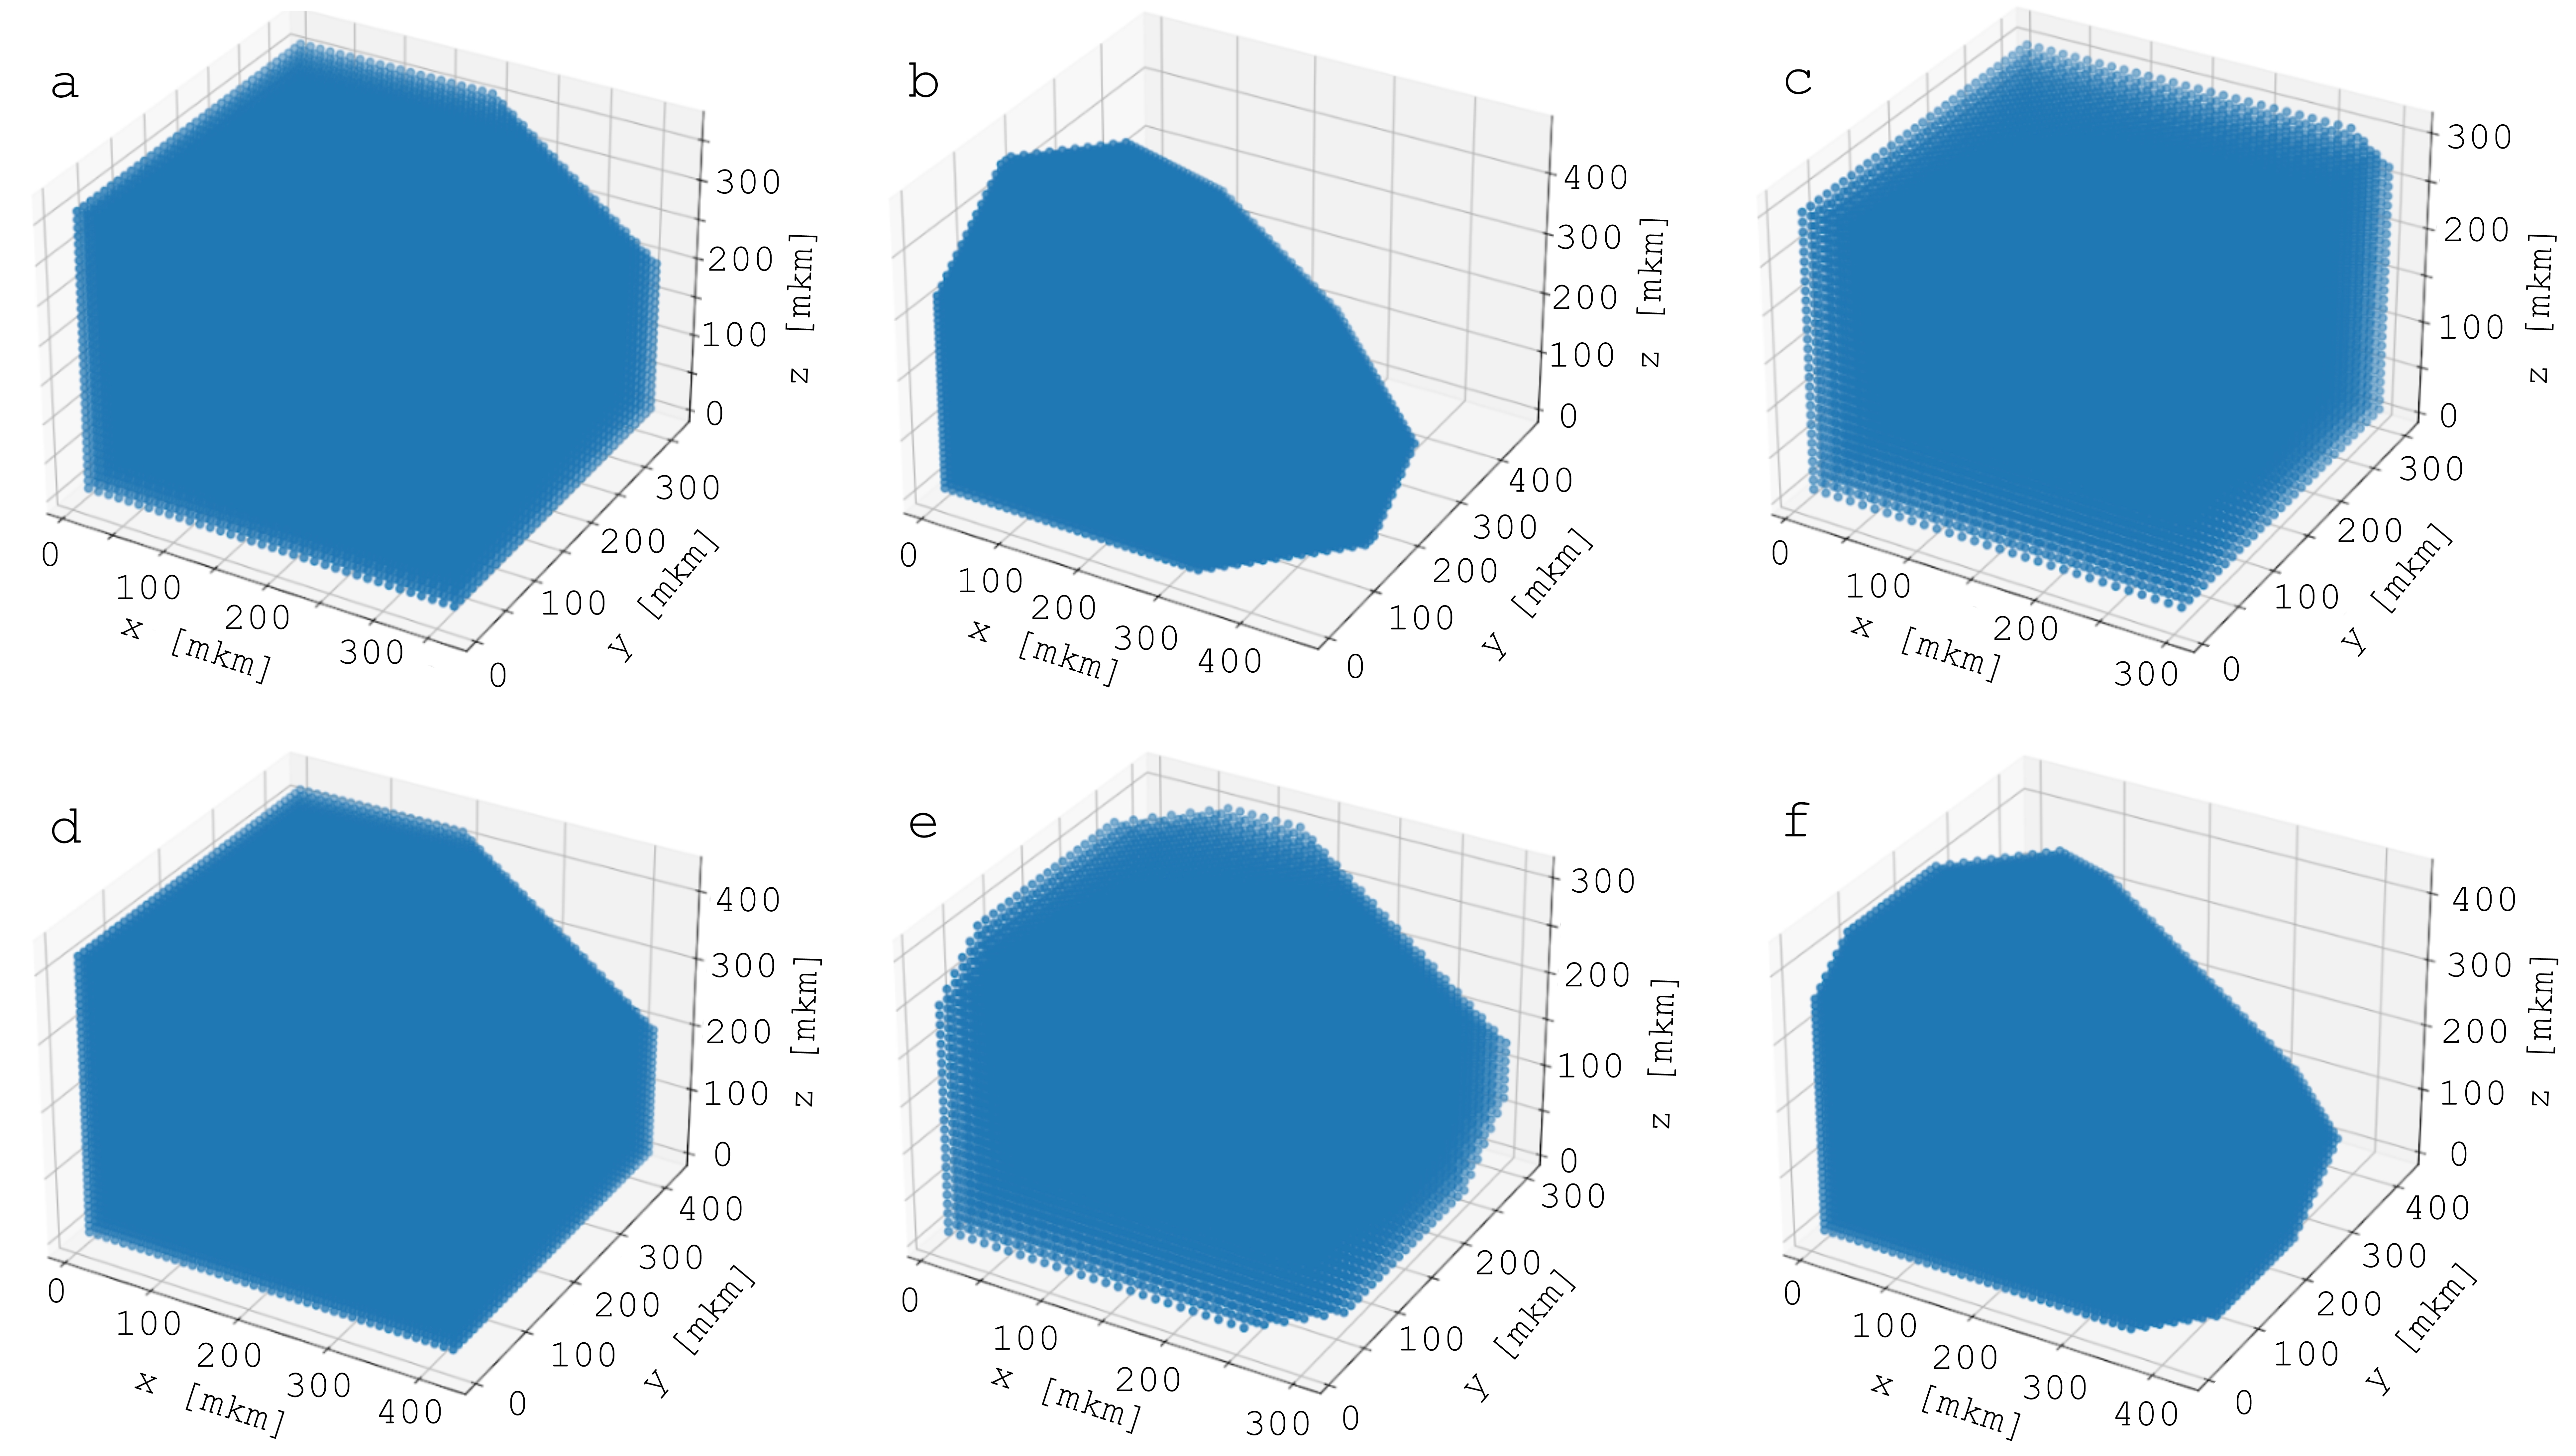
Generally speaking, shape of this area must be taken into account when calculating volume of tissue affected by the tumor. We constructed a three-dimensional structure of the tumor for all observed cases, taking into account environmental heterogeneity factor (Fig. 6). It can be seen that size and shape of area affected by cancer differs for all models, including due to the different structure of biological tissues. Cancer cells in process of evolution of the system rapidly increase volume they occupy, since period of division of cancer cells is short. Evaluation of structure of tumor is important, for example, to determine effectiveness of surgical treatment of patients.
4 Discussion and conclusion
Medical practice is based on a variety of methods for diagnosing malignant tumors (ultrasound, mammography, tomography). Despite the development of these methods, none of them guarantees early detection of cancer. The combined use of diagnostic techniques and mathematical modeling methods can help in solving this problem. Our main efforts are aimed at creating universal methods for computer simulation of biophysical processes. Such methods can improve the quality of medical diagnostics using machine learning algorithms. To date, a method for diagnosing oncological diseases based on microwave radiothermometry data is being actively developed [39, 40]. The application of this method is based on the analysis of thermal fields of individual organs of the patient. The diagnosis of cancer is based on the observation that the most dangerous and rapidly growing tumors are characterized by high specific heat [Gautherie-1982]. Thus, tumors affect thermal fields in biological tissues. Therefore, taking into account the specific heat release of the tumor in the mathematical model seems to be an important direction in the development of our study.
The function in the Eq. (2.1), which is responsible for the appearance of a tumor, needs further mathematical elaboration. In this article, the value of is set to a constant, and does not depend on any other variables. The study of the process of tumor formation and its mathematical description will significantly improve the quality of our model. In addition, we plan to expand the list of free model parameters to take into account a larger number of factors characterizing the human body. Including the resistance provided to the disease will depend on each individual organism. In the Eq. (2.1), this is the parameter, which may depend on the presence of treatment or its absence. In the future, it is possible to take into account many factors that affect the spread of the tumor, such as the age of the body, malnutrition, the use of substances harmful to health (alcohol, smoking).
One of the promising applications of the proposed model is the creation of combined data samples for machine learning. These data samples combine simulation results and medical observations. The research results show that the use of such data samples can improve the efficiency of diagnosing breast cancer [42]. The results of modeling the spatial dynamics of tumor growth can be used to improve the quality of diagnosis based on mammography [43].
The results obtained, however, allow us to conclude that this model satisfies the results of clinical observations and can be used to describe the development of the disease. The comparison shows a good agreement between the field data and the results obtained from the numerical analysis of this system.
The main results of this work:
1) A method for mathematical modeling of tumor growth based on the diffusion equation is proposed. This method makes it possible to take into account the spatial inhomogeneity of medium, which is a significant factor for such problems.
2) Software has been developed for calculating spatio-temporal dynamics of tumor. This software is available at the link https://github.com/TenVal/NonLinearCancerModel/tree/findParams3/
3) The area of admissible values of the initial parameters of mathematical model is determined by optimization methods. Range of values for the modulus of speed : 1.69 mkm/s 3.22 mkm/s, and for the values of tumor spread coefficient : 1.81 mkm2/s 3.89 mkm2/s.
4) The dynamics of tumor volume was studied. The logistic nature of change in size of diseased area is demonstrated both for the results of clinical observations and for the results of modeling. The relative error of the results of computational experiments is determined, which lies in the range from 1.8 percent to 14.6 percent.
5) Spatial structure of the simulated tumors was studied. Applicability of the proposed method for modeling uneven tumor growth depending on environmental conditions is shown.
References
- [1] Ferlay, J., Ervik, M., Lam, F., Colombet, M., Mery, L., Pineros, M. et al. (2020) ’Global Cancer Observatory: Cancer Today’, International Agency for Research on Cancer.
- [2] Liu, L., Li, Y., Zi, Y., Rong, D., Li, Y., Li, X., Xu, F., Wu, H. (2022) ’MRI findings of benign tumors and tumor-like diseases of the tongue with radiologic–pathologic correlation’, Japanese Journal of Radiology, Vol. 41, pp. 19–26.
- [3] Kok, J., Teepen, J., van der Pal, H., Leeuwen, F., Tissing, W., Neggers, S., Loonen, J., Louwerens, M., Versluys, B., Heuvel-Eibrink, M., Broeder, E., Jaspers, M., Santen, H. M., Van der Heiden-van derLoo, M., Janssens, G., Maduro, J., Bruggink, A., Jongmans, M., Kremer, L., Ronckers, C. (2019) ’Incidence of and Risk Factors for Histologically Confirmed Solid Benign Tumors Among Long-term Survivors of Childhood Cancer’, JAMA Oncology, Vol. 5, pp. E1–E10.
- [4] Billy, F., Ribba, B., Saut, O., Morre-Trouilhet, H., Colin, T., Bresch, D., Boissel, J-P., Grenier, E., Flandrois, J-P., (2009) ’A pharmacologically based multiscale mathematical model of angiogenesis and its use in investigating the efficacy of a new cancer treatment strategy’, Journal of Theoretical Biology, Vol. 260, No. 4, pp. 545-562.
- [5] Carmeliet, P., Jain, R.K. (2000) ’Angiogenesis in cancer and other diseases’, Nature, Vol. 407, pp. 249-257.
- [6] Huysentruyt, L.C., Seyfried, T.N. (2013) ’On the Origin of Cancer Metastasis’, Critical Reviews in Oncogenesis, Vol. 18, pp. 43-73.
- [7] Chabner, B.A., Roberts Jr, T.G. (2005) ’Chemotherapy and the war on cancer’, Nature Reviews Cancer, Vol. 5, pp. 65–72.
- [8] Demaria, S., Golden, E.B., Formenti S.C. (2015) ’Role of Local Radiation Therapy in Cancer Immunotherapy’, Oncolytic Viruses in Cancer Treatment, Vol. 1, No. 9, pp. 1325-1332.
- [9] Shepard, D.M., Ferris, M.C., Olivera, G.H., Mackie, T.R. (1999) ’Optimizing the Delivery of Radiation Therapy to Cancer Patients’, SIAM review, Vol. 41, No. 4, pp. 721-744.
- [10] Morch, L.S., Lokkegaard, E., Andreasen, A.H., Kruger-Kjar, S., Lidegaard, O. (2009) ’Hormone Therapy and Ovarian Cancer’, JAMA network open, Vol. 302, No. 3, pp. 298-305.
- [11] Farkona, S., Diamandis, E.P., Blasutig, I.M. (2016) ’Cancer immunotherapy: the beginning of the end of cancer?’, BMC Medicine, Vol. 14, No. 73, pp. 1-18.
- [12] Armitage, P., Doll, R. (1954) ’The age distribution of cancer and a multi-stage theory of carcinogenesis’, British Journ. of Cancer, Vol. 8, pp. 1-12.
- [13] Weinberg, R.A. (2013) ’The Biology of Cancer’, Garland Science. New York, NY.
- [14] Hahnfeldt, P., Panigrahy, D., Folkman, J., Hlatky, L. (1999) ’Tumor development under angiogenic signaling: A dynamical theory of tumor growth, treatment response, and postvascular dormancy’, Cancer Research, Vol. 59, No. 19, pp. 4770-4775.
- [15] d’Onofrio, A., Gandolfi, A. (2004) ’Tumor eradication by antiangiogenic therapy: analysis and extensions of the model by Hahnfeldt et al. (1999)’, Cancer Research, Vol. 191, No. 2, pp. 159-184.
- [16] Anderson, A.R., Quaranta, V. (2008) ’Integrative mathematical oncology’, Nat. Rev. Cancer, Vol. 8, pp. 227-234.
- [17] Byrne, H.M. (2010) ’Dissecting cancer through mathematics: from the cell to the animal model’, Cancer Research, Vol. 191, No. 2, pp. 159-184.
- [18] Lenaerts, T., Pacheco, J. M., Traulsen, A., Dingli, D. (2010) ’Tyrosine kinase inhibitor therapy can cure chronic myeloid leukemia without hitting leukemic stem cells’, Haematologica, Vol. 95, pp. 900-907.
- [19] Jones, S. et al. (2008) ’Comparative lesion sequencing provides insights into tumor evolution’, Proc. Natl. Acad. Sci. USA, Vol. 105, pp. 4283–4288.
- [20] Liu, Z., Yang, C. (2016) ’A mathematical model of cancer treatment by radiotherapy followed by chemotherapy’, Mathematics and Computers in Simulation, Vol. 124, pp. 1-15.
- [21] Breward, C.J.W., Byrne, H.M., Lewis, C.E. (2003) ’A multiphase model describing vascular tumour growth’, Bull. Math. Biol., Vol. 65, No. 4, pp. 609-640.
- [22] Anderson, A.R.A., Rejniak, K.A., Gerlee, P., Quaranta, V. (2007) ’Modelling of cancer growth, evolution and invasion: bridging scales and models’, Math. Model. Nat. Phenom., Vol. 2, No. 3, pp. 1-29.
- [23] Bulai, I.M., De Bonis, M.C., Laurita, C., Sagaria, V. (2023) ’Modeling metastatic tumor evolution, numerical resolution and growth prediction’, Mathematics and Computers in Simulation, Vol. 203, pp. 721-740.
- [24] Drasdo, D., Hoehme, S. (2003) ’Individual-based approaches to birth and death in avascular tumors’, Math. Comput. Mod., Vol. 37, No. 11, pp. 1163-1175.
- [25] Drasdo, D., Hoehme, S. (2005) ’A single-cell-based model of tumor growth in vitro: monolayers and spheroids’, Phys. Biol., Vol. 2, No. 11, pp. 1163-1175.
- [26] De Mattei, V., Flandoli, F., Leocata, M., Polito, M.C., Ricci, C. (2016) ’A mathematical model for growth of solid tumors and combination therapy with an application to colorectal cancer’, arXiv: Tissues and Organs, pp. 1-21.
- [27] Sun, H., Lee, J., (2020) ’Simulation of cancer prognosis’, Journal of Micromechanics and Molecular Physics, Vol. 05, 2050004.
- [28] Drasdo, D., Hoehme, S. (2017) ’Modeling Cancer Cell Growth Dynamics In vitro in Response to Antimitotic Drug Treatment’, Frontiers in Oncology, Vol. 7, pp. 1-14.
- [29] Kansal, A., Torquato, S., Chiocca, E.A., Deisboeck, T. (2000) ’Simulated Bain Tumor Growth Dynamics Using a Three-Dimensional Cellular Automaton’, Journal of theoretical biology, Vol. 203, pp. 367-382.
- [30] Wei, H-C. (2023) ’Mathematical modeling of tumor growth and treatment: Triple negative breast cancer’, Mathematics and Computers in Simulation, Vol. 204, pp. 645-659.
- [31] Polyakov, M.V. (2020) ’Computational modelling to determine the physical characteristics of biological tissues for medical diagnosis’, International Journal of Engineering Systems Modelling and Simulation, Vol. 11, No. 4, pp. 214-221.
- [32] Galaguz, Y., Safina, G. (2020) ’Modeling of Fine Migration in a Porous Medium’, ATEC Web of Conferences, Vol. 86, 03003.
- [33] Aristov, S.N., Prosviryakov, E.Y. (2020) ’A new class of exact solutions for three-dimensional thermal diffusion equations’, Theoretical Foundations of Chemical Engineering, Vol. 50, pp. 286-293.
- [34] Farre, C., Perez-Segarra, C.D., Soria, M., Oliva, A. (2006) ’Analysis of Different Numerical Schemes for the Resolution of Convection-Diffusion Equations using Finite-Volume Methods on Three-Dimensional Unstructured Grids. Part II: Numerical Analysis’, Numerical Heat Transfer Fundamentals, Vol. 49, pp. 351-375.
- [35] Gui, C., Kosteniuk, S.E., Lau, J.C., Megyesi J.F. (2018) ’Tumor growth dynamics in serially-imaged low-grade glioma patients’, Journal of Neuro-Oncology, Vol. 139, pp. 167-175.
- [36] Louis, D.N., Perry, A., Reifenberger, G., von Deimling, A., Figarella-Branger, D., Cavenee, W.K., Ohgaki, H., Wiestler, O.D., Kleihues, P., Ellison, D.W. (2016) ’The 2016 World Health Organization Classification of Tumors of the Central Nervous System: a summary’, Acta Neuropathol, Vol. 131, No. 6, pp. 803-820.
- [37] Pignatti, F., van den Bent, M., Curran, D., Debruyne, C., Sylvester, R., Afra, P.T., Cornu, P., Bolla, M., Vecht, C., Karim, A.B. (2002) ’Prognostic Factors for Survival in Adult Patients With Cerebral Low-Grade Glioma’, Journal of Clinical Oncology, Vol. 20, No. 8, pp. 2076-2084.
- [38] Korneev, A., Krichevets, A. (2011) ’Conditions for Student T-Test and Mann–Whitney U-Test Application’, Psikhologicheskiĭ Zhurnal, Vol. 32, No. 1, pp. 97-110.
- [39] Polyakov, M.V., Popov, I.E., Losev, A.G., Khoperskov, A.V. (2021) ’Application of computer simulation results and machine learning in analysis of microwave radiothermometry data’, Mathematical Physics and Computer Simulation, Vol. 24, No. 2, pp. 27-37.
- [40] Li, J., Galazis, C., Popov, L., Ovchinnikov, L., Kharybina, T., Vesnin, S., Losev, A., Goryanin I. (2022) ’Dynamic Weight Agnostic Neural Networks and Medical Microwave Radiometry (MWR) for Breast Cancer Diagnostics’, Diagnostics, Vol. 12, No. 9, 2037.
- [41] Gautherie, M. (1982) ’Temperature and Blood Flow Patterns in Breast Cancer During Natural Evolution and Following Radiotherapy’, Prog Clin Biol Res, Vol. 107, pp. 21-64.
- [42] Khoperskov, A.V., Polyakov, M.V. (2022) ’Improving the Efficiency of Oncological Diagnosis of the Breast Based on the Combined Use of Simulation Modeling and Artificial Intelligence Algorithms’, Algorithms, Vol. 15, No. 8, 292.
- [43] Karthiga, R., Narasimhan, K., Amirtharajan, R. (2023) ’Diagnosis of breast cancer for modern mammography using artificial intelligence’, Mathematics and Computers in Simulation, Vol. 204, pp. 645-659.