CECT: Controllable Ensemble CNN and Transformer for COVID-19 Image Classification
Abstract
The convolutional neural network (CNN) and transformer are two of the most widely implemented models in the computer vision field. However, the former (latter) one mainly captures local (global) features only. To address the limitation in model performance caused by the lack of features, we develop a novel classification network CECT by controllable ensemble CNN and transformer. CECT is composed of a convolutional encoder block, a transposed-convolutional decoder block, and a transformer classification block. Different from existing methods, our CECT can capture features at both multi-local and global scales without any bells and whistles. Moreover, the contribution of local features at different scales can be controlled with the proposed ensemble coefficients. We evaluate CECT on two public COVID-19 datasets and it outperforms existing state-of-the-art methods. With remarkable feature capture ability, we believe CECT can be extended to other medical image classification scenarios as a diagnosis assistant. Code is available at https://github.com/NUS-Tim/CECT.
keywords:
Deep Learning , Convolutional Neural Network , Transformer , Medical Image Analysis1 Introduction
COVID-19, an infectious disease induced by the novel coronavirus SARS-CoV-2 emerged towards the end of 2019. It is primarily transmitted through respiratory droplets and contact routes and the infection of COVID-19 can lead to symptoms such as fever, cough, and difficulty breathing [1, 2]. According to the report, the rapid spreading of COVID-19 has resulted in over 600 million cases and 6 million deaths worldwide [3]. One of the core components for COVID-19 diagnosis is related medical imaging, which can create a visual representation of the interior body [4], relying on different modalities like computed tomography and X-ray [5]. With the help of medical imaging, further medical intervention can become easier and faster. Though diagnosing patients based on medical imaging is helpful, training and analysis procedure for human expertise is time-consuming. Thanks to the fast development of computer vision (CV), a subfield of deep learning (DL), high-accuracy diagnosing results can be obtained instantly from well-trained CV models without the intervention of professional radiologists [6, 7, 8]. The CV commits to extracting critical features from the visual inputs and is composed of several tasks, such as classification, segmentation, and denoising. Under the classification scene, the convolutional neural network (CNN) and transformer are two of the most widely used type of models.
CNN has dominated the CV field over the past several years and is capable for capture spatial hierarchies of the input features with successive convolution operations [9]. A typical CNN consists of several types of layers, including convolution layers, dropout layers, normalization layers, etc. Compared with CNN, the transformer is a new player in the CV field and is initially proposed in the natural language processing field. The core component of the transformer is the self-attention mechanism or attention in short. The attention mechanism in a transformer network creates interdependencies among different positions within a single sequence, enabling the model to compute a context-aware representation of each position in the sequence [10]. The distinct difference between the CNN- and the transformer-based methods is that CNN mainly captures local features while the transformer captures global features. As the visual input can contain both local and global features, purely implementing CNN or transformer can miss useful information thus hampering the overall performance. To take advantage of both CNN and transformer, the combination between CNN and transformer has developed rapidly in recent years for higher performance.
Here, we develop a novel classification model by Controllable Ensemble CNN and Transformer (CECT) to capture both multi-local and global features. Our CECT is composed of a convolutional encoder block (CEB), a transposed-convolutional decoder block (TDB), and a transformer classification block (TCB). The CEB captures the features at multi-local scales. The TDB decodes the captured features to the same scale and sums them using proposed ensemble coefficients. The summed features are fed into the TCB to capture the global features. As can be seen, CECT can capture the features at both multi-local and global scales. Moreover, the contribution of local features at different scales can be controlled with the ensemble coefficients we proposed. The evaluation results on the COVID-19 radiography dataset [11, 12] and the COVIDx CXR-3 dataset [13, 14, 15] show that our CECT outperforms other state-of-the-art (SOTA) models. To sum up, our main contributions are:
-
1.
We construct CECT that hybridizes CNN and transformer to capture both multi-local and global features.
-
2.
The contribution across different feature scales can be controlled with proposed ensemble coefficients.
-
3.
Results on two public datasets show that our CECT outperforms SOTA methods.
The rest of the paper is organized as follows. Section 2 ”Related work” illustrates the published work related to CNN, transformer, as well as their combinations. The corresponding application in medical image classification is also introduced. Section 3 ”Material and methods” summarizes the datasets used and the implementation details of the proposed CECT, including the architecture design, the experimental settings, and the evaluation metrics. The results on two public COVID-19 datasets together with the corresponding detailed analysis are introduced in Section 4 ”Results and analysis”. Detailed ablation experiments are also conducted. We conclude our work and point out the future research perspectives in Section 5 ”Conclusions”.
2 Related work
CNN Since the development of AlexNet [16], CNN has established itself as one of the paramount models in the CV field. As of now, one of the prevalent models of CNNs is the ResNet [17] developed by He et al. Instead of learning unreferenced functions, the ResNet reformulates the layers as learning residual functions with reference to the layer inputs to ease the deeper network training. Recently, the evolution of CNN has seen a deceleration, partly attributed to the emergence of the transformer. To this end, numerous studies have sought to reaffirm the significance of CNNs in the CV field. Among these efforts, the ConvNeXt [18] developed by Liu et al., stands as one of the most accomplished. The ConvNeXt gradually ”modernizes” the standard ResNet toward the architecture of ViT, thereby elucidating the pivotal components that contribute to the performance gap. In concert with ConvNeXt, the ConvFormer [19] that instantiates the token mixer as separable depthwise convolutions also shows SOTA performance.
Transformer The transformer has ascended to the forefront research field and has demonstrated superior performance over CNN in many tasks since the vision transformer (ViT) [20] is proposed. However, the original ViT is confronted with multiple challenges like varying visual entity scale and high image resolution. To this end, Liu et al. [21] developed the swin transformer (SwT) with hierarchical feature maps. In SwT, the attention is computed within each local window. The window connections are modeled by shifting the window partitioning after computing the attention within each window. With such designs, the SwT can both model at various scales with high flexibility and reduce the computation complexity from quadratic to linear. In parallel, comparable work is seen in CrossViT [22] developed by Chen et al. The CrossViT consists dual-branch transformer and is capable of combining image patches at different sizes to produce stronger image features. Besides, a cross-attention-based token fusion module is developed. For each branch, a single token is utilized as a query for information exchange across branches.
Marrying CNN and transformer In pursuit of leveraging the merits of both CNN and transformer, a significant amount of work has been dedicated to combining CNN and transformer in different ways. Among these, the most common way is to marry CNN and transformer either in tandem or parallel [23, 24, 25, 26, 27]. For example, Duong et al. [23] developed a ViT-Eff method, in which input images are fed into EfficientNet [28]. The extracted feature maps are then fed to the transformer, followed by the prediction head. Instead of tandem or parallel combination, certain studies focus on fusing CNN and transformer in a more inner way with redesigned intrinsic modules [29, 30, 31, 32, 33]. A case in point is the CMT [29] developed by Guo et al. The CMT follows the design of ResNet [17] and is composed of several reimagined blocks, such as the local perception unit, lightweight multi-head self-attention, and inverted residual feed-forward network.
Medical image classification Both CNN [34, 35, 36, 37, 38] and transformer [39, 40, 41, 42, 43] have been extensively utilized in medical image classification and achieved superior performance. However, as the CNN- and transformer-based methods are only versed in capturing local and global features respectively, employing CNN or transformer solely can hamper the model performance to a large extent. Consequently, several recent studies have been focused on combining CNN and transformer in different ways, including tandem or parallel fusion strategies [44, 45] and intricate architecture with redesigned intrinsic modules [46, 47]. Leveraging both local and global features captured, these methods demonstrate excellent performance. Here, we developed CECT, which can capture features at both multi-local and global scales without sophisticated architecture. Compared with tandem or parallel combination, our CECT comprises three CNN-based branches designed to identify features at multi-local scales instead of a specific local scale. Contrasting with the sophisticated design, our CECT exhibits enhanced effectiveness and intuitiveness without any bells and whistles. Moreover, we propose three ensemble coefficients to make the contribution of local features at varying scales controllable, thereby promoting adjustable and generalizable considerations.
3 Material and methods
3.1 Datasets
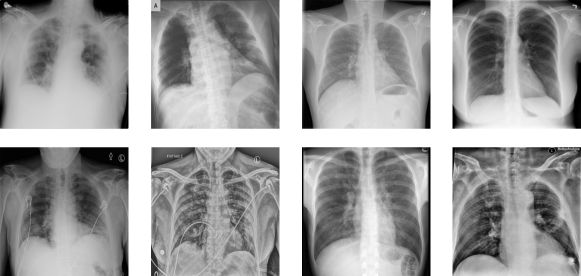
We evaluate CECT on the COVID-19 radiography dataset and the COVIDx CXR-3 dataset. The COVID-19 radiography dataset is collected by researchers from Qatar University and the University of Dhaka together with their collaborators. There are 3616 COVID-positive and 10192 COVID-negative images in the COVID-19 radiography dataset. The COVIDx CXR-3 dataset is a chest X-ray dataset collected from 16,648 patients at different locations. There are 30386 images in the dataset and the dataset is composed of two parts. The first part is for training and validation with 29986 images, while the second part is for testing and is composed of 400 images. For the first part, 15994 images are labeled as positive while 13992 images are labeled as negative. Regarding the second part, 200 images are labeled as positive and the remaining 200 images are labeled as negative. Illustration images from the two datasets can be found in fig. 1.
3.2 Architecture design
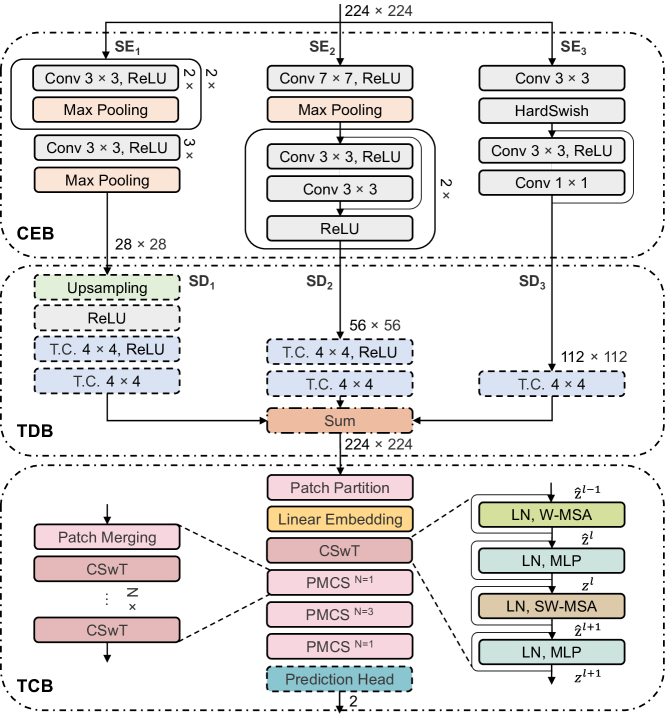
The detailed architecture of CECT is illustrated in fig. 2. CECT is composed of three blocks, the CEB, TDB, as well as TCB. The CEB is composed of three sub-encoders, , , and , which use part of VGGNet [48], ResNet, and MobileNet [49] as the backbone, respectively. To keep consistency with the 224 × 224 scale global features, the output scales of the , , and are implemented as 28 × 28, 56 × 56, and 112 × 112, respectively. With multi-scale outputs, the local features at 28 × 28, 56 × 56, and 112 × 112 scales can be captured. The TDB consists of three sub-decoders , , and and a sum operation at the feature map level. We devised the sub-decoders from scratch with an output dimension of 224 × 224. The input dimensions of the , , and are designed to match those of the output dimensions of , , and , respectively. Three output feature maps are then summed using the proposed ensemble coefficients. The TCB uses SwT as the backbone with a newly designed prediction head. The transformer-based classification block takes the summed feature map as the input and can capture the 224 × 224 scale global features. By combining CEB, TDB, and TCB, the CECT can capture both multi-local and global features from 28 × 28 to 224 × 224 scales.
CEB The , , and are intercepted from the top certain layers of the VGGNet, ResNet, and MobileNet, respectively. Specifically, the is extracted from the top 17 child layers of the VGGNet, and the and are intercepted from the top 5 and 2 child layers, from ResNet and MobileNet, respectively.
TDB The is composed of an upsample layer, a ReLU activation function, a 4 × 4 transposed convolutional layer with a ReLU activation function, and another 4 × 4 transposed convolutional layer. The consists of a 4 × 4 transposed convolutional layer, a ReLU activation function, and another 4 × 4 transposed convolutional layer. The is composed of a single 4 × 4 transposed convolutional layer. The sum operation at the feature map level is based on three coefficients , , , and the output is defined as:
| (1) |
where and the sum of the , , and equals 1. , , and represent the output feature maps of the , , and , respectively.
TCB There are four stages in the TCB and each stage includes a different number of CSwT blocks. Each CSwT block has two parts, which contain the multi-head attention module with regular windowing configurations (W-MSA) and shifted windowing configurations (SW-MSA), respectively. The multilayer perceptron (MLP) module is composed of two layers and a GELU activation function in between. The prediction head is composed of a solely linear layer with two output nodes. The CSwT block can be computed as:
| (2) |
| (3) |
| (4) |
| (5) |
where and illustrate the output features of the W-MSA and the MLP inside the block , respectively. Relative position bias is implemented when calculating attention.
3.3 Experimental settings
| Dataset | Category | Training subset | Validation subset | Test subset | Total |
|---|---|---|---|---|---|
| COVID-19 radiography | Positive | 2892 | 362 | 362 | 3616 |
| COVID-19 radiography | Negative | 8154 | 1019 | 1019 | 10192 |
| COVIDx CXR-3 | Positive | 12795 | 3199 | 200 | 15994 |
| COVIDx CXR-3 | Negative | 11194 | 2798 | 200 | 13992 |
Dataset division We divide each dataset into different subsets randomly. For the COVID-19 radiography dataset, we divided it into a training subset, a validation subset, and a test subset with a ratio of 8:1:1. As for the COVIDx CXR-3 dataset, we only divide it into a training subset and a validation subset with a ratio of 8:2 because the images for testing are provided individually. Details of the dataset partition results can be found in table 1.
Configurations Our CECT is developed using the DL framework Pytorch [50]. The input images are resized and cropped to the resolution of 224 × 224 and normalized. Data augmentation including RandomResizedCrop and RandomHorizontalFlip is introduced for the training subset for generalization ability consideration. We use the cross-entropy loss as the loss function and set the optimizer as Adam. Transfer learning is implemented for the CEB and TCB, excluding the prediction head of TCB. Specifically, these network components are first pre-trained on the ImageNet [51] before training on the COVID-19 image datasets. We show the network component with and without transfer learning in solid and dotted lines in fig. 2, respectively.
Hyperparameters We train all models for 20 epochs with an initial learning rate of 0.003. As the training proceeds, the learning rate is reduced using the ReduceLROnPlateau function with a factor of 0.5 and patience of 5. The training batch size is set as 64. To manage the computation consumption within a reasonable boundary, we stipulate that the value of , , and can only be selected from {0.1, 0.2, , 0.6, 0.8}, where represents . Besides, at least two coefficients must share the same value. Under these conditions, seven groups of , , and are generated, as shown in table 2 or table 3.
3.4 Evaluation metrics
We use six evaluation metrics to evaluate the model performance, which are accuracy (ACC), negative predictive value (NPV), positive predictive value (PPV), sensitivity (SEN), specificity (SPE), and F-1 score (FOS). The evaluation metrics can be calculated based on true positive (TP), true negative (TN), false positive (FP), and false negative (FN) using the formulas below:
| (6) |
| (7) |
| (8) |
| (9) |
| (10) |
| (11) |
where TP and TN stand as the number of instances that the model correctly predicts the positive and negative categories, respectively. Similarly, FP and FN represent the number of instances in which the model wrongly predicts the positive and negative categories, respectively. In the context of binary classification, TP, TN, FP, and FN correspond to the values of four sub-blocks of the confusion matrix. More information about the confusion matrix can be found in Section 4.2.
4 Results and analysis
4.1 Ensemble coefficients
| ACC | NPV | PPV | SEN | SPE | FOS | |||
|---|---|---|---|---|---|---|---|---|
| 0.8 | 0.1 | 0.1 | 98.0% | 98.8% | 95.9% | 96.7% | 98.5% | 96.3% |
| 0.6 | 0.2 | 0.2 | 97.6% | 99.2% | 93.4% | 97.8% | 97.5% | 95.5% |
| 0.1 | 0.8 | 0.1 | 97.8% | 98.6% | 95.3% | 96.1% | 98.3% | 95.7% |
| 0.2 | 0.6 | 0.2 | 98.0% | 98.2% | 97.5% | 95.0% | 99.1% | 96.2% |
| 0.1 | 0.1 | 0.8 | 97.5% | 98.6% | 94.6% | 96.1% | 98.0% | 95.3% |
| 0.2 | 0.2 | 0.6 | 98.0% | 98.8% | 95.6% | 96.7% | 98.4% | 96.2% |
| 98.1% | 98.6% | 96.7% | 96.1% | 98.8% | 96.4% |
| ACC | NPV | PPV | SEN | SPE | FOS | |||
|---|---|---|---|---|---|---|---|---|
| 0.8 | 0.1 | 0.1 | 93.2% | 88.8% | 98.9% | 87.5% | 99.0% | 92.8% |
| 0.6 | 0.2 | 0.2 | 87.2% | 80.2% | 98.7% | 75.5% | 99.0% | 85.6% |
| 0.1 | 0.8 | 0.1 | 92.7% | 88.3% | 98.3% | 87.0% | 98.5% | 92.3% |
| 0.2 | 0.6 | 0.2 | 90.0% | 83.9% | 98.8% | 81.0% | 99.0% | 89.0% |
| 0.1 | 0.1 | 0.8 | 89.5% | 82.9% | 99.4% | 79.5% | 99.5% | 88.3% |
| 0.2 | 0.2 | 0.6 | 89.0% | 82.5% | 98.7% | 79.0% | 99.0% | 87.8% |
| 97.2% | 96.1% | 98.5% | 96.0% | 98.5% | 97.2% |
We perform intensive experiments with CECT using seven groups of , , and on the COVID-19 radiography dataset and COVIDx CXR-3 dataset and illustrate the results in table 2 and table 3, respectively. For the COVID-19 radiography dataset, we find that the values of , , and have no discernible impact on the model performance and the evaluation metrics fluctuate between 93.4% and 99.2%. When , , and all equal , highest ACC and FOS of 98.1% and 96.4% are observed. When , , and equals 0.2, 0.6, and 0.2, the PPV and SPE reach the maximum value of 97.5% and 99.1%, respectively. Besides, the highest NPV and SEN of 99.2% and 97.8% are observed when , , and equals 0.6, 0.2, and 0.2. We choose the coefficient group of , , and for model performance comparison in Section 4.2 as it shows the highest ACC.
Regarding the COVID-19 CXR-3 dataset, we observe that the , , and show a significant impact on the model performance, where the evaluation metrics vary from 75.5% to 99.5%. When , , and all equal , the highest ACC, NPV, SEN, and FOS are observed, reaching 97.2%, 96.1%, 96.0%, and 97.2%, respectively. When , , and equals 0.8, 0.1, and 0.1, the highest PPV of 98.9% is reached. For the case that , , and equals 0.1, 0.1, and 0.8, the highest SPE of 99.5% is observed. Significant variations in model performance among different coefficient groups could potentially be attributed to the inner data distribution. When facing challenging or unusual data distribution, capturing features equally at all scales can greatly improve the generalization ability of the model. Due to this, the best performance is reached when , , and share the same proportion. We choose the coefficient group of , , and for comparing the model performance in Section 4.2 due to the overall performance leadership.
4.2 Performance comparison
| Model | Venue | C | T | ACC | NPV | PPV | SEN | SPE | FOS |
|---|---|---|---|---|---|---|---|---|---|
| ConvNeXt [18] | CVPR 22’ | 95.7% | 95.8% | 95.2% | 87.8% | 98.4% | 91.4% | ||
| RegNetX [52] | CVPR 20’ | 95.9% | 97.3% | 92.0% | 92.5% | 97.2% | 92.3% | ||
| GhostNet [53] | CVPR 20’ | 97.2% | 96.9% | 98.2% | 91.2% | 99.4% | 94.6% | ||
| CSPNet [54] | CVPRW 20’ | 92.7% | 94.6% | 87.0% | 84.8% | 95.5% | 85.9% | ||
| SKNet [55] | CVPR 19’ | 95.3% | 97.4% | 89.6% | 92.8% | 96.2% | 91.2% | ||
| VoVNet [56] | CVPRW 19’ | 95.7% | 96.3% | 93.9% | 89.5% | 97.9% | 91.7% | ||
| ViT [20] | ICLR 21’ | 95.1% | 95.9% | 92.5% | 88.4% | 97.4% | 90.4% | ||
| MaxViT [57] | ECCV 22’ | 91.5% | 91.5% | 91.2% | 74.6% | 97.4% | 82.1% | ||
| CrossViT [22] | ICCV 21’ | 79.7% | 84.2% | 63.6% | 53.0% | 89.2% | 57.8% | ||
| LeViT [32] | ICCV 21’ | 90.3% | 90.2% | 90.7% | 70.2% | 97.4% | 79.1% | ||
| CoaT [30] | ICCV 21’ | 92.8% | 94.3% | 88.1% | 83.7% | 96.0% | 85.8% | ||
| MobileViT [33] | ICLR 22’ | 82.8% | 84.5% | 74.8% | 51.7% | 93.8% | 61.1% | ||
| CECT(Ours) | - | 98.1% | 98.6% | 96.7% | 96.1% | 98.8% | 96.4% |
| Model | Venue | C | T | ACC | NPV | PPV | SEN | SPE | FOS |
|---|---|---|---|---|---|---|---|---|---|
| ConvNeXt [18] | CVPR 22’ | 82.2% | 74.7% | 96.4% | 67.0% | 97.5% | 79.1% | ||
| RegNetX [52] | CVPR 20’ | 90.0% | 84.5% | 97.6% | 82.0% | 98.0% | 89.1% | ||
| GhostNet [53] | CVPR 20’ | 79.2% | 71.3% | 96.8% | 60.5% | 98.0% | 74.5% | ||
| CSPNet [54] | CVPRW 20’ | 89.2% | 85.8% | 93.4% | 84.5% | 94.0% | 88.7% | ||
| SKNet [55] | CVPR 19’ | 85.2% | 80.5% | 91.7% | 77.5% | 93.0% | 84.0% | ||
| VoVNet [56] | CVPRW 19’ | 93.7% | 91.1% | 96.8% | 90.5% | 97.0% | 93.5% | ||
| ViT [20] | ICLR 21’ | 83.7% | 77.3% | 94.1% | 72.0% | 95.5% | 81.6% | ||
| MaxViT [57] | ECCV 22’ | 75.0% | 69.1% | 86.2% | 59.5% | 90.5% | 70.4% | ||
| CrossViT [22] | ICCV 21’ | 63.5% | 60.5% | 68.7% | 49.5% | 77.5% | 57.6% | ||
| LeViT [32] | ICCV 21’ | 88.7% | 82.2% | 98.7% | 78.5% | 99.0% | 87.5% | ||
| CoaT [30] | ICCV 21’ | 81.7% | 74.3% | 95.7% | 66.5% | 97.0% | 78.5% | ||
| MobileViT [33] | ICLR 22’ | 75.2% | 70.6% | 82.6% | 64.0% | 86.5% | 72.1% | ||
| CECT(Ours) | - | 97.2% | 96.1% | 98.5% | 96.0% | 98.5% | 97.2% |
We compare the model performance between our CECT and several SOTA models in table 4 and table 5. For intuitive illustration, the introduced SOTA models are categorized into three types, including the CNN- based, transformer-based, as well as their hybrid. As can be seen, our CECT outperforms SOTA methods on six evaluation metrics to a different extent. On the COVID-19 radiography dataset, our CECT shows apparent performance leadership on most metrics. It reaches the highest ACC, NPV, SEN, and FOS of 98.1%, 98.6%, 96.1%, and 96.4%, respectively. Regarding the PPV and SPE, the performance is also among the best though not as high as GhoseNet. In the result of the COVIDx CXR-3 dataset, CECT shows tremendous leadership on five of six evaluation metrics, reaching an ACC, NPV, PPV, SEN, and FOS of 97.2%, 96.1%, 98.5%, 96.0%, and 97.2%, respectively. The highest SPE is reached by LeViT with 0.5% leadership compared with CECT. The overall performance leadership of CECT shows the effectiveness of the proposed architecture and demonstrates the importance of capturing both multi-local and global features.
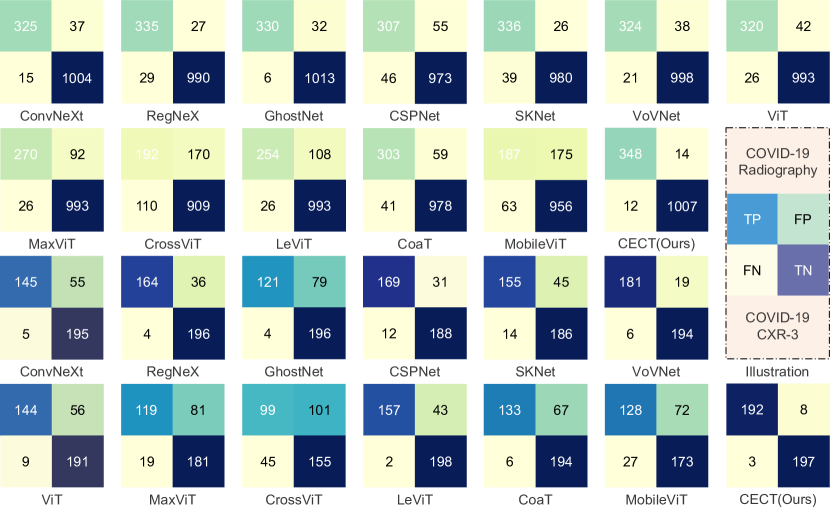
To further visualize the experiment results, we use the confusion matrix to visualize the model performance. The confusion matrix is a concise method to provide comprehensive insights into model performance. It tabulates the true and predicted classes and can not only indicates the correctness of the model but also shows the types of errors made. The abscissa and ordinate of the confusion matrix show the true and predicted labels respectively, and the number of blocks in the abscissa or ordinate shows the number of categories that need to be classified. In a binary classification task, the confusion matrix is 2 × 2 with four sub-blocks, representing TP, FP, FN, and TN, respectively, from left to right and from top to bottom. The confusion matrix comparison between our CECT and several SOTA models on two datasets can be found in fig. 3. For the COVID-19 radiography dataset, our CECT misclassifies twenty-six images, where twelve of them are FP and fourteen are FN. Compared with SOTA methods, our CECT reaches the lowest FP and the second lowest FN. Considering the COVIDx CXR-3 dataset, CECT misclassifies eleven images, where eight of them are FP and only three are FN. The same as before, CECT has the lowest FP and the second lowest FN.
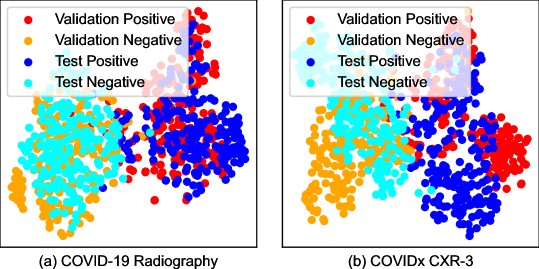
From either table 4, table 5 or fig. 3, an identical curious problem exists. Generally, the performance of the DL model should improve with increasing dataset sizes. However, the overall models perform worse in the COVIDx CXR-3 dataset, which has a larger size compared with the COVID-19 radiography dataset, as shown in table 1. We even observe an SEN of lower than 50.0%, which represents a higher FP compared with TP. To this end, a natural question is raised on why this occurs. Following lots of consideration, we repute that the performance gap between the two datasets is caused by the data distribution. Recall that the training, validation, and test subsets of the COVID-19 radiography dataset are divided simultaneously, while the COVIDx CXR-3 dataset has a separately provided test subset. The separate test subset may lead to a bigger data distribution difference thus improving the requirement of the model generalization ability to a large extent. To verify our conjecture, we employ T-distributed Stochastic Neighbor Embedding (t-SNE) [58] to visualize the data distribution.
The t-SNE is designed for high-dimensional data visualization and can make clusters within the data apparent. In t-SNE, similar objects are modeled by nearby points while dissimilar objects are modeled by distant points. With this, understanding the separability and relationships among different classes in high-dimensional data can be more easy and visually. The t-SNE visualization across the two datasets can be found in fig. 4, in which we compare the data distribution between the validation subset and test subset. The features are extracted ahead of the classification head of the TCB. The reason why we use the validation subset instead of the training subset is that the training subset undergoes data augmentation and the validation subset and test subset are not. From the observation, we can find that the COVIDx CXR-3 dataset has a more apparent data distribution difference between the two subsets. The red dots and blue dots have a large non-overlapping area while this is not observed in the COVID-19 radiography dataset. This is within our expectations as the simultaneously divided subsets should follow the close distribution and also verify our conjecture. With such distribution in the COVIDx CXR-3 dataset, the generalization ability of the model can greatly affect the final performance of the model. With remarkable generalization ability, our CECT shows basically identical excellent performance across the two datasets, repeatedly demonstrating the effectiveness of CECT as well as the importance of capturing features at multi-local and global scales.
4.3 Ablation study
| CEB | TDB | TCB | 28 × 28 | 56 × 56 | 112 × 112 | 224 × 224 | ACC | |||
|---|---|---|---|---|---|---|---|---|---|---|
| - | - | - | 77.5% | |||||||
| - | - | - | 76.0% | |||||||
| - | - | - | 85.2% | |||||||
| - | - | - | 85.0% | |||||||
| 0 | 0 | 1 | 74.7% | |||||||
| 0 | 0.5 | 0.5 | 84.2% | |||||||
| 97.2% |
To further show the effectiveness and importance of capturing both multi-local and global features, we conducted intensive ablation experiments on the COVIDx CXR-3 dataset as CECT outperforms existing methods to a large extent. As illustrated in table 6, the studies are performed across different block configurations as well as feature capture scales. For the variants with CEB only, we assess the performance of its three sub-encoders, which we train with designed classification heads. For the variants solely composed of TCB, we directly train it for performance evaluation as it is capable of performing classification individually. In cases where CEB, TDB, and TCB are all included, we simulate the situation that local features at different scales are absent. This results in two sets, in which one lacks local features at both the 28 × 28 and 56 × 56 scales, while the other lacks local features at the 28 × 28 scale only.
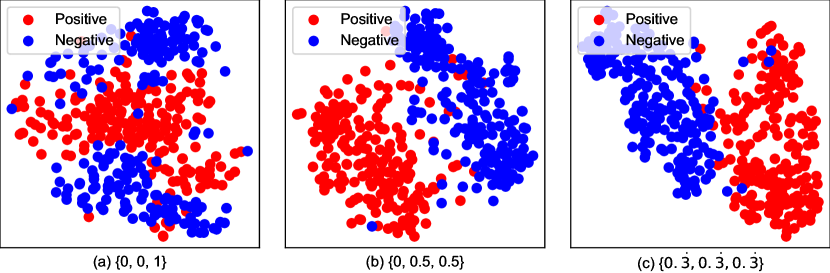
It becomes evident that the variants using merely CEB or TCB are utilized to simulate the cases in which only the CNN- or transformer-based architecture is employed. As for the variants with all CEB, TDB, and TCB included, the cases where both of them are implemented are simulated. As observed, the model performance drops significantly in the case of only the CNN- or transformer-based methods being utilized. We only observe an accuracy of 76.0% to 85.2% and 85.0%, for the variants that leverage CNN and transformer, respectively. When the CNN and transformer are married, we notice that the more features absent, the worse the overall model performance. When local features at both the 28 × 28 and 56 × 56 scales are absent, the performance drops to 74.7%. When only the local features at the 28 × 28 scale are absent, the observed accuracy is 84.2%. We present the t-SNE visualization across different groups of ensemble coefficients in fig. 5. From the visualizations, it can be inferred that as the model captures features at a variety of scales, the discriminative ability of the model improves noticeably. The sequence of subfigures presented in fig. 5 offers an evolutionary progression, illustrating how the model performance increases with more features captured. The results of the ablation study further underscore the effectiveness and importance of capturing multi-scale features from the visual input, thereby highlighting the novelty of our CECT approach.
5 Conclusions
In this paper, we propose a novel CECT model by marrying CNN and transformer to capture features at both multi-local and global scales. Furthermore, with the proposed ensemble coefficients, the contribution of local features at different scales can be controlled arbitrarily. Extensive experiments have shown that CECT outperforms existing methods, either based on CNN, transformer, or their hybrids on two public COVID-19 datasets. To prove the effectiveness and importance of capturing both multi-local and global features, we conduct extensive ablation experiments on the COVIDx CXR-3 dataset as CECT shows tremendous performance leadership on it. From the ablation study, we observe that the absence of more features deteriorates the overall model performance, which is consistent with experimental results as well as common knowledge. With remarkable feature capture ability, CECT may be extended to border classification scenarios. The future perspective is two-fold. For one thing, as the proposed CECT is designed for image classification, it is essential to extend it to broader tasks like image segmentation. For another, the proposed ensemble coefficients can be integrated into the CECT in a more inner way. For instance, the coefficients can be designed as model hyperparameters and the hyperparameters can be updated during the training process to search for better model performance.
References
- [1] Chaolin Huang, Yeming Wang, Xingwang Li, Lili Ren, Jianping Zhao, Yi Hu, Li Zhang, Guohui Fan, Jiuyang Xu, Xiaoying Gu, et al. Clinical features of patients infected with 2019 novel coronavirus in wuhan, china. The lancet, 395(10223):497–506, 2020.
- [2] Qun Li, Xuhua Guan, Peng Wu, Xiaoye Wang, Lei Zhou, Yeqing Tong, Ruiqi Ren, Kathy SM Leung, Eric HY Lau, Jessica Y Wong, et al. Early transmission dynamics in wuhan, china, of novel coronavirus–infected pneumonia. New England journal of medicine, 382(13):1199–1207, 2020.
- [3] Covid-19 chest x-ray images and lung masks database. https://coronavirus.jhu.edu/map.html. Accessed 17 July 2023.
- [4] Ritam Saha and Mrinal Kanti Bhowmik. Active contour model for medical applications. In Handbook of Research on Natural Computing for Optimization Problems, pages 937–959. IGI Global, 2016.
- [5] Zhaoshan Liu and Lei Shen. Medical image analysis based on transformer: A review. arXiv preprint, 2022. https://doi.org/10.48550/arXiv.2208.06643.
- [6] Shu Zhang, Jinru Wu, Enze Shi, Sigang Yu, Yongfeng Gao, Lihong Connie Li, Licheng Ryan Kuo, Marc Jason Pomeroy, and Zhengrong Jerome Liang. Mm-glcm-cnn: A multi-scale and multi-level based glcm-cnn for polyp classification. Computerized Medical Imaging and Graphics, page 102257, 2023.
- [7] Zhibin Liao, Kewen Liao, Haifeng Shen, Marouska F Van Boxel, Jasper Prijs, Ruurd L Jaarsma, Job N Doornberg, Anton Van den Hengel, and Johan W Verjans. Cnn attention guidance for improved orthopedics radiographic fracture classification. IEEE Journal of Biomedical and Health Informatics, 26(7):3139–3150, 2022.
- [8] Zhaoshan Liu, Qiujie Lv, Chau Hung Lee, and Lei Shen. Gsda: A generative adversarial network-based semi-supervised data augmentation method. arXiv preprint arXiv:2203.06184, 2022.
- [9] Rikiya Yamashita, Mizuho Nishio, Richard Kinh Gian Do, and Kaori Togashi. Convolutional neural networks: an overview and application in radiology. Insights into imaging, 9(4):611–629, 2018.
- [10] Ashish Vaswani, Noam Shazeer, Niki Parmar, Jakob Uszkoreit, Llion Jones, Aidan N Gomez, Łukasz Kaiser, and Illia Polosukhin. Attention is all you need. Adv Neural Inf Process Syst, 30:1–11, 2017.
- [11] Covid-19 chest x-ray images and lung masks database. https://www.kaggle.com/datasets/tawsifurrahman/covid19-radiography-database. Accessed 19 October 2022.
- [12] Linda Wang, Zhong Qiu Lin, and Alexander Wong. Covid-net: A tailored deep convolutional neural network design for detection of covid-19 cases from chest x-ray images. Sci Rep, 10(1):1–12, 2020. https://doi.org/10.1038/s41598-020-76550-z.
- [13] Chest x-ray images for the detection of covid-19. https://www.kaggle.com/datasets/andyczhao/covidx-cxr2. Accessed 19 October 2022.
- [14] Muhammad EH Chowdhury, Tawsifur Rahman, Amith Khandakar, Rashid Mazhar, Muhammad Abdul Kadir, Zaid Bin Mahbub, Khandakar Reajul Islam, Muhammad Salman Khan, Atif Iqbal, Nasser Al Emadi, et al. Can ai help in screening viral and covid-19 pneumonia? IEEE Access, 8:132665–132676, 2020. https://doi.org/10.1109/ACCESS.2020.3010287.
- [15] Tawsifur Rahman, Amith Khandakar, Yazan Qiblawey, Anas Tahir, Serkan Kiranyaz, Saad Bin Abul Kashem, Mohammad Tariqul Islam, Somaya Al Maadeed, Susu M Zughaier, Muhammad Salman Khan, et al. Exploring the effect of image enhancement techniques on covid-19 detection using chest x-ray images. Comput. Biol. Med., 132:104319, 2021. https://doi.org/10.1016/j.compbiomed.2021.104319.
- [16] Alex Krizhevsky, Ilya Sutskever, and Geoffrey E Hinton. Imagenet classification with deep convolutional neural networks. Commun. ACM, 60(6):84–90, 2017. https://doi.org/10.1145/3065386.
- [17] Kaiming He, Xiangyu Zhang, Shaoqing Ren, and Jian Sun. Deep residual learning for image recognition. In Proceedings of the IEEE/CVF Conference on Computer Vision and Pattern Recognition, pages 770–778, 2016. https://doi.org/10.1109/CVPR.2016.90.
- [18] Zhuang Liu, Hanzi Mao, Chao-Yuan Wu, Christoph Feichtenhofer, Trevor Darrell, and Saining Xie. A convnet for the 2020s. In Proceedings of the IEEE/CVF Conference on Computer Vision and Pattern Recognition, pages 11976–11986, 2022.
- [19] Weihao Yu, Chenyang Si, Pan Zhou, Mi Luo, Yichen Zhou, Jiashi Feng, Shuicheng Yan, and Xinchao Wang. Metaformer baselines for vision. arXiv preprint arXiv:2210.13452, 2022.
- [20] Alexey Dosovitskiy, Lucas Beyer, Alexander Kolesnikov, Dirk Weissenborn, Xiaohua Zhai, Thomas Unterthiner, Mostafa Dehghani, Matthias Minderer, Georg Heigold, Sylvain Gelly, et al. An image is worth 16x16 words: Transformers for image recognition at scale. arXiv preprint, 2020. https://doi.org/10.48550/arXiv.2010.11929.
- [21] Ze Liu, Yutong Lin, Yue Cao, Han Hu, Yixuan Wei, Zheng Zhang, Stephen Lin, and Baining Guo. Swin transformer: Hierarchical vision transformer using shifted windows. In Proceedings of the IEEE/CVF International Conference on Computer Vision, pages 10012–10022, 2021.
- [22] Chun-Fu Richard Chen, Quanfu Fan, and Rameswar Panda. Crossvit: Cross-attention multi-scale vision transformer for image classification. In Proceedings of the IEEE/CVF international conference on computer vision, pages 357–366, 2021.
- [23] Linh T Duong, Nhi H Le, Toan B Tran, Vuong M Ngo, and Phuong T Nguyen. Detection of tuberculosis from chest x-ray images: boosting the performance with vision transformer and transfer learning. Expert Syst. Appl., 184:115519, 2021. https://doi.org/10.1016/j.eswa.2021.115519.
- [24] Tianmu Wang, Zhenguo Nie, Ruijing Wang, Qingfeng Xu, Hongshi Huang, Handing Xu, Fugui Xie, and Xin-Jun Liu. Pneunet: deep learning for covid-19 pneumonia diagnosis on chest x-ray image analysis using vision transformer. Med. Biol. Eng. Comput., pages 1–14, 2023. https://doi.org/10.1007/s11517-022-02746-2.
- [25] Hong Gu, Hongyu Wang, Pan Qin, and Jia Wang. Chest l-transformer: Local features with position attention for weakly supervised chest radiograph segmentation and classification. Front. Med., page 1619, 2022. https://doi.org/10.3389/fmed.2022.923456.
- [26] Jie Mei. Marrying convolution and transformer for covid-19 diagnosis based on ct scans. In Proceedings of the International Joint Conference on Neural Networks, pages 1–7. IEEE, 2022. https://doi.org/10.1109/IJCNN55064.2022.9892015.
- [27] Qixuan Sun, Nianhua Fang, Zhuo Liu, Liang Zhao, Youpeng Wen, and Hongxiang Lin. Hybridctrm: Bridging cnn and transformer for multimodal brain image segmentation. J. Healthc. Eng., 2021, 2021. https://doi.org/10.1155/2021/7467261.
- [28] Mingxing Tan and Quoc Le. Efficientnet: Rethinking model scaling for convolutional neural networks. In Proceedings of the International conference on machine learning, pages 6105–6114. PMLR, 2019.
- [29] Jianyuan Guo, Kai Han, Han Wu, Yehui Tang, Xinghao Chen, Yunhe Wang, and Chang Xu. Cmt: Convolutional neural networks meet vision transformers. In Proceedings of the IEEE/CVF Conference on Computer Vision and Pattern Recognition, pages 12175–12185, 2022.
- [30] Weijian Xu, Yifan Xu, Tyler Chang, and Zhuowen Tu. Co-scale conv-attentional image transformers. In Proceedings of the IEEE/CVF International Conference on Computer Vision, pages 9981–9990, 2021.
- [31] Muhammad Maaz, Abdelrahman Shaker, Hisham Cholakkal, Salman Khan, Syed Waqas Zamir, Rao Muhammad Anwer, and Fahad Shahbaz Khan. Edgenext: efficiently amalgamated cnn-transformer architecture for mobile vision applications. In European Conference on Computer Vision, pages 3–20. Springer, 2022.
- [32] Benjamin Graham, Alaaeldin El-Nouby, Hugo Touvron, Pierre Stock, Armand Joulin, Hervé Jégou, and Matthijs Douze. Levit: a vision transformer in convnet’s clothing for faster inference. In Proceedings of the IEEE/CVF international conference on computer vision, pages 12259–12269, 2021.
- [33] Sachin Mehta and Mohammad Rastegari. Mobilevit: light-weight, general-purpose, and mobile-friendly vision transformer. arXiv preprint arXiv:2110.02178, 2021.
- [34] Samir S Yadav and Shivajirao M Jadhav. Deep convolutional neural network based medical image classification for disease diagnosis. J. Big Data, 6(1):1–18, 2019. https://doi.org/10.1186/s40537-019-0276-2.
- [35] Rehan Ashraf, Muhammad Asif Habib, Muhammad Akram, Muhammad Ahsan Latif, Muhammad Sheraz Arshad Malik, Muhammad Awais, Saadat Hanif Dar, Toqeer Mahmood, Muhammad Yasir, and Zahoor Abbas. Deep convolution neural network for big data medical image classification. IEEE Access, 8:105659–105670, 2020. https://doi.org/10.1109/ACCESS.2020.2998808.
- [36] Fung Fung Ting, Yen Jun Tan, and Kok Swee Sim. Convolutional neural network improvement for breast cancer classification. Expert Syst. Appl., 120:103–115, 2019. https://doi.org/10.1016/j.eswa.2018.11.008.
- [37] Ana C Perre, Luís A Alexandre, and Luís C Freire. Lesion classification in mammograms using convolutional neural networks and transfer learning. Comp. Meth. Biomech. Biomed. Eng., 2018. https://doi.org/10.1080/21681163.2018.1498392.
- [38] Asmaa Abbas, Mohammed M Abdelsamea, and Mohamed Medhat Gaber. Classification of covid-19 in chest x-ray images using detrac deep convolutional neural network. Appl. Intell., 51(2):854–864, 2021. https://doi.org/10.1007/s10489-020-01829-7.
- [39] Suliman Aladhadh, Majed Alsanea, Mohammed Aloraini, Taimoor Khan, Shabana Habib, and Muhammad Islam. An effective skin cancer classification mechanism via medical vision transformer. Sensors, 22(11):4008, 2022. https://doi.org/10.3390/s22114008.
- [40] Koushik Sivarama Krishnan and Karthik Sivarama Krishnan. Vision transformer based covid-19 detection using chest x-rays. In Proceedings of the International Conference on Signal Processing, Computing and Control, pages 644–648. IEEE, 2021. https://doi.org/10.1109/ISPCC53510.2021.9609375.
- [41] Magdy Abd-Elghany Zeid, Khaled El-Bahnasy, and SE Abo-Youssef. Multiclass colorectal cancer histology images classification using vision transformers. In Proceedings of the International Conference on Intelligent Computing and Information Systems, pages 224–230. IEEE, 2021. https://doi.org/10.1109/ICICIS52592.2021.9694125.
- [42] Chiagoziem C Ukwuoma, Zhiguang Qin, Md Belal Bin Heyat, Faijan Akhtar, Abla Smahi, Jehoiada K Jackson, Syed Furqan Qadri, Abdullah Y Muaad, Happy N Monday, and Grace U Nneji. Automated lung-related pneumonia and covid-19 detection based on novel feature extraction framework and vision transformer approaches using chest x-ray images. Bioengineering, 9(11):709, 2022. https://doi.org/10.3390/bioengineering9110709.
- [43] Tuan Le Dinh, Suk-Hwan Lee, Seong-Geun Kwon, and Ki-Ryong Kwon. Covid-19 chest x-ray classification and severity assessment using convolutional and transformer neural networks. Appl. Sci., 12(10):4861, 2022. https://doi.org/10.3390/app12104861.
- [44] Sudhakar Tummala, Jungeun Kim, and Seifedine Kadry. Breast-net: Multi-class classification of breast cancer from histopathological images using ensemble of swin transformers. Mathematics, 10(21):4109, 2022.
- [45] Yin Dai, Yifan Gao, and Fayu Liu. Transmed: Transformers advance multi-modal medical image classification. Diagnostics, 11(8):1384, 2021.
- [46] Omid Nejati Manzari, Hamid Ahmadabadi, Hossein Kashiani, Shahriar B Shokouhi, and Ahmad Ayatollahi. Medvit: a robust vision transformer for generalized medical image classification. Computers in Biology and Medicine, 157:106791, 2023.
- [47] Hengde Zhu, Jian Wang, Shui-Hua Wang, Rajeev Raman, Juan M Górriz, and Yu-Dong Zhang. An evolutionary attention-based network for medical image classification. International Journal of Neural Systems, 33(03):2350010, 2023.
- [48] Karen Simonyan and Andrew Zisserman. Very deep convolutional networks for large-scale image recognition. In Proceedings of the International Conference on Learning Representations, pages 1–14, 05 2015.
- [49] Andrew Howard, Mark Sandler, Grace Chu, Liang-Chieh Chen, Bo Chen, Mingxing Tan, Weijun Wang, Yukun Zhu, Ruoming Pang, Vijay Vasudevan, Quoc V. Le, and Hartwig Adam. Searching for mobilenetv3. In Proceedings of the IEEE/CVF International Conference on Computer Vision, pages 1314–1324, 2019. https://doi.org/10.1109/ICCV.2019.00140.
- [50] Adam Paszke, Sam Gross, Francisco Massa, Adam Lerer, James Bradbury, Gregory Chanan, Trevor Killeen, Zeming Lin, Natalia Gimelshein, Luca Antiga, et al. Pytorch: An imperative style, high-performance deep learning library. Advances in neural information processing systems, 32, 2019.
- [51] Jia Deng, Wei Dong, Richard Socher, Li-Jia Li, Kai Li, and Li Fei-Fei. Imagenet: A large-scale hierarchical image database. In 2009 IEEE conference on computer vision and pattern recognition, pages 248–255. Ieee, 2009.
- [52] Ilija Radosavovic, Raj Prateek Kosaraju, Ross Girshick, Kaiming He, and Piotr Dollár. Designing network design spaces. In Proceedings of the IEEE/CVF conference on computer vision and pattern recognition, pages 10428–10436, 2020.
- [53] Kai Han, Yunhe Wang, Qi Tian, Jianyuan Guo, Chunjing Xu, and Chang Xu. Ghostnet: More features from cheap operations. In Proceedings of the IEEE/CVF conference on computer vision and pattern recognition, pages 1580–1589, 2020.
- [54] Chien-Yao Wang, Hong-Yuan Mark Liao, Yueh-Hua Wu, Ping-Yang Chen, Jun-Wei Hsieh, and I-Hau Yeh. Cspnet: A new backbone that can enhance learning capability of cnn. In Proceedings of the IEEE/CVF conference on computer vision and pattern recognition workshops, pages 390–391, 2020.
- [55] Xiang Li, Wenhai Wang, Xiaolin Hu, and Jian Yang. Selective kernel networks. In Proceedings of the IEEE/CVF conference on computer vision and pattern recognition, pages 510–519, 2019.
- [56] Youngwan Lee, Joong-won Hwang, Sangrok Lee, Yuseok Bae, and Jongyoul Park. An energy and gpu-computation efficient backbone network for real-time object detection. In Proceedings of the IEEE/CVF conference on computer vision and pattern recognition workshops, pages 0–0, 2019.
- [57] Zhengzhong Tu, Hossein Talebi, Han Zhang, Feng Yang, Peyman Milanfar, Alan Bovik, and Yinxiao Li. Maxvit: Multi-axis vision transformer. In Proceedings of the European Conference on Computer Vision, pages 459–479. Springer, 2022.
- [58] Laurens Van der Maaten and Geoffrey Hinton. Visualizing data using t-sne. Journal of machine learning research, 9(11), 2008.