CLiNet: Joint Detection of Road Network Centerlines in 2D and 3D
Abstract
This work introduces a new approach for joint detection of centerlines based on image data by localizing the features jointly in 2D and 3D. In contrast to existing work that focuses on detection of visual cues, we explore feature extraction methods that are directly amenable to the urban driving task. To develop and evaluate our approach, a large urban driving dataset dubbed AV Breadcrumbs is automatically labeled by leveraging vector map representations and projective geometry to annotate over 900,000 images. Our results demonstrate potential for dynamic scene modeling across various urban driving scenarios. Our model achieves an F1 score of 0.684 and an average normalized depth error of 2.083. The code and data annotations are publicly available.111avl.ucsd.edu 222https://github.com/AutonomousVehicleLaboratory/clinet
I INTRODUCTION
Open-source contributions to the research community have helped accelerate the development of autonomous vehicle technology in recent years. These contributions include open-source datasets such as Argoverse2 [1], Waymo Open Dataset [2], and NuPlan [3]. These datasets include labeled sensor and map data that has been curated for various tasks including detection [4, 5], tracking [6, 7], prediction [8, 9], and planning [10, 11].
A core component of these datasets involves the map information that describes lane level definitions and road network connectivity information that is often utilized in prediction models to provide context and in planning for trajectory generation and optimization tasks. Nevertheless, these models often make a static world assumption that may present failure modes in real-world deployment in the presence of road changes or construction. Examples of methods that utilize high definition maps in autonomy stacks include [12, 13, 14] that facilitate global planning for point-to-point navigation; however, given the drastic differences between the definitions, an autonomous agent would be unable to negotiate a feasible trajectory without continuous updates to static map features. This illustrates the importance of dynamic and real-time scene understanding.
To explore dynamic scene modeling strategies, this work presents three key contributions to the open-source research community, namely,
-
•
A publicly available dataset that is automatically labeled by utilizing vector map data from the Argoverse2 sensor dataset. Our work presents an approach for automatic image labeling by leveraging ego-vehicle localization, the state information of each camera, and projective geometry to align map features with image data. The dataset contains over 900,000 annotated image frames across three front facing cameras with various information including centerline and lane boundary definitions.
-
•
A baseline approach termed CLiNet is implemented for centerline key-points prediction with joint 2D and 3D key-point estimation. The approach leverages intrinsic parameters to decouple sensor-specific assumptions from the training process. To the best of our knowledge, this is the first approach that focuses on directly predicting centerline features from camera observations in an urban setting.
-
•
A benchmark is provided to aid in the evaluation of centerline prediction methods. We hope our contribution further motivates the research community to help drive the development of fully dynamic methods for urban driving applications.
II RELATED WORK
Lane detection and semantic segmentation has remained an active area of research for decades. Early work for autonomous driving applications relied on traditional edge detection techniques, as described in [16]. However, with the introduction of learning-based methods for lane detection and segmentation tasks, a number of methods have been developed in recent years. These methods cover semantic segmentation as well as key-point and parametric-based approaches.
The semantic segmentation task consists of a per-pixel prediction task, in which every pixel from an image is classified into different classes. Public datasets including Mapillary [17] and Cityscapes [18] have enabled multiple open-source contributions in the semantic segmentation task that leverage encoder-decoder architectures and spatial pyramid pooling modules [19] and attention mechanisms to resolve fine grain details [20]. These methods are capable of resolving small details. However, semantic segmentation can present a large computational overhead during training and inference time, which can limit the use cases for real-time scene understanding.
Another approach for inferring drivable regions and trajectories involves key-point and spline prediction for lanes directly. Examples of real-time image based key-point detection include PINet[15]. In a similar way, the lane detection tasks have been extended to include parameterized spline representations such as Bezier curves [21] that compress a lane representation by using a fixed number of control points. However, these methods can struggle when recovering irregular lanes and sharp curves that may not be fully characterized by a finite number of control points. More recently, the lane detection task has also been extended to 3D [22] by using synthetic [23] and real-world datasets [24].
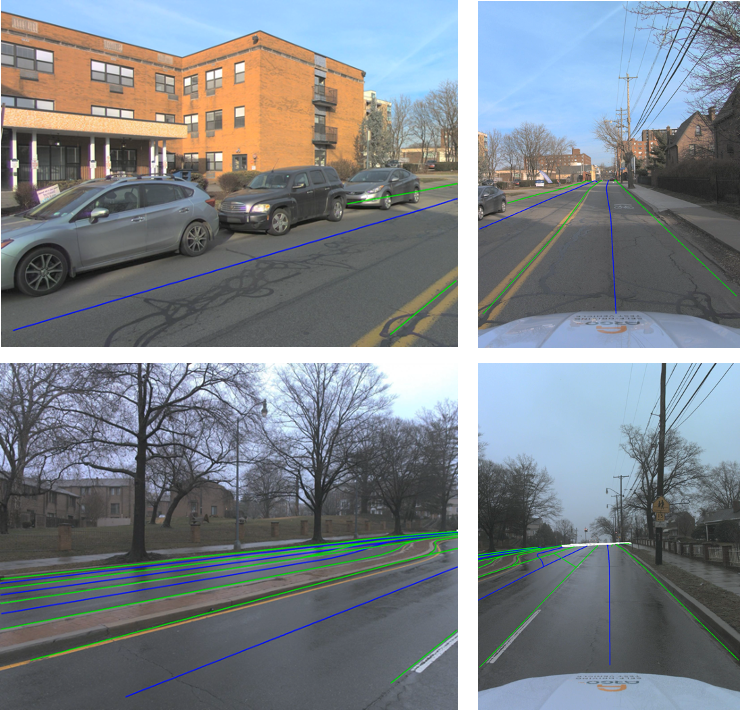
In contrast to existing work, we introduce an approach that focuses on directly predicting centerline key-points as shown in Fig 1. A key benefit of directly predicting centerlines involves downstream applications and post-processing. In practice, the centerlines of each lane provide reference trajectories that can be directly utilized by motion planners. Standard methods for detection and segmentation of lanes still infer an overhead for centerline extraction and reasoning depending on the context of the scene and whether a bounded lane mark boundary is traversable or not.
III CENTERLINE KEY-POINT PREDICTION
In this section, we outline the design of CLiNet for the 2D and 3D centerline prediction task. A number of design considerations are made to decouple sensor-specific assumptions from the training process by incorporating the intrinsic parameters of each camera during the depth prediction task. Furthermore, in contrast to semantic segmentation frameworks that seek to classify each pixel with various semantic classes, we simplify the complexity of the model by only predicting the centerline key-points that are directly relevant for the driving task.
III-A CLiNet Architecture
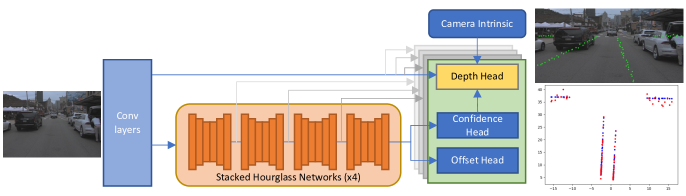
Our approach is motivated by the stacked hourglass network described in the Point Instance Network (PINet) work proposed in [15]. This approach stacks multiple hourglass networks during the training process that can be separated during testing as a tradeoff between inference time and precision. The model architecture and training process can be visualized in Fig. 2; where each network jointly learns centerline key-point features and contributes to the overall loss. First, an input image with known intrinsic parameters is normalized and resized to a fixed representation . A sequence of convolutional layers with batch normalization is then applied to increase channel depth to a final representation such that , where is a scaling factor. The prediction heads for each hourglass block further process the intermediate representation and output a confidence map (), depth estimates (), and key-point offset values () for each key-point on the centerline. For the experiments performed, , , , and .
III-B Losses
The confidence map focuses on the binary classification of key-points, i.e. predictions close to one indicate centerline key-point existence. Given a confidence prediction , the confidence loss is characterized by Eq. 1, where the first term minimizes false negatives and the second minimizes false positives. Each term is normalized based on the number of key-points with a ground truth class that corresponds to a key-point and the number of key-points that do not correspond to a key-point . A ground truth label is denoted by .
| (1) |
Together with the confidence map, a two-dimensional offset is predicted that indicates a scaling factor to map from a representation to the input scale. Therefore, the transformed prediction in original scale, is given by and . The offset loss is then characterized by
Given that the features are encoded in 2D, an additional multilayer perceptron (MLP) is utilized to infer depth for each centerline key-point. A depth prediction is estimated by first converting a key-point prediction in pixel space to camera coordinates. This transformation is given by the intrinsic camera parameters and by accounting for image resizing and crop operations. The camera-centric coordinates are then concatenated with its corresponding image embedding to provide additional context. This final representation is passed through the MLP to predict its z-component, namely . The depth loss is then characterized as shown below, where denotes ground truth.
In summary, the losses are added and optimized jointly during the training process using the Adam optimizer with a constant learning rate. The overall loss is given by , where is a constant.
IV EXPERIMENTS
To evaluate our reference solution, we introduce a large dataset for training, validation, and testing based on the Argoverse2 sensor data [1]. The evaluation additionally consists of a benchmark to quantify the performance of the approach for key-point localization in 2D and depth estimation (3D). Additional details on the data and benchmarks are provided below.
IV-A Dataset
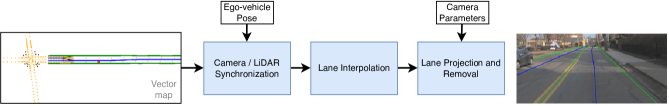
We augment the dataset to create a new reference termed AV Breadcrumbs that consists of individually labeled image frames across three front-facing cameras with known camera parameters. In contrast to standard labeling techniques that generally involve extensive manual labeling, we design a pipeline that automatically generates image key-point features with ground truth depth information. First, the ego-vehicle pose is synchronized to each camera by utilizing the LiDAR; given the pose of each camera over time and performing pose corrections, we align vector map information defined in a city coordinate frame and project its 3D features into each image frame. Given that projection preserves 2D and 3D correspondences, this facilitates the process of assigning unique lane IDs.
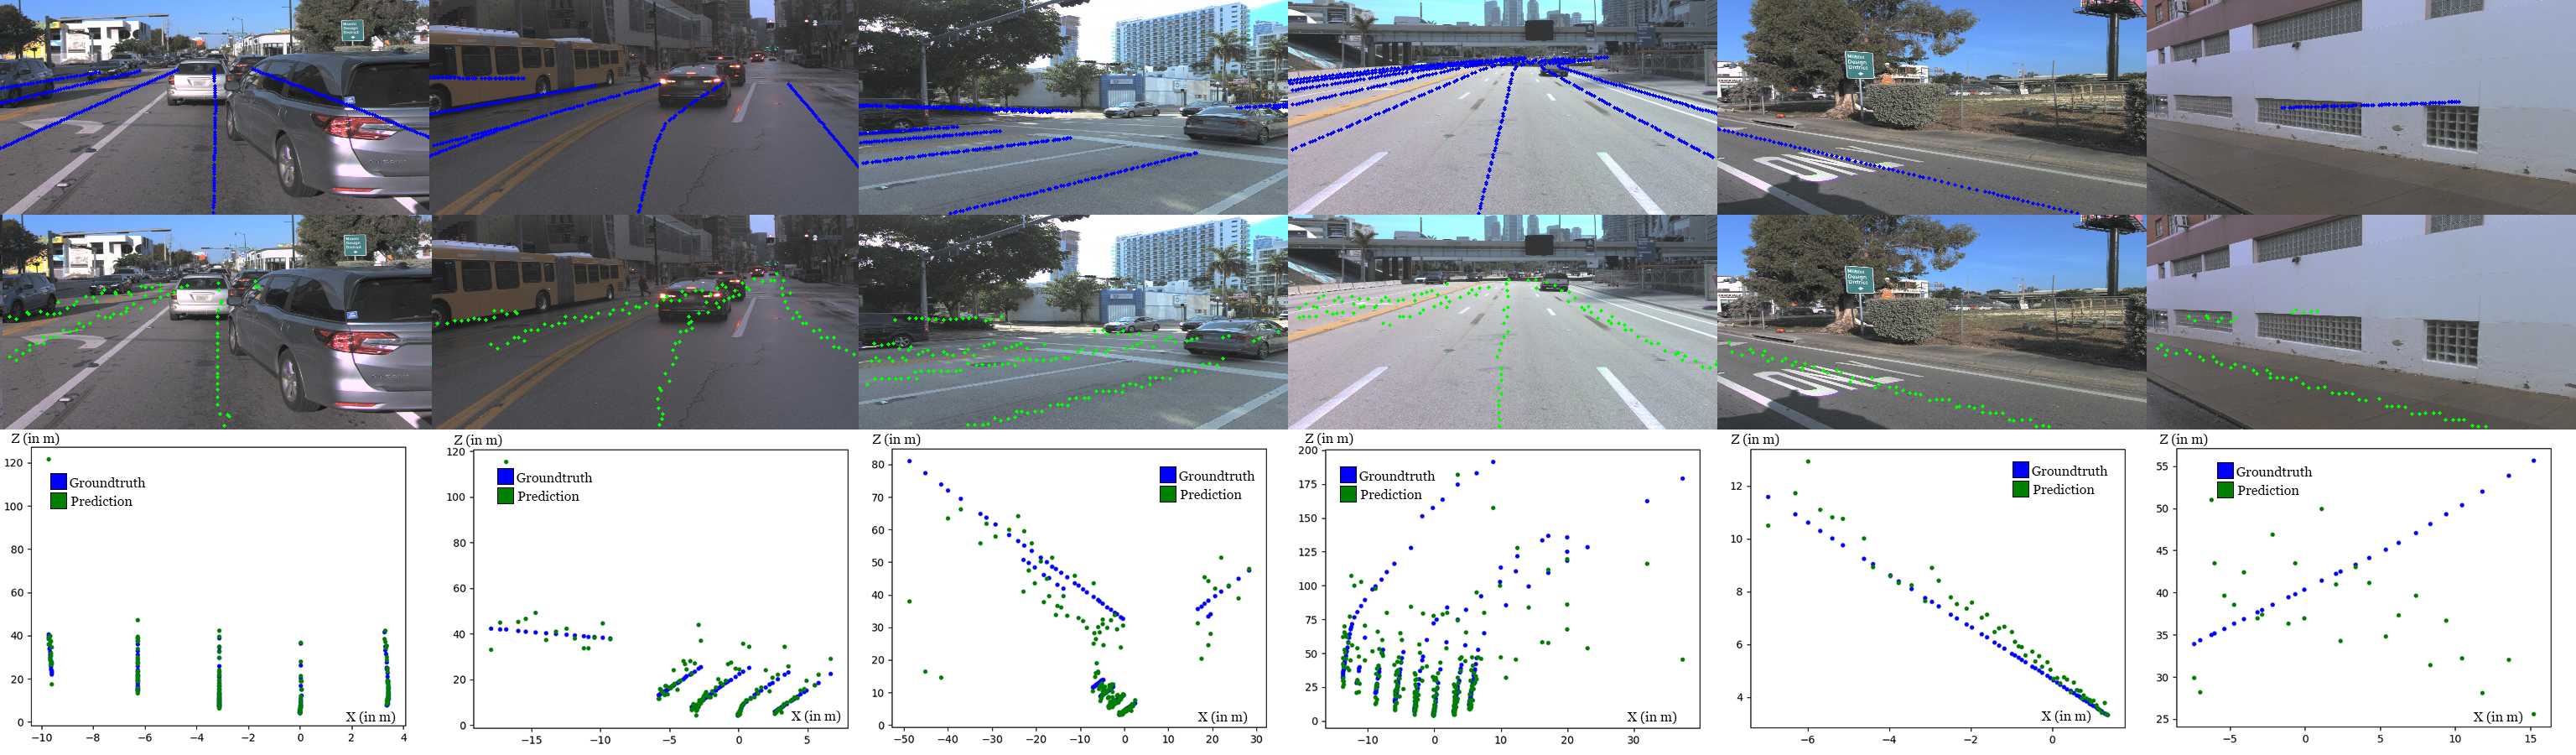
The dataset includes labels for centerlines and lane boundaries; where each label is interpolated in 3D and post-processed in an image frame to remove features that are too far or too tightly packed after projection. An important consideration involves intersections: although the full road network connectivity for each intersection is available, we find that sufficient context to identify entry and exit points of each intersection lane is often lacking when the vehicle is at an intersection. For this reason, we additionally remove labels that are too short or are part of intersections. The total split for the train, validation, and test sets corresponds to 659,720, 141,138, and 141,303 image frames, respectively. The auto-labeling pipeline is shown in Fig. 3 and a few data labels can be observed in the first row of Fig. 4. On average, we observe adequate alignment between the automatically generated features and the lanes visualized in each image.
IV-B Results
Each of the logs in the training, validation and test set comprises of sequential frames of data. We take a subset of these logs for our training and testing as two consecutive frames of data present similar features. As a result of which, we empirically chose every 10th image in the sequence for training and testing. This reduced the number of test images to 13,046 images.
Fig: 4 shows the results from our model for the test set of our dataset. It can be seen that our model performs well in detecting the key-points on the straight line segments (row:2, col:4) as well as curved line segments (row:2, col: 2). Additionally, we observe that there are some challenging scenarios due to lack of context (col:1) and complexities due to complete occlusions (col:6).
The third row of the figure illustrates predicted depth versus ground truth depth for each of the input images in the top row. We observe that the points that are at a greater distance from the camera center have relatively large error compared to those that are closer to the camera center (row:3, col:4).
Table I shows the average precision, recall and F1 score of our model on the test set. We create an occupancy grid map of the predicted key-points where the centerline key-point indices are set to 1. To calculate the number of true positives, false positives and false negatives, we then create a window of size n x n. If the occupancy grid does not contain a key-point within the windowed region, we count this key-point to be a false negative. We zero out the windowed region otherwise, which we later use for counting false positives.
To calculate the average depth error, we use the L1 norm between the ground truth and the predicted z values. We normalize this error based on the distance of the key-point from the camera center. Error for key-points closer to the camera center is penalized more than the error for key-points farther away. Average normalized depth error for the test set is 2.0834.
| Window Size | Precision | Recall | F1 Score |
|---|---|---|---|
| 5 | 0.822 | 0.585 | 0.684 |
| 3 | 0.748 | 0.512 | 0.608 |
| 1 | 0.378 | 0.229 | 0.285 |
V CONCLUSION AND FUTURE WORK
In this work, we introduced a large-scale dataset for 2D and 3D centerline detection. A reference solution to help drive progress for future contributions was additionally presented as a baseline that shows potential in real-time dynamic scene understanding.
We plan to explore further methods that improve depth perception and enforce temporal consistency. We also plan to perform curve fitting through the 2D key-points and provide additional metrics for accuracy and error. There are cases where the lane information cannot be extracted from the image due to occlusions that are a result of reprojection as show in the last column of Fig. 4. We plan to handle these cases for future work by leveraging depth data from sensors. Additionally, given the practicality of our labeling pipeline, we plan to release additional data to augment the training process and further generalize for other scenarios and sensor configurations.
ACKNOWLEDGEMENT
We appreciate the input from various members of the Autonomous Vehicle Lab, specifically Henry Zhang, Rohin Garg and Tanay Karve for their feedback on open-source driving datasets. Our team also thanks the Argo AI team for their contributions to the Argoverse2 open-source dataset. This work would not have been possible without their contributions.
References
- [1] B. Wilson, W. Qi, T. Agarwal, J. Lambert, J. Singh, S. Khandelwal, B. Pan, R. Kumar, A. Hartnett, J. K. Pontes, D. Ramanan, P. Carr, and J. Hays, “Argoverse 2: Next generation datasets for self-driving perception and forecasting,” in Proceedings of the Neural Information Processing Systems Track on Datasets and Benchmarks (NeurIPS Datasets and Benchmarks 2021), 2021.
- [2] P. Sun, H. Kretzschmar, X. Dotiwalla, A. Chouard, V. Patnaik, P. Tsui, J. Guo, Y. Zhou, Y. Chai, B. Caine, et al., “Scalability in perception for autonomous driving: Waymo open dataset,” in Proceedings of the IEEE/CVF Conference on Computer Vision and Pattern Recognition, 2020, pp. 2446–2454.
- [3] H. Caesar, J. Kabzan, and K. T. et al., “Nuplan: A closed-loop ml-based planning benchmark for autonomous vehicles,” in CVPR ADP3 workshop, 2021.
- [4] Z. Li, W. Wang, H. Li, E. Xie, C. Sima, T. Lu, Y. Qiao, and J. Dai, “Bevformer: Learning bird’s-eye-view representation from multi-camera images via spatiotemporal transformers,” arXiv preprint arXiv:2203.17270, 2022.
- [5] Z. Yang, J. Chen, Z. Miao, W. Li, X. Zhu, and L. Zhang, “Deepinteraction: 3d object detection via modality interaction,” in NeurIPS, 2022.
- [6] L. Wang, X. Zhang, W. Qin, X. Li, L. Yang, Z. Li, L. Zhu, H. Wang, J. Li, and H. Liu, “Camo-mot: Combined appearance-motion optimization for 3d multi-object tracking with camera-lidar fusion,” 2022. [Online]. Available: https://arxiv.org/abs/2209.02540
- [7] Y. Jiao, Z. Jie, S. Chen, J. Chen, L. Ma, and Y.-G. Jiang, “Msmdfusion: A gated multi-scale lidar-camera fusion framework with multi-depth seeds for 3d object detection,” 2022. [Online]. Available: https://arxiv.org/abs/2209.03102
- [8] S. Shi, L. Jiang, D. Dai, and B. Schiele, “Motion transformer with global intention localization and local movement refinement,” Advances in Neural Information Processing Systems, 2022.
- [9] B. Varadarajan, A. Hefny, A. Srivastava, K. S. Refaat, N. Nayakanti, A. Cornman, K. Chen, B. Douillard, C. P. Lam, D. Anguelov, and B. Sapp, “Multipath++: Efficient information fusion and trajectory aggregation for behavior prediction,” arXiv, 2021.
- [10] S. Casas, A. Sadat, and R. Urtasun, “Mp3: A unified model to map, perceive, predict and plan,” Conference on Computer Vision and Pattern Recognition (CVPR), 2021.
- [11] B. Ivanovic, A. Elhafsi, G. Rosman, A. Gaidon, and M. Pavone, “Mats: An interpretable trajectory forecasting representation for planning and control,” arXiv preprint arXiv:2009.07517, 2020.
- [12] S. Kato, E. Takeuchi, Y. Ishiguro, Y. Ninomiya, K. Takeda, and T. Hamada, “An open approach to autonomous vehicles,” IEEE Micro, vol. 35, no. 6, pp. 60–68, 2015.
- [13] Baidu-Apollo-team, “Apollo: Open source autonomous driving,” 2017, https://github.com/ApolloAuto/apollo. Last accessed on 10/02/2021.
- [14] H. Christensen, D. Paz, H. Zhang, D. Meyer, H. Xiang, Y. Han, Y. Liu, A. Liang, Z. Zhong, and S. Tang, “Autonomous vehicles for micro-mobility,” Autonomous Intelligent Systems, vol. 1, no. 1, 2021-12.
- [15] Y. Ko, Y. Lee, S. Azam, F. Munir, M. Jeon, and W. Pedrycz, “Key points estimation and point instance segmentation approach for lane detection,” 2020. [Online]. Available: https://arxiv.org/abs/2002.06604
- [16] E. Dickmanns, Dynamic Vision for Perception and Control of Motion. Heidelberg: Springer Verlag, October 2007.
- [17] G. Neuhold, T. Ollmann, S. Rota Bulò, and P. Kontschieder, “The mapillary vistas dataset for semantic understanding of street scenes,” in International Conference on Computer Vision (ICCV), 2017. [Online]. Available: https://www.mapillary.com/dataset/vistas
- [18] M. Cordts, M. Omran, S. Ramos, T. Rehfeld, M. Enzweiler, R. Benenson, U. Franke, S. Roth, and B. Schiele, “The cityscapes dataset for semantic urban scene understanding,” in The IEEE Conference on Computer Vision and Pattern Recognition (CVPR), June 2016.
- [19] L.-C. Chen, Y. Zhu, G. Papandreou, F. Schroff, and H. Adam, “Encoder-decoder with atrous separable convolution for semantic image segmentation,” in Computer Vision – ECCV 2018, V. Ferrari, M. Hebert, C. Sminchisescu, and Y. Weiss, Eds. Cham: Springer International Publishing, 2018, pp. 833–851.
- [20] A. Tao, K. Sapra, and B. Catanzaro, “Hierarchical multi-scale attention for semantic segmentation,” 2020. [Online]. Available: https://arxiv.org/abs/2005.10821
- [21] Z. Feng, S. Guo, X. Tan, K. Xu, M. Wang, and L. Ma, “Rethinking efficient lane detection via curve modeling,” in Computer Vision and Pattern Recognition, 2022.
- [22] Y. Bai, Z. Chen, Z. Fu, L. Peng, P. Liang, and E. Cheng, “Curveformer: 3d lane detection by curve propagation with curve queries and attention,” 2022. [Online]. Available: https://arxiv.org/abs/2209.07989
- [23] Y. Guo, G. Chen, P. Zhao, W. Zhang, J. Miao, J. Wang, and T. E. Choe, “Gen-lanenet: A generalized and scalable approach for 3d lane detection,” in Computer Vision - ECCV 2020 - 16th European Conference, 2020.
- [24] L. Chen, C. Sima, Y. Li, Z. Zheng, J. Xu, X. Geng, H. Li, C. He, J. Shi, Y. Qiao, and J. Yan, “Persformer: 3d lane detection via perspective transformer and the openlane benchmark,” in European Conference on Computer Vision (ECCV), 2022.