Design and characterization of AmLi neutron sources for the LZ experiment
Abstract
In this paper we describe the development, testing, and characterization of three low-emission rate AmLi neutron sources. The sources are used to calibrate the nuclear recoil response of the LUX-ZEPLIN (LZ) dark matter experiment. The sources’ neutron emission rate was measured using 3He proportional tubes. The sources’ gamma emissions were characterized using a high-purity germanium (HPGe) detector. Source-validated Geant4 Monte Carlo simulations allowed to calibrate the Ge and neutron detectors’ responses.
1 Introduction
Neutron sources are widely used in various medical, industrial, and basic research applications. AmBe and 252Cf neutron sources are probably the most common. These two source types are based on either (, n) nuclear reactions or spontaneous fission. The former type is a binary system, containing an -emitter as the driver and some low Z-material (Z denotes the atomic number) as the target for the intended reaction that results in the emission of neutrons after the formation of an excited compound nucleus. This paper describes the design, fabrication, and characterization of such a nuclear reaction based compound source using a mixture of americium and lithium. These AmLi neutron sources were developed for calibration of the LUX-ZEPLIN (LZ) [1] detector, searching for dark matter.
The LZ experiment uses 10 tonnes of xenon and a dual phase time projection chamber (TPC) to search for elastic scattering of Weakly Interacting Massive Particles (WIMPs) off xenon nuclei. The experimental signature of a WIMP interaction is the creation of scintillation light and ionization electrons in a particular proportion due to a recoiling xenon nucleus. The purpose of neutron sources is to calibrate the LZ detector response to nuclear recoils, in order to suppress the dominant background, which is due to electron recoils. Such background events yield different amounts of scintillation light and ionization electrons. Neutron source data helps reconstruct the recoil energy which, in turn, is related to the WIMP mass. More information on the LZ experiment can be found in [1].
Low energy neutrons, with kinetic energies below 1.5 MeV, are well suited to calibrate the nuclear recoil (NR) energy response of xenon detectors. Events induced by low energy neutrons closely resemble the NR response to WIMP particles in the relevant energy range [2]. Such neutron source should emit as little -radiation as possible to limit unwanted background events in the calibration data. The development of the sources described in this paper paid particular attention to the suppression and quantification of source-related -radiation.
Based on these considerations, the choice fell on AmLi compound sources. This system emits neutrons with a maximum energy of 1.5 MeV; in particular, the NR endpoint energy of about 40 keV corresponds to the 1.5 MeV neutron energy endpoint provides an NR calibration point near the top of the LZ WIMP energy search window. Moreover, unlike 252Cf and AmBe sources, neutrons emitted by the AmLi system are not accompanied by reaction-correlated high-energy gammas. This absence of reaction-correlated gammas results in a sample of nuclear recoil events with relatively little electron recoil background. However, the reaction neutrons are superimposed to the -radiation emitted in the 241Am -decay. This source of background was carefully studied.
To the best of our knowledge, there are no current manufacturers of AmLi sources, and extant sources we have access to have neutron emission rates at the level of tens of kHz, far too high to be feasible for use in the LZ experiment. Such low-yield sources had to be developed and manufactured in our lab. In this paper, we describe the design, fabrication, testing, and characterization of the three AmLi sources to be used for LZ calibration purposes.
2 Design and manufacture
The design of the AmLi sources was carried out with four goals in mind. First, fabrication and use of the sources would be safe to personnel following reasonable procedures for radiation safety. Second, in order to not overload the LZ data acquisition system (DAQ) system, sources with a combined neutron emission rate of order 100 n/s, when deployed simultaneously, were targeted, so that large calibration data sets could be acquired on the order of a day. Third, the AmLi sources need to be clean in that the neutron emission spectra would not contain any contributions from (, n) interactions on beryllium, carbon, and oxygen, that might be present as contamination, as sometimes observed in commercial neutron sources [3]. Fourth, the copious gamma emission following 241Am -decay, especially at 59 keV, would be sufficiently attenuated to avoid pile–up effects and unwanted source-related -events.
AmLi is an (, n)-type source. Alphas from 241Am decay bombard the 7Li nuclei. In a few cases, this leads to a nuclear reaction of type 7Li11B*. The excited 11B nucleus then decays to 10B via neutron emission. Two thresholds have been observed for the (, n) reaction in AmLi : (i) at 4.379 MeV where the interaction leaves the 10B nucleus in its ground state and (ii) at 5.51 MeV where the interaction leaves the 10B nucleus at an excited state of 720 keV [4, 5]. However, the production of neutrons through the latter is negligible because only of the 241Am alphas have an energy of more than 5.51 MeV, even if they manage to reach a 7Li nucleus without losing any energy in the source matrix material. The main contribution is from the former production channel as it results from the most abundant 241Am alphas with 5.486 MeV with a branching ratio of 85%. These alphas need to reach the 7Li target without losing more than 1 MeV of kinetic energy. Due to these kinematics, the neutron production varies considerably among different AmLi sources because of the dependence of the average -energy loss on the source geometry, encapsulation and shielding, degree of proximity of 241Am atoms to 7Li atoms achieved in mixing the americium and lithium materials, and presence of the impurities [6].
Prior to embarking on the fabrication of AmLi sources, two prototypes were fabricated to gain experience in building such sources and to provide test beds for evaluating the efficacy of further shielding to absorb the copious 241Am gammas. The prototypes were sealed in stainless steel capsules with 1-mm wall thickness. The 241Am activities and neutron emission rates were measured for these prototypes resulting in an average yield of .
241Am Deposition
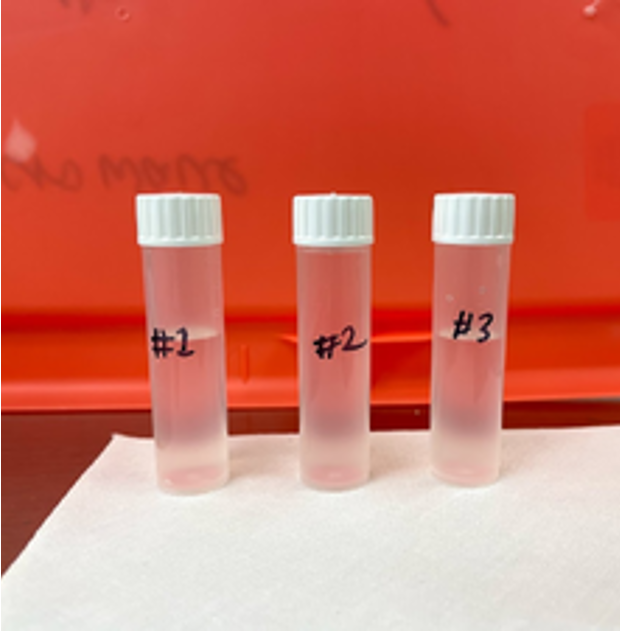
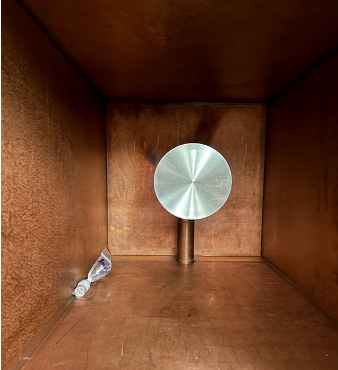
Commercially available AmLi sources typically contain rather high 241Am activities. The LZ DAQ [7], which is designed with the goal of saving maximal information for each triggered event, cannot handle high event rates exceeding approximately 1000 events/s. Furthermore, since the commercial vendors often use the same facility to build different (, n) sources, impurities might be included [3]. Hence, three sources were built at the University of Alabama (UA) as per LZ requirements. The 241Am was obtained from Eckert and Ziegler in the form of in 1 molar (M) nitric acid solution, shown in figure 1.
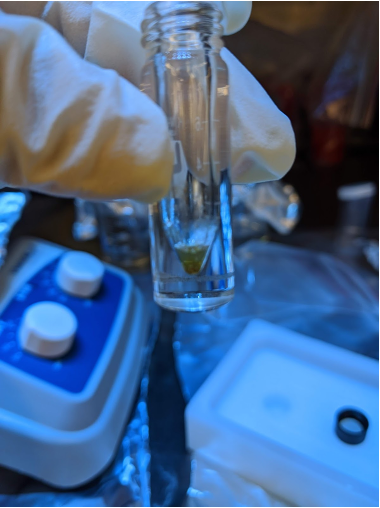
After slowly evaporating 1 mL of the manufacturer’s solution to near dryness and then reconstituting with 50 L of 1 M nitric acid, the solution was deposited centrally on a gold foil of 0.1 mm thickness using a micro-liter syringe. The certificate of analysis for the gold foil specifies the purity of the gold foil to be better than 99.999%. The only detected impurity is Ag, which is reported with a concentration of 1.8 ppm. L drops were deposited at a time on the gold foil until all the solution had been used up. The gold foil holder was placed on a hotplate inside a fume-hood and heated to evaporate the nitric acid solvent. The amount of 241Am deposited on the gold foil and not lost with the vapor during concentration and deposition, was estimated by counting the radiation emitted in the form of 59 keV gammas from 241Am decay. More than 90% of the 241Am was transferred to the gold foil in this process.
In the next step, the 241Am deposited gold foil was wrapped in a lithium foil. The task was carried out inside a glove box under an argon atmosphere to prevent the Li foil from oxidizing. The Li foil has a thickness of 0.75 mm. According to the certificate of analysis of the Li foil, it contains 99.9% Li with some alkaline metals and nitrogen impurities. The gold foil was laid on top of the lithium foil with the deposition side down, and then the combination was folded up ensuring good contact between them. This Au-Am-Li sandwich constitutes the matrix of the AmLi source.
Encapsulation of the source
The encapsulation of the sources serves two purposes. The first and more important is to ensure the source is safe to transport and handle following prescribed and accepted procedures. The encapsulation provides the barrier against the release of 241Am radioactivity into the environment. The second purpose is to absorb as much gamma radiation as feasible from the source while at the same time not significantly affecting the neutron emission rate and energy spectrum. The outside dimensions of the sources were developed based on the geometrical and mass requirements defined by the LZ source deployment system.
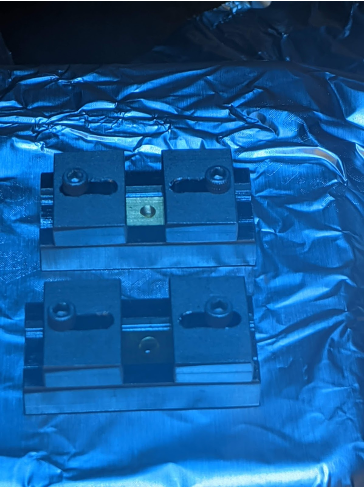
The encapsulation consists of three nested metal capsules. The inner two are made of tungsten alloy (Midwest Tungsten Service MT-185), and the outer one is made of series 304 stainless steel (SS). Each capsule is independently plugged and sealed. The inner capsule is closed by a press-fit plug and sealed with an acid-resistant epoxy (EP21ARHT from Masterbond), the middle capsule is closed by a threaded plug and sealed with the acid-resistant epoxy, and the outer capsule is closed by a press-fit plug and sealed by welding. The dimensions of each capsule were chosen so that nesting was as tight as possible, allowing for machining tolerances and avoiding undue thermal stresses between capsules over the temperature range from -50 °C to 204 °C, which is the epoxy seal working range for the inner two capsules.
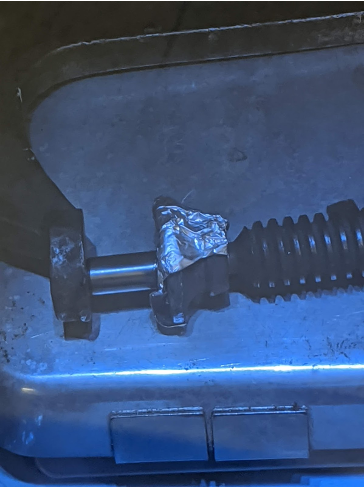
To ensure that the internal temperature of the sources wouldn’t exceed the working range of the epoxy during welding, careful testing was performed ahead of conducting the work. To achieve low internal temperatures, TIG (tungsten inert gas) welding was performed around the plug-body interface, a fraction of the arc at a time, followed by a cooling period. Furthermore, the source bottom was placed into a heat sink during welding. The heat sink was coupled to a water bath. The suitability of this technique was tested before attempting to weld the high-activity sources using 8 outer source capsules, containing different temperature-sensing crayons (Tempilstik from Markal) instead of the tungsten bottles. The correctness of the melting temperature, stated by the manufacturer, was verified by means of putting crayon samples on a heating plate, equipped with a temperature probe. The melting points of the crayons used during our welding tests ranged from 163 °C to 260 °C. The mock capsules were welded, following the procedure described above, and then cut open. None of the crayons was found to have melted, demonstrating that the internal temperature of the SS capsules was below 163 °C. This value is within the operating range of the epoxy used. After completion of the welding, the weldments were required to pass a dye penetration test.
Furthermore, to test the integrity of the design, two prototypes containing approximately 5 Ci (185 kBq) of 241Am were subjected to thermal, vibration, pressure, impact, and puncture tests following guidance for neutron calibration sources from the International Organization for Standardization (ISO)-2919 standard [8] and then leak tested using the hot-acid method prescribed in the ISO-9978 standard [9]. The activity found in the soaking liquid was consistent with the background.
3 Leak testing of the AmLi sources
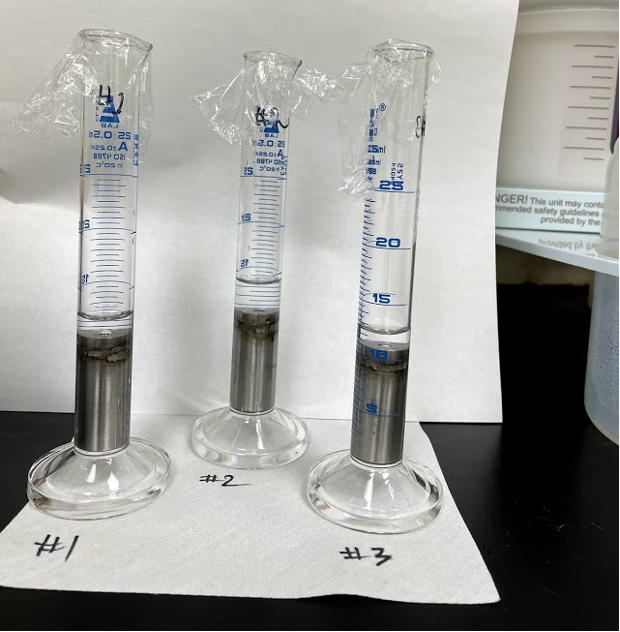
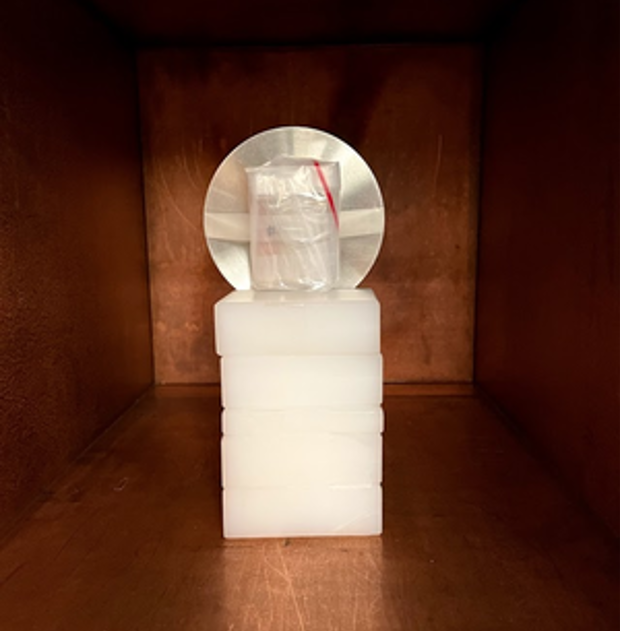
Source integrity is of paramount importance during the calibration of ultra-low background experiments. Hence, the completed AmLi sources underwent acid immersion and water pressurisation leakage testing as per the ISO-9978 standard. In order to perform the leak test, the sources were individually submerged in 7.5 ml of 1 M nitric acid for 24 hours. The soak acid was collected in small polyethylene (PE) vials, as shown in figure 2, and counted using the GeIII, a low background radiation detection setup operated by our group. of the entire soak acid was transferred to the PE counting vials.
Any leak of 241Am out of the capsule would be dissolved in the nitric acid (the original source solvent) and then be detected via the 59 keV full absorption peak in the GeIII -ray spectrum. No discernible 59 keV peak was observed. In order to perform a one-dimensional peak search in the resulting energy spectrum, the centroid and width of the hypothetical 59 keV peak were fixed to values derived from a direct calibration. To pinpoint the 59 keV peak parameters in terms of the ADC channel, an AmBe source was counted with GeIII. This AmBe source contains no gamma shielding, so the 59 keV peak could be observed with high statistics. Fit results from calibration were used to fix the peak nuisance parameters in the leak test data. This approach was used to put a limit on the 241Am activity, as shown at the bottom of figure 3. No statistically significant excess of peak events over a counting blank, consisting of acid-filled vials not used in the soak, was observed.
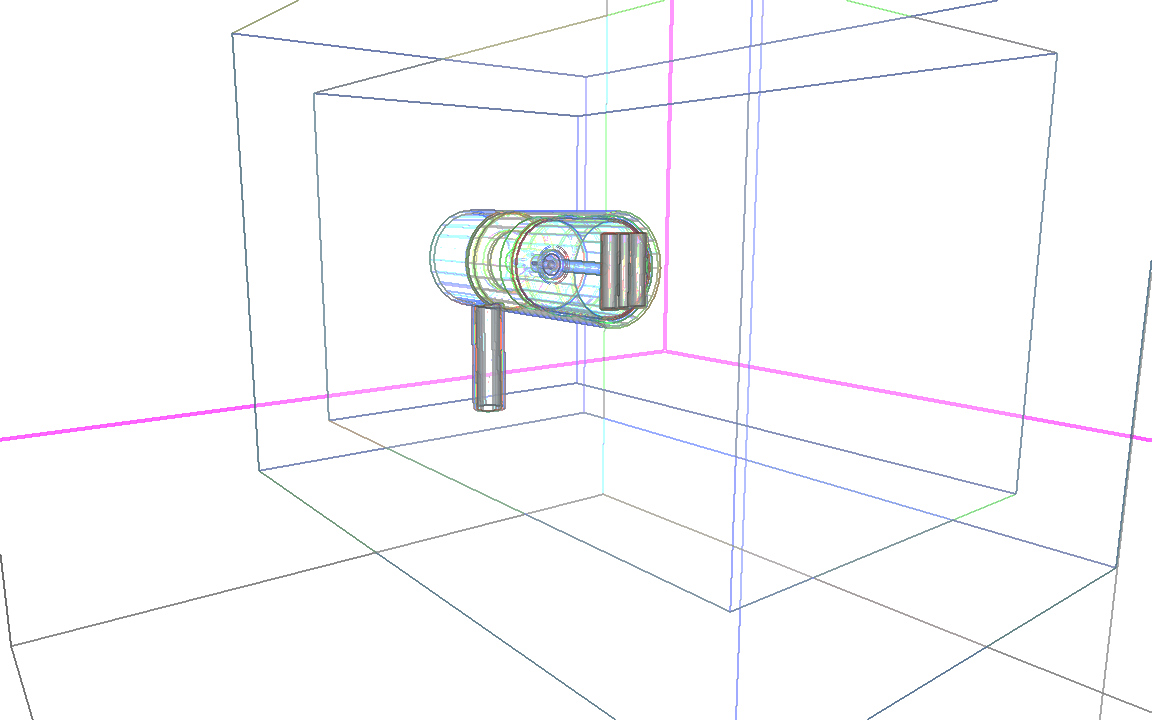
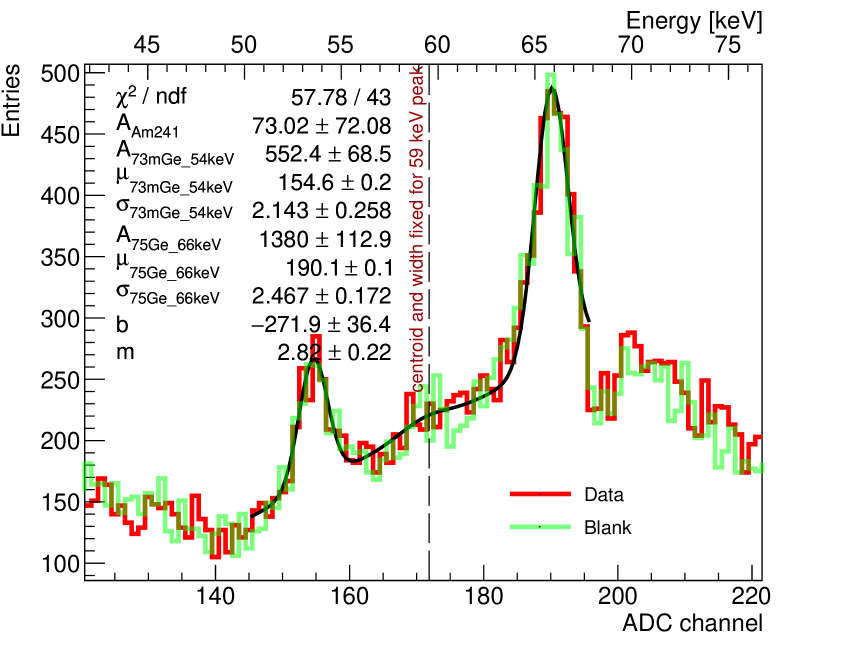
The detection efficiency of the used Ge detector was estimated by means of a Geant4 Monte Carlo simulation, as described in [10] (shown in the top of figure 3). 59 keV gammas were simulated originating from the liquid occupying the volume of the three vials. The simulated GeIII detector response was fitted with a Gaussian response, superimposed to a linear background. From this, the detection efficiency was estimated to be 0.0681 0.0003stat 0.0050syst per primary gamma emitted. The systematic error estimation, done with 46 keV -radiation from 210Pb, was taken from [10]. Furthermore, a blank sample was made from soaking two mock capsules which had not been exposed to 241Am but were handled in the lab the same way the source capsules had. A third vial was filled with acid, handled the same way as the others but not containing a metal capsule and added to the suite of counting vials. The counting result from the soak data and the blank sample is shown at the bottom of Figure 3. The sample and blank were both counted for 12.6 days. The agreement between the spectra indicates no 241Am is present in the soak acid. Subtracting the blank rate from the soak data count rate, dividing by the detection efficiency, and dividing by the appropriate branching ratio, a limit was placed on the 241Am activity in the acid. Accounting for the fact that only of the soak acid was collected, the final activity limit set on the soak acid from all three sources was mBq at confidence level using the Feldman Cousins method [11]. When taken relative to the 241Am activity contained in all three sources (discussed in the next section) this limit corresponds to a leakage fraction of of the contained activity; a strong constraint indeed.
For the water pressurisation leakage test, all three sources were accurately weighed after cleaning their surfaces with methanol and acetone. They were submerged in de-ionized (DI) water in open beakers. These beakers were then placed into a pressure vessel and subjected to an air pressure of 3.9 atm (57.3 psi gauge pressure). The vessel was sealed and left pressurized for about 18 hours- at the end of that period, the pressure was dropped to 2.8 atm. Next, the sources were recovered, wiped, and rinsed with methanol and acetone to remove any remaining water. The sources were weighed again and were found mg lighter than their initial mass. The pressure test indicates that there were no detectable water leaks into the capsules. We interpreted this observation to mean that there are no penetrations through the welds.
4 Source activity
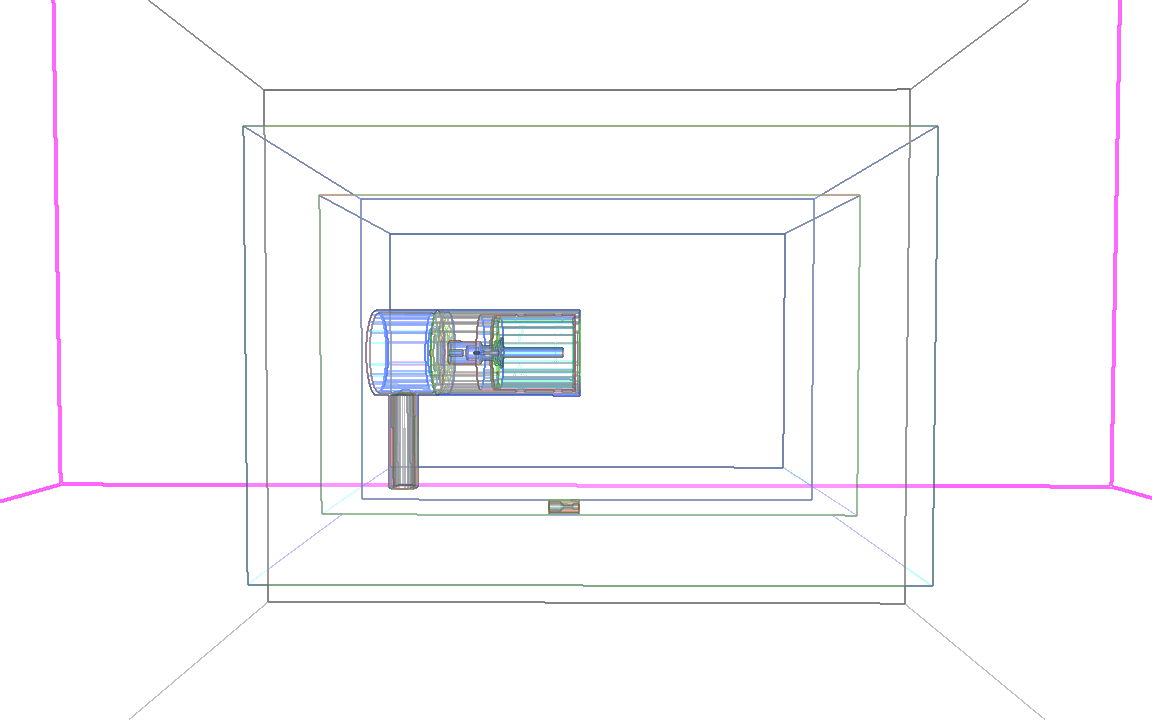
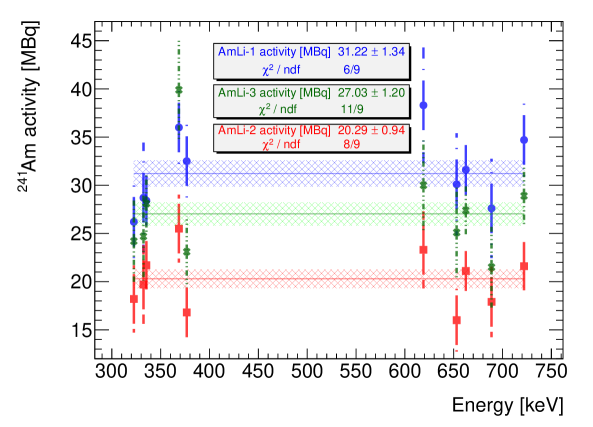
The 241Am activity contained in each of the three sources was determined to quantify the -ray induced background as well as their -ray to neutron emissivity ratio. To obtain the 241Am quantity contained in the sources, ten high energy -quanta co-emitted in the 241Am -decay were measured with the GeIII setup. Unlike the low energy 59 keV -radiation which is significantly suppressed by the tungsten encapsulations of the source, these penetrating high energy gammas have enough statistics to be detected with our counting setup. The amount of 241Am in the source matrix is then estimated from the peak integral returned from the fit result divided by the corresponding branching ratios and detection efficiencies derived from Monte Carlo simulation in Geant4 as shown in figure 4 (right). For each source, the ten peak-wise activities were then fitted with a constant to get the source activity as shown in figure 5. A systematic uncertainty of 6% was added quadratically to the statistical uncertainty of each peak to get an acceptable chi-square value. We interpret this as an independent evaluation of the systematic uncertainty of the -ray detection efficiency correction. The estimated 241Am activities of the three sources, along with their -ray to neutron emission ratio, are summarized in table 4.
5 Source – ray emission rate and spectrum
To allow LZ to estimate the -ray induced background of the AmLi neutron sources during calibration, we measured the gammas emerging from all three sources individually with GeIII. A simulation model was validated by comparing the simulated to the measured energy spectrum seen by the detector. This model is then used to determine the gamma-ray emission rate from the sources.
Gamma model development
Almost all of the gammas emitted from the source are from the 241Am decay. 241Am -decays to various excited states of 237Np. According to the National Nuclear Data Center [12], 75.449% of these decays produce X-rays and -radiation. However, of these gammas have an energy of keV or less, whose characteristic attenuation length in tungsten is 0.15 mm [13]. By design, the tungsten wall thickness of the inner and middle capsule combined is at least 4 mm, resulting in a mass attenuation factor of or more. Hence, only the other of the gammas with energy greater than keV were simulated to save computational time. In addition to these gammas, another contribution comes from 7Li()7Li∗ inelastic scattering that leaves the 7Li nucleus in its first excited state, which decays via the emission of a 478 keV photon [14]. Further -radiation with 312 keV comes from the 241Am progeny 233Pa decaying to an excited state of 233U. Two corresponding effective branching ratios were deduced from the AmLi source spectrum measurement and added to the existing list of branching ratios. This modified spectrum, dubbed as the AmLi gamma model, serves as the MC simulation’s primary generator.
Validation of the gamma model
The AmLi source spectrum observed by the germanium detector is composed of primary and Compton scattered -radiation. The task is to unfold the detector response and scattering contribution from the data to obtain the emergent -spectrum as emitted by the sources. This is done by means of a Geant4 [15] Monte Carlo simulation. The primary photons are simulated, the radiation transported through the source geometry and the detector response modelled. A picture of the simulated geometry is shown earlier in the paper in figure 4, a close-up view of the source at “remote location” is shown in figure 7 (left). The source and detector model is validated by comparing the measured and simulated energy distributions, as shown in figure 6.
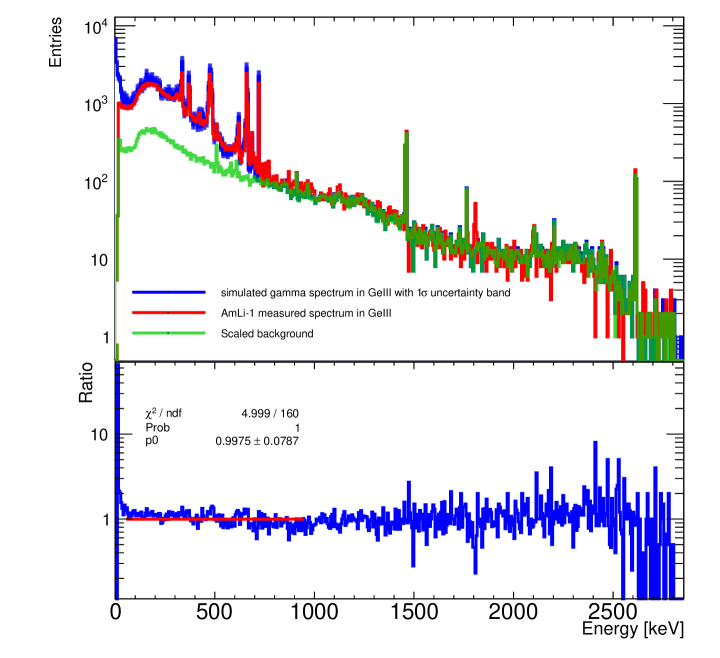
The peaks at 312 and 478 keV have been added, as explained above. The primary 241Am gamma spectrum was generated using single gammas and statistically sampling all known branching fractions, as given by [12]. As can be seen in the top part of figure 6, the simulated (blue) and measured (red) distributions agree over the entire energy range. The appropriately scaled detector background spectrum (green) was added to the simulation. The lower part of figure 6 shows the ratio of simulated divided by observed spectrum. There is no obvious energy bias. The fit to a constant yields .
The so-verified source -ray emission model is shown in figure 7 (right). It was obtained by recording the frequency distribution of simulated photons at the outer surface of each AmLi source. We call this the emergent -spectrum.
The source -ray emission rate is determined from the knowledge of the number of simulated primary gammas and counting the number of gammas crossing the outer surface of the source encapsulation. The ratio of these two numbers is multiplied by the source activity to obtain the emergent gamma emission rate of each source. The individual gamma emission rates of all three sources are tabulated in table 4.
Although not prominent in the AmLi-1 -spectrum, a peak was observed at 871 keV for the AmLi-2 and AmLi-3 sources. The reaction 7N(,p)17O*, indicating the presence of a nitrogen contamination in AmLi-2 and AmLi-3, offers a plausible explanation of this observation [16].
High energy gamma search
Previous publications on AmLi sources [3] identified unwanted high-energy events, created by contamination of the source with beryllium, resulting in secondary nuclear reactions. A dedicated 0.19 day long GeIII detector run with reduced amplifier gain was performed to search for the 4.439 MeV -radiation emitted in the de-excitation of 12C after the reaction 9Be(, n)12C∗. No 4.439 MeV peak was observed, as shown in the figure 8. A Gaussian fit to the hypothetical peak, with the centroid and width fixed to values obtained from a calibration run with an AmBe calibration source, coupled with a Monte Carlo generated detection efficiency and a gamma to neutron ratio taken from [17], results in a limit of less than 3.4 AmBe neutrons/s emitted by all three AmLi sources.
6 Neutron emission rate measurement
Experimental setup
The neutron emission rates of the sources were measured using four 3He gas-filled proportional tube counters. The model RS P4-0813-101 3He tubes are from GE Reuter Stokes [18]. The 3He tube pulses were monitored using Precision Digital Technology (PDT) modules [19], one PDT-20A_HN module in combination with three PDT-10A_HN modules. The PDT-20A_HN contains an adjustable high-voltage generator, providing high voltage to all modules. All counters are placed in a stainless steel housing (SS304) and are suspended from a rail system into a water shielding tank. The rail-system allows the counters to be placed at different radial distances from the center of the water tank. At the center of the tank is a fixed stainless steel tube for neutron source deployment. For deployment, sources are attached to a stainless steel rod that can move them to six different depths inside the center tube air cavity. Water is used as a shield and for the moderation of the fast neutrons. The moderator enhances the neutron capture rate as the 3He thermal neutron absorption cross-section is 6000 times larger than that for fast neutrons [20]. The water tank has a diameter and a depth of about 1.5 m, each. The detector setup is shown in figure 9 (left).
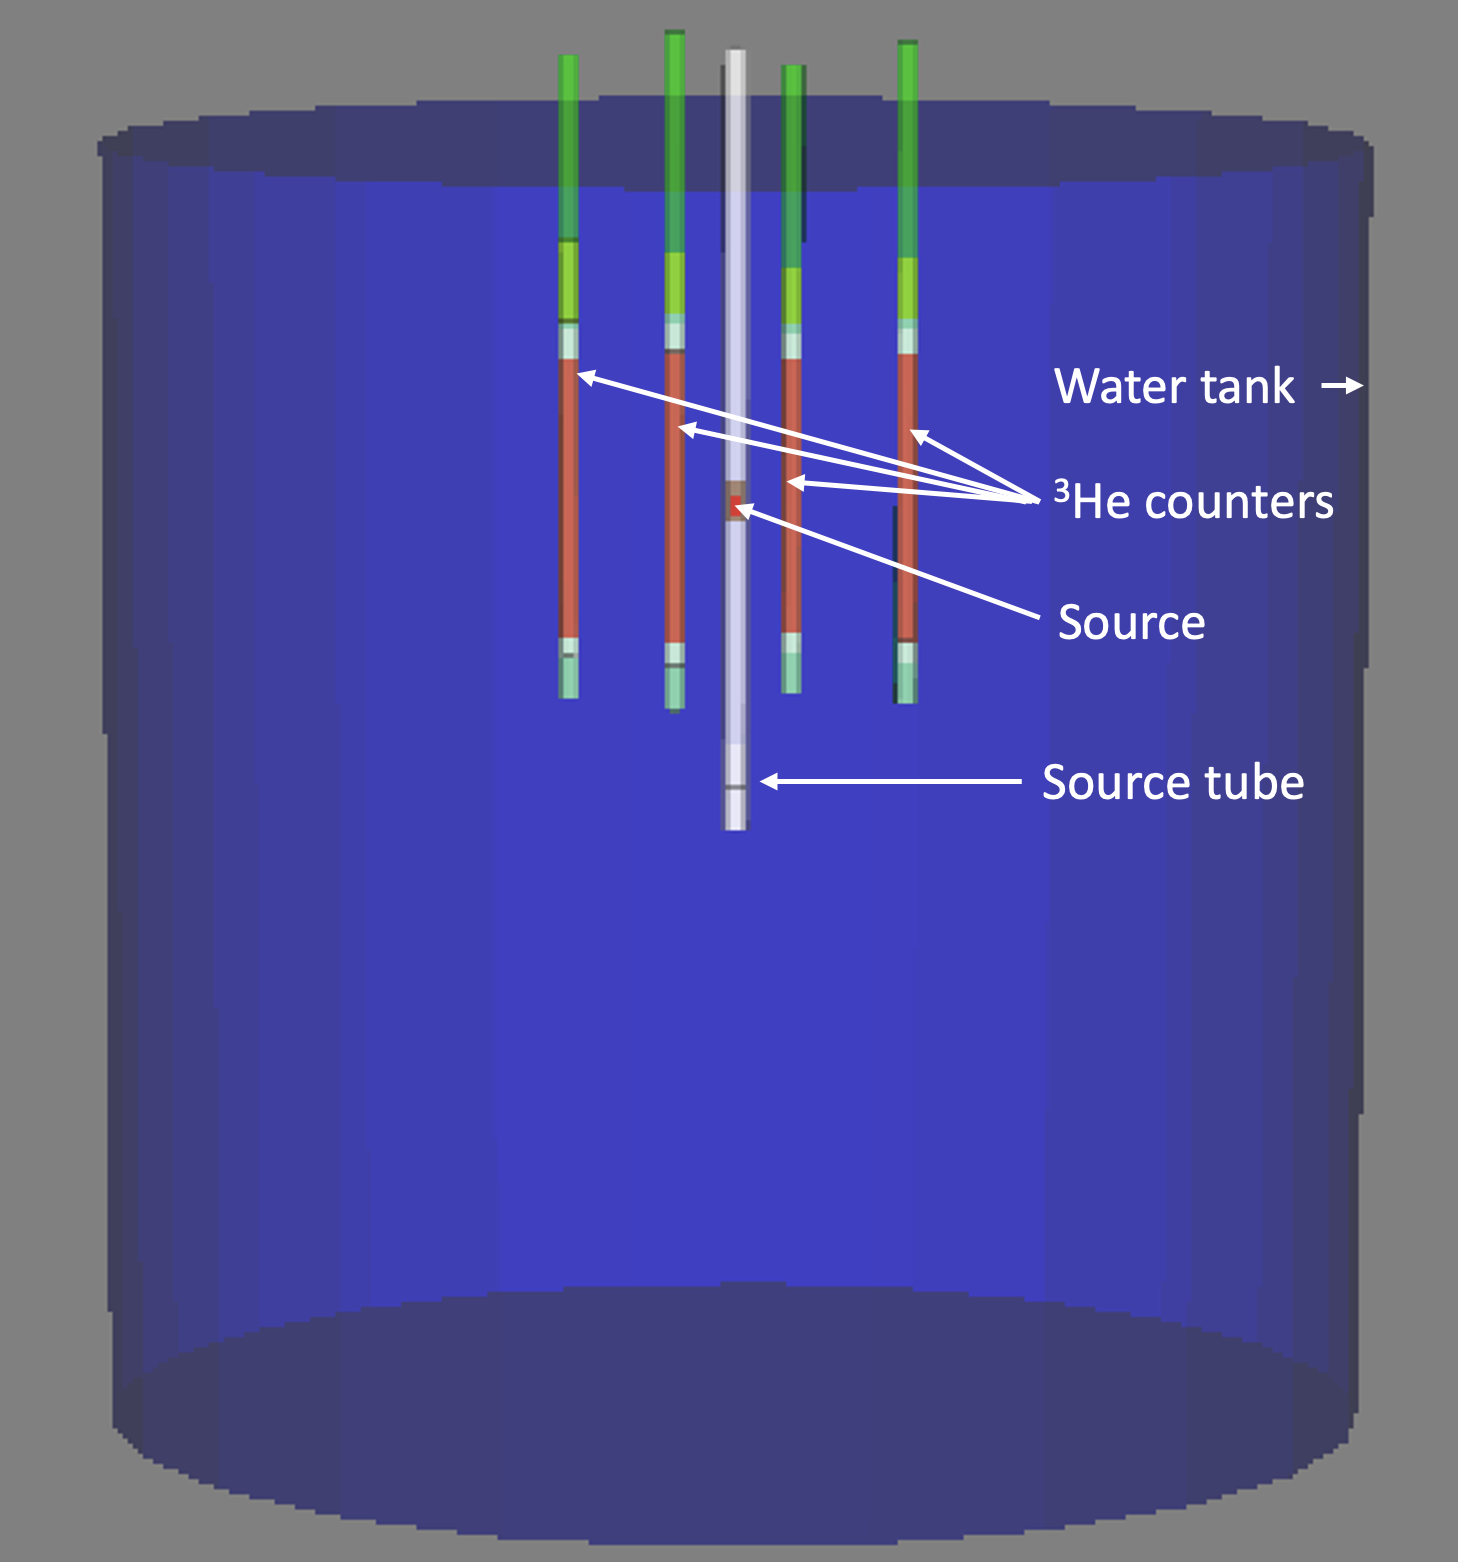
3He Geant4 simulation overview
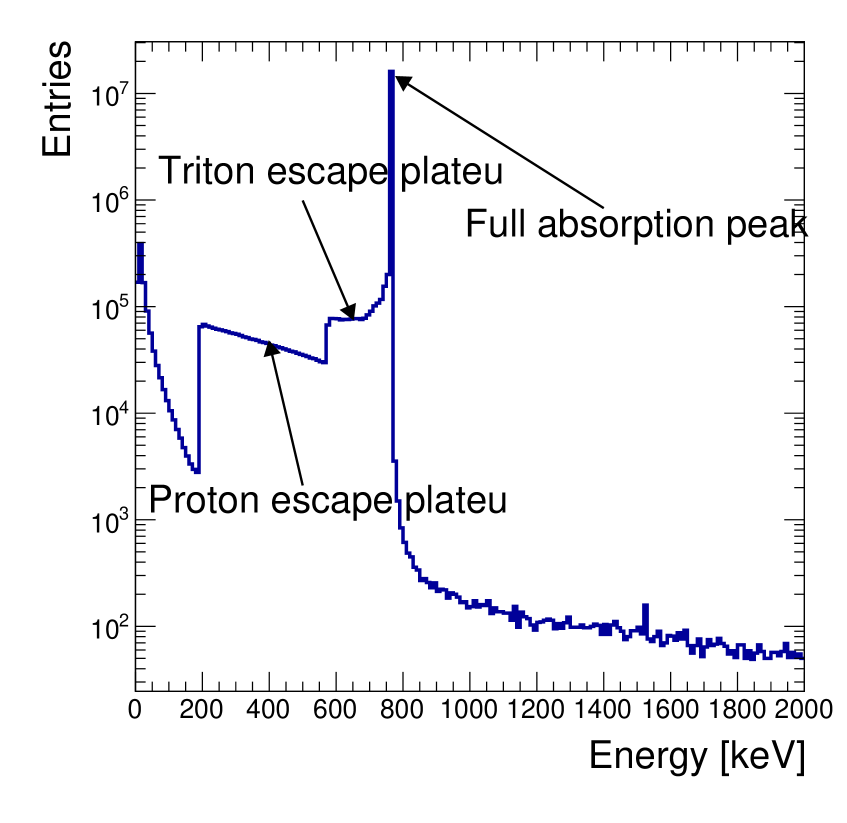
A response model of the setup was developed in Geant4 (version 4.10.4.p02). The geometry of the water, source, 3He tubes along with their electronic modules and their stainless steel housing was implemented. Technically complex components such as electronic modules were implemented using appropriate approximations. Figure 9 (right) shows the setup, as contained in the Geant4 simulation. The detectors and their holders were placed in cardinal directions with respect to the source at a distance that could be varied in the simulation. The "G4ThermalNeutron" and "QGSP_BIC_HP" physics lists were utilized, as recommended by Geant4 use cases. The energy deposition characteristics of the 3He counters’ sensitive volume were found to be consistent with that given in ref [21]. Figure 10 (left) shows the MC truth energy deposition spectrum of the 3He counters obtained by simulating an AmBe source. The peak at 764 keV corresponds to the absorption of the full kinetic energy of both proton and tritium, produced after neutron capture on 3He. The plateaus correspond to the escape of one of the reaction products from the 3He tube’s active region, leading to incomplete energy deposition. Note the effect of the detector resolution on the spectrum, shown in the figure 10 (right).
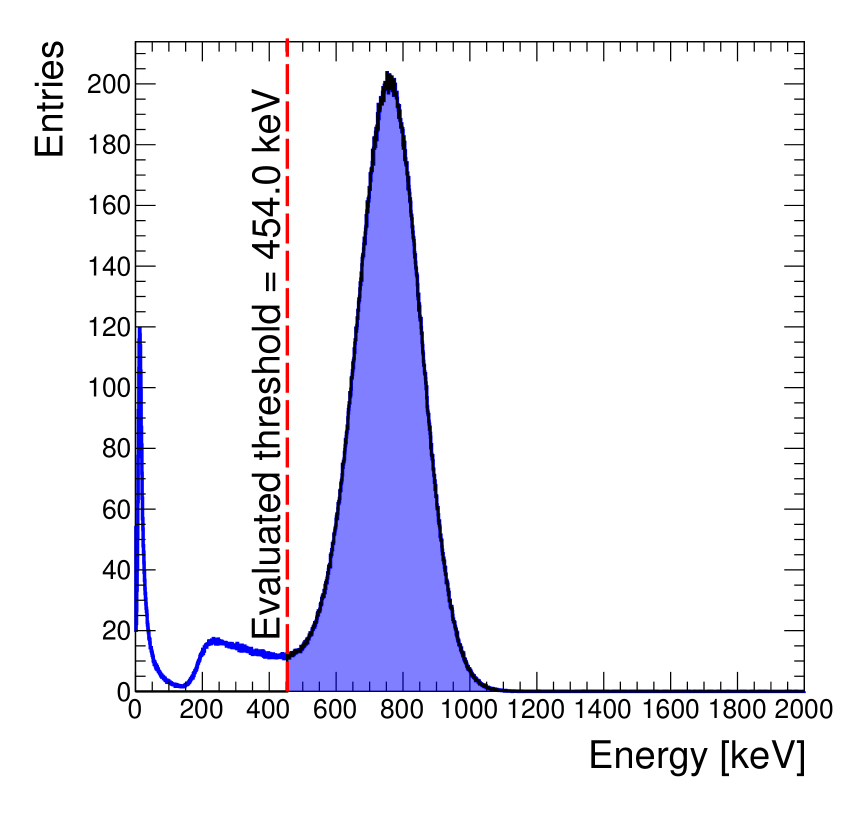
The manufacturer recommends a 10-12% energy resolution for counters of this type [18]. The used signal readout does not allow the digitization of pulse amplitudes. The energy response of the detectors had to be modeled using the manufacturer’s recommendation. To account for this uncertainty, the change of the calculated detection efficiency under a variation of the resolution enters into the systematic error estimate.
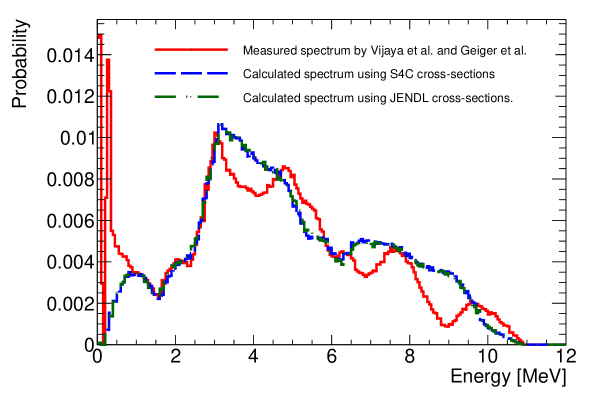
A comparison of measurement and simulation of a well-characterized AmBe source served to verify the overall correctness of the simulation code. A comparison of measured and calculated neutron event rates, induced by a neutron emission rate-calibrated AmBe source was used to determine the detector thresholds. To estimate the impact the unobserved source spectrum has on the threshold determination, calculations were performed with several plausible choices. The differences were included in the systematic uncertainty. One realization of the AmBe source neutron spectrum was generated by sampling the energy distributions given in references [22, 23]. Two more plausible choices were obtained using the SOURCES-4C (S4C) code [24]. One utilized the native cross sections of the code, the other was based on modified cross sections, taken from the JENDL-2005/AN database [25]. A comparison of the resulting AmBe neutron spectra is depicted in figure 11.
Detector calibration and MC simulation tuning
An AmBe source with a known neutron emission rate of 488 10 neutrons/s, measured by NIST, was used to calibrate the detectors and tune the Monte Carlo simulation. The AmBe source-related counting rate was measured by means of a scaler, with the individual counter voltages set such as to achieve operation in the plateau region.
The detection thresholds of the counters were determined by comparing the measured rates to those derived from the simulation, normalized by the known neutron emission rate of the AmBe source (shown in figure 10 (right)). During this procedure, the AmBe source normalization was numerically varied within its uncertainty. The effect of the source rate uncertainty on the calculated thresholds was found to be less than a percent. On top of that, the detector resolution was also varied between 5 to 15% to investigate the uncertainty it imposes on the calculated thresholds. This was also found to be less than a percent.
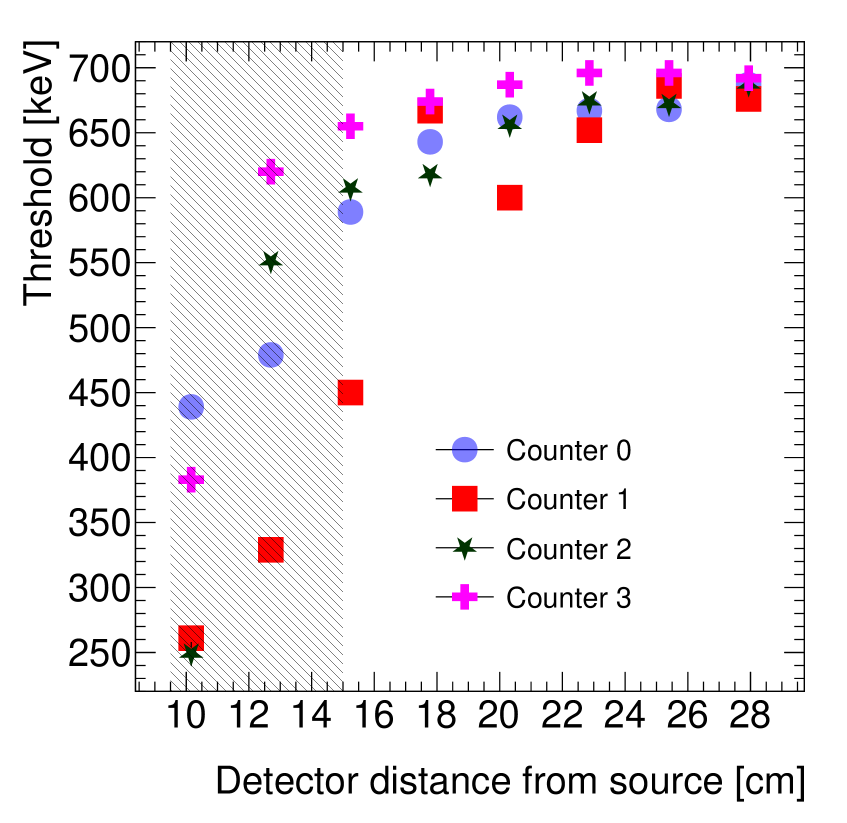
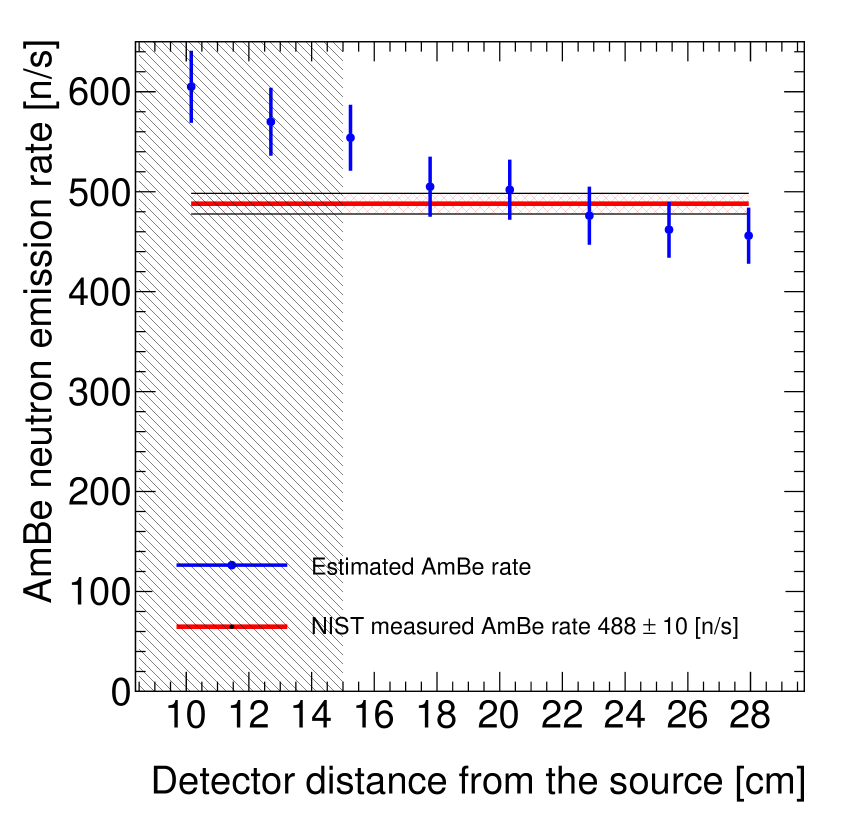
To understand how uncertainties in geometrical source placement impact the evaluation of the thresholds, AmBe measurements and simulations were performed for source-detector distances varying from 10 cm to 30 cm. As can be seen in figure 12 (left), this variation does impact the threshold evaluation significantly. The so-derived threshold estimates are observed to stabilize for source-detector distances in excess of 15.2 cm. Since thresholds are an intrinsic property of the detectors, we attribute the distance dependence seen in figure 12 (left) to indicate imperfections in the treatment of thermal and epithermal neutrons, as discussed in [26, 27]. As a consequence, the thresholds were determined by averaging for distances of 15.2 cm or more. All measurements with the AmLi sources were performed at source-detector distances of 15.2 cm or more. The detector-averaged measurement-derived AmBe source neutron emission rates obtained by applying the average thresholds are shown in figure 12 (right) together with the known source activity and its error band.
The variation in the detection thresholds of the setup, resulting from simulating different AmBe neutron spectra was found to be less than 0.5%. The various systematic uncertainties, described above, are all summarized in the thresholds uncertainties. The detection thresholds and their uncertainties are shown in table 1. The threshold uncertainties were determined by simultaneous variation of all uncertainty components to obtain a single value. Note that the resulting error found this way is smaller than the quadratic sum of its components, indicating the presence of anti-correlation.
| Counter 0 | Counter 1 | Counter 2 | Counter 3 | |
| Thresholds [keV] | 663 2 | 665 2 | 661 5 | 682 2 |
Using the tuned simulation, a summed AmBe source neutron detection efficiency was determined for all 3He detectors for various source-counter distances. The uncertainty of the efficiency was calculated using the method defined in [28]. The 6 AmBe neutron rate measurements, taken at distances of 15.2 cm or more (see figure 12), are combined into a single systematic uncertainty by means of a statistic:
| (6.1) |
where is the neutron emission rate at location , denotes the known neutron emission rate, stands for the uncertainty of , is the uncertainty of . is taken to be the systematic uncertainty of the model. Assuming a 6% model uncertainty, we achieve a /ndf value of 6.14/6. This simulation model uncertainty serves as a comparison standard for a similar quantity determined for the AmLi measurements described below.
AmLi neutron emission rate
Using the same procedure described above, the neutron emission rates of all three AmLi sources were measured. The AmLi source measurements utilized the system of detector-thresholds derived from the AmBe source runs. Again only measurements taken at source-detector distances of 15.2 cm or more were considered.
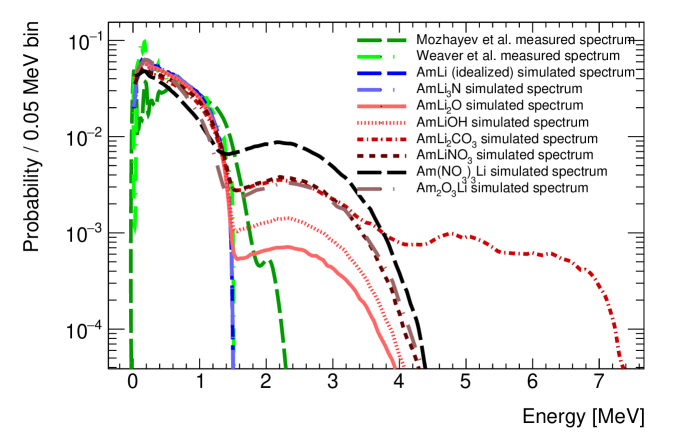
As in the case of the AmBe source, the spectrum of the neutrons emitted by the AmLi sources is not known. Plausible AmLi energy spectra were taken from the literature [29, 3] or derived from the GEANT4 package SaG4n [30, 31]. However, SaG4n does not allow the implementation of complex geometries; hence neutron transport through the source encapsulations for the various spectra was performed in Geant4 with the “ShieldingLEND” physics list. In addition, the chemical form of the 241Am deposit and of the 7Li foils after the deposition are not known. To encompass all plausible source compounds (due to chemical impurities contained in the source), the following AmLi source compositions were simulated- Am-Li, Am(NO3)3-Li, Am2O3-Li, Am-Li3N, Am-LiOH, Am-Li2O or Am-Li2CO3 [32, 33]. These composition-induced differences in the neutron energy distributions are shown in figure 13. The resulting differences in the neutron detection efficiency and with it the neutron emission rate are interpreted as an additional systematic uncertainty. As evident from figure 13, the presence of americium or lithium compounds would result in a high-energy tail. Preliminary analyses from LZ indicate the potential presence of such a tail in data taken with the AmLi sources. Investigation of these events is ongoing, as is the elemental abundance of the compounds in figure 13.
To explore the impact of source-distance variation on the neutron rate measurement, the neutron emission rate of one source, AmLi-1, was measured in detail at 5 different distances. The other two sources were measured at 4 distances. Since the neutron emission rate should not depend on the detector configuration, we interpret the standard deviation of these measured rates as a systematic uncertainty. A variability of about 5% was found this way. This spatially dependent uncertainty is similar to the 6% model uncertainty found for the AmBe source. Table 2 shows the observed rates for AmLi-1. The weighted average of these rates serves as a measure for the neutron emission rate of the source. All systematic uncertainties and their quadratic sum are listed in table 3. The neutron emission rates of all three AmLi sources along with our uncertainty estimate, are given in table 4.
| AmLi-1 | ||||
|---|---|---|---|---|
| Detector Position [cm] | Background subtracted rate [Hz] | MC Efficiency | Neutron emission rate [Hz] | Weighted average |
| 15.2 | 0.523 0.002 | 0.02871 0.00012 | 18.2 0.1 | 18.3 0.1 |
| 17.8 | 0.259 0.002 | 0.01401 0.00008 | 18.5 0.2 | |
| 20.3 | 0.116 0.002 | 0.00655 0.00003 | 17.8 0.3 | |
| 22.9 | 0.058 0.001 | 0.00304 0.00002 | 19.0 0.5 | |
| 25.4 | 0.032 0.001 | 0.00139 0.00001 | 23.0 1.1 | |
| Uncertainty Name | Uncertainty Value [] |
|---|---|
| Detection threshold (contains AmBe source rate uncertainty, unknown AmBe spectrum, detector resolution uncertainty) | 0.8 |
| Detector placement | 6.1 |
| Source placement | 0.5 |
| AmLi input spectra | 2.2 |
| AmLi rate spatial variability | 5.2 |
| Summed systematic error [excluding detection threshold] | 8.3 |
Neutron yields of the sources
We call the number of neutrons emitted per 241Am alpha the neutron yield. Evaluation of this quantity allows comparison to other publications. Table 4 shows the yields of all three AmLi sources. They are found to be somewhat lower than 1.510-6 n/, reported in [3, 34]. The chosen sandwich geometry of our sources probably contributes here. Our simulation of an idealized source geometry, namely 241Am alphas impinging on a flat lithium foil in the absence of carbon and oxygen, results in a yield of (1.0 0.1) 10-6 n/, twice of what is observed for our sources. Simulations assuming the presence of Am2O3, Am(NO3)3 also show reduced n/ yields.
| Source | 241Am activity [MBq] | -emission rate [Hz] | Neutron emission rate [Hz] | to neutron ratio | Neutron yield [n/106 |
| AmLi-1 | 31.2 1.4 | 368 59 | 18 2 | 20 4 | 0.59 0.06 |
| AmLi-2 | 20.3 1.0 | 239 38 | 9 1 | 26 5 | 0.45 0.04 |
| AmLi-3 | 27.0 1.2 | 318 51 | 12 1 | 30 6 | 0.46 0.04 |
| Total | 79.0 2.0 | 925 87 | 39 3 |
7 Conclusion
The details of the development, testing, and characterization of three low-rate AmLi neutron sources, utilized for the calibration of the LZ dark matter experiment, are described. This includes pre-welding and quantitative leak test procedures, measurement of the 241Am activities, -ray emission rates and spectra, the determination of neutron emission rates, and the neutron yields. The neutron emission rates of the sources have been determined with uncertainties between 8 and 11%.
Acknowledgments
This project was conceived as a contribution to the LZ experiment. We would like to thank our LZ colleagues for their support and valuable insights. We acknowledge Jaclyn Schillinger’s contribution in the early stages of this project. This research was supported in part by the U.S. Department of Energy under DOE Grant DE-SC0012447 and by LZ project subcontract 7270503 from Lawrence Berkeley National Lab.
References
- [1] D. S. Akerib, C.W. Akerlof, D. Yu. Akimov, A. Alquahtani et al., The LUX-ZEPLIN (LZ) experiment, Nucl. Instrum. Meth. A 953 (2020) pg. 163047.
- [2] B. J. Mount, S. Hans, R. Rosero, M. Yeh et al., LUX-ZEPLIN (LZ) Technical Design Report, Report, LBNL-1007256, FERMILAB-TM-2653-AE-E-PPD(2017) pg. 369.
- [3] A. V. Mozhayev, M. E. Moore, E. K. Mace, Characterization of two extraordinary AmLi neutron sources, Appl. Radiat. Isot. 168 (2021) pg. 109472.
- [4] B. Hans, T. W. Bonner, Reactions , , and , Phys. Rev. 108 (1957) pg. 1025.
- [5] L. Van Der Zwan and K.W. Geiger, The 7Li(,n)10B differential cross section for -energies of up to 8 MeV, Nucl. Phys. A 180 (1972) pg. 615.
- [6] M. E. Moore, A. V. Mozhayev, R. S. Wittman, E. K. Mace, Configuration and impurity quantification of AmLi sources using radiography and gamma spectroscopy, Nucl. Instrum. Meth. A 990 (2021) pg. 164987.
- [7] E. Druszkiewicz, The Data Acquisition System for LZ, arXiv:1511.08385 (2015) .
- [8] International Organization for Standardization (2012), Radiological protection — Sealed radioactive sources — General requirements and classification, ISO2919:2012.
- [9] International Organization for Standardization (2012), Radiation protection — Sealed sources — Leakage test methods, ISO9978:2020.
- [10] R.H.M. Tsang, A. Piepke, D.J Auty, B. Cleveland et al., GEANT4 models of HPGe detectors for radioassay, Nucl. Instrum. Meth. A 935 (2019) pg. 75.
- [11] G. J. Feldman, R. D. Cousins, Unified approach to the classical statistical analysis of small signals, Phys. Rev. D 57 (1998) pg. 3873.
- [12] National Nuclear Data Center, NuDat (Nuclear Structure and Decay Data), Brookhaven National Laboratory (2022).
- [13] M.J. Berger, J. H. Hubbell, S.M. Seltzer, J. Chang, et al., XCOM: Photon Cross Section Database (version 1.5), National Institute of Standards and Technology Gaithersburg, MD. (2022).
- [14] C.W. Li, R. Sherr, Inelastic Scattering of Alpha Particles by Lithium, Phys. Rev. 96 (1954) pg. 389.
- [15] S. Agostinelli, J. Allison, K. Amako, J. Apostolakis et al., Geant4—a simulation toolkit, Nucl. Instrum. Meth. A 506 (2003) pg. 250.
- [16] A. Peurrung, R. Arthur, R. Elovich, B. Geelhood et al., The 871keV gamma ray from 17O and the identification of plutonium oxide, Nucl. Instrum. Meth. A 474 (2001) pg. 285.
- [17] Z. Liu, J. Chen, P. Zhu, Y. Li et al., The 4.438MeV gamma to neutron ratio for the Am–Be neutron source, Appl. Radiat. Isot. 65 (2007) pg. 1318.
- [18] Reuter-Stokes, 3He filled position sensitive proportional counter, Data Sheet: RS-P4-0424-201.
- [19] Precision Data Technology, Neutron pulse monitoring modules, Data Sheet: PDT10 & 20 Series.
- [20] P. M. Rinard, Neutron Interactions with Matter, Los Alamos Technical Report , U.S.A.(2009) pg. 368.
- [21] G. F. Knoll, Radiation detection and measurement (3rd edition), John Wiley & Sons, New York. (2000), [ISBN 978-0-471-07338-3, 978-0-471-07338-3].
- [22] A.D. Vijaya and A. Kumar, The neutron spectrum of Am-Be neutron sources, Nucl. Instrum. Meth. A 111 (1973) pg. 435.
- [23] K.W. Geiger and L. Van Der Zwan, Radioactive neutron source spectra from 9Be(, n) cross section data, Nucl. Instrum. Meth. A 131 (1975) pg. 315.
- [24] W. B. Wilson, R. T. Perry, E. F. Shores, W. S. Charlton et al., SOURCES 4C: a code for calculating (α,n), spontaneous fission, and delayed neutron sources and spectra, Report, LA-UR–02-1839, USA, (2002).
- [25] K. Shibata, O. Iwamoto, T. Nakagawa, N. Iwamoto et al., JENDL-4.0: A New Library for Nuclear Science and Engineering, J Nucl Sci Technol 48 (2011) pg. 1.
- [26] L. Thulliez, C. Jouanne, E. Dumonteil, Improvement of Geant4 Neutron-HP package: From methodology to evaluated nuclear data library, Nucl. Instrum. Meth. A 1027 (2022) pg. 166187.
- [27] K. Hartling, B. Ciungu, G. Li, G. Bentoumi et al., The effects of nuclear data library processing on Geant4 and MCNP simulations of the thermal neutron scattering law, Nucl. Instrum. Meth. A 891 (2018) pg. 25.
- [28] T. Ullrich, Z. Z. Xu, Treatment of Errors in Efficiency Calculations, arXiv: Data Analysis, Statistics and Probability (2007) .
- [29] D.R. Weaver, J.G. Owen, J. Walker, The neutron spectrum from a 5 Ci Am/Li neutron source, Nucl. Instrum. Meth. A 198 (1982) pg. 599.
- [30] V. Pesudo, E. Mendoza, V. Alcayne, D. Cano-Ott et al., SaG4n: Calculation of (,n) yields for low background experiments using Geant4, J. Phys. Conf 1468 (2020) pg. 012059.
- [31] E. Mendoza, D. Cano-Ott, P. Romojaro, V. Alcayne et al., Neutron production induced by -decay with Geant4, Nucl. Instrum. Meth. A 960 (2020) pg. 163659.
- [32] D. W. Jeppson, Interactions of liquid lithium with various atmospheres, concretes, and insulating materials; and filtration of lithium aerosols, Technical report, HEDL-TME-79-7 TRN: 79-018250, United States: N. p., 1979. Web, doi:10.2172/6122331.
- [33] T.H. Joshi, S. Sangiorgio, V. Mozin, E.B. Norman et al., Design and demonstration of a quasi-monoenergetic neutron source, Nucl Instrum Methods Phys Res B 333 (2014) pg. 6.
- [34] H. Tagziria, M. Looman, The ideal neutron energy spectrum of 241AmLi(,n)10B sources, Appl. Radiat. Isot. 70 (2012) pg. 2395.