DAHe white dwarfs from the DESI Survey
Abstract
A new class of white dwarfs, dubbed DAHe, that present Zeeman-split Balmer lines in emission has recently emerged. However, the physical origin of these emission lines remains unclear. We present here a sample of 21 newly identified DAHe systems and determine magnetic field strengths and (for a subset) periods which span the ranges of 6.5 – 147 MG and 0.4 – 36 h respectively. All but four of these systems were identified from the Dark Energy Spectroscopic Instrument (DESI) survey sample of more than 47 000 white dwarf candidates observed during its first year of observations. We present detailed analysis of the new DAHe WD J161634.36+541011.51 with a spin period of 95.3 min, which exhibits an anti-correlation between broadband flux and Balmer line strength that is typically observed for this class of systems. All DAHe systems cluster closely on the Gaia Hertzsprung-Russell diagram where they represent 1 per cent of white dwarfs within that region. This grouping further solidifies their unexplained emergence at relatively late cooling times and we discuss this in context of current formation theories. Nine of the new DAHe systems are identifiable from SDSS spectra of white dwarfs that had been previously classified as featureless DC-type systems. We suggest high , unbiased observations of DCs as a possible route for discovering additional DAHe systems.
keywords:
white dwarfs – magnetic fields – line: profiles – stars: individual: WD J161634.36+541011.51 – surveys1 Introduction
The study of magnetic fields and its effect on matter is important across scientific disciplines and their applications, such as magnetic resonance imaging in the field of medicine (Lauterbur, 1973). The highest continuous field strength generated in the laboratory is recorded at 0.455 MG (Hahn et al., 2019), but to investigate fields beyond this we must study and characterise astronomical sources. White dwarfs, the remnant cores left over from the stellar evolution of main sequence stars up to masses of 8 – 10 , have weaker fields than the more massive neutron stars (Truemper et al., 1978; Olausen & Kaspi, 2014), but are significantly easier to observe and characterise (for reviews, see Wickramasinghe & Ferrario 2000; Ferrario et al. 2020).
Since the discovery of the first magnetic white dwarf, Grw+70o8247, more than half a century ago (Kemp et al., 1970), several hundred systems are now known with fields in the range of 10-3 – 103 MG (Külebi et al., 2009; Ferrario et al., 2015; Bagnulo & Landstreet, 2022). These white dwarfs have been predominantly identified by the Zeeman-splitting of spectroscopic absorption features (Preston, 1970; Angel et al., 1974; Schmidt et al., 2003), although other methods can be used such as spectropolarimetric measurements which can detect the weakest kilogauss fields in bright nearby white dwarfs with broadband circular polarisation (Kemp et al., 1970; Bagnulo & Landstreet, 2020; Berdyugin et al., 2022, 2023) or with polarisation in spectral lines (Angel & Landstreet, 1970; Aznar Cuadrado et al., 2004; Jordan et al., 2007; Landstreet & Bagnulo, 2019), and the detection of cyclotron emission/absorption from accreting systems with a magnetic white dwarf primary (Visvanathan & Wickramasinghe, 1981; Schwope et al., 1990; Bailey et al., 1991; Campbell et al., 2008).
The generation of magnetic fields in isolated white dwarfs cannot come from a single mechanism (Bagnulo & Landstreet, 2021, 2022), and multiple channels have been proposed which include: (i) Fossil fields strengthened by magnetic flux conservation as stars evolve into white dwarfs (Woltjer, 1964; Landstreet, 1967; Tout et al., 2004), (ii) convective dynamos driven in binary mergers (Regős & Tout, 1995; Tout et al., 2008; Nordhaus et al., 2011; García-Berro et al., 2012; Wickramasinghe et al., 2014), or by giant-planet engulfment (Siess & Livio, 1999; Farihi et al., 2011), and (iii) convective dynamos driven by crystallization of the cores of white dwarfs as they cool down (van Horn, 1968; Isern et al., 2017; Schreiber et al., 2021a, b, 2022; Ginzburg et al., 2022).
A rare subset of magnetic white dwarfs show Zeeman-split Balmer emission (DAHe), first identified in the white dwarf GD 356 (Greenstein & McCarthy, 1985). Three DAHe white dwarfs are currently known***Two potentially additional systems show Balmer-line emission but no detectable magnetic field; WD J0412+7549 (Tremblay et al., 2020; Walters et al., 2021) and WD J1653–1001 (O’Brien et al., 2023), dubbed DAe white dwarfs. (Reding et al., 2020; Gänsicke et al., 2020; Walters et al., 2021), which all appear to be near the age at which crystallization sets in (Schreiber et al., 2021b) potentially explaining both their emergence in the white dwarf cooling sequence and their magnetic fields. Additionally, these DAHe systems are fast rotators with spin periods in the range of 0.09 – 15.3 h. Isolated white dwarfs typically have spin periods of 1 – 3 d (Hermes et al., 2017), and the accretion of planetary material by these white dwarfs could provide a source of angular momentum to spin them up (Stephan et al., 2021). The presence of planetary material around white dwarfs is not unexpected, as the survival of planetary systems into the white dwarf phase of their host star is evidenced through the presence, destruction, and accretion of planetary bodies (Zuckerman & Becklin, 1987; Zuckerman et al., 2003; Jura, 2003; Gänsicke et al., 2006a; Vanderburg et al., 2015; Gänsicke et al., 2019; Vanderburg et al., 2020; Blackman et al., 2021; Cunningham et al., 2022; Gaia Collaboration et al., 2022).
While a crystallization-driven convective dynamo could produce a magnetic field in these white dwarfs, the generation mechanism of Zeeman-split emission is still uncertain. Observations show that the Zeeman-split emission is strongest at photometric minimum in these DAHe systems. This coincidence suggests that these white dwarfs host a temperature-inverted, optically thin emission region sitting above a photospheric dark region. The photometric variability induced by these dark regions has been observed in many magnetic white dwarfs (Wickramasinghe & Ferrario, 2000), and are thought to be generated by the change in the inhomogeneous field distribution over the visible surface of the white dwarf while it rotates. The resulting photometric variability has previously been attributed to a reduction in the temperature in areas of high magnetic field strength, akin to a Sun-spot. However, recent theoretical works suggest that photometric variability in magnetic radiative main-sequence stars is due to changes in their emergent spectrum rather than their bolometric flux (Fuller & Mathis, 2023), although further work is needed to extend this result to white dwarfs.
For GD 356, the size of both of these emitting and photometrically darker regions cover 10 per cent of the white dwarf surface (Ferrario et al., 1997; Brinkworth et al., 2004). One potential explanation for these systems is the unipolar inductor model (Goldreich & Lynden-Bell, 1969; Li et al., 1998; Wickramasinghe et al., 2010), whereby a close-in conductive body, such as a planetary core, induces a current that heats up the white dwarf atmosphere at the magnetic poles. However, this model is debated (Walters et al., 2021), and other possibilities could include the presence of an intrinsic chromosphere in these white dwarfs. As only three confirmed DAHe systems are currently known; enlarging this class of stars is crucial for understanding these white dwarfs and determining their origin.
In this paper, we report the identification of 21 new DAHe systems. Seventeen of these systems were identified by the Dark Energy Spectroscopic Instrument (DESI; DESI Collaboration et al. 2016a, b) on the Mayall 4 m telescope at Kitt Peak National Observatory (KPNO), and four were discovered from re-inspection of archival Sloan Digital Sky Survey (SDSS; York et al. 2000; Eisenstein et al. 2011; Blanton et al. 2017) spectroscopy of featureless DC white dwarfs. In Section 2 we present detailed observations for the DAHe, WD J161634.36+541011.51 (hereafter WD J1616+5410), which shows Zeeman-emission and photometric variability on a min period. In Section 3 we present our results of analysing the presence of a magnetic field and photometric variability in WD J1616+5410. In Section 4 we give details on the 21 DAHe white dwarfs we have identified. In Section 5 we calculate the occurrence rates of DAHe white dwarfs and discuss the potential theories for why these systems cluster at late cooling times on the Gaia Hertzsprung-Russell diagram (HRD). Finally we summarise our findings in Section 6.
2 Observations
| # | HJD [d] | Exp. | Night | Exp. | Fibre |
|---|---|---|---|---|---|
| time [s] | ID | ||||
| 1 | 2459288.9659351 | 900.1 | 2021 03 14 | 80503 | 4903 |
| 2 | 2459288.9787686 | 900.1 | 2021 03 14 | 80504 | 4903 |
| 3 | 2459288.9909529 | 900.1 | 2021 03 14 | 80505 | 4903 |
| 4 | 2459289.0030943 | 900.1 | 2021 03 14 | 80506 | 4903 |
| 5 | 2459289.0152451 | 900.1 | 2021 03 14 | 80507 | 4903 |
| 6 | 2459311.8965222 | 636.4 | 2021 04 06 | 83738 | 4631 |
| 7 | 2459312.9428680 | 259.5 | 2021 04 07 | 83886 | 4631 |
| 8 | 2459323.9773956 | 913.5 | 2021 04 18 | 85357 | 4839 |
| 9 | 2459323.9888389 | 956.2 | 2021 04 18 | 85358 | 4839 |
| 10 | 2459324.9054519 | 326.7 | 2021 04 19 | 85511 | 4839 |
| 11 | 2459337.9370142 | 1431.0 | 2021 05 02 | 86988 | 4921 |
| 12 | 2459338.9186979 | 800.9 | 2021 05 03 | 87122 | 4921 |
| 13 | 2459340.9281868 | 835.3 | 2021 05 05 | 87379 | 4530 |
| Telescope | Night | Band | First exp. [HJD] | last exp. [HJD] | Exp. time [s] | # of exp. |
|---|---|---|---|---|---|---|
| ZTF | Multiple | 2458203.895314 | 2459641.895052 | 30 | 1124 | |
| ZTF | Multiple | 2458198.893930 | 2459641.868801 | 30 | 1202 | |
| LT | 2022 May 26 | 2459726.541376 | 2459726.704541 | 60 | 180 | |
| LT | 2022 May 28 | 2459728.509526 | 2459728.563321 | 60 | 60 | |
| LT | 2022 May 31 | 2459731.487386 | 2459731.650531 | 60 | 179 |

2.1 Spectroscopy
2.1.1 DESI
DESI on the Mayall 4 m telescope at Kitt Peak National Observatory (KPNO) is a multi-object spectroscopic instrument capable of collecting fiber spectroscopy on up to targets per pointing (DESI Collaboration et al., 2022). The fibers are positioned by robot actuators and are grouped into ten petals which feed ten identical three-arm spectrographs, each spanning 3600 – 9824 Å at a FWHM resolution of 1.8 Å. The inter-exposure sequence which includes telescope slewing, spectrograph readout and focal plane reconfiguration can be completed in as little as 2 min (DESI Collaboration et al., 2022). DESI started main survey operations on 2021 May 14 and will obtain spectroscopy of more than 40 million galaxies (Zhou et al., 2020, 2022; Raichoor et al., 2020, 2022) and quasars (Yèche et al., 2020; Chaussidon et al., 2022) over five years to explore the nature of dark matter. During sub-optimal observing conditions (for example, poor seeing or high lunar illumination), observations switch focus to nearby bright galaxies (Ruiz-Macias et al., 2020; Hahn et al., 2022) and stars (Allende Prieto et al., 2020; Cooper et al., 2022). The DESI Early Data Release (EDR, DESI collaboration et al. 2022, in preparation) contains approximately 4 400 white dwarf candidates (Cooper et al., 2022) from the Gentile Fusillo et al. (2019) Gaia DR2 sample, and a full description of the reduction pipeline is given by Guy et al. (2022). The first year of DESI observations will constitute the DESI Data Release 1 (DR1), and combined with the DESI EDR contain over 47 000 white dwarf candidate. The EDR will contain survey validation data (DESI collaboration et al. 2023, in preperation), where targets often have more repeat observations than in main survey operations.
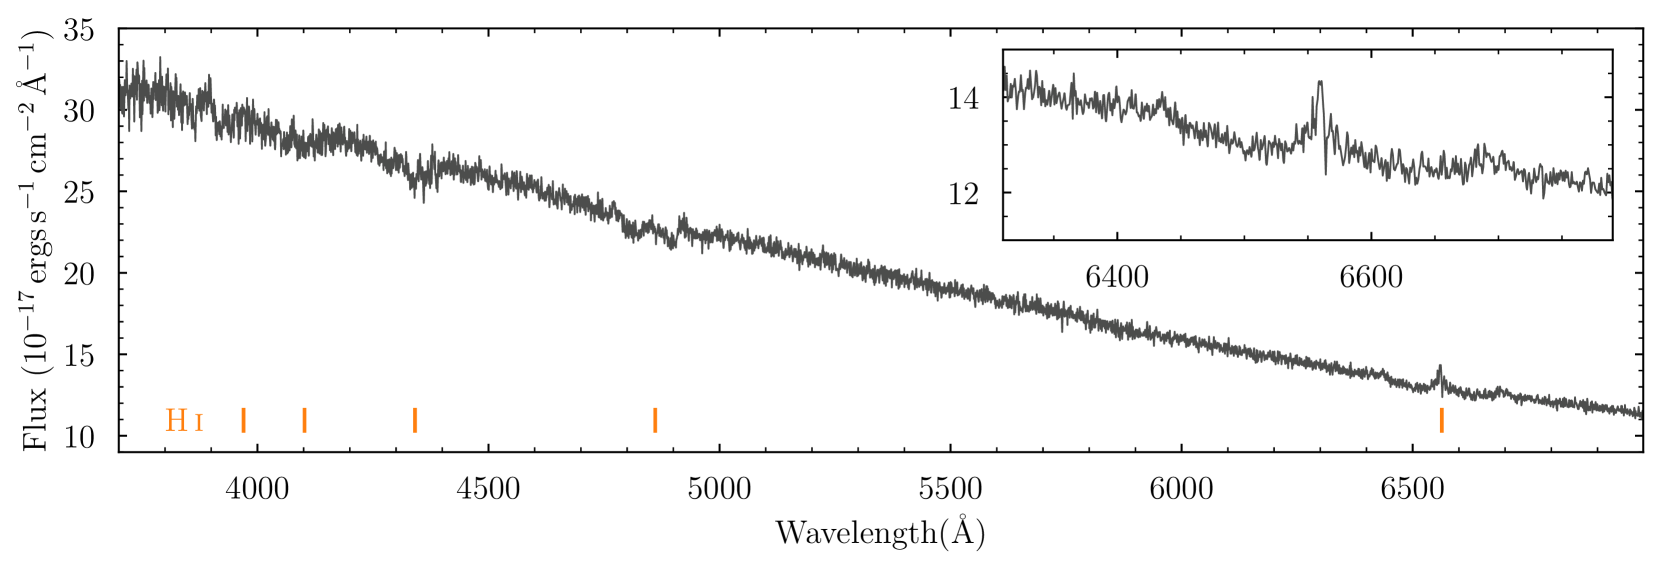
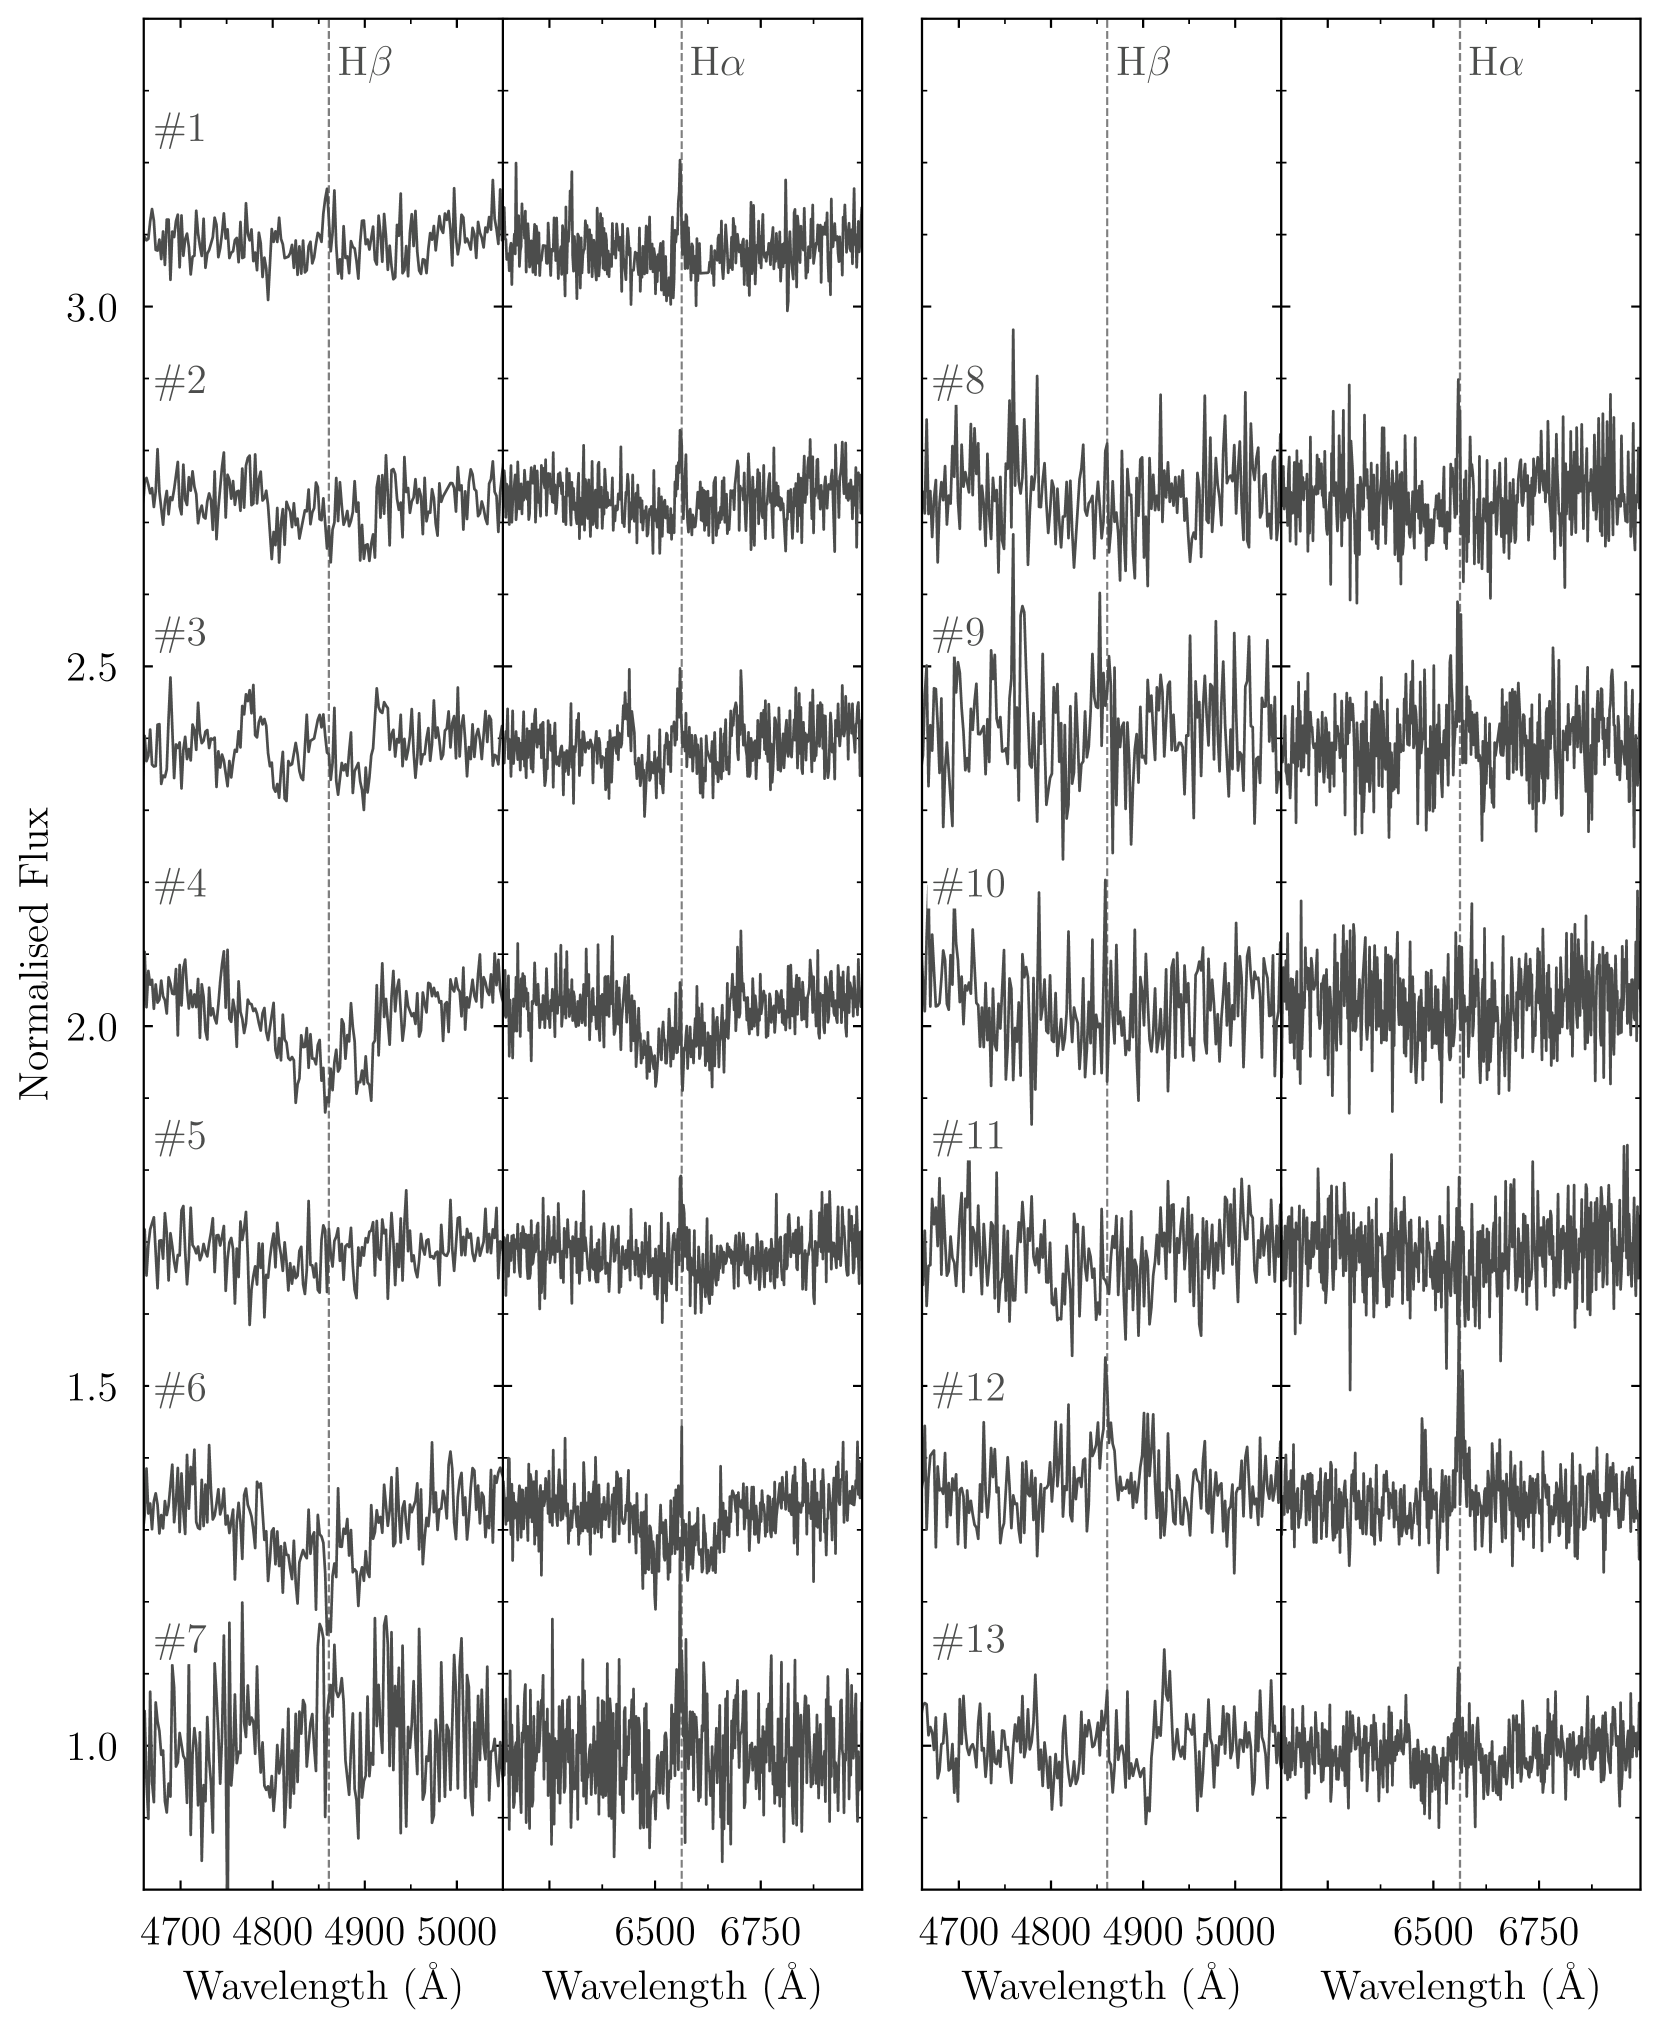
We identified a total of 17 DAHe systems through visual inspection of the DESI EDR and DR1 samples (see Section 4, which includes the white dwarf WD J1616+5410 (Fig. 1). As WD J1616+5410 was observed during survey validation many repeat spectra were taken in varied conditions (leading to a visible spread in the signal-to-noise ratios, ), resulting in thirteen individual exposures collected by DESI from 2021 March 14 to 2021 May 5, which are presented in Table 1. The first five exposures were taken consecutively with an exposure time of 900 s, and show clear variation of the Balmer features, exhibiting both emission and absorption features (see Fig. 9). Given the variations detected in the DESI spectroscopy, we inspected archival Zwicky Transient Facility (ZTF) data to probe for photometric variability.
2.1.2 SDSS
The SDSS has been taking multi-band photometry and multi-fibre spectroscopy since 2000, using a 2.5 m telescope located at the Apache Point Observatory in New Mexico (Gunn et al., 2006). We retrieved the archival SDSS spectroscopy (DR17, Abdurro’uf et al. 2022) of 2621 white dwarfs classified as “DC” within the Gaia/SDSS white dwarf catalogue of Gentile Fusillo et al. (2019), using the spectral_class identifier. We identified four new DAHe systems from this sample which are discussed further in Section 4.2.
2.2 Time-series photometry
2.2.1 ZTF
ZTF is a robotic time-domain survey using the Palomar 48-inch Schmidt Telescope (Bellm et al., 2019; Masci et al., 2019). Utilising a 47 field of view, ZTF can scan the entire sky in two days, making it a powerful survey for identifying photometrically variable sources at optical wavelengths. The ZTF observed WD J1616+5410 and we collected the photometry provided by Data Release 11 (Masci et al., 2019). Between 2018 March to 2022 March, ZTF obtained a total of 1124 and 1202 30 s exposures in the -band and -band, respectively (Table 2). We computed a preliminary Lomb-Scargle periodogram (Lomb, 1976; Scargle, 1982) using the python package astropy.timeseries (Astropy Collaboration et al., 2013, 2018, 2022), and identified a strong periodic signal at 47.6 min, which spurred us on to collect additional photometry on the Liverpool Telescope (LT) to confirm the variability.
2.2.2 LT
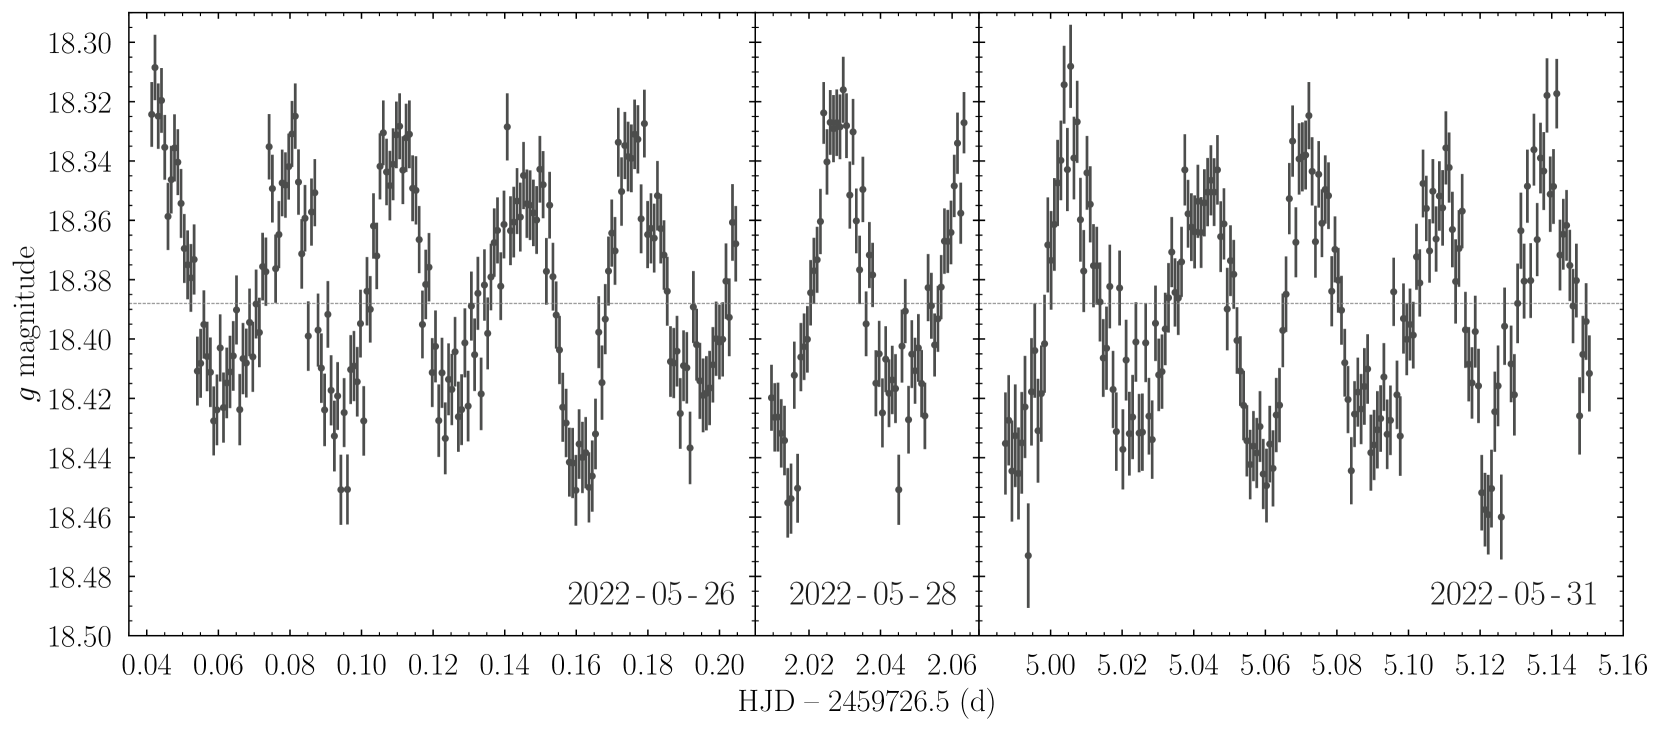
The LT is a 2 m robotic telescope situated on the island of La Palma (Steele et al., 2004). We obtained three nights of data on the LT, on 2022 May 26, May 28, and May 31, collecting 419 60 s exposures totaling 7 h (Table 2). We used the IO:O imager with the SDSS- filter providing variability information over the wavelength range 4000 – 5500 Å, covering H, H, and H where photometric variability is expected for magnetic white dwarfs. We used the standard LT pipeline to provide bias subtraction and flat fielding. Differential photometry based on Sextractor (Bertin & Arnouts, 1996) was then used to extract the light curve by comparing the flux with the comparison star, SDSS J161657.97+540954.4. The LT light-curve of WD J1616+5410 exhibits clear periodic behaviour (Fig.2), with variations over a magnitude range of 0.14 mag on a period in agreement with that identified from the ZTF photometry, although there are clear changes in the strength at maxima and minima.
3 Results
3.1 Magnetic field variations
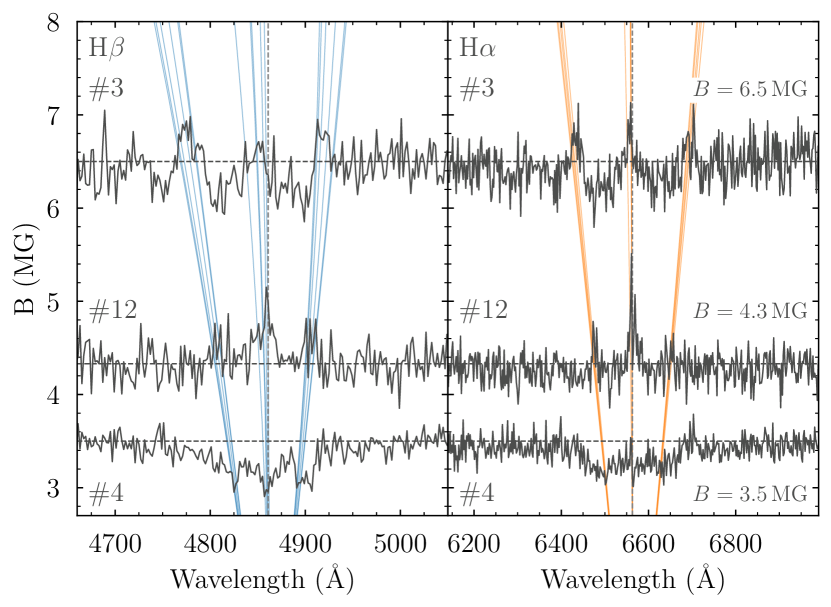
Figure 9 reveals clear variations in the H and H features where spectra show both three-component absorption (e.g. #2, #4, #6) and emission (e.g. #3, #12, #13), a behaviour that has also been reported for the DAHe white dwarf WD J125230.93–023417.72 (hereafter WD J1252–0234; Reding et al. 2020). This is due to Zeeman-splitting of the energy levels for H and H in the presence of a magnetic field. In spectrum #4, the absorption features are consistent with the linear Zeeman-splitting regime where the three , , and components are clearly seen. As the magnetic field strength increases, the energy degeneracy due to orbital angular momentum, , will eventually be lifted and these three components will split further, resulting in 18 (15) transitions in H (H), where the 2p and 2p (2p and 2p) transitions are still degenerate (Henry & O’Connell, 1985). This is known as the quadratic Zeeman effect and is apparent in the H region of spectrum #3, where the central component is blue-shifted, in addition to all three emission features having broader profiles consistent with the lifting of energy degeneracy.
We measured the magnetic field strength, , for spectra #3, #4, and #12, as they were the clearest profiles recovered from the DESI spectroscopy, and assume is constant throughout the emitting or absorbing area of the white dwarf atmosphere. We used the transition wavelengths as a function of provided by Schimeczek & Wunner (2014a, b) and compared these to the Zeeman-split profiles (Fig. 3), where we obtained values of 6.5 0.1 MG, 4.3 0.1 MG, and 3.5 0.2 MG for spectra #3, #4, and #12 respectively. Spectra #3 and #4 were taken sequentially with only 3.5 min of downtime (consistent with the time taken for the inter-exposure sequence), and suggest that the white dwarf is rotating fairly rapidly and that a localised emitting hot-spot is rotating in and out of view. The hotspot must be sufficiently localised as the width of the profiles do not allow for a significant variation in , which has been previously seen for the DAHe WD J121929.50+471522.94 (hereafter WD J1219+4715; Gänsicke et al. 2020). For a centred-dipolar field configuration on the white dwarf, the field strength near the magnetic equator is a factor two lower than the field strength at the poles (Achilleos et al., 1992), which is in rough agreement with the variations between spectra #3 and #4. Spectrum #12 was taken 50 d after #3 and #4, but is suggestive of two seperate localised emitting hot-spots with two different field strengths i.e an offset dipole or quadrupolar field (Martin & Wickramasinghe, 1984; Achilleos & Wickramasinghe, 1989; Achilleos et al., 1992). If this interpretation is correct and the dipole is simply offset in the direction of the magnetic axis (Achilleos et al., 1992), we expect the variation between spectrum #3 and spectrum #12 to be periodic and separated by 0.5 in phase.
3.2 Period analysis
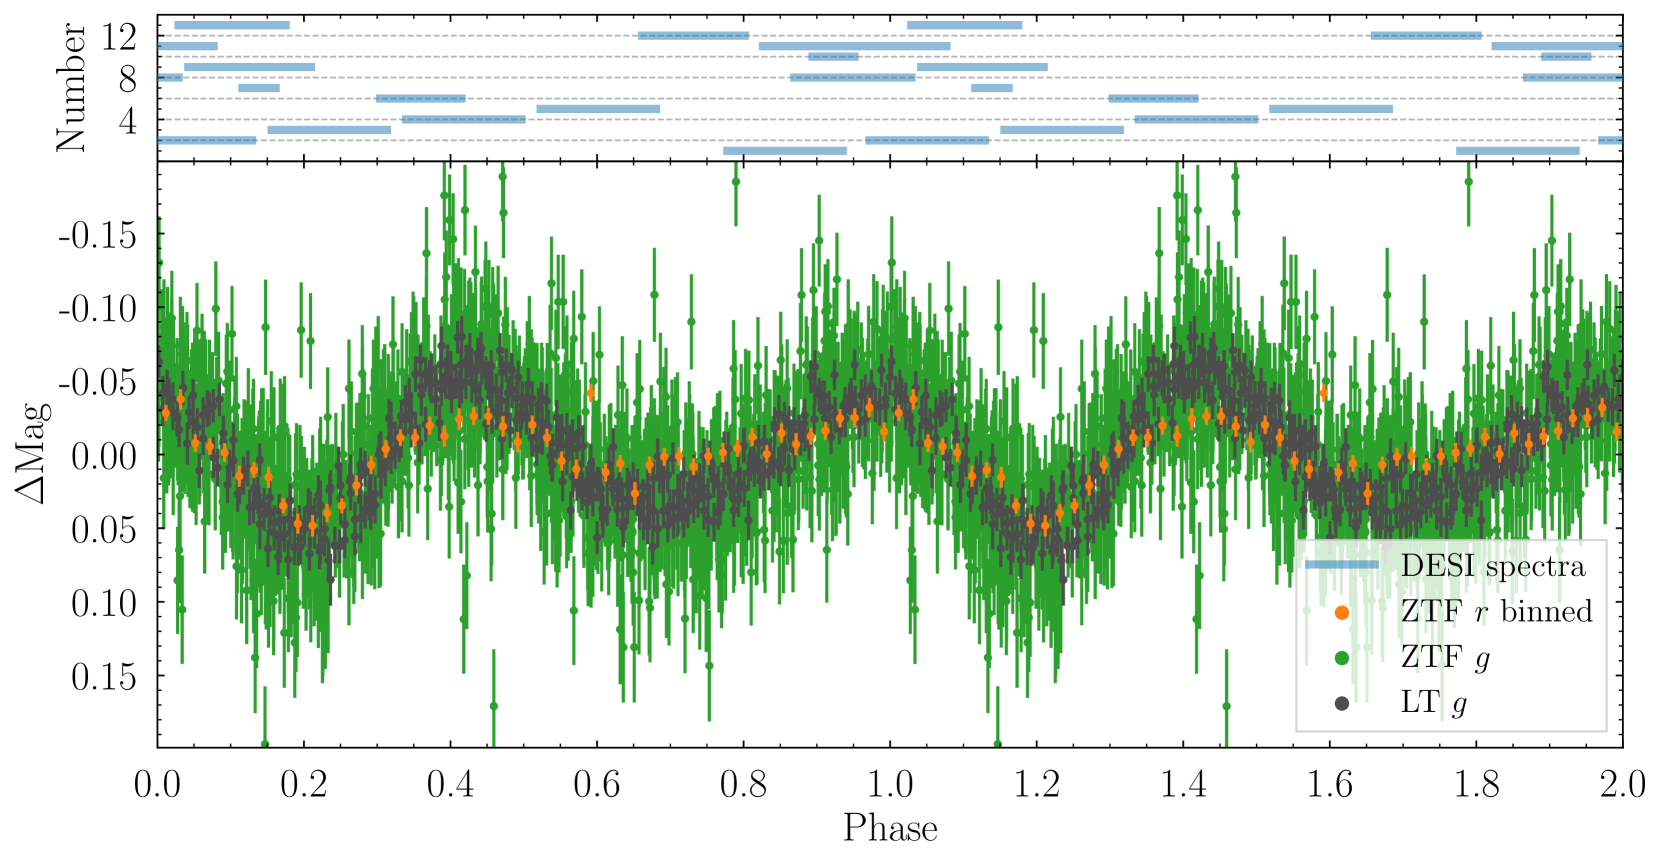
With the combined set of ZTF and LT data, we computed Lomb-Scargle periodograms for the ZTF -band data and the LT and ZTF -band data. Owing to an offset between the ZTF and LT -band data of about 0.05 mag, we subtracted the median magnitude of each data-set separately before combining them. The resulting periodograms are shown in Fig. 4, where the 47.6444 0.0003 min signal is immediately recovered from both the -band and -band data with excellent agreement between the two. We determined the error on the period by calculating the standard deviation of a Gaussian profile fitted to the signal peak in the periodogram. There are potential alias periods present in the ZTF and LT data, with some at a frequency half that of the dominant signal. Given the variation in maxima and minima seen in the LT light-curve, we inspected phase-folded light-curves on both a 47.6444 0.0003 min period and a 95.2889 0.0005 min period. The 95.3 min phase-fold shows two maxima and minima per cycle (Fig. 5), and we interpret this as the true period of variability. To obtain a more precise estimate of the period, we performed a fit using the sinusoidal function around the 95.3 min value, where is the time of each Mag measurement, is the period, is the amplitude and is the phase zero-point. This resulted in a period solution of 95.288828 0.000023 min which we provide as our final solution. The variations seen in the ZTF and LT -band data behave in a similar manner, whereas the ZTF -band data appear to vary at a slightly reduced amplitude; a colour dependence on the strength of variability that has been previously observed at DAHe white dwarfs (Reding et al., 2020).
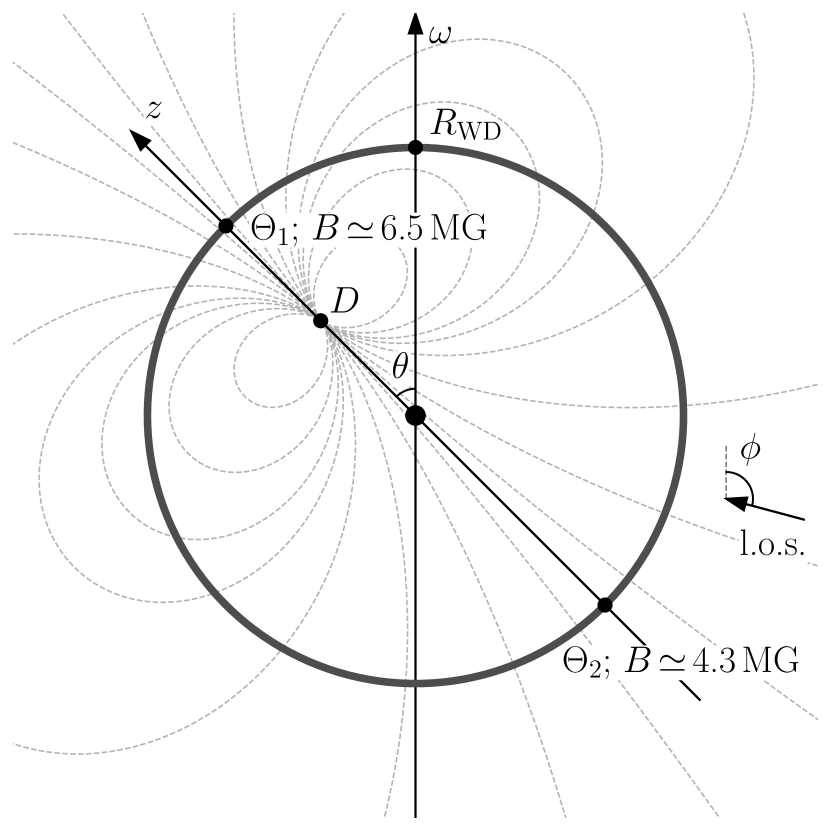
With the multi-epoch DESI spectroscopy showing variations in the strength of both the observed magnetic field and Balmer emission, we convert the shutter open time and exposure duration from Table 1 to phase space which are shown in Fig. 5. It is immediately clear that spectra #3 and #12 are offset in by 0.5 in phase, with spectrum #3 (#12) aligned with the deepest (shallowest) minima in the photometry at phase 0.2 (0.7). These observations are consistent with those seen at all confirmed DAHe white dwarfs (Ferrario et al., 1997; Brinkworth et al., 2004; Gänsicke et al., 2020; Reding et al., 2020; Walters et al., 2021). For WD J1616+5410, we suggest an offset dipole field configuration with the two magnetic poles that rotate in and out of view (see Fig. 6 for a toy model), both of which have co-located, temperature-inverted, optically-thin hotspots. These magnetic poles have differing magnetic field strengths, resulting in slightly different photometric minima when the poles are in view. When viewing the system equator-on, we expect the white dwarf to be at photometric maximum and its spectrum to present the lowest field strengths with Zeeman-split absorption, as the poles are no longer in full view at the limbs of the observable hemisphere (Fig. 6). This is consistent with the DESI spectra and LT and ZTF photometry, where spectra #2, #4, and #6 each align with one of the two photometric maxima in Fig. 5.
Other epochs of spectroscopy have poor , or show featureless (#5) or potentially blended emission and absorption features (#13). The relatively long exposure times ( 13 min) of the DESI spectroscopy are likely to blame for the blended or featureless profiles, and the poor achieved for spectrum #7 in a short exposure show the limits achievable with serendipitously obtained, survey-based observations. Follow-up observations at a higher and shorter exposure times are required to further analyse the spectroscopic variability seen at WD J1616+5410.
4 Identification of 21 additional DAHe systems
4.1 DESI identified DAHe systems
Motivated by the identification of WD J1616+5410, we expanded our search for DAHe white dwarfs in the DESI EDR and DR1 samples which include observations of over 47 000 white dwarf candidates from Gentile Fusillo et al. (2019). The Zeeman-split Balmer profiles can shift from their rest-wavelengths location across a significant fraction of the optical spectrum when magnetic field strengths reach several tens of MG (see fig. 2 of Schmidt et al. 2003), making it difficult to select for these systems with simple criteria (e.g. equivalent width at the rest-wavelength of H). We therefore opted to visually inspect the entire sample searching for spectra with signs of emission features across the entire spectral range of DESI. In addition to WD J1616+5410, we identified 30 potential systems as well as two of the previously known DAHe systems; WD J1219+4715 and WD J1252–0234 (Gänsicke et al., 2020; Reding et al., 2020). We attempted to identify magnetic field strengths for the 30 candidate DAHe white dwarfs in a manner similar to what was done for WD J1616+5410. We were able to confirm 16 of the candidates as new DAHe by matching their emission features with Zeeman-split Balmer line transitions (Table 3). For most of the systems we only had a single DESI spectrum, with six systems having two, three, or four spectra, and hence we could obtain no information on the field topology. For completeness we also list the 14 systems where a magnetic field could not be associated with the emission features as DESI DAHe candidates.
4.2 SDSS identified DAHe systems
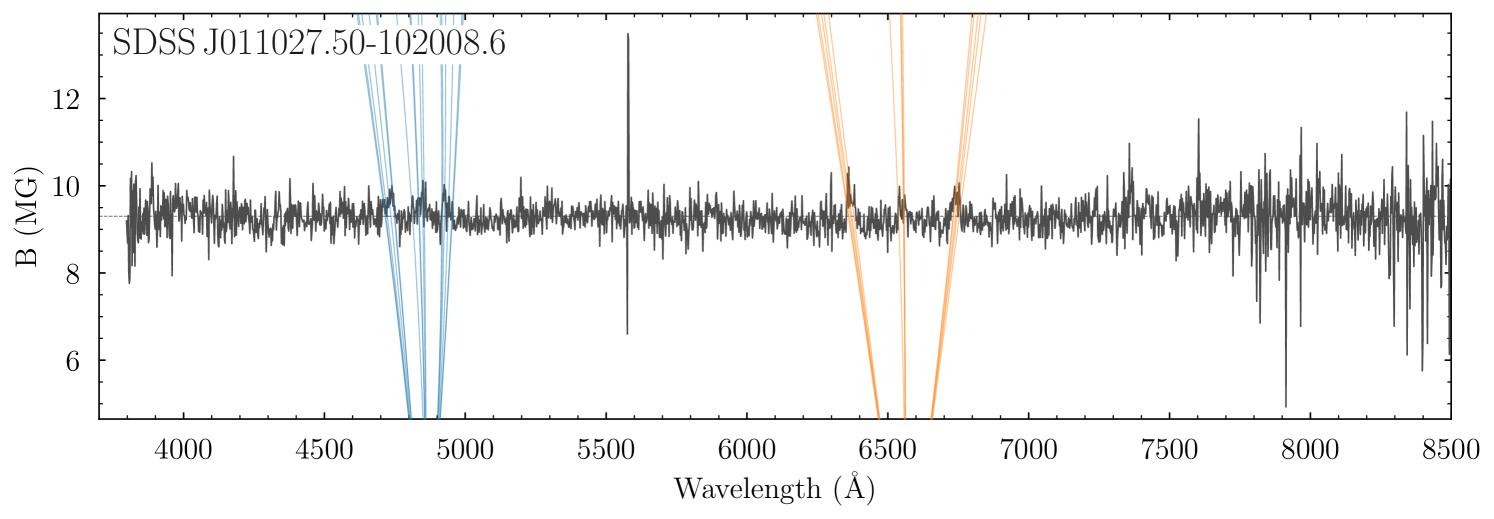
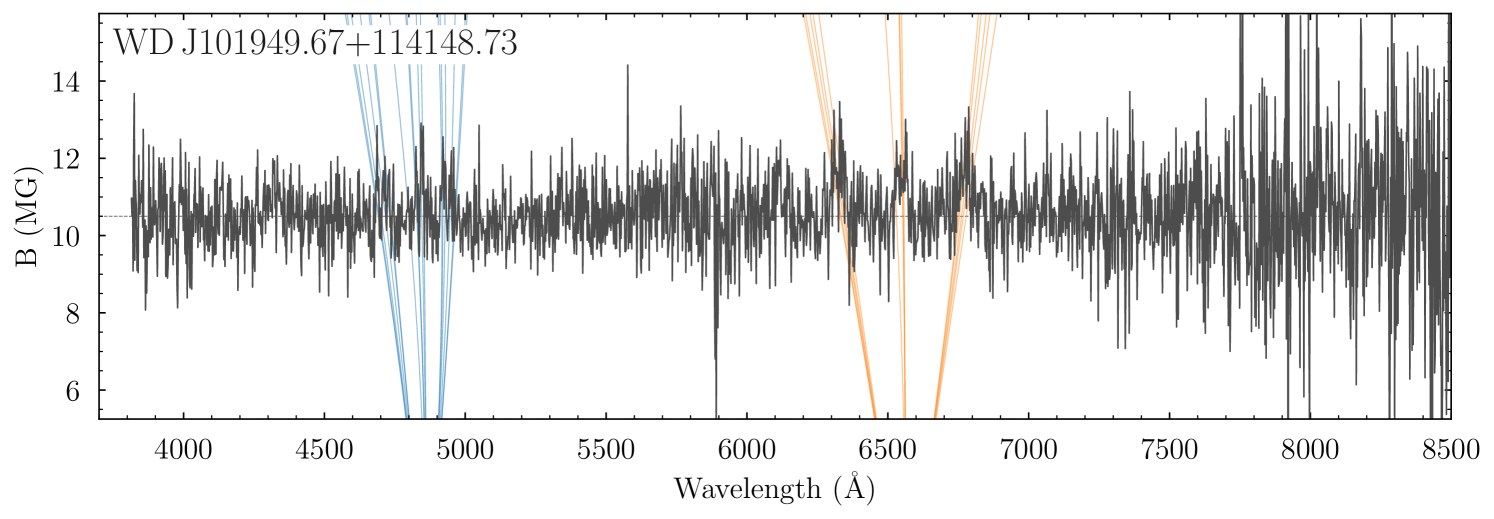
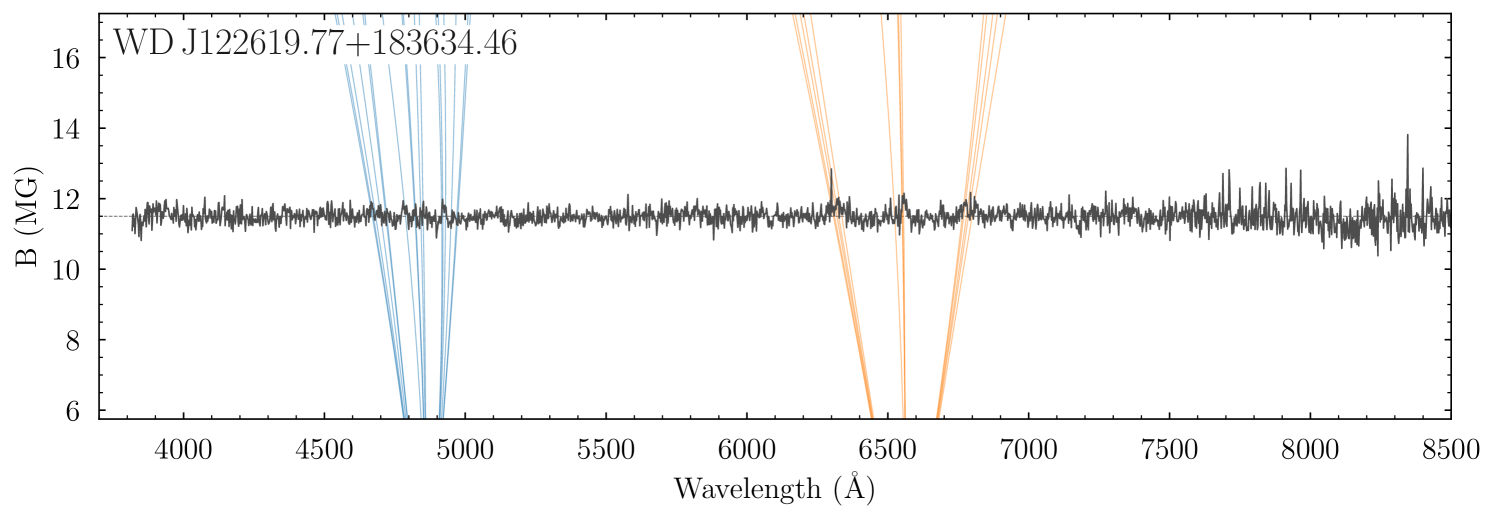
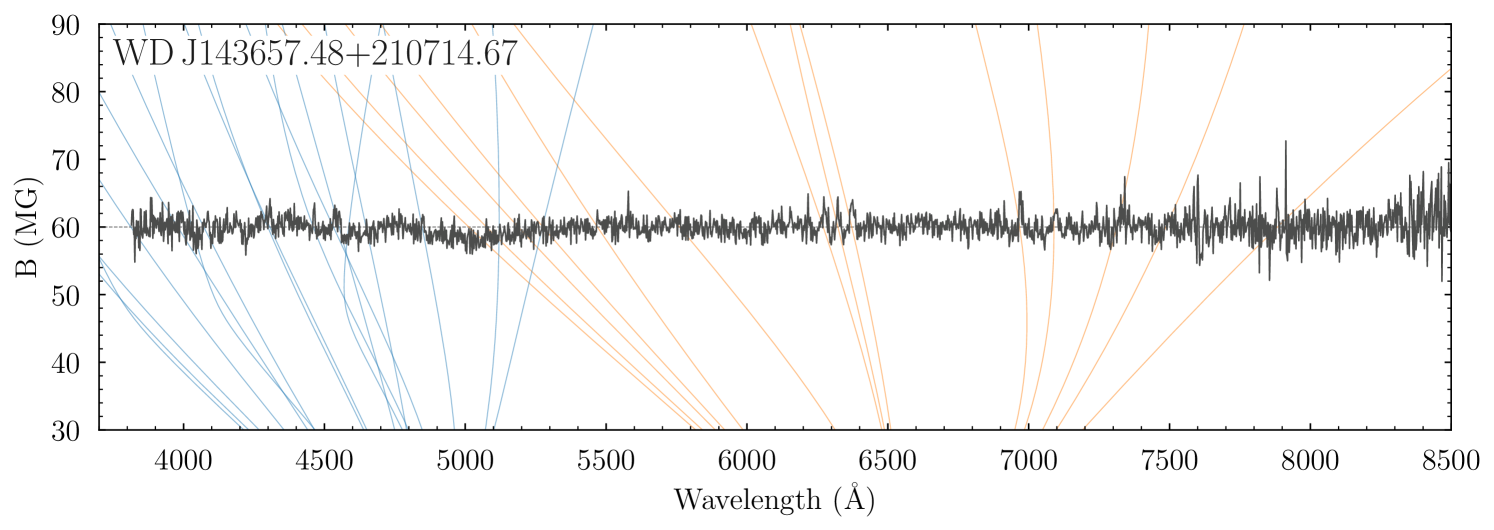
Eight of the DAHe systems identified from their DESI spectra were previously observed by the SDSS and classified as DC white dwarfs (McCook & Sion, 1999; Harris et al., 2003; Eisenstein et al., 2006; Kleinman et al., 2013; Kepler et al., 2015, 2016; Gentile Fusillo et al., 2019; McCleery et al., 2020), in addition to the previously published system WD J1219+4715 (Gänsicke et al., 2020). In five of these systems (see Table 3) there is evidence of Zeeman-split Balmer line emission in the SDSS spectra, although it is not surprising these subtle features were missed as the class of DAHe white dwarfs has only recently been established. In fact, GD 356, the prototypical system was originally classified as a DC white dwarf (Greenstein, 1974; Ferrario et al., 1997). This motivated us to visually re-inspect the all the 2621 SDSS spectra of white dwarfs classified as DCs (see Section 2.1.2), and discovered an additional four DAHe systems: WD J011027.51–102008.82, WD J101949.67+114148.73, WD J122619.77+183634.46†††Kawka & Vennes (2006) noted that WD J122619.77+183634.46, also known as LP 435–109, hosted H emission and suggested the system may be a close binary, but classified the system as a DC., and WD J143657.48+210714.67 (hereafter WD J0110–1020, WD J1019+1141, WD J1226+1836, and WD J1436+2107 respectively). We were able to measure magnetic field strengths for all four new DAHe systems (Table 3).
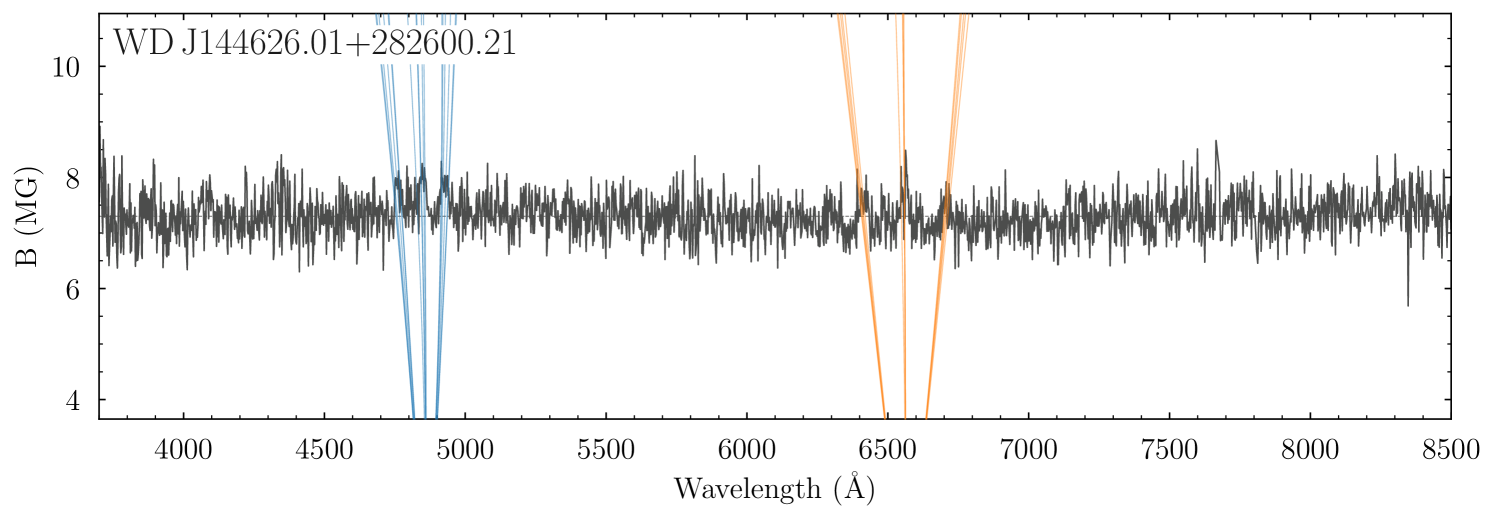
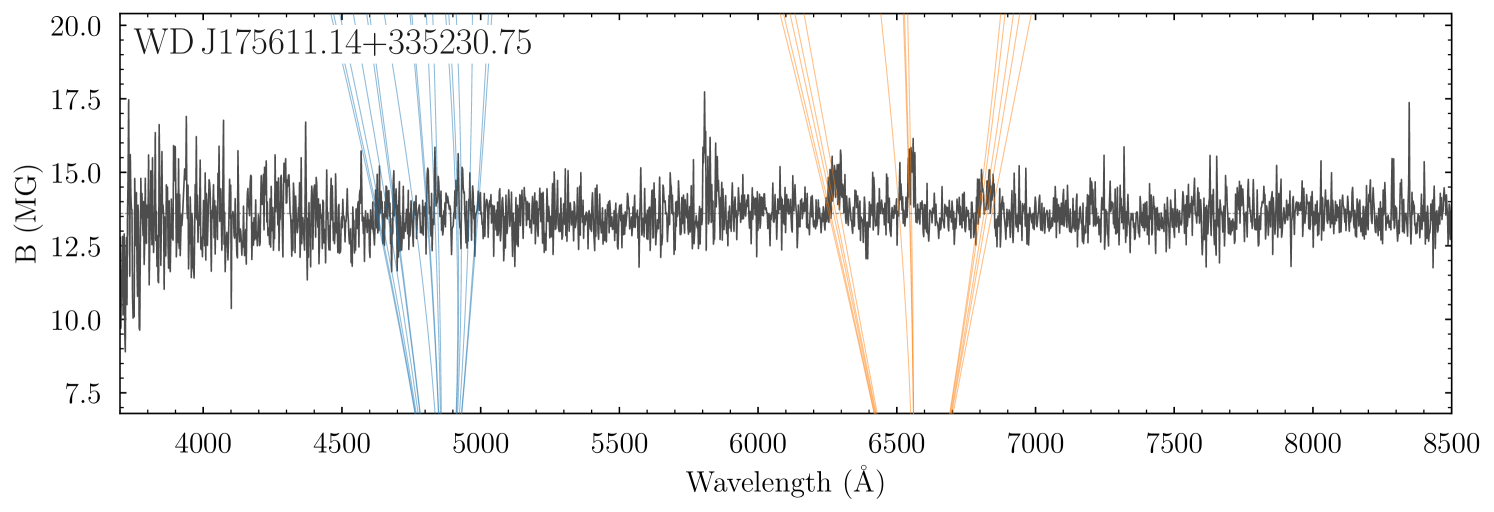
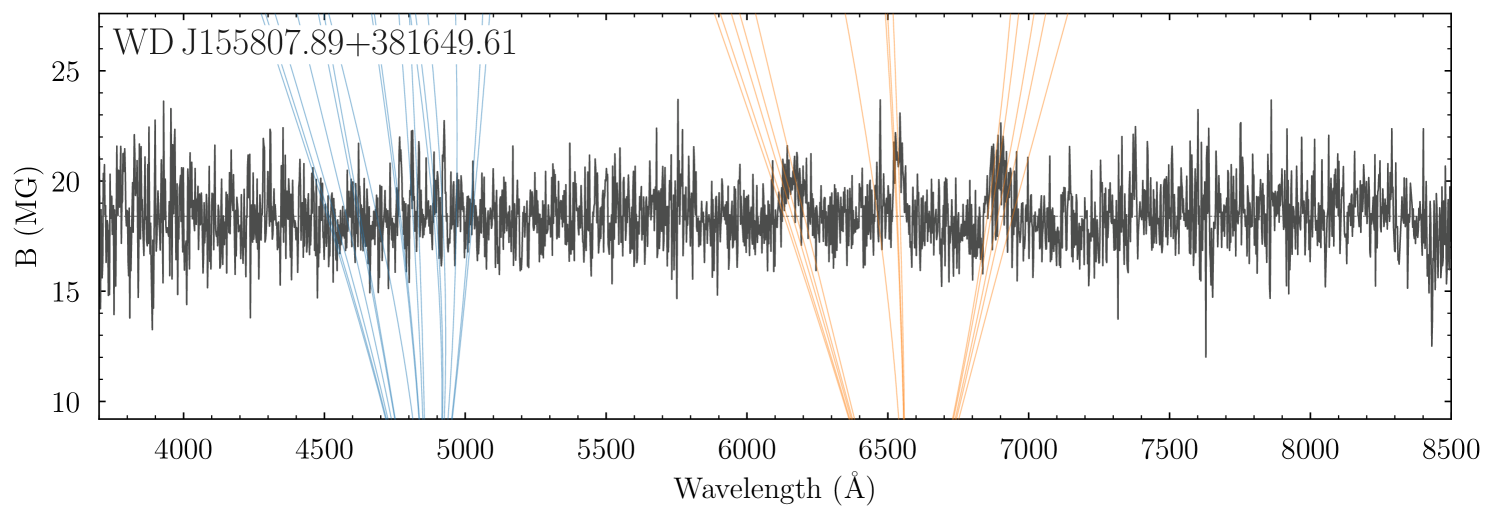
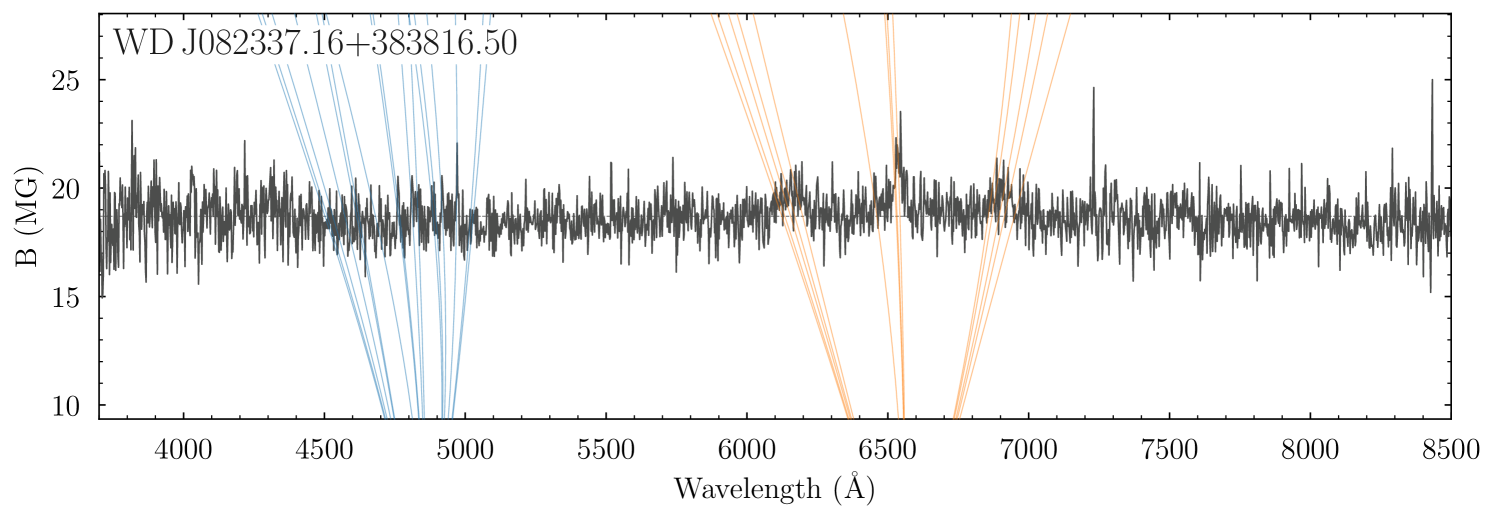
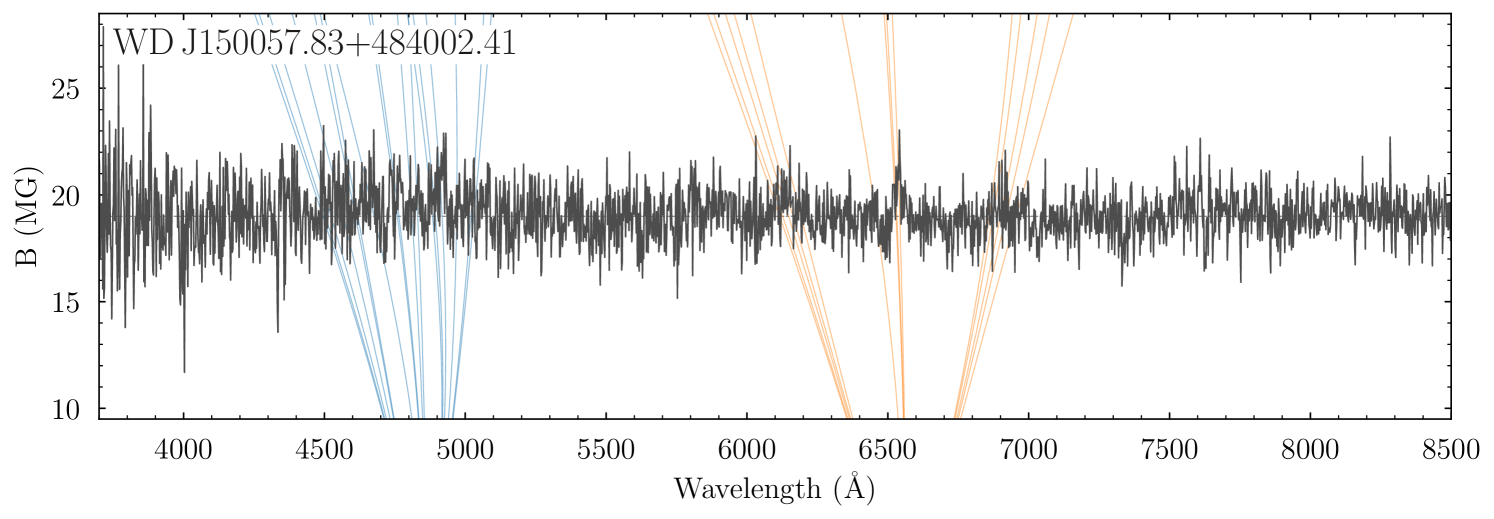
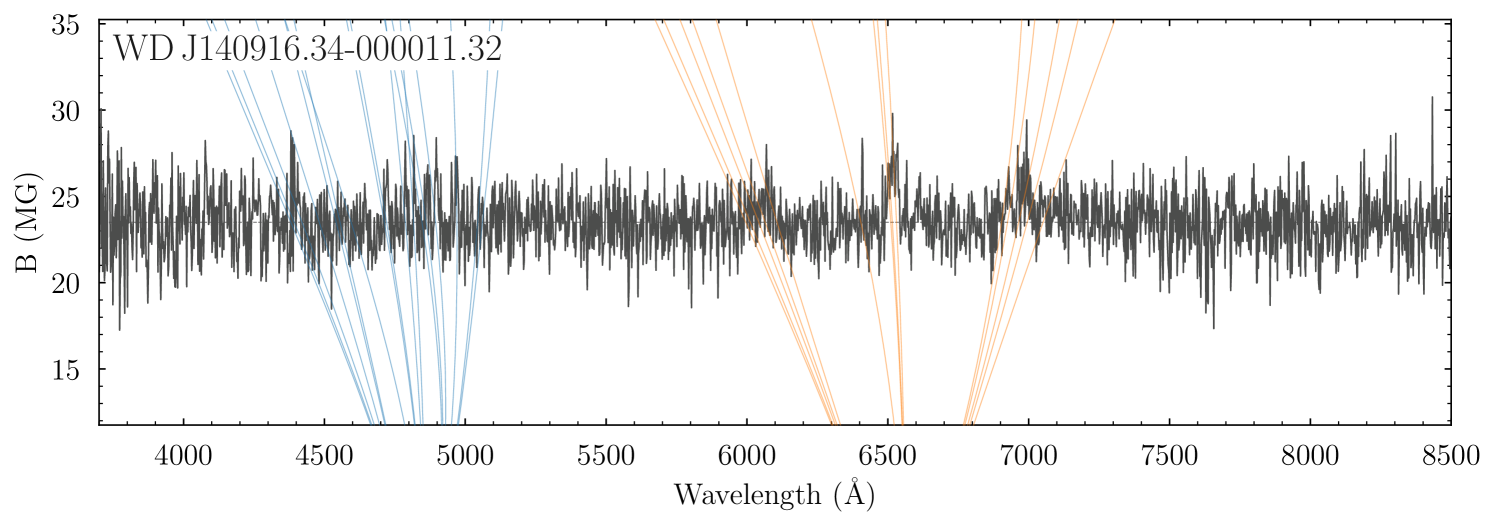
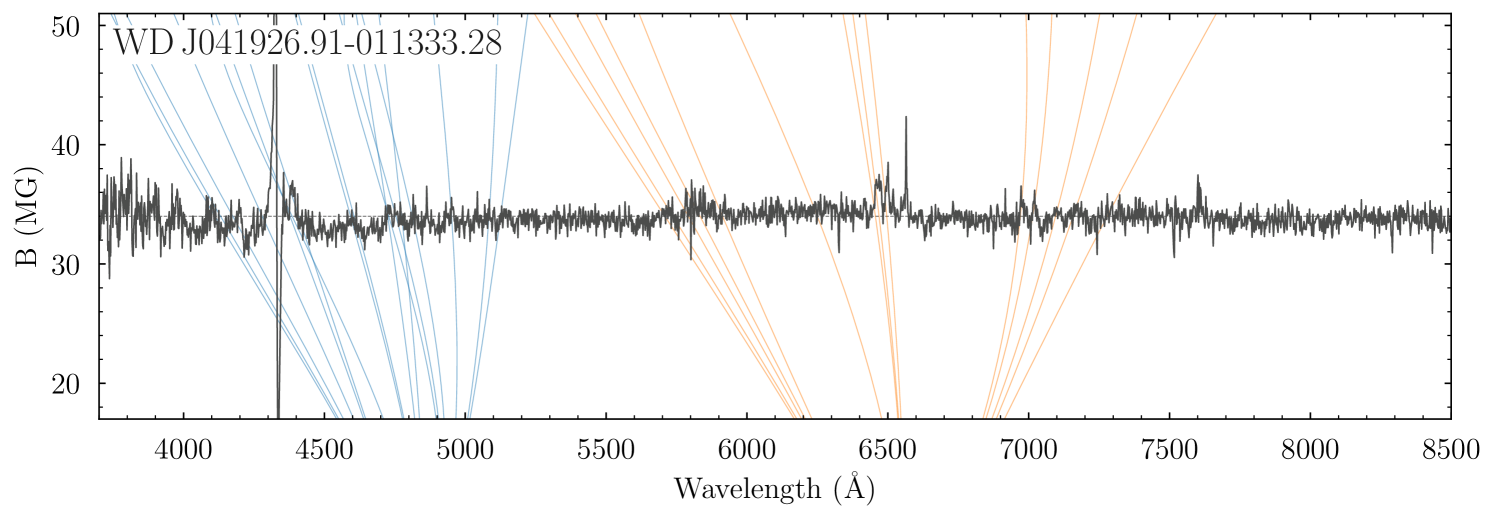
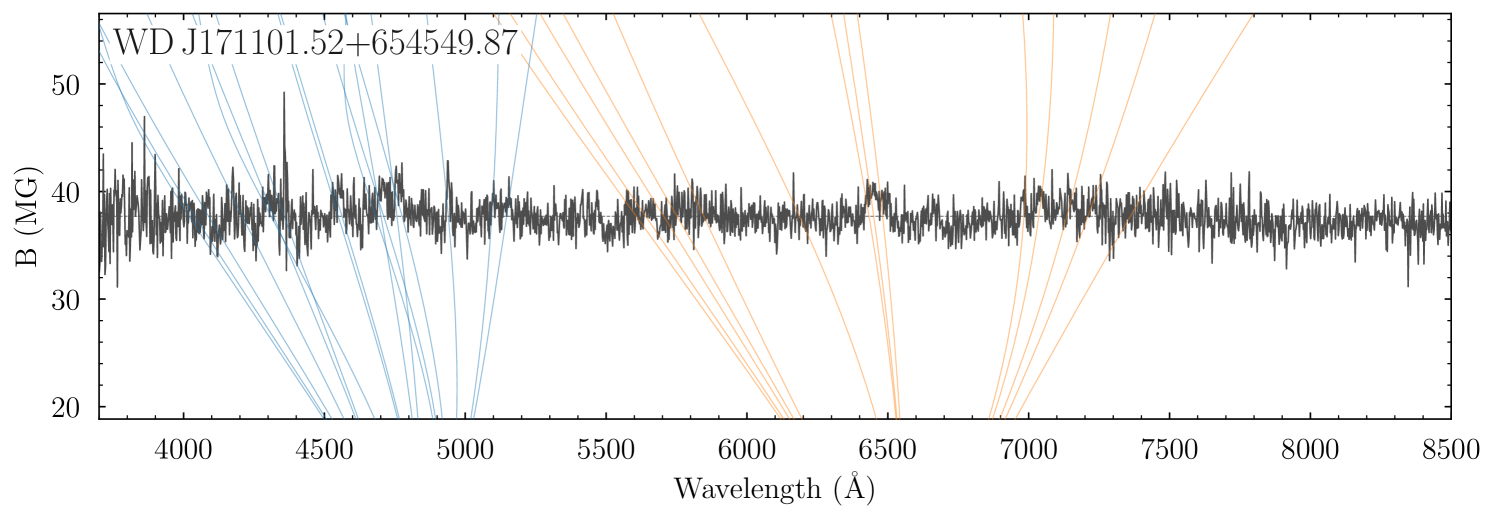
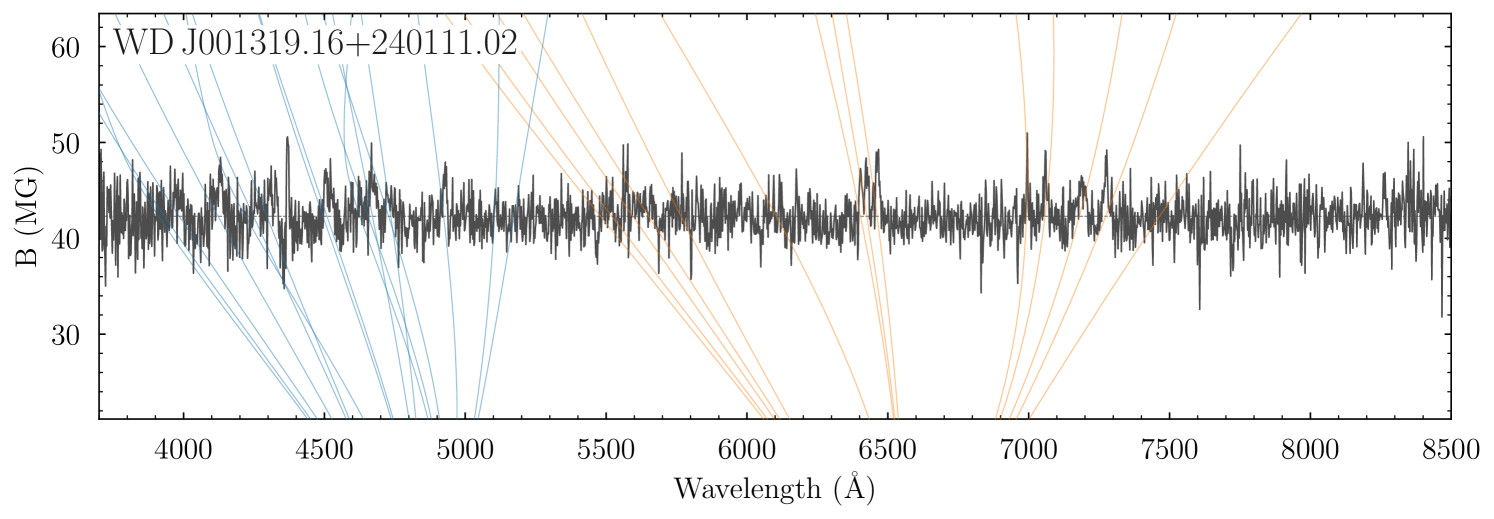
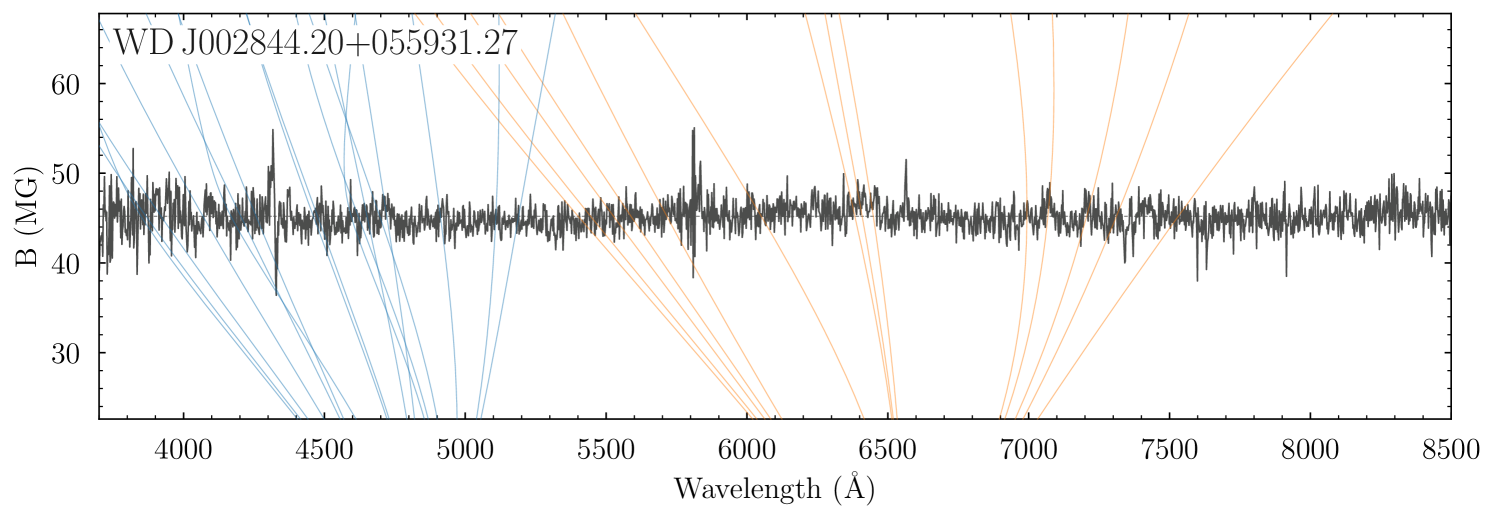
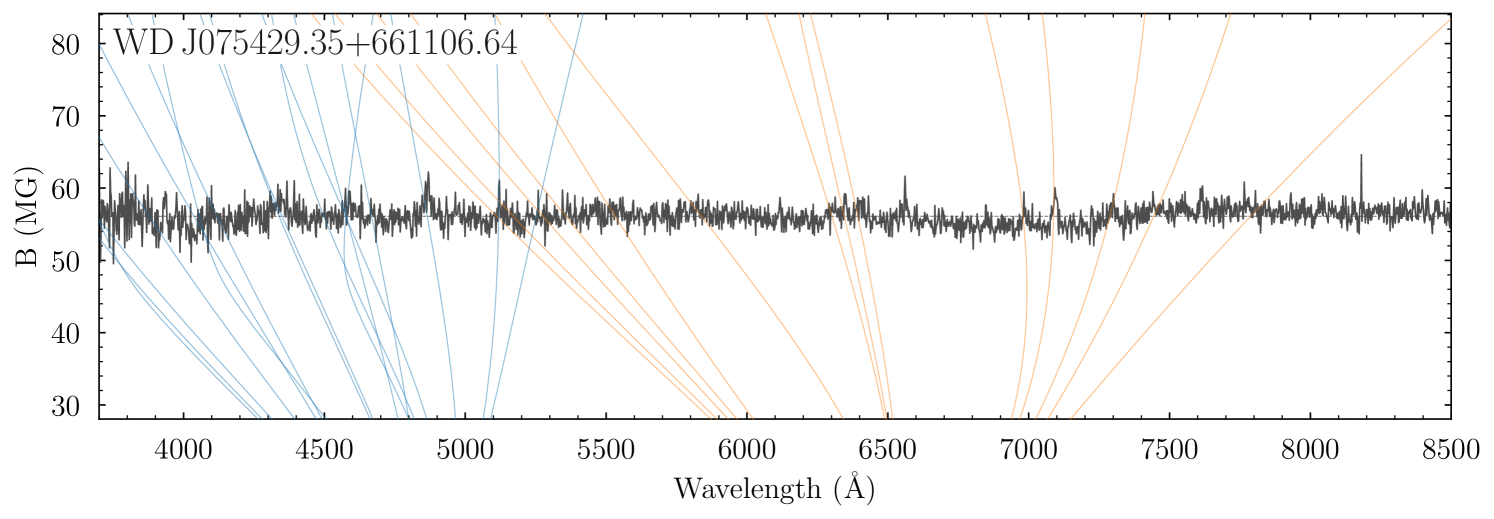
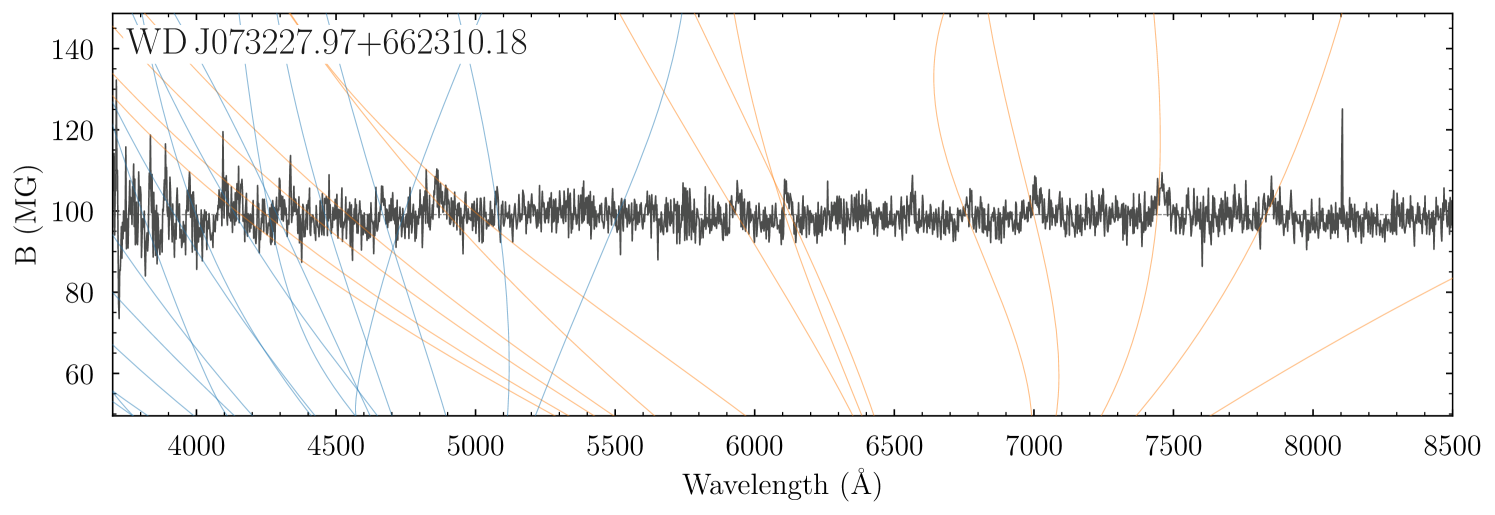
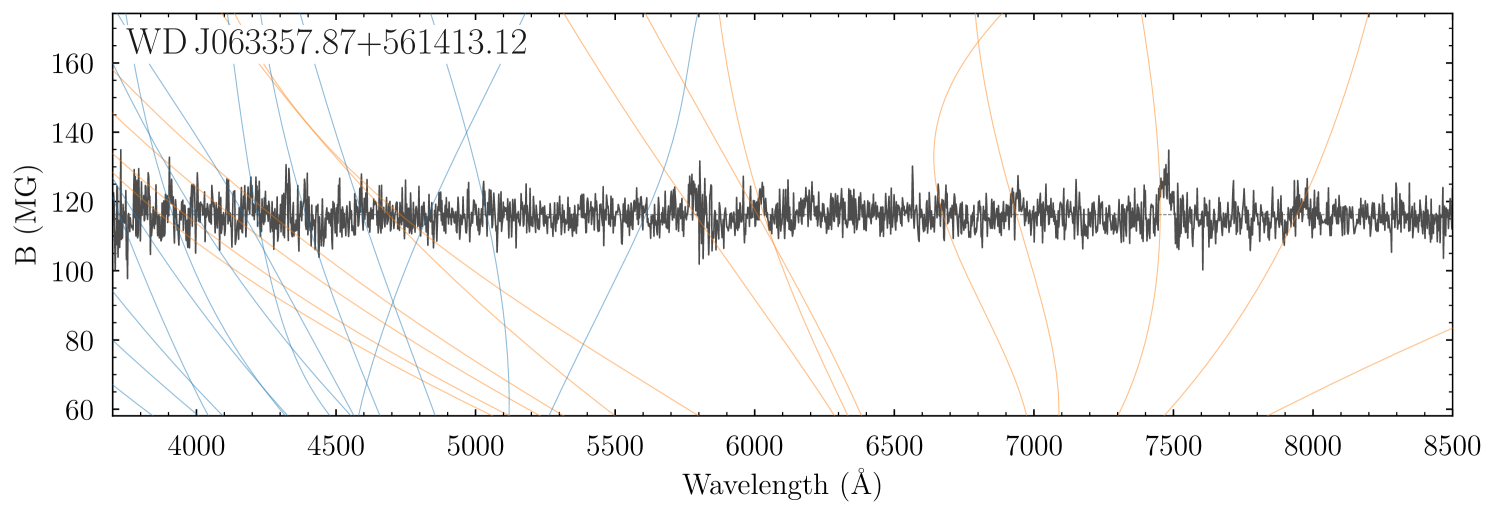
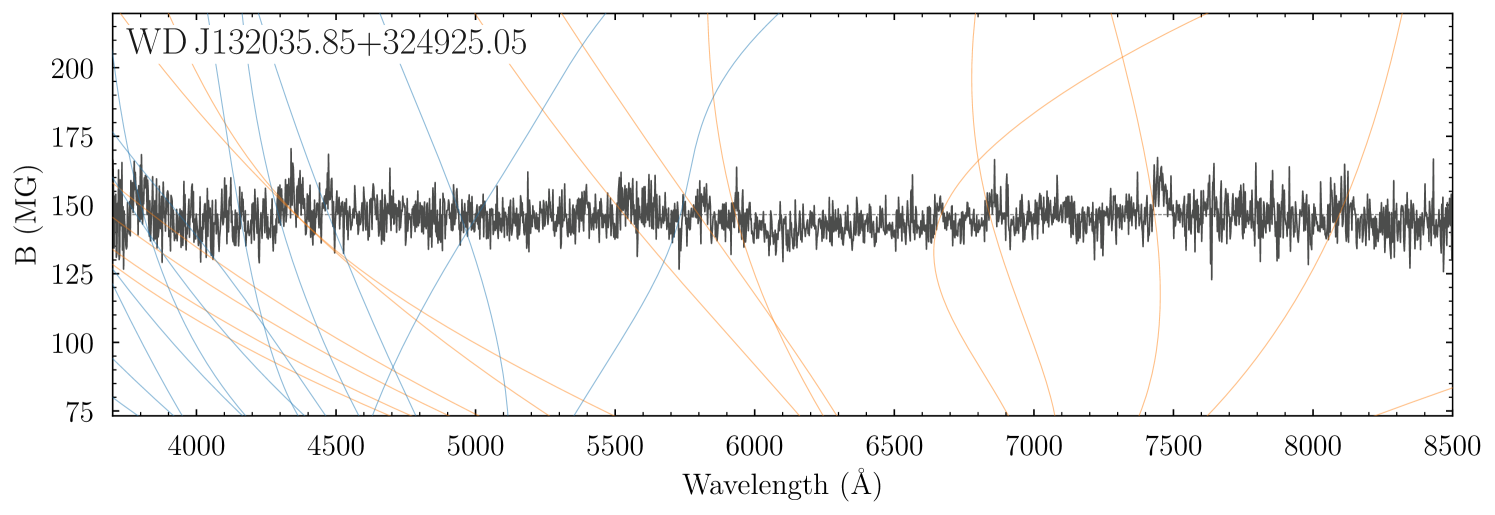
The DESI and SDSS spectra of all 20 new DAHe (in addition to WD J1616+5410) are shown in Fig. 10, where each spectrum is normalised at the value that best matches the emission features.
4.3 Periodic signals from ZTF data
We searched the ZTF data of each of the additional 20 DAHe white dwarfs and 14 candidates for periodic signals in a similar manner to the analysis of WD J1616+5410. We identified significant photometric signals for eight of the DAHe systems and one of the candidates, which are reported in Table 3. We associate most of these signals with the spin period of the white dwarf, although in some cases ambiguities between more than one photometric signal remain, and we recommend dedicated photometric follow-up to corroborate the periods detected in the ZTF data – ideally following a strategy similar to the one we used for WD J1616+5410, which proved very efficient. We were not able to identify significant periodic signals for 12 of the 21 new DAHe systems reported here, including WD J1226+1836 which is a relatively bright system with within the volume-limited 40 pc sample of white dwarfs (Tremblay et al., 2020; McCleery et al., 2020). This strongly suggests that photometric variability based searches for DAHe white dwarfs will be biased and incomplete. We propose that an unbiased, high spectroscopic survey of DC-identified white dwarfs in the region of the Gaia HRD identified by Equations 1 will provide a more complete sample of DAHe systems.
| DESI Systems | (MG) | (h) | Emission identifiable in SDSS spectrum? | |
| WD J125230.93–023417.72 | 17.46 | 5.0 | 0.09 | - |
| WD J161634.36+541011.51 | 18.24 | 6.5 | 1.59 | - |
| WD J144626.01+282600.21 | 18.22 | 7.3 | 0.75∗ | no |
| WD J175611.14+335230.75 | 17.36 | 13.6 | - | |
| WD J145207.19+325240.45 | 19.26 | 14.2 | yes | |
| WD J155807.89+381649.61 | 19.79 | 18.4 | - | |
| WD J121929.50+471522.94 | 17.53 | 18.5 | 15.26 | yes |
| WD J082337.16+383816.50 | 19.12 | 18.7 | no | |
| WD J150057.83+484002.41 | 18.65 | 19.0 | 1.42 | no |
| WD J075224.17+472422.44 | 18.53 | 21.0 | 1.21† | yes |
| WD J140916.34–000011.32 | 18.64 | 23.5 | yes | |
| WD J041926.91–011333.28 | 17.81 | 34.0 | 1.65 | - |
| WD J171101.52+654549.87 | 18.74 | 37.7 | yes | |
| WD J001319.16+240111.02 | 19.34 | 42.3 | - | |
| WD J002844.20+055931.27 | 18.48 | 45.2 | - | |
| WD J075429.35+661106.64 | 16.72 | 56.1 | 1.37 | - |
| WD J073227.97+662310.18 | 17.58 | 99.1 | 34.3 | - |
| WD J063357.87+561413.12 | 17.93 | 116 | - | |
| WD J132035.85+324925.05 | 18.60 | 147 | yes | |
| SDSS systems | ||||
| WD J011027.51–102008.82 | 17.52 | 9.3 | 6.63 / 9.16 | yes |
| WD J101949.67+114148.73 | 18.88 | 10.5 | yes | |
| WD J122619.77+183634.46 | 16.23 | 11.5 | yes | |
| WD J143657.48+210714.67 | 17.22 | 60.0 | yes | |
| DESI Candidates | ||||
| WD J004736.08–154326.57 | 17.99 | - | ||
| WD J012915.76–152430.04 | 18.51 | - | ||
| WD J031921.71–035432.96 | 18.38 | - | ||
| WD J041321.81–061330.41 | 19.65 | - | ||
| WD J043042.29+003025.69 | 19.78 | - | ||
| WD J071203.03+440710.94 | 19.33 | - | ||
| WD J073547.95+682836.51 | 18.18 | - | ||
| WD J102242.40+330550.42 | 18.70 | - | ||
| WD J112444.53+564204.17 | 18.90 | no | ||
| WD J124333.86+031737.13 | 18.58 | no | ||
| WD J125940.74+623449.82 | 17.76 | no | ||
| WD J143740.61+030900.68 | 17.57 | - | ||
| WD J165132.13+374410.33 | 18.92 | no | ||
| WD J173835.47+144120.91 | 18.69 | 8.96∗ | - |
5 Discussion
5.1 Occurrence rates of DAHe white dwarfs
We show the white dwarf cooling sequence in the Gaia HRD in Fig. 7, highlighting the location of the three previously published DAHe systems (WD J1252–0234, GD356, and WD J1219+4715), the two DAe white dwarfs (which show Balmer-line emission but no Zeeman splitting) WD J0412+7549 (Tremblay et al., 2020; Walters et al., 2021) and WD J1653–1001 (O’Brien et al., 2023), WD J1616+5410 and our additional 20 DAHe white dwarfs, as well as the 14 candidate DAHe systems. The clustering of the DAHe systems on the white dwarf cooling track is striking, and suggests that their presence in this confined parameter space is related to an evolutionary process which occurs at late ( 1 Gyr) cooling times. Previous studies have already commented on the tight clustering of the DAHe systems on the Gaia HR diagram (Gänsicke et al., 2020; Walters et al., 2021), with Schreiber et al. (2021b) suggesting that this is partially due to the onset of crystallization.
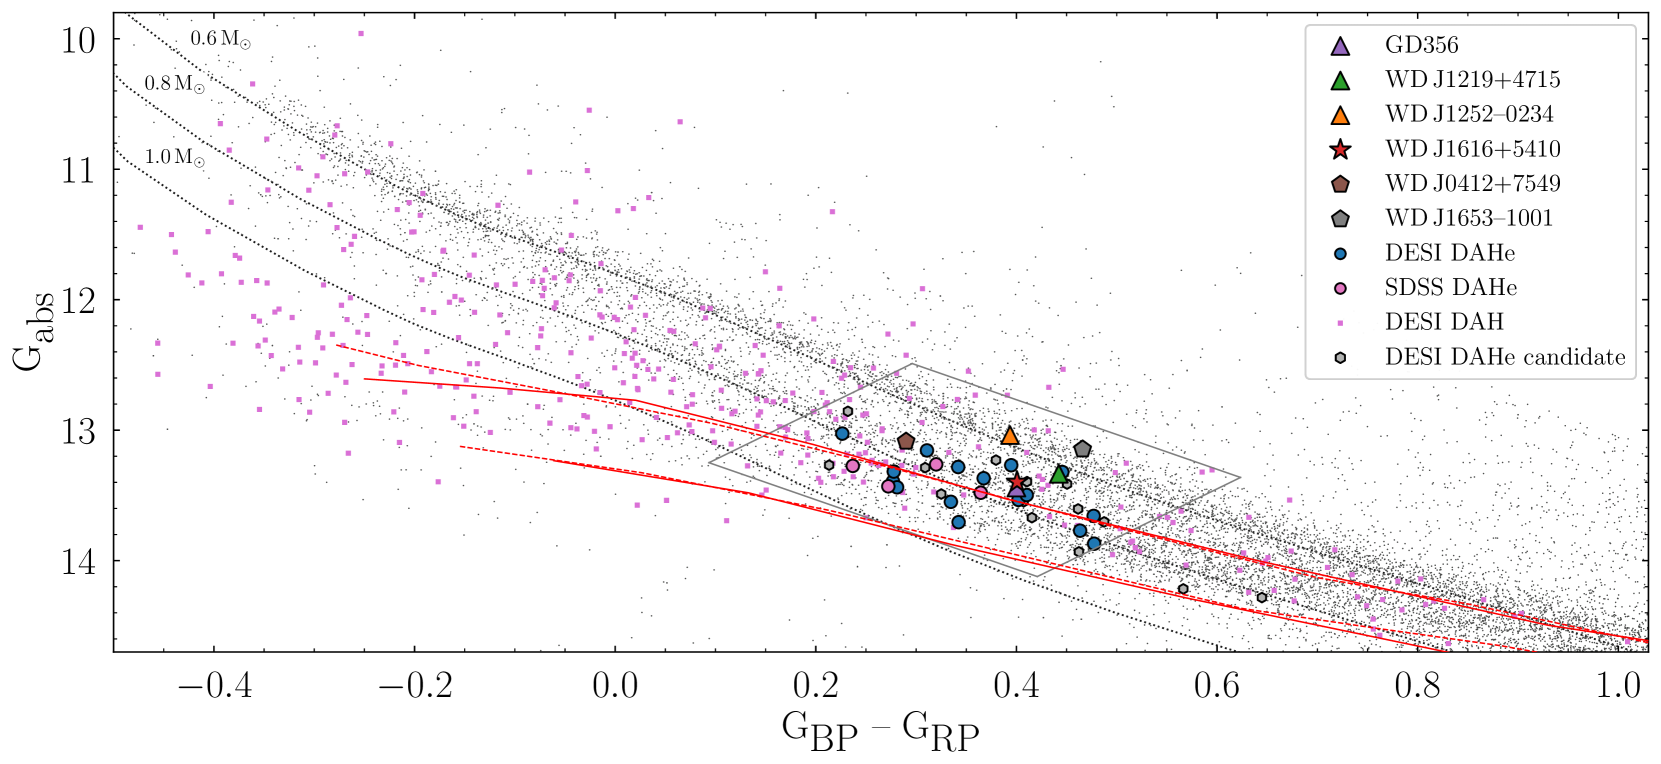
To estimate the occurrence rate of these DAHe systems within the location they cluster in, we constructed an area defined by the set of equations,
| (1) | ||||
which is depicted in Fig. 7 (we did not include the 14 DAHe candidates to constrain this region). We visually inspected the DESI EDR and DR1 spectra of 5155 white dwarf candidates contained within this area, and identified 5056 single white dwarfs, 19 white dwarfs in binaries‡‡‡This includes WD J154905.35+193132.60, a newly-identified AM CVn., 21 extra-galactic sources (e.g. quasars), 18 stellar spectra, and 41 objects for which the spectroscopy was too poor to determine their nature. Of the 5056 isolated white dwarfs, we recover the 17 new DAHe white dwarfs identified here in addition to two of the previously known systrems, WD J1252–0234 and WD J1219+4715 (Table 3). This results an occurrence rate of per cent for white dwarfs in the area defined by Equations 1 exhibiting observable Zeeman-split Balmer lines in emission, with uncertainties determined by sampling from a binomial distribution.
From our visual inspection of the 47 000 DESI EDR and DR1 white dwarf candidates we also identified 368 magnetic DA white dwarfs without Balmer line emission (DAHs)§§§Full information on these targets will be released in a future paper., of which 72 are present in the boxed region (Fig. 7). Using the same method as above, we determine an occurrence rate of DAHs without emission in the boxed region as per cent. Taking the total number of magnetic DA white dwarfs in the box (72 DAH plus 19 DAHe systems), per cent are DAHe systems.
and are strict lower limits for DAHe and DAH systems given constraints on identifying weak features, as well as possible phase-dependent emission that are not seen in the DESI exposures (e.g. spectrum #4 in Fig. 3 would be identified as a DAH rather than a DAHe). is also additionally effected by the ability to detect fields using the presence of Zeeman-splitting in Balmer absorption features below 1 MG.
To factor in the bias of detecting faint emission features at higher values, we recalculated the above occurrence rates for a series of sub-samples which had a lower limit set on in the range observed for the DAHe systems (). The number of white dwarf spectra in these sub-samples decreased from 1884 to ten. The occurrence rates are reasonably consistent over a range of , with median values and standard deviations of per cent, per cent, and per cent. We take these as the occurrence rates of DAH and DAHe from the DESI sample, although they are still likely lower limits (Table 4).
To compare against a more complete sample, we calculated the same occurrence rate of DAH and DAHe systems to isolated white dwarfs in the 40 pc volume-limited sample of white dwarfs (Tremblay et al., 2020; McCleery et al., 2020; O’Brien et al., 2023) contained in the boxed region in Fig. 7. The 40 pc sample benefits from many (but not all) white dwarfs having dedicated observations with higher compared with DESI spectroscopy. The region of interest contains 168 isolated white dwarfs of which thirteen are DAH systems, resulting in an occurrence rate of per cent. and are in rough agreement ( 2.3 difference), although the 40 pc sample has a larger occurrence rate which we attribute to the increased and spectral resolution of that sample, allowing weaker fields (i.e. narrower Zeeman splitting) to be probed. WD J1226+1836, identified here as a new DAHe system from SDSS spectra, is the second DAHe found in the 40 pc sample after GD 356 (WD J0412+7549 and WD J1653–1001 are DAe white dwarfs) and we find per cent which is in excellent agreement with . Finally, we obtain an occurrence rate of DAHe systems compared to all magnetic white dwarfs (DAHe + DAH) in the 40 pc sample in the boxed region as per cent. The 1:1 ratio of DAe:DAHe systems in the 40 pc sample is tentatively suggestive of an unidentified population of DAe systems in the spectroscopic white dwarf samples from DESI and SDSS, but identifying these is beyond the scope of this study. A summary of the occurrence rates calculated for the DESI and 40 pc samples are given in Table 4.
| Occurrence rate | DESI (per cent) | 40 pc (per cent) |
|---|---|---|
| 1.5 0.3 | 1.3 | |
| 3.4 0.5 | 8 2 | |
| 30 5 | 14 |
The occurrence rates calculated above suggest that 10 – 30 per cent of DAH systems in the boxed region show emission features, implying DAHe may be far more common than previous searches have indicated. These DAHe white dwarfs likely either form from DAH white dwarfs, where a mechanism begins to produce spectral emission features, or they form from DAs, where both the magnetic field and emission features emerge together. If DAH white dwarfs are the progenitors for DAHe systems, the origin of the emission is not necessarily a phase that all DAH white dwarfs go through, or it is a phase that is not long lived. If instead a subset of DAs transition into DAHe white dwarfs, then this channel could potentially provide up to a 45 per cent increase in magnetic hydrogen-atmosphere white dwarfs over this region of the cooling track. Schreiber et al. (2021b) recently suggested that a rotational and crystallization driven dynamo in a DA white dwarf enhanced by the accretion of planetary material could explain the presence of DAHe white dwarfs.
5.2 Discussion on the origin of DAHe systems
5.2.1 Can the late onset of DAHe white dwarfs in the Gaia HRD be explained by the production of a magnetic field from a crystallization-driven convective dynamo?
The stellar spin-up resulting from the accretion of planetary material (Stephan et al., 2020) along with the onset of crystallization setting up a convective dynamo offers a potentially plausible scenario for the appearance of magnetic Balmer emission features at a specific time in the cooling sequence of isolated white dwarfs (Isern et al., 2017; Ginzburg et al., 2022). However, recent studies have brought into question whether the convective velocities in crystallizing white dwarfs are large enough to explain the observed magnetic field strengths (Fuentes et al., 2023). Here we focus on whether the observational evidence is in agreement with a crystallization-driven dynamo generating the magnetic fields seen in DAHe systems.
Spin-up of a white dwarf and the generation of a magnetic field has been previously linked to planetary bodies through the engulfment of sub-stellar bodies in a common envelope during the red/asymptotic giant branch phases along with a common envelope driven dynamo (Siess & Livio, 1999; Farihi et al., 2011). The presence of these bodies are expected, and four such giant sub-stellar candidates that have survived the giant branch phases have already been identified around white dwarfs (Gänsicke et al., 2019; Vanderburg et al., 2020; Blackman et al., 2021; Gaia Collaboration et al., 2022). While planetary engulfment during a common envelope could explain the more rapid spin-periods and presence of a magnetic field for DAHe white dwarfs, the generation of a magnetic field during the common envelope cannot explain the the appearance of DAHe systems at late times in the Gaia HRD.
To examine the scenario that the onset of DAHe systems is in-part due to crystallization, we used the evolutionary models of Bédard et al. (2020)¶¶¶Cooling models available at http://www.astro.umontreal.ca/~bergeron/CoolingModels to determine the crystallization tracks for thick hydrogen atmospheres ( = 10-4, where is the mass of hydrogen in the white dwarf atmosphere and is the white dwarf mass) and thin hydrogen atmospheres ( = 10-10). These crystallization tracks are plotted in Fig. 7 with upper and lower bounds denoting 20 per cent and 80 per cent of the white dwarf mass being crystallized respectively, as presented in Tremblay et al. (2019).
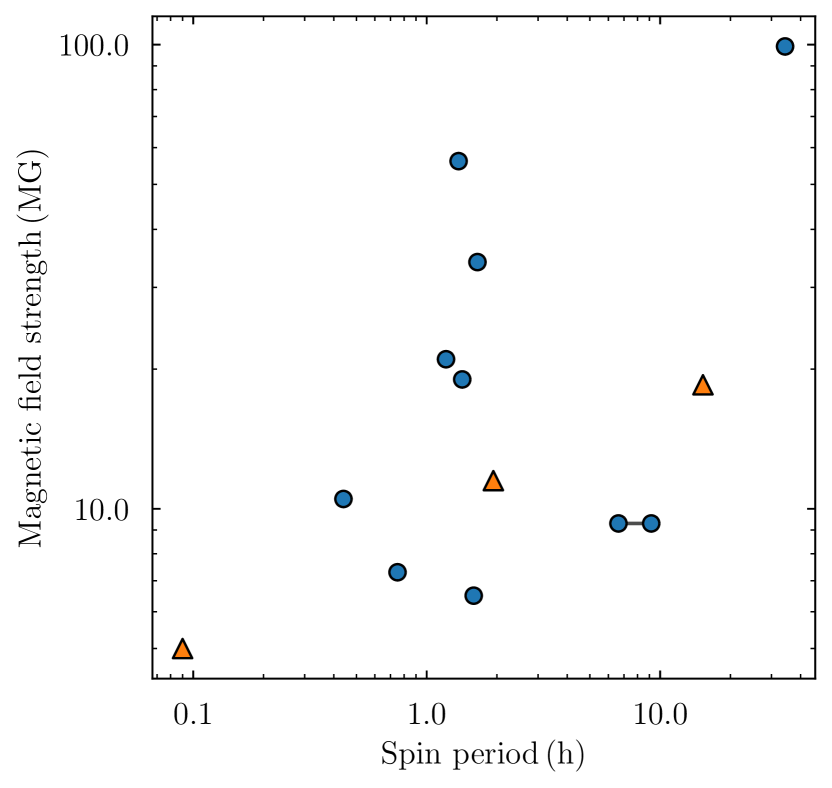
Out of the 24∥∥∥After submission of this manuscript, a preprint was posted announcing the discovery of two additional DAHe (Reding et al., 2023), bringing the number of currently known DAHe to 26. known DAHe systems, only ten fall within the region at which crystallization sets in. Furthermore, for a crystallization-driven dynamo one would expect an anti-correlation between the magnetic field strength and the spin-period of the white dwarf (see Ginzburg et al. 2022 and their fig. 4). However, the three DAHe systems identified in the literature, along with the nine DAHe systems discovered here with ZTF-determined periodic signals show a positive correlation between and (Fig. 8). This discrepancy was noted by Ginzburg et al. (2022) for the three previously known DAHe systems, and our new additions suggest an even steeper correlation between and . A caveat is that the strongest periodic signals identified from ZTF photometry may be off by a factor of two from the true rotation period (as it is the case for WD J1616+5410), however, that systematic uncertainty does not change the apparent correlation seen in Fig. 8. Photometric follow-up of the new DAHe systems presented here will eventually allow the dependence between magnetic field strength and white dwarf spin-period to be more rigorously tested.
If a crystallization and rotation driven dynamo creates the magnetic fields in these systems, then they should evolve and cool as a standard DA white dwarf until they reach the crystallization track and become magnetic. The distribution of DAHe systems appear to more closely match the distribution of DAH white dwarfs in the boxed region of the Gaia HRD (which are thought to have masses that clusters around = 0.8 identified from the magnitude limited sample of SDSS white dwarfs, Ferrario et al. 2020), rather than the canonical DA cooling track for = 0.6 . This would suggest that the progenitors of DAHe systems are more likely to be similar to DAHs rather than DAs. However, it is also likely that these DAHe systems have radiative atmospheres, as convection should be inhibited by the presence of a strong magnetic field (Gentile Fusillo et al., 2018; Gänsicke et al., 2020). The resulting differences in the structures of their atmospheres can alter their spectral energy distribution and shift their location on the Gaia HRD compared to a standard, non-magnetic, DA white dwarf. Mismatches between and spectral energy distributions determined from ultraviolet and optical spectra have also been observed for magnetic white dwarfs (Schmidt et al., 1986; Gänsicke et al., 2001). In conclusion, the currently available data and theoretical models cannot unambiguously constrain whether crystallization can ubiquitously explain the emergence of DAHe white dwarfs. Further work on these systems, in particular measuring their spin-periods and understanding their location on the Gaia HRD are needed to investigate the crystallization-driven dynamo as a universal origin mechanism for the DAHe systems.
5.2.2 What is the generation mechanism for emission in DAHe white dwarfs?
Whether or not a crystallization-driven convective dynamo can explain the onset of a magnetic field in these DAHe systems, an additional mechanism is needed to produce the observed Zeeman-split emission features. Observations show that these emission features are produced by optically thin hot-spots co-located with regions on the white dwarf surface that are darker in the continuum. The unipolar inductor model, whereby a close-in conductive body heats up the white dwarf atmosphere, has been invoked to explain the temperature inverted hot-spot creating the emission feature seen in spectroscopy (Goldreich & Lynden-Bell, 1969; Li et al., 1998; Wickramasinghe et al., 2010). The model has also been used to explain the apparent cutoff in the Gaia HRD of DAHe systems by a natural lifetime put in place on the conducting planetary body through Lorentz drift (Veras & Wolszczan, 2019; Gänsicke et al., 2020). However, Walters et al. (2021) argue that the rapid stellar rotation periods inhibit current carriers from reaching the white dwarf and therefore heating the surface. Additionally, these white dwarfs do not exhibit metal absorption features indicative of the accretion of planetary material (Koester et al., 1997; Jura, 2003). However, an absence of photospheric metal absorption features has been observed in the magnetic white dwarfs in polar-type cataclysmic variables (Gänsicke et al., 2006b), which are definitively actively accreting. The lack of photospheric metals in polars is explained by the fact that the strong magnetic fields inhibit horizontal spreading of material before it sinks below the photosphere. In contrast, non-magnetic cataclysmic variables do all show clearly detectable metal features in their spectra (Sion et al., 1995; Gänsicke & Beuermann, 1996; Pala et al., 2017). Furthermore, as these DAHe white dwarfs may have radiative atmospheres, horizontal spreading would also be suppressed when compared to white dwarfs with convective atmospheres (Cunningham et al., 2021), so the lack of photospheric metal absorption features is not necessarily indicative of a lack of accretion.
Another scenario that has been suggested to explain the occurrence of DAHe white dwarfs is the presence of a chromosphere and chromospheric activity in these white dwarfs (Musielak et al., 2005; Walters et al., 2021). Finally, Bagnulo & Landstreet (2022) observe an increase in the occurrence of magnetic white dwarfs in the volume-limited 40 pc sample over the first 2 - 3 Gyr, where the authors suggest these fields are left over from earlier stages in evolution and may emerge at later times. While this range roughly overlaps the onset of DAHe white dwarfs, and would potentially explain their delayed generation, further work is needed to explain the increase in the occurrence of magnetic fields with white dwarfs in time, and a possible link to DAHe white dwarfs.
6 Conclusion
Even though GD 356, the first DAHe system, was discovered over 30 years ago (Greenstein & McCarthy, 1985), the physical origin of these systems remains uncertain. We provide detailed follow-up of a new DAHe with multi-epoch DESI spectroscopy, WD J1616+5410, where we identify photometric variability on a 95.3 min period, and a magnetic field which varies between MG. As it has been observed among the previously known DAHe white dwarfs, the brightness of WD J1616+5410 varies in anti-phase with the strength of the emission features and the observed average magnetic field strength across the observable hemisphere. This suggests that a photospheric dark spot, and an optically-thin temperature-inverted hot-spot are co-located close to or at the magnetic poles.
We have identified a sample of 21 DAHe systems from the DESI survey and the SDSS, providing a significant increase in the number of these enigmatic sources known and confirming their clustering at late cooling times on the Gaia HRD. We calculate occurrence rates for these systems using the magnitude-limited DESI sample and the volume-limited 40 pc sample of white dwarfs, which suggest that 1 per cent of white dwarfs are classed as DAHe in the region of the Gaia HRD where they cluster, and 10 - 30 per cent of DAH white dwarfs within the same region exhibit Balmer line emission. Given ten DAHe systems are identifiable from archival SDSS spectroscopy, nine of which were previously classified as DC white dwarfs, an unbiased, high survey of DC white dwarfs in the boxed region of Fig. 7 may reveal more DAHe systems that are currently below the detection threshold. As only nine of our 21 DAHe systems have detectable periodic signals from ZTF data, searches based on photometric variability are likely to provide a biased sample of systems. Whether or not a crystallization and rotation driven dynamo can create DAHe white dwarfs is not distinguishable using the currently available data, and further theoretical work is required to confidently exclude this evolutionary channel. Spectroscopic and photometric follow-up of these newly identified DAHe white dwarfs will aid the understanding and characterisation of these systems.
Acknowledgements
We thank the referee John Landstreet, whose insightful comments improved the quality of this manuscript. We thank Elena Cukanovaite for insightful discussions and Mairi O’Brien for sharing data on the 40 pc volume-limited white dwarf sample. The authors acknowledge financial support from Imperial College London through an Imperial College Research Fellowship grant awarded to CJM. This project has received funding from the European Research Council (ERC) under the European Union’s Horizon 2020 research and innovation programme (Grant agreement No. 101020057). BTG was supported by the UK STFC grant ST/T000406/1. This research was supported in part by the National Science Foundation under Grant No. PHY-1748958.
Based on observations obtained with the Samuel Oschin Telescope 48-inch and the 60-inch Telescope at the Palomar Observatory as part of the Zwicky Transient Facility project. ZTF is supported by the National Science Foundation under Grants No. AST-1440341 and AST-2034437 and a collaboration including current partners Caltech, IPAC, the Weizmann Institute for Science, the Oskar Klein Center at Stockholm University, the University of Maryland, Deutsches Elektronen-Synchrotron and Humboldt University, the TANGO Consortium of Taiwan, the University of Wisconsin at Milwaukee, Trinity College Dublin, Lawrence Livermore National Laboratories, IN2P3, University of Warwick, Ruhr University Bochum, Northwestern University and former partners the University of Washington, Los Alamos National Laboratories, and Lawrence Berkeley National Laboratories. Operations are conducted by COO, IPAC, and UW.
The Liverpool Telescope is operated on the island of La Palma by Liverpool John Moores University in the Spanish Observatorio del Roque de los Muchachos of the Instituto de Astrofisica de Canarias with financial support from the UK Science and Technology Facilities Council.
This research is supported by the Director, Office of Science, Office of High Energy Physics of the U.S. Department of Energy under Contract No. DE–AC02–05CH11231, and by the National Energy Research Scientific Computing Center, a DOE Office of Science User Facility under the same contract; additional support for DESI is provided by the U.S. National Science Foundation, Division of Astronomical Sciences under Contract No. AST-0950945 to the NSF’s National Optical-Infrared Astronomy Research Laboratory; the Science and Technologies Facilities Council of the United Kingdom; the Gordon and Betty Moore Foundation; the Heising-Simons Foundation; the French Alternative Energies and Atomic Energy Commission (CEA); the National Council of Science and Technology of Mexico (CONACYT); the Ministry of Science and Innovation of Spain (MICINN), and by the DESI Member Institutions: https://www.desi.lbl.gov/collaborating-institutions.
The authors are honored to be permitted to conduct scientific research on Iolkam Du’ag (Kitt Peak), a mountain with particular significance to the Tohono O’odham Nation.
Data availability
Spectroscopy from the SDSS and photometry from ZTF are available from their respective public archives. Data presented here along with the Python scripts used to produce the figures in this manuscript are available at https://zenodo.org/record/7581523#.Y9aAX1LP3Ah.
References
- Abdurro’uf et al. (2022) Abdurro’uf et al., 2022, ApJS, 259, 35
- Achilleos & Wickramasinghe (1989) Achilleos N., Wickramasinghe D. T., 1989, ApJ, 346, 444
- Achilleos et al. (1992) Achilleos N., Wickramasinghe D. T., Liebert J., Saffer R. A., Grauer A. D., 1992, ApJ, 396, 273
- Allende Prieto et al. (2020) Allende Prieto C., et al., 2020, Research Notes of the American Astronomical Society, 4, 188
- Angel & Landstreet (1970) Angel J. R. P., Landstreet J. D., 1970, ApJ, 160, L147
- Angel et al. (1974) Angel J. R. P., Carswell R. F., Strittmatter P. A., Beaver E. A., Harms R., 1974, ApJ, 194, L47
- Astropy Collaboration et al. (2013) Astropy Collaboration et al., 2013, A&A, 558, A33
- Astropy Collaboration et al. (2018) Astropy Collaboration et al., 2018, AJ, 156, 123
- Astropy Collaboration et al. (2022) Astropy Collaboration et al., 2022, ApJ, 935, 167
- Aznar Cuadrado et al. (2004) Aznar Cuadrado R., Jordan S., Napiwotzki R., Schmid H. M., Solanki S. K., Mathys G., 2004, A&A, 423, 1081
- Bagnulo & Landstreet (2020) Bagnulo S., Landstreet J. D., 2020, A&A, 643, A134
- Bagnulo & Landstreet (2021) Bagnulo S., Landstreet J. D., 2021, MNRAS, 507, 5902
- Bagnulo & Landstreet (2022) Bagnulo S., Landstreet J. D., 2022, ApJ, 935, L12
- Bailey et al. (1991) Bailey J., Ferrario L., Wickramasinghe D. T., 1991, MNRAS, 251, 37P
- Bédard et al. (2020) Bédard A., Bergeron P., Brassard P., Fontaine G., 2020, ApJ, 901, 93
- Bellm et al. (2019) Bellm E. C., et al., 2019, PASP, 131, 018002
- Berdyugin et al. (2022) Berdyugin A. V., Piirola V., Bagnulo S., Landstreet J. D., Berdyugina S. V., 2022, A&A, 657, A105
- Berdyugin et al. (2023) Berdyugin A. V., Piirola V., Bagnulo S., Landstreet J. D., Berdyugina S. V., 2023, A&A, 670, A2
- Bertin & Arnouts (1996) Bertin E., Arnouts S., 1996, A&AS, 117, 393
- Blackman et al. (2021) Blackman J. W., et al., 2021, Nature, 598, 272
- Blanton et al. (2017) Blanton M. R., et al., 2017, AJ, 154, 28
- Brinkworth et al. (2004) Brinkworth C. S., Burleigh M. R., Wynn G. A., Marsh T. R., 2004, MNRAS, 348, L33
- Campbell et al. (2008) Campbell R. K., Harrison T. E., Schwope A. D., Howell S. B., 2008, ApJ, 672, 531
- Chaussidon et al. (2022) Chaussidon E., et al., 2022, arXiv e-prints, p. arXiv:2208.08511
- Cooper et al. (2022) Cooper A. P., et al., 2022, arXiv e-prints, p. arXiv:2208.08514
- Cunningham et al. (2021) Cunningham T., et al., 2021, MNRAS, 503, 1646
- Cunningham et al. (2022) Cunningham T., Wheatley P. J., Tremblay P.-E., Gänsicke B. T., King G. W., Toloza O., Veras D., 2022, Nature, 602, 219
- DESI Collaboration et al. (2016a) DESI Collaboration et al., 2016a, preprint, (arXiv:1611.00036)
- DESI Collaboration et al. (2016b) DESI Collaboration et al., 2016b, preprint, (arXiv:1611.00037)
- DESI Collaboration et al. (2022) DESI Collaboration et al., 2022, arXiv e-prints, p. arXiv:2205.10939
- Eisenstein et al. (2006) Eisenstein D. J., et al., 2006, ApJS, 167, 40
- Eisenstein et al. (2011) Eisenstein D. J., et al., 2011, AJ, 142, 72
- Farihi et al. (2011) Farihi J., Dufour P., Napiwotzki R., Koester D., 2011, MNRAS, 413, 2559
- Ferrario et al. (1997) Ferrario L., Vennes S., Wickramasinghe D. T., Bailey J. A., Christian D. J., 1997, MNRAS, 292, 205
- Ferrario et al. (2015) Ferrario L., de Martino D., Gänsicke B. T., 2015, Space Sci. Rev., 191, 111
- Ferrario et al. (2020) Ferrario L., Wickramasinghe D., Kawka A., 2020, Advances in Space Research, 66, 1025
- Fuentes et al. (2023) Fuentes J. R., Cumming A., Castro-Tapia M., Anders E. H., 2023, arXiv e-prints, p. arXiv:2301.04273
- Fuller & Mathis (2023) Fuller J., Mathis S., 2023, MNRAS,
- Gaia Collaboration et al. (2022) Gaia Collaboration et al., 2022, arXiv e-prints, p. arXiv:2206.05595
- Gänsicke & Beuermann (1996) Gänsicke B. T., Beuermann K., 1996, A&A, 309, L47
- Gänsicke et al. (2001) Gänsicke B. T., Schmidt G. D., Jordan S., Szkody P., 2001, ApJ, 555, 380
- Gänsicke et al. (2006a) Gänsicke B. T., Marsh T. R., Southworth J., Rebassa-Mansergas A., 2006a, Science, 314, 1908
- Gänsicke et al. (2006b) Gänsicke B. T., Long K. S., Barstow M. A., Hubeny I., 2006b, ApJ, 639, 1039
- Gänsicke et al. (2019) Gänsicke B. T., Schreiber M. R., Toloza O., Fusillo N. P. G., Koester D., Manser C. J., 2019, Nature, 576, 61
- Gänsicke et al. (2020) Gänsicke B. T., Rodríguez-Gil P., Gentile Fusillo N. P., Inight K., Schreiber M. R., Pala A. F., Tremblay P.-E., 2020, MNRAS, 499, 2564
- García-Berro et al. (2012) García-Berro E., et al., 2012, ApJ, 749, 25
- Gentile Fusillo et al. (2018) Gentile Fusillo N. P., Tremblay P. E., Jordan S., Gänsicke B. T., Kalirai J. S., Cummings J., 2018, MNRAS, 473, 3693
- Gentile Fusillo et al. (2019) Gentile Fusillo N. P., et al., 2019, MNRAS, 482, 4570
- Ginzburg et al. (2022) Ginzburg S., Fuller J., Kawka A., Caiazzo I., 2022, MNRAS, 514, 4111
- Goldreich & Lynden-Bell (1969) Goldreich P., Lynden-Bell D., 1969, ApJ, 156, 59
- Greenstein (1974) Greenstein J. L., 1974, ApJ, 194, L51
- Greenstein & McCarthy (1985) Greenstein J. L., McCarthy J. K., 1985, ApJ, 289, 732
- Gunn et al. (2006) Gunn J. E., et al., 2006, AJ, 131, 2332
- Guy et al. (2022) Guy J., et al., 2022, arXiv e-prints, p. arXiv:2209.14482
- Hahn et al. (2019) Hahn S., et al., 2019, Nature, 570, 496
- Hahn et al. (2022) Hahn C., et al., 2022, arXiv e-prints, p. arXiv:2208.08512
- Harris et al. (2003) Harris H. C., et al., 2003, AJ, 126, 1023
- Henry & O’Connell (1985) Henry R. J. W., O’Connell R. F., 1985, PASP, 97, 333
- Hermes et al. (2017) Hermes J. J., et al., 2017, ApJS, 232, 23
- Isern et al. (2017) Isern J., García-Berro E., Külebi B., Lorén-Aguilar P., 2017, ApJ, 836, L28
- Jordan et al. (2007) Jordan S., Aznar Cuadrado R., Napiwotzki R., Schmid H. M., Solanki S. K., 2007, A&A, 462, 1097
- Jura (2003) Jura M., 2003, ApJ Lett., 584, L91
- Kawka & Vennes (2006) Kawka A., Vennes S., 2006, ApJ, 643, 402
- Kemp et al. (1970) Kemp J. C., Swedlund J. B., Landstreet J. D., Angel J. R. P., 1970, ApJ, 161, L77
- Kepler et al. (2015) Kepler S. O., et al., 2015, MNRAS, 446, 4078
- Kepler et al. (2016) Kepler S. O., et al., 2016, MNRAS, 455, 3413
- Kleinman et al. (2013) Kleinman S. J., et al., 2013, ApJS, 204, 5
- Koester et al. (1997) Koester D., Provencal J., Shipman H. L., 1997, A&A, 320, L57
- Külebi et al. (2009) Külebi B., Jordan S., Euchner F., Gänsicke B. T., Hirsch H., 2009, A&A, 506, 1341
- Landstreet (1967) Landstreet J. D., 1967, Physical Review, 153, 1372
- Landstreet & Bagnulo (2019) Landstreet J. D., Bagnulo S., 2019, A&A, 623, A46
- Lauterbur (1973) Lauterbur P. C., 1973, Nature, 242, 190
- Li et al. (1998) Li J., Ferrario L., Wickramasinghe D., 1998, ApJ, 503, L151
- Lomb (1976) Lomb N. R., 1976, Ap&SS, 39, 447
- Martin & Wickramasinghe (1984) Martin B., Wickramasinghe D. T., 1984, MNRAS, 206, 407
- Masci et al. (2019) Masci F. J., et al., 2019, PASP, 131, 018003
- McCleery et al. (2020) McCleery J., et al., 2020, MNRAS, 499, 1890
- McCook & Sion (1999) McCook G. P., Sion E. M., 1999, ApJS, 121, 1
- Musielak et al. (2005) Musielak Z. E., Winget D. E., Montgomery M. H., 2005, ApJ, 630, 506
- Nordhaus et al. (2011) Nordhaus J., Wellons S., Spiegel D. S., Metzger B. D., Blackman E. G., 2011, Proceedings of the National Academy of Science, 108, 3135
- O’Brien et al. (2023) O’Brien M. W., et al., 2023, MNRAS, 518, 3055
- Olausen & Kaspi (2014) Olausen S. A., Kaspi V. M., 2014, ApJS, 212, 6
- Pala et al. (2017) Pala A. F., et al., 2017, MNRAS, 466, 2855
- Preston (1970) Preston G. W., 1970, ApJ, 160, L143
- Raichoor et al. (2020) Raichoor A., et al., 2020, Research Notes of the American Astronomical Society, 4, 180
- Raichoor et al. (2022) Raichoor A., et al., 2022, arXiv e-prints, p. arXiv:2208.08513
- Reding et al. (2020) Reding J. S., Hermes J. J., Vanderbosch Z., Dennihy E., Kaiser B. C., Mace C. B., Dunlap B. H., Clemens J. C., 2020, ApJ, 894, 19
- Reding et al. (2023) Reding J. S., Hermes J. J., Clemens J. C., Hegedus R. J., Kaiser B. C., 2023, arXiv e-prints, p. arXiv:2302.10207
- Regős & Tout (1995) Regős E., Tout C. A., 1995, MNRAS, 273, 146
- Ruiz-Macias et al. (2020) Ruiz-Macias O., et al., 2020, Research Notes of the American Astronomical Society, 4, 187
- Scargle (1982) Scargle J. D., 1982, ApJ, 263, 835
- Schimeczek & Wunner (2014a) Schimeczek C., Wunner G., 2014a, Computer Physics Communications, 185, 614
- Schimeczek & Wunner (2014b) Schimeczek C., Wunner G., 2014b, ApJS, 212, 26
- Schmidt et al. (1986) Schmidt G. D., West S. C., Liebert J., Green R. F., Stockman H. S., 1986, ApJ, 309, 218
- Schmidt et al. (2003) Schmidt G. D., et al., 2003, ApJ, 595, 1101
- Schreiber et al. (2021a) Schreiber M. R., Belloni D., Gänsicke B. T., Parsons S. G., Zorotovic M., 2021a, Nature Astronomy, 5, 648
- Schreiber et al. (2021b) Schreiber M. R., Belloni D., Gänsicke B. T., Parsons S. G., 2021b, MNRAS, 506, L29
- Schreiber et al. (2022) Schreiber M. R., Belloni D., Zorotovic M., Zapata S., Gänsicke B. T., Parsons S. G., 2022, MNRAS, 513, 3090
- Schwope et al. (1990) Schwope A. D., Beuermann K., Thomas H. C., 1990, A&A, 230, 120
- Siess & Livio (1999) Siess L., Livio M., 1999, MNRAS, 308, 1133
- Sion et al. (1995) Sion E. M., Szkody P., Cheng F., Huang M., 1995, ApJ Lett., 444, L97
- Steele et al. (2004) Steele I. A., et al., 2004, in Oschmann Jacobus M. J., ed., Society of Photo-Optical Instrumentation Engineers (SPIE) Conference Series Vol. 5489, Ground-based Telescopes. pp 679–692, doi:10.1117/12.551456
- Stephan et al. (2020) Stephan A. P., Naoz S., Gaudi B. S., Salas J. M., 2020, ApJ, 889, 45
- Stephan et al. (2021) Stephan A. P., Naoz S., Gaudi B. S., 2021, ApJ, 922, 4
- Tout et al. (2004) Tout C. A., Wickramasinghe D. T., Ferrario L., 2004, MNRAS, 355, L13
- Tout et al. (2008) Tout C. A., Wickramasinghe D. T., Liebert J., Ferrario L., Pringle J. E., 2008, MNRAS, 387, 897
- Tremblay et al. (2019) Tremblay P.-E., et al., 2019, Nature, 565, 202
- Tremblay et al. (2020) Tremblay P. E., et al., 2020, MNRAS, 497, 130
- Truemper et al. (1978) Truemper J., Pietsch W., Reppin C., Voges W., Staubert R., Kendziorra E., 1978, ApJ, 219, L105
- Vanderburg et al. (2015) Vanderburg A., et al., 2015, Nat, 526, 546
- Vanderburg et al. (2020) Vanderburg A., et al., 2020, Nature, 585, 363
- Veras & Wolszczan (2019) Veras D., Wolszczan A., 2019, MNRAS, 488, 153
- Visvanathan & Wickramasinghe (1981) Visvanathan N., Wickramasinghe D. T., 1981, MNRAS, 196, 275
- Walters et al. (2021) Walters N., et al., 2021, MNRAS, 503, 3743
- Wickramasinghe & Ferrario (2000) Wickramasinghe D. T., Ferrario L., 2000, PASP, 112, 873
- Wickramasinghe et al. (2010) Wickramasinghe D. T., Farihi J., Tout C. A., Ferrario L., Stancliffe R. J., 2010, MNRAS, 404, 1984
- Wickramasinghe et al. (2014) Wickramasinghe D. T., Tout C. A., Ferrario L., 2014, MNRAS, 437, 675
- Woltjer (1964) Woltjer L., 1964, ApJ, 140, 1309
- Yèche et al. (2020) Yèche C., et al., 2020, Research Notes of the American Astronomical Society, 4, 179
- York et al. (2000) York D. G., et al., 2000, AJ, 120, 1579
- Zhou et al. (2020) Zhou R., et al., 2020, Research Notes of the American Astronomical Society, 4, 181
- Zhou et al. (2022) Zhou R., et al., 2022, arXiv e-prints, p. arXiv:2208.08515
- Zuckerman & Becklin (1987) Zuckerman B., Becklin E. E., 1987, Nat, 330, 138
- Zuckerman et al. (2003) Zuckerman B., Koester D., Reid I. N., Hünsch M., 2003, ApJ, 596, 477
- van Horn (1968) van Horn H. M., 1968, ApJ, 151, 227
Appendix A Multi-epoch spectroscopy of WD J1616+5410
The 13 spectra obtained for WD J1616+5410 are presented here (Fig. 9).
Appendix B Spectra of DAHe white dwarfs observed by DESI and SDSS
Provided here are the spectra of DAHe systems observed by DESI and SDSS (Table 3), with estimated field strengths (Fig. 10).