Laser-induced Cavitation for Controlling Crystallization from Solution
Abstract
We demonstrate that a cavitation bubble initiated by a Nd:YAG laser pulse below breakdown threshold induces crystallization from supersaturated aqueous solutions with supersaturation and laser-energy dependent nucleation kinetics. Combining high-speed video microscopy and simulations, we argue that a competition between the dissipation of absorbed laser energy as latent and sensible heat dictates the solvent evaporation rate and creates a momentary supersaturation peak at the vapor-liquid interface. The number and morphology of crystals correlate to the characteristics of the simulated supersaturation peak.
Controlling crystallization from solution, which is central to technological applications ranging from nanomaterial synthesis to pharmaceutical manufacturing [1, 2, 3], is still challenging our understanding of nucleation [4, 5, 6]. Among the strategies proposed to control kinetics and emerging crystal properties [7, 8, 9], non-photochemical laser-induced nucleation (NPLIN), where one or more unfocused laser pulses trigger accelerated nucleation in supersaturated solutions [10, 11, 12], emerged as a promising approach due to its presumed non-chemical nature and ability to influence polymorphic form [13, 14]. At the reported laser pulse duration (ns), wavelengths (532/1064 nm) and laser intensity (MW/cm2), neither the solute nor the solvent have sufficiently strong absorption bands to induce photochemical effects. Several putative mechanistic hypotheses, ranging from molecular phenomena relying on (an)isotropic polarization and isotropic electronic polarizability of solute clusters [15] to microscale phenomena based on impurity heating and consequent cavitation, have been proposed in an attempt to explain the observations [16]. However, the exact mechanism behind NPLIN remains elusive [16].
Transient micro vapor bubbles can be created in liquid environments with the absorption of laser pulses by dyes [17] and nanoparticles [18, 19]. The impurity heating hypothesis suggests that laser energy absorbed by inherent insoluble impurities (such as nanoparticles) locally evaporates its surrounding solvent - consequently triggering solute nucleation. However, no direct measurements of this hypothesized phenomenon was reported. Most reported NPLIN experiments only quantify the crystallization probability seconds to minutes after laser irradiation [20]. Moreover, the large exposed volumes [] and uncertainties in concentration and chemical nature of impurities limit the observation of micron-sized cavitation bubbles within microseconds after laser irradiation. Thus the attempts to test the impurity heating hypothesis using numerical modeling have had limited success due to lack of concomitant experimental data [21].
In this work, using high-speed microscopy experiments and 1D finite element simulations, we demonstrate that a momentary supersaturation rise surrounding a laser-induced cavitation bubble can trigger crystallization in supersaturated aqueous solutions of potassium chloride (\chKCl). We use a frequency-doubled Nd:YAG pulsed laser with 532 nm wavelength and 4 ns pulse duration. Unlike the traditional NPLIN experiments, we focus the laser to fix the location of bubble formation and intentionally dope the solution with a light-absorbing soluble impurity. 3.26 mg potassium permanganate (\chKMnO4) per 100 g water, is added to facilitate bubble formation below the optical breakdown threshold via thermocavitation [22] (see SI [23]). The laser focal spot resembles an impurity being heated up and a consequent cavitation bubble formation, establishing the connection between NPLIN experiments conducted with unfocussed laser and this study. The added \chKMnO4 is comparable to the impurities level in traditional NPLIN experiments [] [24], and therefore does not alter the solubility of \chKCl (see SII [23]). Thus, this work differentiates itself from cavitation-induced crystallization experiments via multiphoton absorption using focused ultrashort laser pulse (fs) that might involve photochemistry [25]. Moreover, it captures the size of cavitation bubbles [m)] [19] surrounding the nanoparticles for the inferred magnitude of laser energies and impurity sizes in NPLIN experiments [24] (see SIII [23] for calculations).
We perform experiments to record the size of the vapor bubbles created, the resulting number and morphology of crystal(s) formed, and the cumulative nucleation probability at a fixed time lag. Subsequently, using simulations, we estimate the local temperature, solute concentration, and solute supersaturation surrounding the bubble to complement the experiments. The quantitative agreement between experimental and simulated bubble dynamics validates the proposed model. Leveraging the model, we argue that a competition between the dissipation of absorbed laser energy as latent and sensible heat dictates the instantaneous solvent evaporation rate. A spike in evaporation rate during the cavitation bubble expansion creates a momentary supersaturation peak at the vapor-liquid interface (hereinafter referred to as “interface”). The experimentally acquired nucleation probabilities, number, and morphology of crystals formed correlate with the characteristics of the short-lived [] supersaturation peak surrounding the bubble from simulations. For the first time, we quantitatively correlate the likelihood of crystal formation due to an increase in the solute concentration at the interface through laser-induced bubble formation with no expected photochemical reaction.
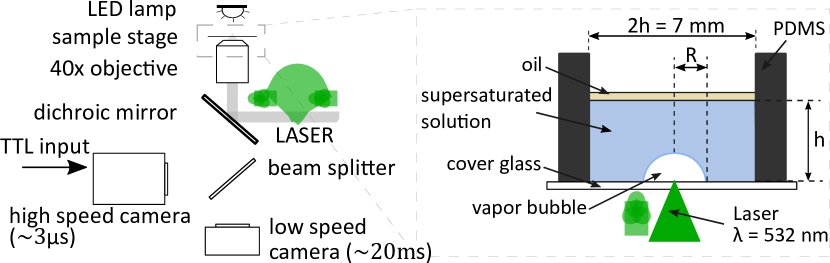
In our experiments, KCl solutions with a supersaturation range of were used (solubility = 35.97 g/100 g-\chH2O at C) with no pre-treatment for dissolved gases or filtration. A 40× objective (numerical aperture=0.6) is employed to both focus the laser and image the sample. Fig. 1 shows the architecture of the inverted microscope which employs two cameras: a high-speed camera operated at 330,000 frames per second (fps) to record the evolution of the bubble size and a low-speed camera operated at 50 fps which records the appearance of crystals. A 1.23 mm layer of silicone oil (density = kg/m3) floating on top of the supersaturated solution prevents evaporation of the solution. The laser is focused to a point within m above the bottom surface (cover glass). The standoff distance to the bottom surface is maintained below 0.05 to prevent surface erosion [27]. In addition, all formed hemispherical bubbles in this work have, , to prevent the effect of side walls on the bubble dynamics [28]. Thus the cover glass acts as a plane of symmetry for the semi-unbounded fluid surrounding the hemispherical bubble, allowing us to analyze the bubble as spherically unbound - a 3D bubble. Since the negatively buoyant crystals sediment to the bottom, the adapted experimental technique allows in-situ recording of both the bubble and crystal(s).
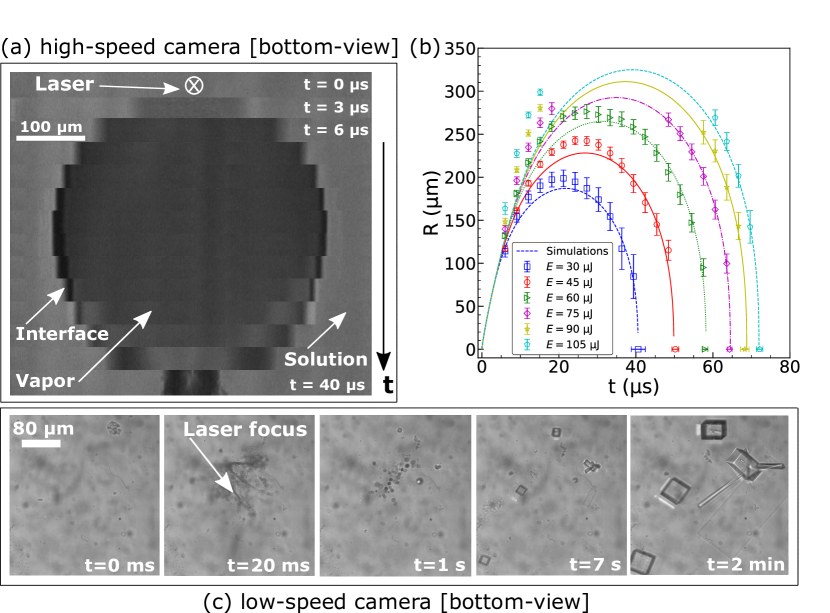
Figure 2(a) depicts the primary bubble formation, its subsequent expansion, and collapse immediately after laser irradiation. The primary bubble then disintegrates into secondary bubbles followed by the emergence of crystals surrounding the laser focal point (Fig. 2(c)). After the primary bubble collapsed, we also observe a complex flow pattern that transports secondary bubbles and crystals. The direction of the resulting flow was observed to be random, consistent with previous observations [29]. Figure 2(b) displays a clear increase in the maximum radius () and bubble lifetime with the supplied laser energy (). For details on the experimental methodology and validity of the bubble shape, see SIV [23].
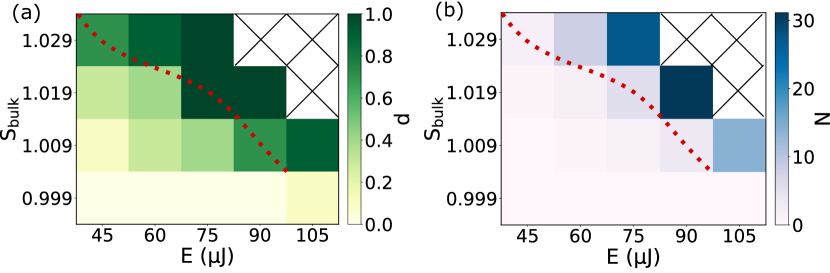
We quantify crystallization by plotting nucleation probability and crystal count for varying laser energy and supersaturation in the bulk, Fig. 3. The cumulative nucleation probability () is defined as the number of trials that resulted in crystal formation two minutes after laser irradiation to the number of trials performed. Overall, the nucleation probability increases with increasing laser energy and solution supersaturation in the bulk (). From Fig. 3(a), we observe a minimum threshold laser energy for crystal formation related to and vice versa, an observation repeatedly reported in NPLIN experiments [20]. We recorded a very low crystallization probability () for roughly saturated solution () as the lack of supersaturation would inhibit crystal growth. We attribute the non-zero value to the uncertainty in pertaining to the variation in room temperature (C). No experiment was performed beyond as it was difficult to keep the solution stable during handling. In Fig. 3(b), similar to the nucleation probability, we see an increase in the number of crystals formed () with both laser energy and bulk supersaturation above the minimum laser intensity threshold. We predominantly observed cubic crystals with the probability of finding a rectangle or needle-like crystal increasing with and (see SV [23]). This observed change in morphology aligns with previous observations [30, 31], deduced using limited solvent availability per nuclei. In our experiments, we cannot measure local fluid properties surrounding the bubble, such as temperature and solute concentration, due to the small length and time scales involved. Therefore, we employ numerical simulations to calculate temporal and spatial values of these variables while the experimentally measured bubble radii and crystal count are used to validate the fluid flow and local supersaturation, respectively.
In numerical simulations, we solve for combined momentum, heat, and solute transport. For each phenomenon, the governing equations for an unbound 3D sphere are used due to the plane of symmetry offered by the cover glass. We employ the Rayleigh-Plesset equation [32] to solve for the momentum surrounding the bubble,
| (1) |
where kg/m3 is the solution density, bar is the ambient pressure and is the pressure within the bubble, is the surface tension, is the dynamic viscosity of the solution and the distance of the interface from the laser focal point. The spherically symmetric heat dissipation surrounding the bubble is modeled using,
| (2) |
in which is the temperature, is the thermal diffusivity of the solution and () the radial position from the bubble center. For solute transport, we use an analogous equation to Eq. (2) by substituting with , the solute concentration in kg/kg of the solution, and with , the mass diffusivity of the solute.
For simplicity, we assume the bubble to be a lumped system with an energy balance given by
| (3) |
where , , and are the mass, surface area, and specific heat capacity of the vapor bubble, respectively. is the latent heat of vaporization and the thermal conductivity of the solution. At the interface, we enforce the boundary condition at all times, where is the bubble temperature. The change in mass of the bubble is estimated using the corrected Hertz-Knudsen equation [33], , where is the specific gas constant for water vapor and the saturation pressure of the solution at the interface. The is estimated using the ideal gas law, , where is the bubble volume.
At the bubble is assumed to be saturated with zero interface velocity, and the surrounding solute concentration is assumed to be same as in the bulk. System energy is imposed by initializing a thermal boundary layer profile surrounding the bubble. The initial temperature distribution is , where is the ambient temperature, is the thermal boundary layer thickness and , is the radial distance from the interface. A high exponent of 25 is used to approximate a step function, while still being smooth enough to avoid numerical instabilities near . The thermal energy supplied in the simulation is transformed into latent heat (vapor), sensible heat (vapor and liquid), and kinetic energy of the solution. Thus, the control parameter in simulation, , characterizes the energy available for a bubble to grow. The initial bubble temperature is chosen to be 650 K - the spinodal temperature [34], with the radius m calculated using theoretical laser spot dimensions. For details on the numerical model and parameter values solved, refer SVI [23].
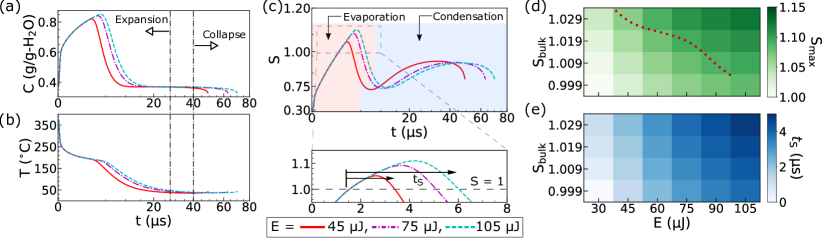
Figure 2(b) shows the numerically obtained bubble size for 21, 25.5, 29.5, 32.5, 34.5 and 36 m, corresponding to the increasing laser energy values from experiments (see SVI [23] for calculations). The deviation between experiments and simulations in for higher energies (J) can be attributed to non-linear absorption [35, 36] with possible plasma formation. The plasma can initiate high pressures, leading to higher interface velocities [37]. The probability of bubble incidence with and without \chKMnO4 in water was investigated for non-linear absorption, which supports the reasoning made for deviations in (see SI [23]). Moreover, the increase in interface velocities will only enhance the solvent accumulation at the interface supporting our hypothesis (see SVI [23]).
To get insight into the crystal formation surrounding the bubble, we look at the factors affecting the solute supersaturation using simulation. Figure 4(a,b) shows the temporal evolution of the solute concentration and temperature at the dynamic interface for three different laser energies at fixed bulk supersaturation. Initially, the temperature drops abruptly, in conjunction with a steep rise in concentration due to high evaporation rates, (100 kg/(m2s)). Then, the decrease in temperature is more gradual, while the decrease in concentration is steep. The drop in temperature can be attributed to heat diffusion away from the interface and advection resulting from bubble dynamics. Similarly, for the solute, there is dilution occurring at the interface due to condensation of the vapor in addition to diffusion and advection. During the latter half of the bubble lifetime, the concentration and temperature have minimal change due to lower driving potentials and short time range, (10 s). The temperatures during bubble collapse estimated from the simulations are in good agreement with the empirical calculations from literature (see SIV [23]).
Figure 4(c) shows the temporal supersaturation at the interface calculated using profiles given in Fig. 4(a,b). We observe a peak in the local supersaturation ratio when the bubble is rapidly expanding, after which the supersaturation decreases and the interface stays undersaturated () within the bubble lifetime. This observation of a momentarily supersaturated state (), highlighted in the close-up in Fig. 4(c), is a favorable condition for crystal nucleation. Moreover, both the peak supersaturation () and the time during which the interface remains supersaturated () increase with increasing . In the above analysis, we only look at the interface since heat diffuses faster than the solute and thus the maximum supersaturation ratio can exist only in the region closest to the bubble, i.e., at the interface. The estimated supersaturated layer thickness increases with and is (10 nm), consistent with literature [21]. However, this supersaturation ratio at the interface is dynamic and is quantified only when the bubble exists. The induced flow and resulting temperature and solute distribution surrounding the laser focal point after the bubble collapses are complex and outside the scope of this work. The simulated trends observed in Fig. 4(d,e) agree well with the presented experimental results in Fig. 3.
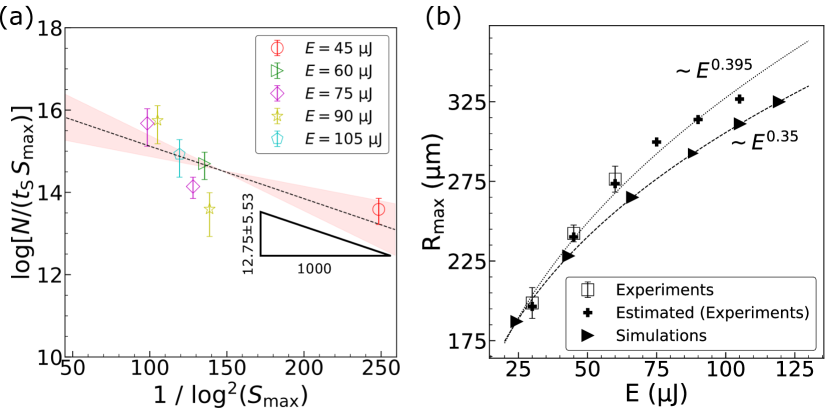
Subsequently, we correlate the simulated crystallization parameters, and , with the experimentally acquired parameter, (Fig. 3b). The nucleation rate (the number of nuclei formed per unit time per unit volume) can be expressed as [38],
| (4) |
where is the solute-solution interfacial tension, is Boltzmann’s constant and the molecular volume. We relate . Since the size of the bubbles for the time region where are almost the same within the range of energies used, we leave out the shell volume surrounding the interface in the proportionality for . Using the slope from Fig. 5(a), we estimate in Eq. (4) to be mJ/m2 (at C). This value, when calculated for C (3.51 mJ/m2), is within the reported values of 2.19-5.283 mJ/m2 for NPLIN [39, 40, 41] (see SVII [23] for calculation). Note that the elevated temperature is also a favorable condition for crystal nucleation in addition to supersaturation (Eq. 4).
Figure 5(b) is an equivalent representation of Fig. 2(b), showing the dependence of maximum bubble size () for varying supplied energies. The estimate of the in experiments was made using the bubble lifetime [42, 43] (see SVIII [23]). The closely matching trends between experiments and simulations support the reliability of the boundary conditions and assumptions employed in the simulation.
In summary, we have shown that primary nucleation in supersaturated aqueous \chKCl solution can be triggered by thermocavitation induced by a single Nd:YAG laser pulse below the optical breakdown threshold. The nucleation probability as well as the number and morphology of crystals formed depends on bulk supersaturation and laser energy used. Combining high-speed microscopy experiments and finite element simulations, we propose a nucleation mechanism based on the solute accumulation at the interface due to solvent evaporation into the growing bubble. Simulations reveal a momentary spike in supersaturation with a lifetime [] proportional to the bulk supersaturation and the supplied laser energy to facilitate nucleation.
The proposed mechanism is distinct from other speculated routes to crystal nucleation in laser-induced cavitation experiments, for example, due to photochemistry [44] and shock waves [45]. The intentional addition of \chKMnO4 enabled bubble formation via thermocavitation avoiding photochemistry - that otherwise might exist due to plasma in cavitation via optical breakdown. Furthermore, our calculations reveal the lengthscale of shockwave influencing crystallization [m)] matches the thermal boundary layer thickness surrounding the bubble (see SVIII [23]). Therefore, we expect no formation of crystals due to shockwaves because of the lower supersaturation ratio associated with higher temperatures. Thus, the proposed mechanism, verified by combining experiments and simulations, may shed light on the discussion of the working mechanism(s) behind NPLIN and sonocrystallization via cavitation [46, 47].
Acknowledgements.
This work was funded by LightX project under NWO Open Technology Programme (project number 16714). We thank Dr. D. Irimia and Ing. E.F.J. Overmars for supporting the experiments, and Sára Bánovská for supporting the solubility tests. A special thanks to Dr. H.J.M. Kramer, Dr. A.E.D.M. van der Heijden and members of the LightX user committee for the productive discussions.References
- Kashchiev [2000] D. Kashchiev, Nucleation: Basic theory with application, Vol. 1 (Butterworth-Heinman, 2000).
- Mullin [2001] J. W. Mullin, Crystallization (Butterworth-Heinemann, Oxford, 2001).
- Myerson and Trout [2013] A. S. Myerson and B. L. Trout, Science 341, 855 (2013).
- Schoonen and Lutsko [2022] C. Schoonen and J. F. Lutsko, Phys. Rev. Lett. 129, 246101 (2022).
- Lutsko [2019] J. F. Lutsko, Science Advances 5, eaav7399 (2019).
- Bianco et al. [2021] V. Bianco, P. M. de Hijes, C. P. Lamas, E. Sanz, and C. Vega, Phys. Rev. Lett. 126, 015704 (2021).
- Grossier et al. [2011] R. Grossier, Z. Hammadi, R. Morin, and S. Veesler, Phys. Rev. Lett. 107, 025504 (2011).
- Díaz Leines and Rogal [2022] G. Díaz Leines and J. Rogal, Phys. Rev. Lett. 128, 166001 (2022).
- Bigdeli and Tsai [2020] M. B. Bigdeli and P. A. Tsai, Langmuir 36, 4835 (2020), pMID: 32309954.
- Garetz et al. [1996] B. A. Garetz, J. E. Aber, N. L. Goddard, R. G. Young, and A. S. Myerson, Phys. Rev. Lett. 77, 3475 (1996).
- Hussain et al. [2021] M. N. Hussain, J. Jordens, S. Kuhn, L. Braeken, and T. Van Gerven, Chemical Engineering Journal 408, 127272 (2021).
- Duffus et al. [2009] C. Duffus, P. J. Camp, and A. J. Alexander, Journal of the American Chemical Society 131, 11676 (2009), pMID: 19645467.
- Garetz et al. [2002] B. A. Garetz, J. Matic, and A. S. Myerson, Phys. Rev. Lett. 89, 175501 (2002).
- Liu et al. [2017] Y. Liu, M. H. van den Berg, and A. J. Alexander, Phys. Chem. Chem. Phys. 19, 19386 (2017).
- Alexander and Camp [2009a] A. J. Alexander and P. J. Camp, Crystal Growth & Design 9, 958 (2009a).
- Alexander and Camp [2019] A. J. Alexander and P. J. Camp, The Journal of Chemical Physics 150, 040901 (2019).
- Zwaan et al. [2007] E. Zwaan, S. Le Gac, K. Tsuji, and C.-D. Ohl, Phys. Rev. Lett. 98, 254501 (2007).
- Arita et al. [2012] Y. Arita, M. Antkowiak, V. Venugopalan, F. J. Gunn-Moore, and K. Dholakia, Phys. Rev. E 85, 016319 (2012).
- Wang et al. [2021] L. Wang, Y. Wu, X. Wu, and K. Cen, Experimental Thermal and Fluid Science 121, 110266 (2021).
- V. Korede and N. Nagalingam et al. [2023] V. Korede and N. Nagalingam, F. M. Penha, N. van der Linden, J. T. Padding, R. Hartkamp, and H. B. Eral, Crystal Growth & Design (2023).
- Hidman et al. [2020] N. Hidman, G. Sardina, D. Maggiolo, H. Ström, and S. Sasic, Crystal Growth & Design 20, 7276 (2020).
- Schoppink et al. [2023] J. J. Schoppink, J. Krizek, C. Moser, and D. Fernandez Rivas, Experimental Thermal and Fluid Science 146, 110926 (2023).
- SI [2023] See Supplementary Information at [URL will be inserted by publisher] for experimental methodology, details on numerical model and other miscellaneous calculations (2023).
- Kacker et al. [2018] R. Kacker, S. Dhingra, D. Irimia, M. K. Ghatkesar, A. Stankiewicz, H. J. M. Kramer, and H. B. Eral, Crystal Growth & Design 18, 312 (2018).
- Sugiyama and Wang [2022] T. Sugiyama and S.-F. Wang, Journal of Photochemistry and Photobiology C: Photochemistry Reviews 52, 100530 (2022).
- Nagalingam et al. [2023] N. Nagalingam, A. Raghunathan, V. Korede, E. F. Overmars, S.-T. Hung, R. Hartkamp, J. T. Padding, C. S. Smith, and H. B. Eral, HardwareX 14, e00415 (2023).
- Reuter et al. [2022] F. Reuter, C. Deiter, and C.-D. Ohl, Ultrasonics Sonochemistry 90, 106131 (2022).
- Supponen et al. [2016] O. Supponen, D. Obreschkow, M. Tinguely, P. Kobel, N. Dorsaz, and M. Farhat, Journal of Fluid Mechanics 802, 263–293 (2016).
- Quinto-Su et al. [2009] P. A. Quinto-Su, K. Y. Lim, and C.-D. Ohl, Phys. Rev. E 80, 047301 (2009).
- Kardum et al. [2005] J. Kardum, A. Sander, and A. Glasnoviae, Chemical and Biochemical Engineering Quarterly 19 (2005).
- Cheng et al. [2020] A.-C. Cheng, H. Masuhara, and T. Sugiyama, The Journal of Physical Chemistry C 124, 6913 (2020).
- Plesset and Prosperetti [1977] M. S. Plesset and A. Prosperetti, Annual Review of Fluid Mechanics 9, 145 (1977).
- Barrett and Clement [1992] J. Barrett and C. Clement, Journal of Colloid and Interface Science 150, 352 (1992).
- Thiéry and Mercury [2009] R. Thiéry and L. Mercury, Journal of Solution Chemistry 38, 893 (2009).
- Noack and Vogel [1999] J. Noack and A. Vogel, IEEE Journal of Quantum Electronics 35, 1156 (1999).
- Sun et al. [2016] W. Sun, Z. Liu, and H. Zhou, Journal of Nanoscience and Nanotechnology 16, 3895 (2016).
- Vogel et al. [1996] A. Vogel, S. Busch, and U. Parlitz, The Journal of the Acoustical Society of America 100, 148 (1996).
- Kashchiev and van Rosmalen [2003] D. Kashchiev and G. M. van Rosmalen, Crystal Research and Technology 38, 555 (2003).
- Fang et al. [2014] K. Fang, S. Arnold, and B. A. Garetz, Crystal Growth & Design 14, 2685 (2014).
- Alexander and Camp [2009b] A. J. Alexander and P. J. Camp, Crystal Growth & Design 9, 958 (2009b).
- Ward and Alexander [2012] M. R. Ward and A. J. Alexander, Crystal Growth & Design 12, 4554 (2012).
- Han et al. [2015] B. Han, K. Köhler, K. Jungnickel, R. Mettin, W. Lauterborn, and A. Vogel, Journal of Fluid Mechanics 771, 706–742 (2015).
- Rau et al. [2006] K. R. Rau, P. A. Quinto-Su, A. N. Hellman, and V. Venugopalan, Biophysical Journal 91, 317 (2006).
- Okutsu et al. [2005] T. Okutsu, K. Furuta, M. Terao, H. Hiratsuka, A. Yamano, N. Ferté, and S. Veesler, Crystal Growth & Design 5, 1393 (2005).
- Lindinger et al. [2007] B. Lindinger, R. Mettin, R. Chow, and W. Lauterborn, Phys. Rev. Lett. 99, 045701 (2007).
- Lee et al. [2018] J. Lee, K. Yasui, M. Ashokkumar, and S. E. Kentish, Crystal Growth & Design 18, 5108 (2018).
- Bussonnière et al. [2020] A. Bussonnière, Q. Liu, and P. A. Tsai, Phys. Rev. Lett. 124, 034501 (2020).
- Quinto-Su et al. [2014] P. A. Quinto-Su, M. Suzuki, and C.-D. Ohl, Scientific Reports 4, 5445 (2014).
- Matzler [2002] C. Matzler, IAP Res Rep 8 (2002).
- Querry [1985] M. R. Querry, Optical constants, Tech. Rep. (Missouri Univ-Kansas City, 1985).
- Wood [1976] J. R. Wood, Geochimica et Cosmochimica Acta 40, 1211 (1976).
- Rayleigh [1917] L. Rayleigh, The London, Edinburgh, and Dublin Philosophical Magazine and Journal of Science 34, 94 (1917).
- Lunnon [1912] R. G. Lunnon, Proceedings of the Physical Society of London 25, 180 (1912).
- Ozbek and Phillips [1979] H. Ozbek and S. L. Phillips, Thermal conductivity of aqueous NaCl solutions from 20°C to 330°C, Tech. Rep. (U.S. Department of energy, 1979).
- Toner and Catling [2017] J. D. Toner and D. C. Catling, Journal of Chemical & Engineering Data 62, 995 (2017).
- Kestin et al. [1981] J. Kestin, H. E. Khalifa, and R. J. Correia, Journal of Physical and Chemical Reference Data 10, 57 (1981).
- Ozdemir et al. [2009] O. Ozdemir, S. I. Karakashev, A. V. Nguyen, and J. D. Miller, Minerals Engineering 22, 263 (2009).
- Nowak and Grosh [1961] E. S. Nowak and R. J. Grosh, An analysis of specific heat data for water and water vapor in the critical region., Tech. Rep. 8 (U.S. Department of energy, 1961).
- Leopold and Johnston [1927] H. G. Leopold and J. Johnston, Journal of the American Chemical Society 49, 1974 (1927).
- Chang and Myerson [1985] Y. C. Chang and A. S. Myerson, AIChE Journal 31, 890 (1985).
- COM [2020] Reference Manual, COMSOL Multiphysics® v. 5.6 (2020).
- Kestin et al. [1978] J. Kestin, M. Sokolov, and W. A. Wakeham, Journal of Physical and Chemical Reference Data 7, 941 (1978).
- Preckshot and Brown [1952] G. W. Preckshot and G. G. Brown, Industrial & Engineering Chemistry 44, 1314 (1952).
- Chatterji and Singh [1958] A. C. Chatterji and R. N. Singh, The Journal of Physical Chemistry 62, 1408 (1958).
- Faravar and Manteghian [2019] A. Faravar and M. Manteghian, International Journal of New Chemistry 6, 43 (2019).
- Mersmann [1990] A. Mersmann, Journal of Crystal Growth 102, 841 (1990).
- Thurmond et al. [1984] V. L. Thurmond, R. W. Potter II, and M. A. Clynne, The densities of saturated solutions of NaCl and KCL from 10 degrees to 105 degrees C, Tech. Rep. (U.S. Geological Survey, 1984) report.
- Venugopalan et al. [2002] V. Venugopalan, A. Guerra, K. Nahen, and A. Vogel, Phys. Rev. Lett. 88, 078103 (2002).
- Hickling [1994] R. Hickling, Phys. Rev. Lett. 73, 2853 (1994).
- Rice and Walsh [1957] M. H. Rice and J. M. Walsh, The Journal of Chemical Physics 26, 824 (1957).
- Mirsaleh-Kohan et al. [2017] N. Mirsaleh-Kohan, A. Fischer, B. Graves, M. Bolorizadeh, D. Kondepudi, and R. N. Compton, Crystal Growth & Design 17, 576 (2017).
- Darojat et al. [2022] Y. Darojat, A. Aljalal, K. Gasmi, I. H. Aljundi, N. Mirsaleh-Kohan, and W. Al-Basheer, ACS Omega 7, 38400 (2022).
- Batchelor [1967] G. K. Batchelor, An introduction to fluid dynamics (Cambridge university press, 1967).
- Supponen [2017] O. Supponen, Collapse phenomena of deformed cavitation bubbles, Tech. Rep. (EPFL, 2017).