Exposing the CSI: A Systematic Investigation of CSI-based Wi-Fi Sensing Capabilities and Limitations
Abstract
Thanks to the ubiquitous deployment of Wi-Fi hotspots, channel state information (CSI)-based Wi-Fi sensing can unleash game-changing applications in many fields, such as healthcare, security, and entertainment. However, despite one decade of active research on Wi-Fi sensing, most existing work only considers legacy IEEE 802.11n devices, often in particular and strictly-controlled environments. Worse yet, there is a fundamental lack of understanding of the impact on CSI-based sensing of modern Wi-Fi features, such as 160-MHz bandwidth, multiple-input multiple-output (MIMO) transmissions, and increased spectral resolution in IEEE 802.11ax (Wi-Fi 6). This work aims to shed light on the impact of Wi-Fi 6 features on the sensing performance and to create a benchmark for future research on Wi-Fi sensing. To this end, we perform an extensive CSI data collection campaign involving 3 individuals, 3 environments, and 12 activities, using Wi-Fi 6 signals. An anonymized ground truth obtained through video recording accompanies our 80-GB dataset, which contains almost two hours of CSI data from three collectors. We leverage our dataset to dissect the performance of a state-of-the-art sensing framework across different environments and individuals. Our key findings suggest that (i) MIMO transmissions and higher spectral resolution might be more beneficial than larger bandwidth for sensing applications; (ii) there is a pressing need to standardize research on Wi-Fi sensing because the path towards a truly environment-independent framework is still uncertain. To ease the experiments’ replicability and address the current lack of Wi-Fi 6 CSI datasets, we release our 80-GB dataset to the community.
I Introduction
It was the late 1990s when Vic Hayes first introduced the concept of an international standard for wireless networking, which would later become IEEE 802.11 in 1997, also known as Wi-Fi. Initially, Wi-Fi was supposed to be a low-rate replacement of Ethernet and supported up to 2 Mbit/s connectivity. Today, Wi-Fi is undeniably one of the most pervasive wireless technologies ever invented, providing up to 14 Gbit/s connectivity in homes, offices, university campuses, parks, airports, and shopping malls, to name a few [1]. To attest to this explosive growth, the number of Wi-Fi 6 hotspots is expected to increase 13x by 2023 [2], while the global Wi-Fi economy is poised to increase by $1.5T in two years [3].
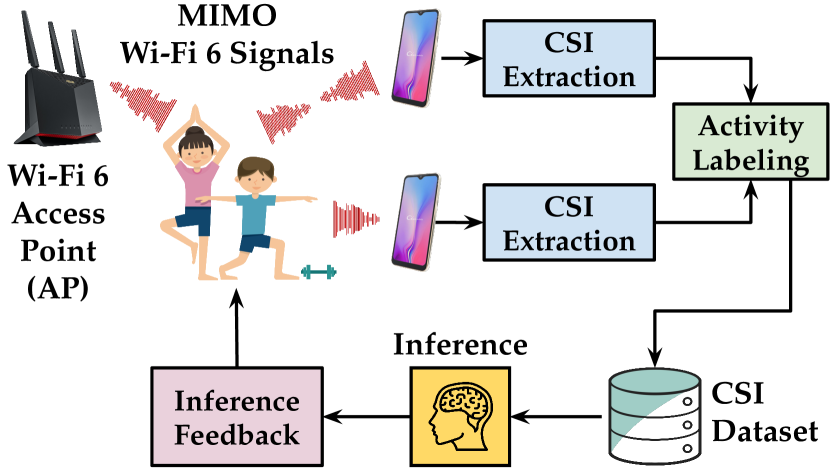
Besides connectivity, Wi-Fi signals can also be used as fine-grained “radar” pulses to sense what happens in the surroundings [4]. Among the most popular techniques there is channel state information (CSI)-based sensing, which aims at capturing small-scale changes in the channel frequency response (CFR) produced by the presence of obstacles located between Wi-Fi nodes, such as phase differences [5] or Doppler shifts [6]. The subtle changes in the CFR can be estimated through pilot symbols [7] and used to classify phenomena of interest, such as human activity recognition (HAR) [8, 9, 10, 11], person detection and identification [12, 13, 14], human pose tracking [15, 16], baggage tracking [17] and respiration monitoring [18], among many others [19, 20, 21]. Figure 1 shows an example in the context of HAR, where a CSI-based sensing framework tracks the users’ fitness activities and sends appropriate recommendations to adjust the daily activity levels. However, even if research in this field is thriving, we have identified a few key issues that, in the long run, might prevent CSI-based sensing from unleashing its full potential.
Key Research Issues
Legacy CSI signals. Since the seminal “See through walls with WiFi!” paper in 2013 [22], CSI-based sensing has been investigated by a deluge of research work (see Section II). However, most of the current art is still based on legacy 802.11n platforms that fail to capture critical innovations of newer standards, such as wider channels (up to 160-MHz bandwidth) and more subcarriers (up to 2048 per antenna per spatial stream). To put things in perspective, the increase in CSI dimensionality between 802.11n and 802.11ax is about ten times the increase in the number of pixels between a PAL-format video and an 8k-resolution video.
Lack of a full-fledged investigation. Despite the unprecedented sensing possibilities provided by the newer versions of Wi-Fi, a systematic investigation into if, when, and how modern features may improve—or impair—CSI-based sensing performance is missing. For example, current systems might even suffer from broader bandwidths or multiple-input multiple-output (MIMO) transmissions, as they might introduce more noise or inter-stream interference in the sensing framework. Achieving this fundamental understanding becomes crucial in light of the recent standardization efforts of the IEEE 802.11bf Task Group (TG), founded in September 2020 and aimed at enabling Wi-Fi sensing in common routers [23].
Scarcity of CSI datasets. As of October 2022, there were very few CSI datasets available to the community (see Section II). Collecting large quantities of CSI data and preparing ready-to-use labeled datasets is a cumbersome endeavor requiring a lot of effort and specific software tools [24, 25, 26, 27, 28], as discussed in Section II. Unfortunately, this causes some authors to refrain from sharing their own CSI datasets, a practice that hinders breakthrough innovation and—more critically—the replicability of the research outcomes. This does not happen in more mature fields such as in computer vision (CV), where massive datasets like COCO [29] or ImageNet [30] have been available to the research community for 8+ years.
Summary of Novel Contributions
We present the first full-fledged investigation into the capabilities and limitations of CSI-based Wi-Fi sensing with 802.11ax (Wi-Fi 6) signals, henceforth referred to as CSI sensing for brevity. Given its significance, we cast our study into the context of HAR, the most explored problem in CSI sensing so far [19]. Specifically, we consider a HAR problem targeting twelve different activities (see Table V). To collect the data for our analysis, we set up an extensive data collection campaign involving three subjects in three different indoor environments, as detailed in Section IV-C. Our experiments involve one Wi-Fi 6 transmitter and three CSI collectors that extract up to 8192 data points per CSI, i.e., more than 250x the number of data points extracted with legacy 802.11n systems (usually 30 data points per CSI). Moreover, CSI data are synchronized to an anonymized video ground truth, constructed by recording the activities with a webcam, and anonymized by building a 3D model of the subject performing the activity. To the best of our knowledge, this is the first CSI dataset available for Wi-Fi 6 systems, and the first introducing video-based ground truth generation.
We leverage our dataset to dissect the impact of available bandwidth, subcarrier spacing, and number of antennas on CSI sensing performance. To this end, we test the performance of one of the most recent frameworks, SHARP [6], while changing such parameters. We also evaluate the generalization performance of the system on different subjects and environments. Our key findings are that more antennas and finer subcarrier spacing greatly improve the sensing performance, while broader bandwidths lead only to a marginal improvement. Besides informing the wireless research community, we expect our results will inform ongoing standardization efforts in IEEE 802.11bf.
To allow full replicability and for benchmarking purposes, we release to the research community our labeled CSI dataset, including the anonymized ground truth videos, for a total of about 80 GB of data.111See https://github.com/ansresearch/exposing-the-csi Beyond eliciting “pure” CSI sensing, we expect our dataset will be used to perform novel research at the intersection of CV and CSI sensing.
II Related Work
| Name (Year) | 802.11 | Task | Approach |
|---|---|---|---|
| WiAR [31] (2019) | n | A | Traditional ML |
| Widar 3.0 [10] (2019) | n | G | CNN + GRUs |
| RF-Net [32] (2020) | n | A | LSTM + Meta-Learning |
| OneFi [11] (2021) | n | G | One-Shot Learning |
| ReWiS [33] (2022) | ac | A | Few-Shots Learning |
| SHARP [6] (2022) | ac | A | CNN (Inception v4) |
The field of CSI sensing sparked with the development of CSI extraction tools, i.e., software that enabled researchers to CSI data from commercial Wi-Fi devices. Then, over the last decade, CSI sensing has been proposed for a wide variety of applications; among the most compelling, we mention person detection and identification [12, 13, 14], localization [34], baggage tracking [17], and human pose tracking [15, 16], with most of the previous research activities focused on human activity and gesture recognition [35, 8, 9, 10, 11]. The applications are so compelling that the IEEE 802.11bf Task Group is currently working to define the appropriate modifications to existing Wi-Fi standards to enhance sensing capabilities through 802.11-compliant devices [36, 37, 38]. In Table I, we summarize some of the most recent approaches (i.e., less than three years old) that are most related to the work conducted in this paper, which we will briefly review in the following. We refer the reader to [19, 20, 21] for excellent survey papers on the topic. In Table II, we report a list of the most common CSI extraction tools available today.
| CSI Extractor | 802.11 | CSI points |
|---|---|---|
| 802.11n CSI Tool [24] | n | 30 |
| Atheros CSI Tool [25] | n | 56 |
| Nexmon CSI [26] | ac | up to 4096 |
| PicoScenes [27] | ax | up to 7968 |
| AX-CSI [28] | ax | up to 32768 |
WiAR [31] is a framework for HAR based on the 802.11n CSI Tool. The WiAR dataset contains sixteen activities from three subjects in three different environments, but it is collected using legacy 802.11n signals. The authors tested the accuracy of seven traditional deep learning (DL) algorithms, showing up to 90% accuracy with 16 activities. Based on the same CSI extraction tool, RF-Net [32] presented a HAR framework using long short-term memory (LSTM) layers. However, the approach is evaluated on a dataset with only four activities, making the findings not widely generalizable. Regarding gesture recognition, Widar 3.0 [10] and OneFi [11] collected datasets with 802.11n signals containing 6 and 40 different gestures, respectively. Widar 3.0 derives a Body Velocity Profile (BVP) quantity from the CSI and introduces gated recurrent units (GRUs) in the framework architecture to improve generalization and sensing performance. On the other hand, OneFi proposes an approach based on One-Shot Learning (OSL) to recognize previously unseen gestures with only one (or few) labeled samples. However, while the Widar 3.0 dataset is currently available online, the authors of OneFi replied when contacted that they are not planning to release their dataset to the community, which ultimately makes the findings not replicable.
Even if Nexmon CSI was released in 2019, very few works have considered HAR in the context of 802.11ac. Among them, SHARP [6] proposes a technique based on Doppler shift estimation through the CSI. The idea is that Doppler shifts are not affected by environment-specific static objects. The authors claim that the proposed technique is person- and environment-independent, with an average accuracy of 95%. Finally, ReWiS [33] is a framework for CSI-based HAR using Few-Shots Learning (FSL) to generalize across different environments. Although code and dataset were made available by the authors, the number of activities considered is only four.
Discussion. We have identified a series of problems with the public CSI datasets that are available today: (i) different works consider different activities; (ii) many works consider a limited amount of activities (often less than 8); (iii) many papers only test their implementation with their own dataset; (iv) some public datasets still use the Intel 5300 chipset, which includes only 30 subcarriers per CSI and is now discontinued by Intel; (v) there is no way to evaluate “intuitively” how the activity has been performed; (vi) there is no ground truth to correlate an exact moment during the activity execution with the corresponding CSI. After much exploration, we could not find a research paper investigating rigorously the limits and the trade-offs imposed by different Wi-Fi standards. Many interesting questions arise when studying how different features of the Wi-Fi signals affect CSI sensing. For example, does the sensing accuracy improve with a broader channel bandwidth? And what happens if we consider the reduced subcarrier spacing of 802.11ax? To our knowledge, this paper is the first to address these questions.
III Background on CSI Sensing
For the purpose of communication, the CSI is a crucial element of Wi-Fi because it is one of the simplest ways to properly equalize wide-band communication signals received on frequency-selective channels. In this section, we briefly review the background underpinning CSI measurements.
III-A Background on Wi-Fi PHY Layer
Orthogonal frequency-division multiplexing (OFDM) has been at the core of Wi-Fi since IEEE 802.11a/n[7], either at 2.4 GHz, 5 GHz, and now even 6 GHz. Although Wi-Fi 6 introduces orthogonal frequency-division multiple access (OFDMA) to multiplex the data across multiple users, the CSI is computed starting from the training symbols in the Wi-Fi preamble, which are modulated using OFDM. Therefore, here we summarize the basic notions of OFDM, and refer the interest reader to [1] for an exhaustive tutorial on OFDMA on 802.11ax.
OFDM transceivers subdivide a wide-band channel into orthogonal subchannels depending on (i) the available bandwidth and (ii) the frequency spacing between adjacent subchannels. In Table III, we compare the maximum channel bandwidth and the minimum subcarrier spacing allowed by different Wi-Fi versions. For example, the maximum number of OFDM subcarriers supported by 802.11n devices is on a 40-MHz channel, while 802.11ax systems can fit subcarriers into a 160-MHz channel.
| IEEE Standard | Max Bandwidth | Subcarrier Spacing |
|---|---|---|
| 802.11n (2009) | 40 MHz | 312.5 kHz |
| 802.11ac (2013) | 160 MHz | 312.5 kHz |
| 802.11ax (2021) | 160 MHz | 78.125 kHz |
OFDM systems map groups of transmit bits onto symbols, and each symbol is used to modulate a different OFDM subcarrier using traditional modulation techniques, e.g., 64-QAM. In general, because some subcarriers are reserved to carry pilot tones or forced to zero (like the guard bands), but we will drop the distinction between and in the following, as all the subcarriers are then transmitted within a single OFDM symbol. The th OFDM symbol , transmitted at time with duration , can be described by:
| (1) |
where is the constellation point modulating the th subcarrier of the th symbol, is the base-band frequency of the th subcarrier, and is the central frequency of the Wi-Fi channel.

Figure 2 shows the preamble of an 802.11ax Physical Layer (PHY) frame. At the beginning, training fields are included for retro-compatibility with legacy Wi-Fi standards. Specifically, the legacy short training field (L-STF) and legacy long training field (L-LTF) are used for frame synchronization, while the legacy signal field (L-SIG) is used to compute the frame duration. To simplify the 802.11ax frame detection, the HE part of the preamble starts with a repetition of the L-SIG field called RL-SIG, followed by HE-SIG-A. The latter indicates modulation and coding scheme (MCS), bandwidth, and the number of spatial streams used, among others, while HE-SIG-B contains the OFDMA resource allocation and resource block-specific information. Finally, the PHY frame preamble is followed by a set of HE-LTF pilot symbols, which are used to estimate the CFR, as explained below.
III-B Mathematical definition of Channel State Information
Let us consider an OFDM communication system with subcarriers. In the following, we focus on one specific symbol, so that we can drop the index and simplify the notation. Given one OFDM symbol, we can express Eq. 1 as the product of a vector of modulating coefficients with a symbol-independent vector containing all the complex exponentials. Then, the relation between the transmit signal and the received one is given by:
| (2) |
where is the frequency response of the wide-band wireless channel and is the Hadamard product, i.e., the element-wise product.
Since the OFDM channel is in general frequency-selective, the receiver needs to estimate its effect in order to properly equalize the received signal. The CSI is a quantized approximation of the channel response that is computed by the receiver using the HE-LTF symbols of the Wi-Fi preamble in Fig. 2 as described in the specification [7]. Using the CSI, the receiver can invert Eq. 2 to equalize the received signal and eventually recover the original transmit signal:
| (3) |
We omit spatial multiplexing in our discussion because we will not deal with multi-stream transmissions in our experiments. However, we will consider the case when the receiver has antennas. In this case, it is easy to generalize Eqs. 2 and 3 by computing for every receiving antennas from 1 to . This means that from a single transmission we can measure different CSI simultaneously.
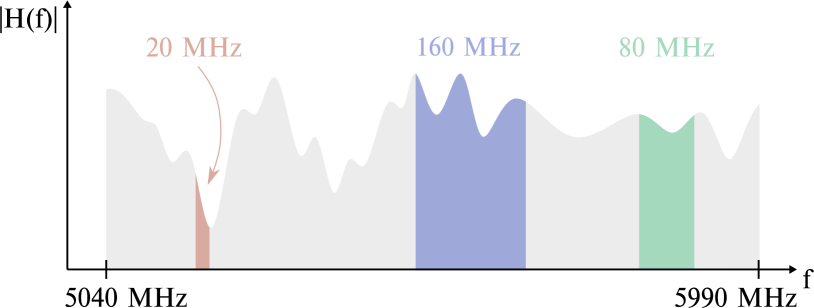
Discussion. It is clear that the number of antennas, the channel bandwidth and the subcarrier spacing are all key parameters for the resulting CSI. In Fig. 3, we visually represent to scale the bandwidth difference between 20-MHz and 160-MHz systems, and we recall that most bibliography only considers the smallest one. However, beside the intuition that “more data, the better,” there are more profound implications that should motivate us to consider larger bandwidths and higher frequency resolution in CSI sensing applications. The specific interference pattern associated to the CSI is generated by the superposition at the receiver of several copies of the signal (multi-path propagation). The properties of the wireless channel measured in the frequency domain by the CSI can be equivalently described in the time domain through the channel’s impulse response. We recall that one of the basic properties of the Fourier transform asserts that, given a signal function of time and its Fourier transform as a function of frequency , then
| (4) |
where represents the Fourier transform operator and is a time delay. From Eq. 4 and the linearity of the Fourier transform itself, it is easy to show that receiving multiple copies of the Wi-Fi signal at different ’s (e.g., due to multi-path) turns into a combination of complex exponentials in the frequency domain. From this, we can derive that a broader CSI bandwidth helps discriminating lower-frequency exponentials, i.e., paths that arrived close to the first one, while higher spectral resolution can help detecting higher-frequency exponentials, i.e., multi-path components with larger delays.
IV Methodology
In this work, we want to propose a framework for collecting and processing the CSI to evaluate the capabilities and limitations of Wi-Fi sensing systematically. Before describing the setup of the experiments, we must define upfront the variables that we will consider in our analysis. In our investigation, we propose to evaluate the performance of Wi-Fi sensing systems while changing three key properties of the CSI: i) the bandwidth, which can range from 20 MHz to 160 MHz; ii) the subcarrier spacing (either 312.5 kHz for 802.11ac or 78.125 kHz for 802.11ax); iii) the number of receiving antennas (from one to four).
IV-A Hardware Selection and Testbed Setup
The fundamental building block of any CSI-based sensing framework is the CSI collector, i.e., the device used for measuring the CSI. In this work, we opt for the AX-CSI tool because it supports the latest 802.11ax standard with up to 160 MHz bandwidth and 4x4 MIMO transmissions [28].
Our testbed consists of four Asus RT-AX86U routers, connected together to form a local-area network (LAN) and controlled by a host laptop. During the experiments, one router generates dummy Wi-Fi traffic at a constant rate using the injection features of AX-CSI. The other three routers—which we will also call monitors—perform the sensing, i.e., they extract the corresponding CSI from the received dummy Wi-Fi frames. We deploy this testbed in different environments to perform the data collection campaign described in detail in the following sections.
Notice that CSI data grows very quickly when working with multi-antenna 160-MHz 802.11ax transmissions; hence, storing the CSI on every monitor can become expensive and inefficient. Thus, the extracted CSI data is forwarded to the host laptop through the LAN. The raw data are then stored as a pcap file on an external storage device.
IV-B Preliminary Analysis
Before collecting the dataset, we validate two crucial properties of the CSI. Albeit intuitive, their analytical derivation is beyond the scope of this paper. In this section, we prove that such intuitive properties hold in our measurements by using experimental evidence.
Property 1
The CSI of a wide-band channel is equivalent to the ensemble of CSI of its narrow-band sub-channels.
We have discussed in Section III how the CSI is a quantized approximation of the CFR. It is clear that no matter the bandwidth of the CSI being measured, the underlying CFR should not change. In Fig. 4, we show that the CSI measured for a 160-MHz channel overlaps perfectly (apart from some inevitable noise) with the CSI of its narrow-band sub-channels, thus proving this point. This result allows us to perform only one experiment in every scenario with the broadest bandwidth, i.e., MHz. The CSI of narrower channels can then be easily derived by considering just the subset of OFDM subcarriers corresponding to that narrow-band channels.

Property 2
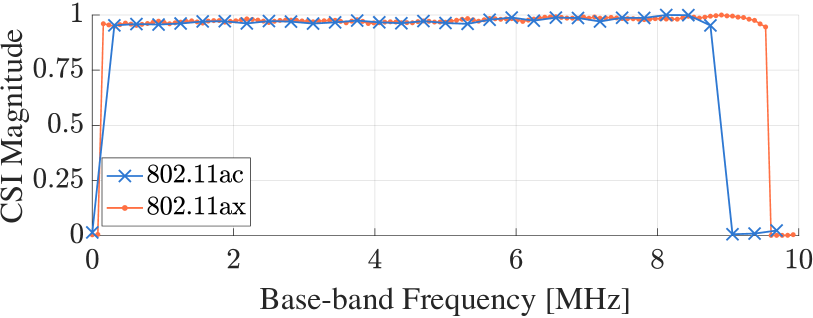
The CSI measured by 802.11ax and 802.11ac systems represents the same underlying CFR.
With reference to Table III, the smaller subcarrier spacing enables 802.11ax systems to detect higher frequency components in the CSI, but the general behavior is indeed equivalent. We prove this in Fig. 5, showing a detail of the CSI measured over the same channel by 802.11ac and 802.11ax systems. This result allows us to run the experiments with 802.11ax transmissions and then do a downsampling operation on the CSI when we need to consider the CSI of 802.11ac systems.
IV-C Data Collection


Our main experimental activity consists of collecting CSI data in 7 different experiments, or scenarios. We report the complete list of the considered scenarios in Table IV and discuss the rationale behind our specific choice. First, we would like to validate the property of a sensing framework to work well over time on the same person in the same environment; hence, we collect this type of data in S1, S4, and S5. Note that S1 and S4 are collected a few hours apart during the same day, while S5 data have been collected after one day. Second, we want to verify that a sensing framework can generalize to different people in the same environment; this type of insight can be given by the results obtained in scenarios S1, S2, and S3, which are three experiments we ran in the lab with three different candidates. Third, we want to investigate how the sensing framework generalizes to different environments with the same person; the scenarios used to benchmark this property are scenarios S5, S6, and S7. Overall, we believe that these seven scenarios represent the most simple yet complete set of cases to benchmark the most desirable properties of any CSI-based sensing framework.
| Scenario | Candidate | Environment | Day # |
|---|---|---|---|
| S1 | A | Lab | 1 |
| S2 | B | Lab | 1 |
| S3 | C | Lab | 1 |
| S4 | A | Lab | 1 |
| S5 | A | Lab | 2 |
| S6 | A | Office | 2 |
| S7 | A | Hall | 2 |
In our experiments we consider three different environments, shown in Fig. 6. The three chosen environments are representative of different general “layouts” of an indoor space: the lab (Fig. 6(a)) represents a medium-sized indoor space, i.e., a sort of “average” room in which CSI sensing can be performed; the office (Fig. 6(b)) represents a smaller, more cluttered space rich of multipath reflections; finally, the hall (Fig. 6(c)) represents a larger space with less multipath, except for the one coming from the floor and the ceiling. Following the discussion in Section IV-A, we deploy three monitors and one transmitter in every environment, respectively identified by red and blue circles in Fig. 6. We think it is important to remark that scenarios S1 to S5 refer to the same physical environment and that we moved neither the receivers nor the transmitter for the entire duration of the corresponding experiments. Thus, it is safe to assume that eventual modifications in the channel are due to natural variations in the environmental conditions and do not depend on the position of the devices.
In every scenario, we invite the candidate to perform 12 different activities, and we let every monitor collect 80 s of CSI data for each activity. Ultimately, our experimental data collection campaign totaled two hours of CSI data for each monitor. The activities performed by the candidate are either static (sitting, standing) or dynamic (walking, waving hands); some of them involve mild physical exercise (jumping, running), but we have selected activities that are compatible with a general office setting. The complete list of the activities is reported in Table V.
| A. | Walk | D. | Sitting | G. | Wave hands | J. | Wiping |
| B. | Run | E. | Empty room | H. | Clapping | K. | Squat |
| C. | Jump | F. | Standing | I. | Lay down | L. | Stretching |
Another significant novelty is the recording of an anonymized video ground truth synchronized to the CSI data. Indeed, CSI data related to a particular activity is often provided without a satisfactory description of the process that generated the data, e.g., the frequency of the jumps or the exact motion while waving the hands. To overcome this problem, we record the candidate with a camera while executing the target activities. In this way, other researchers can work on our dataset in the future and know exactly how the activities are performed in every trace. At this point, we must make a critical observation about the video recordings and the participants’ anonymity. The candidates consented to be video recorded during the experiments; however, their identity is concealed in the public dataset. Indeed, the public ground truth consists of only a few key-points per frame (corresponding to the candidate’s joints) and an anonymous 3D figure that is automatically modeled on the candidate’s activities starting from the video trace, as shown in Fig. 7. To automatically reconstruct the 3D figure from video data we use VideoPose3D [39], an open-source tool available online at https://github.com/facebookresearch/VideoPose3D.

Finally, we briefly describe how we synchronized the CSI data to the video trace. During every experiment, we first start recording the video using the webcam attached to the host laptop. When the transmitter sends the first Wi-Fi frame, an audiovisual signal is created and recorded in the video trace. We assume this time also corresponds to the reception time of the same frame since propagation delays in indoor environments are negligible with respect to the standard video frame rate (30 Hz). In the same way, an audiovisual signal is created for the last Wi-Fi frame. This method allows for simple synchronization of CSI data with a video trace without setting up a complex infrastructure, thus improving the replicability of the setup by anyone interested in expanding the dataset with common ground-truth data.
IV-D CSI Data Structure
Preliminary experiments showed that it is hard to achieve satisfactory results with raw CSI data, e.g., by training a convolutional neural network (CNN) with sequences of raw CSI taken from the same target activity. Therefore, organizing the CSI in a data structure that is both informative and manageable is fundamental to support further processing.
We recall that every CSI data point can be represented by a complex-valued matrix of size , where is the number of OFDM subcarriers and is the number of receiving antennas (we omit multiple spatial streams in our discussion for simplicity). We stack consecutive CSI data points along the “time” dimension to create a 3D tensor of size . This data structure enables easy retrieval of the CSI corresponding to a specific time instant, as well as studying the evolution of the CSI for single antennas (e.g., the CSI already shown in Fig. 7) or along subsets of subcarriers.
IV-E Activity Recognition Framework
In the previous sections we described how to systematically collect and store large volumes of CSI data that are also synchronized to a video trace. At this point, we only miss a system to benchmark how different features of the Wi-Fi signal (i.e., bandwidth, OFDM subcarrier spacing, and number of antennas) affect CSI sensing performance.
In this paper, we decided to employ SHARP222See https://github.com/signetlabdei/SHARP, a state-of-the-art open-source system targeting person- and environment-independent activity recognition. SHARP is a supervised DL framework that solves a classification problem: it takes in input sequences of CSI and outputs an activity chosen from the set of possible activities on which it was trained. The idea at the core of SHARP is first to preprocess the raw CSI data to extract the so-called Doppler vector. The Doppler vector is a feature that should not depend on the surrounding environment—unlike the CSI—but only on the “variations” across different CSI and, thus, on the specific activity being monitored. Describing the SHARP system in detail is beyond the scope of this paper, and we redirect the interested reader to the original paper [6] for further details about its theory and implementation. However, we recall that SHARP has been designed to work with 80-MHz 802.11ac transmissions; hence, we had to customize some of the preprocessing operations to take into account the different number of subcarriers and the reduced subcarrier spacing.
V Experimental Results
We finally present and discuss the results of our investigation. We want to stress again that our primary research objective is to systematically investigate how different parameters of Wi-Fi communications impact sensing performance. We do not propose a novel sensing algorithm; instead, we study the performance of one of the latest Wi-Fi sensing systems on an independent dataset we crafted for this task.
The results are subject to a broad spectrum of analysis and interpretation work, so large that the amount of data to look at quickly becomes overwhelming. For this reason, and due to space constraints, we present only a few possible perspectives on the outcomes of our analysis and show the results that offer the most intriguing insights on fundamental questions about CSI-based sensing.
V-A Same Person, Same Environment (PE)
We start our analysis by presenting the results obtained when the system is trained with CSI data of one person in one environment and then tested using different data from the same person in the same environment. These results represent a baseline and can later be used to study how the system generalizes to different subjects and environments. For shorthand, we label this experiment PE (Person-Environment).

In Fig. 8, we show the average PE accuracy (on scenarios S1 to S7 in Table IV) for the same five target classes that were considered in the original SHARP work (labeled from A to E in Table V). We can already take a few interesting insights from these results. First, we notice that once we fix the bandwidth, the classification accuracy increases if we increase the spectral resolution and the number of receiving antennas. The effect is evident regardless of the bandwidth, as the classification accuracy increases by 30 to 40 percent when moving from a single-antenna 802.11ac system to a four-antenna 802.11ax one. Second, it is apparent that the CSI bandwidth does not play a primary role in the considered CSI sensing application, as the improvement from 20 MHz to 80 MHz and 160 MHz is marginal. We guess that even if a wider bandwidth helps to characterize better the communication channel, the main features of human motion are already detected when considering smaller bandwidths, and their recognition does not improve as the bandwidth increases.
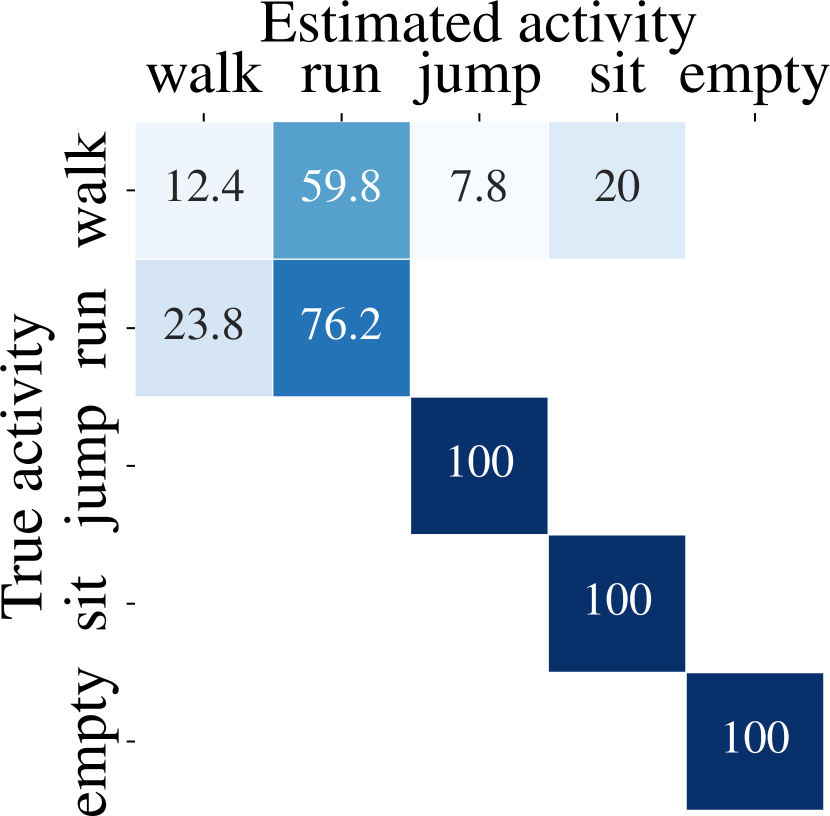

There is another critical thing to notice in Fig. 8. We recall that the system achieved 100% accuracy in the original SHARP paper, while here it stops at almost 90% accuracy in the best case. To further investigate this discrepancy, we show the confusion matrices for two different experiments in Fig. 9. The confusion matrices clearly show a high misclassification rate between walk and run, while the other activities are perfectly detected. This is reassuring in some sense because it is often hard to discern between these two activities, especially in indoor environments. It is worth noticing that if we join together the classes walk and run (e.g., in a single class move), then the classification accuracy touches 100% for our dataset too. However, this consideration also raises an important question about how CSI sensing models can generalize across different settings and repetitions of the same experiment.

Another interesting question regards the performance of the system when we consider more activities. In Fig. 10, we show the accuracy in the PE experiment for 12 different activities. As expected, the overall accuracy drops when we enlarge the set of target activities; however, we notice that with 802.11ax transmissions and four antennas, the average accuracy stays above 60% (we point out that a random choice would be almost 8%). The results reproduce almost exactly the behavior we have already commented on for the PE experiment with 5 classes, except for the 160-MHz 802.11ac transmissions with 4 antennas, for which the larger bandwidth seems to correspond to a slight increase in the average accuracy.


We report two confusion matrices for this experiment in Fig. 11. We observe that also in this case there is substantial confusion between the activities walk and run. Moreover, we notice an interesting misclassification trend between pairs of activities such as wave hands and wiping, which is reasonable, or clapping and squat, which instead is a bit more obscure.

Finally, as we ran PE experiments in three different environments, it is interesting to ask ourselves whether the sensing performance is the same everywhere. In Fig. 12, we show the classification accuracy obtained in different environments for 802.11ax transmissions with four receiving antennas and different bandwidths. While the average accuracy remains the same across the different bandwidths (as we have already acknowledged in Fig. 8), we can clearly distinguish other trends that depend on the environment. In the office, the smallest of the three environments, the accuracy is higher when working with 20 MHz transmissions and decreases as the bandwidth grows. We see the opposite trend in the hall, which is also the largest of the three environments, while in the lab the overall accuracy remains mostly unchanged. This behavior confirms that the interference pattern created by different activities is indeed intertwined with the effect of the surrounding environment and might represent a problem when trying to generalize to different environments.
V-B Different person, same environment (XP)
We have presented the results obtained by training and testing the Wi-Fi sensing system on CSI data collected from the same person in a single environment. Now, we focus our attention on a different experiment, in which we test the ability of the system to work with activities performed by a subject different from the one on which the specific model was trained. We label this kind of experiment as XP.

In Fig. 13, we show the results obtained for the XP experiment over the same five classes we considered before. We notice two main differences with respect to the PE results. First, we see that, in this case, using more antennas does not improve classification accuracy. While this might be confusing at first, this result seems to indicate that the trained model is indeed overfitting on the training dataset. Second, in the XP experiment we notice a weak correlation between the accuracy and the CSI bandwidth. Unlike in the PE experiment, this result seems in line with the basic intuition that “more data, the better.” We suspect that a larger bandwidth helps the sensing system to detect similar features when two different users perform the same gesture.
In this case, the outcome of our experiment differs from the one reported in the original SHARP paper, which reports high accuracy for XP experiments. However, we want to highlight the fact that people might perform the same gesture in different ways, e.g., with different speeds and periodicity. This observation might undermine the assumption that different subjects cause similar variations in the CSI when performing the same activity. We believe that in this case the video ground truth will help interpret patterns in the CSI data and differences between different realizations of the same gestures.
We noticed that the performance of the system is almost equivalent in the XP experiment and in other experiments in which we train and test the system on the same person in the same environment after some time has passed (i.e., training with dataset S1 and testing with dataset S4 and S5, with reference to Table IV). This means that even if the system still works correctly in most cases, it is not entirely independent from the channel’s current state, which slightly impairs the activity recognition performance.
V-C Same person, different environment (XE)
The last part of our study focuses on analyzing the sensing performance when the system is provided with CSI data of the same person for which it was trained, but the activities are performed in a different environment. This is the most challenging scenario, and we label these experiments XE to recall the cross-environment nature.
Unfortunately, in our experiments, SHARP failed to generalize to new environments. In the best cases, the system did only slightly better than a random choice between the target activities. On the one hand, this result is quite expected because there is no guarantee that the same activities will have the same effect on the physical channel in different environments. On the other hand, however, this result contradicts the environment-independent nature of the SHARP framework. One possible explanation for this inconsistency is that macroscopic differences in the training and testing environments (e.g., different room sizes and amounts of reflective clutter) can disrupt the performance of the sensing system. In the original SHARP work, all the rooms had more or less the same size; however, in this work, we chose different classes of rooms to test the system’s limits. We believe this point raises fundamental questions about the generalization capabilities of current CSI sensing models, opening several new issues to address in this research field and encouraging authors to work collaboratively on datasets as heterogeneous as possible.
VI Concluding Remarks
This paper presents the first full-fledged investigation into CSI-based sensing with Wi-Fi 6 signals. We have set up an extensive data collection campaign involving 3 human subjects and 3 indoor environments, measuring the impact of 12 activities on the CSI in 7 different scenarios. We have collected CSI measurements using 3 nodes with 4 receiving antennas each and up to 2048 subcarriers per receiving antenna, leading to up to 8192 data points per CSI. We have created an anonymized ground truth based on a video recording of the subjects performing every activity. We have leveraged our dataset to dissect the impact that different Wi-Fi 6 features (i.e., available bandwidth, subcarrier spacing, and multiple receiving antennas) have on the classification performance. We have leveraged a state-of-the-art DL algorithm for benchmarking purposes and evaluated its generalization performance when samples collected in different environments and with other subjects are fed to the DL model.
Significance and Impact of Results
We studied how different features of the Wi-Fi signals impact the performance of a state-of-the-art sensing framework. Our experimental results indicate that despite ten years of innovative research in the field of CSI-based Wi-Fi sensing, there is still much more to understand and discover about this topic. While our results verify the main findings of the research community, they also suggest that achieving reliable generalization to new, unseen situations and environments is a difficult task. Beyond the results discussed in this paper, we firmly believe that the community should conduct further investigations into CSI sensing. For this reason, and to allow full replicability of our results, we release to the research community our labeled CSI dataset for about 80 GB of data.
VII Acknowledgement of Support and Disclaimer
This material is based upon work supported by the National Science Foundation under Grant No. CNS-2134973 and CNS-2120447, and co-funded/supported by the German Research Foundation (DFG) in the Collaborative Research Center (SFB) 1053 MAKI. Any opinions, findings, and conclusions or recommendations expressed in this material are those of the author(s) and do not necessarily reflect the views of the National Science Foundation.
References
- [1] E. Khorov, A. Kiryanov, A. Lyakhov, and G. Bianchi, “A Tutorial on IEEE 802.11 ax High Efficiency WLANs,” IEEE Communications Surveys & Tutorials, vol. 21, no. 1, pp. 197–216, 2018.
- [2] Cisco, “Cisco annual internet report (2018–2023) white paper,” 2020.
- [3] Wi-Fi Alliance, “The Economic Value of Wi-Fi: A Global View (2018 and 2023).” https://tinyurl.com/EconWiFi, 2021.
- [4] W. Li, R. J. Piechocki, K. Woodbridge, C. Tang, and K. Chetty, “Passive wifi radar for human sensing using a stand-alone access point,” IEEE Transactions on Geoscience and Remote Sensing, vol. 59, no. 3, pp. 1986–1998, 2020.
- [5] X. Wang, C. Yang, and S. Mao, “PhaseBeat: Exploiting CSI Phase Data for Vital Sign Monitoring with Commodity WiFi Devices,” in Proceedings of IEEE ICDCS, 2017.
- [6] F. Meneghello, D. Garlisi, N. Dal Fabbro, I. Tinnirello, and M. Rossi, “Sharp: Environment and person independent activity recognition with commodity ieee 802.11 access points,” IEEE Transactions on Mobile Computing, pp. 1–16, 2022.
- [7] I. of Electrical and E. E. (IEEE), “Ieee standard for information technology–telecommunications and information exchange between systems local and metropolitan area networks–specific requirements part 11: Wireless lan medium access control (mac) and physical layer (phy) specifications amendment 1: Enhancements for high-efficiency wlan,” IEEE Std 802.11ax-2021 (Amendment to IEEE Std 802.11-2020), pp. 1–767, 2021.
- [8] B. Korany, C. R. Karanam, H. Cai, and Y. Mostofi, “Teaching RF to Sense without RF Training Measurements,” in Proceedings of the ACM on Interactive, Mobile, Wearable and Ubiquitous Technologies (IMWUT), 2020.
- [9] B. Wei, W. Hu, M. Yang, and C. T. Chou, “From Real to Complex: Enhancing Radio-based Activity Recognition Using Complex-Valued CSI,” ACM Transactions on Sensor Networks (TOSN), vol. 15, no. 3, pp. 1–32, 2019.
- [10] Y. Zheng, Y. Zhang, K. Qian, G. Zhang, Y. Liu, C. Wu, and Z. Yang, “Zero-Effort Cross-Domain Gesture Recognition with Wi-Fi,” in Proceedings of the ACM International Conference on Mobile Systems, Applications, and Services (MobiSys), pp. 313–325, 2019.
- [11] R. Xiao, J. Liu, J. Han, and K. Ren, “OneFi: One-Shot Recognition for Unseen Gesture via COTS WiFi,” in Proceedings of the ACM Conference on Embedded Networked Sensor Systems (SenSys), pp. 206–219, 2021.
- [12] B. Korany, H. Cai, and Y. Mostofi, “Multiple People Identification Through Walls Using Off-the-Shelf WiFi,” IEEE Internet of Things Journal, vol. 8, no. 8, pp. 6963–6974, 2021.
- [13] Y. Zeng, P. H. Pathak, and P. Mohapatra, “WiWho: WiFi-based Person Identification in Smart Spaces,” in Proceedings of ACM/IEEE International Conference on Information Processing in Sensor Networks (IPSN), pp. 1–12, IEEE, 2016.
- [14] E. Soltanaghaei, R. A. Sharma, Z. Wang, A. Chittilappilly, A. Luong, E. Giler, K. Hall, S. Elias, and A. Rowe, “Robust and practical wifi human sensing using on-device learning with a domain adaptive model,” in Proceedings of the 7th ACM International Conference on Systems for Energy-Efficient Buildings, Cities, and Transportation, pp. 150–159, 2020.
- [15] Y. Ren, Z. Wang, S. Tan, Y. Chen, and J. Yang, “Winect: 3D Human Pose Tracking for Free-form Activity Using Commodity WiFi,” Proceedings of the ACM on Interactive, Mobile, Wearable and Ubiquitous Technologies, vol. 5, no. 4, pp. 1–29, 2021.
- [16] Y. Ren, Z. Wang, S. Tan, Y. Chen, and J. Yang, “Tracking Free-Form Activity Using WiFi Signals,” in Proceedings of the 27th Annual International Conference on Mobile Computing and Networking, pp. 816–818, 2021.
- [17] C. Shi, T. Zhao, Y. Xie, T. Zhang, Y. Wang, X. Guo, and Y. Chen, “Environment-independent In-baggage Object Identification Using WiFi Signals,” in Proceedings of IEEE International Conference on Mobile Ad Hoc and Smart Systems (MASS), pp. 71–79, IEEE, 2021.
- [18] Y. Zeng, D. Wu, J. Xiong, J. Liu, Z. Liu, and D. Zhang, “MultiSense: Enabling Multi-person Respiration Sensing with Commodity WiFi,” Proceedings of the ACM on Interactive, Mobile, Wearable and Ubiquitous Technologies (IMWUT), vol. 4, no. 3, pp. 1–29, 2020.
- [19] Y. Ma, G. Zhou, and S. Wang, “WiFi Sensing with Channel State Information: A Survey,” ACM Computing Surveys (CSUR), vol. 52, no. 3, pp. 1–36, 2019.
- [20] Y. Ma, S. Arshad, S. Muniraju, E. Torkildson, E. Rantala, K. Doppler, and G. Zhou, “Location- and Person-Independent Activity Recognition with WiFi, Deep Neural Networks, and Reinforcement Learning,” ACM Trans. Internet of Things, vol. 2, Jan. 2021.
- [21] I. Nirmal, A. Khamis, M. Hassan, W. Hu, and X. Zhu, “Deep learning for radio-based human sensing: Recent advances and future directions,” IEEE Communications Surveys & Tutorials, vol. 23, no. 2, pp. 995–1019, 2021.
- [22] F. Adib and D. Katabi, “See through walls with wifi!,” SIGCOMM Comput. Commun. Rev., vol. 43, no. 4, p. 75–86, 2013.
- [23] IEEE 802.11bf Task Group (TG), “IEEE 802.11bf (TGbf) Project Authorization Request (PAR).” https://tinyurl.com/TGbfPAR, 2020.
- [24] D. Halperin, W. Hu, A. Sheth, and D. Wetherall, “Tool release: Gathering 802.11n traces with channel state information,” SIGCOMM Comput. Commun. Rev., vol. 41, p. 53, Jan. 2011.
- [25] Y. Xie, Z. Li, and M. Li, “Precise power delay profiling with commodity wifi,” in Proceedings of the 21st Annual International Conference on Mobile Computing and Networking, MobiCom ’15, (New York, NY, USA), p. 53–64, ACM, 2015.
- [26] F. Gringoli, M. Schulz, J. Link, and M. Hollick, “Free your csi: A channel state information extraction platform for modern wi-fi chipsets,” in Proceedings of the 13th International Workshop on Wireless Network Testbeds, Experimental Evaluation & Characterization, (New York, NY, USA), p. 21–28, Association for Computing Machinery, 2019.
- [27] Z. Jiang, T. H. Luan, X. Ren, D. Lv, H. Hao, J. Wang, K. Zhao, W. Xi, Y. Xu, and R. Li, “Eliminating the barriers: Demystifying wi-fi baseband design and introducing the picoscenes wi-fi sensing platform,” IEEE Internet of Things Journal, vol. 9, no. 6, pp. 4476–4496, 2022.
- [28] F. Gringoli, M. Cominelli, A. Blanco, and J. Widmer, “Ax-csi: Enabling csi extraction on commercial 802.11ax wi-fi platforms,” in Proceedings of the 15th ACM Workshop on Wireless Network Testbeds, Experimental Evaluation & CHaracterization, (New York, NY, USA), p. 46–53, Association for Computing Machinery, 2022.
- [29] T.-Y. Lin, M. Maire, S. Belongie, J. Hays, P. Perona, D. Ramanan, P. Dollár, and C. L. Zitnick, “Microsoft coco: Common objects in context,” in Proceedings of European Conference on Computer Vision (ECCV), pp. 740–755, Springer, 2014.
- [30] O. Russakovsky, J. Deng, H. Su, J. Krause, S. Satheesh, S. Ma, Z. Huang, A. Karpathy, A. Khosla, M. Bernstein, A. C. Berg, and L. Fei-Fei, “Imagenet large scale visual recognition challenge,” International Journal of Computer Vision, vol. 115, no. 3, pp. 211–252, 2015.
- [31] L. Guo, L. Wang, C. Lin, J. Liu, B. Lu, J. Fang, Z. Liu, Z. Shan, J. Yang, and S. Guo, “Wiar: A Public Dataset for WiFi-based Activity Recognition,” IEEE Access, vol. 7, pp. 154935–154945, 2019.
- [32] S. Ding, Z. Chen, T. Zheng, and J. Luo, “RF-Net: A Unified Meta-Learning Framework for RF-Enabled One-Shot Human Activity Recognition,” in Proceedings of the 18th Conference on Embedded Networked Sensor Systems (SenSys 2020), (New York, NY, USA), p. 517–530, Association for Computing Machinery, 2020.
- [33] N. Bahadori, J. Ashdown, and F. Restuccia, “ReWiS: Reliable Wi-Fi Sensing Through Few-Shot Multi-Antenna Multi-Receiver CSI Learning,” in Proceedings of IEEE International Symposium on a World of Wireless, Mobile and Multimedia Networks (WoWMoM), pp. 50–59, 2022.
- [34] M. Abbas, M. Elhamshary, H. Rizk, M. Torki, and M. Youssef, “Wideep: Wifi-based accurate and robust indoor localization system using deep learning,” in 2019 IEEE International Conference on Pervasive Computing and Communications (PerCom, pp. 1–10, 2019.
- [35] H. Abdelnasser, K. Harras, and M. Youssef, “A ubiquitous wifi-based fine-grained gesture recognition system,” IEEE Transactions on Mobile Computing, vol. 18, no. 11, pp. 2474–2487, 2019.
- [36] C. Chen, H. Song, Q. Li, F. Meneghello, F. Restuccia, and C. Cordeiro, “Wi-Fi Sensing Based on IEEE 802.11bf,” IEEE Communications Magazine, pp. 1–7, 2022.
- [37] F. Meneghello, C. Chen, C. Cordeiro, and F. Restuccia, “Towards Integrated Sensing and Communications in IEEE 802.11bf Wi-Fi Networks,” arXiv preprint arXiv:2212.13930, 2022.
- [38] F. Restuccia, “IEEE 802.11bf: Toward Ubiquitous Wi-Fi Sensing,” arXiv preprint arXiv:2103.14918, 2021.
- [39] D. Pavllo, C. Feichtenhofer, D. Grangier, and M. Auli, “3d Human Pose Estimation in Video with Temporal Convolutions and Semi-Supervised Training,” in Proceedings of the IEEE/CVF Conference on Computer Vision and Pattern Recognition, pp. 7753–7762, 2019.