Machine Learning for Visualization Recommendation Systems: Open Challenges and Future Directions
Abstract
Visualization Recommendation Systems (VRS) are a novel and challenging field of study, whose aim is to automatically generate insightful visualizations from data, to support non-expert users in the process of information discovery. Despite its enormous application potential in the era of big data, progress in this area of research is being held back by several obstacles among which are the absence of standardized datasets to train recommendation algorithms, and the difficulty in defining quantitative criteria to assess the effectiveness of the generated plots. In this paper, we aim not only to summarize the state-of-the-art of VRS, but also to outline promising future research directions.
1 Introduction
More and more sectors in society and science are interested in data-driven approaches, reshaping how strategies and decisions are taken. The availability of vast amounts of data represents an opportunity, but at the same time, introduces complexity and data interpretability challenges. The acquisition and analysis of data and their subsequent transformation into actionable insights have stimulated a significant demand for data scientists. However, the offer of these specialized profiles does not meet the needs of the industry111https://www.techtarget.com/searchbusinessanalytics/feature/Data-scientist-shortage-leaves-organizations-uncertain. Visualization Recommendation Systems (VRS), a sub-area of ML4Viz222ML4Viz is concerned with the application of ML techniques ”to achieve a better design, development, and evaluation of visualizations” Wang et al. (2021)., try to fill the gap between non-expert users and data analysis, providing automatic tools for insights discovery across different sectors and applications. For high dimensional data, VRS might be extremely useful also for data analysts, since they help reduce the search space of possible insightful visualizations Wang et al. (2021); Zhu et al. (2020). VRS represent a new emerging application of artificial intelligence, as discussed in Wu et al. (2021a). Despite the great application potential of this research area in the era of big data, a number of open challenges hinder its progress. This survey seeks not only to assess the state of the art of VRS, but also to identify the obstacles limiting their diffusion and to outline possible new promising research opportunities.
2 Problem Definition
Visualization recommendation is a new research area that helps individuals and organizations effectively communicate complex data through visual aids like infographics and charts. It is a relatively new and potentially disruptive area of research that aims to solve the problem of transforming data into information at scale in the current data-flooding scenario. Due to its novelty, a precise definition of this task and its objectives has not yet been provided in the current literature.
In general terms, we can define a visual recommender as a system that takes in input a dataset of columns (features) and suggests a set of perceptually effective charts (visualzations), highlighting relevant and insightful feature relationships in . Although a visual recommender of these capabilities is desired, current VRS try to solve a simpler problem over a smaller set of features:
Definition 1.
Given a dataset of features , a chosen subset of features, and a set of constraints , a VRS suggests a set of visualizations that provide the best insight concerning the relations among according to the constraints .
In the literature, the notions of ”constraints” and ”insight” - or effectiveness - of a visualization lack a precise definition, and are specified differently depending on the context considered. We begin with an analysis of visualization constraints. Based on the works surveyed, we have identified four types of constraints: i.e., syntax, task-based, design, and perceptual constraints.
-
•
Syntax constraints encompass a set of atomic visualization rules that conduct the correct generation of charts. These constraints depend on the relationship between single features and the visualization type. For example, line charts require the variables on the Cartesian axes to be of type ordinal or metrics.
-
•
Task-based constraints specify whether potential visualization recommendations have (non)interesting and (non)relevant visible patterns based on user-specified objectives. These constraints affect the choice of visualization types. For example, line charts and scatterplots are an appropriate choice if the task is comparing features trends.
-
•
Design constraints are a set of aesthetic specifications that beautify the recommended visualizations to render them more memorable Borkin et al. (2013), like for example an appropriate layout, choice of colors, and scale. These constraints are applied on top of the chosen visualizations .
-
•
Perceptual constraints refer to the limitations of human perception and cognitive abilities that need to be taken into account when designing a VRS. Indeed, this is the most relevant constraint since visual perception is a primary source of information as people interpret and make sense of the world around them Cole and Balcetis (2021). Perceptual features depend on the relationships among features, and therefore are those that mostly affect the insightfulness of the generated recommendations . Examples of perceptual features that affect visual interpretation are discrimination Taylor and Rodriguez (2022) and constancy Garrigan and Kellman (2008); Walsh and Kulikowski (1998).
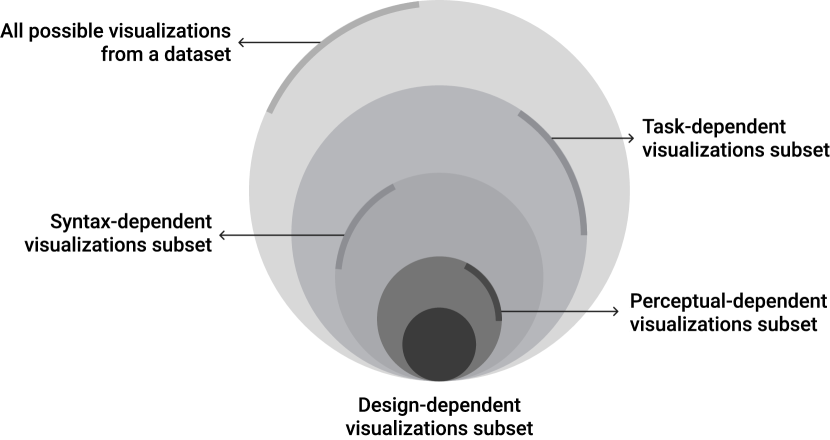
A visualization needs to satisfy all the previous constraints to be considered a ”correct” and adequate recommendation to the end-user, although they are not sufficient to guarantee insightfulness (a concept that we deepen later in this Section). Notice that the relationship that occurs between the previous constraints can be represented as a hierarchy (see Figure 1). In other words, given a set of features , the first type of constraint that induces the generation of a particular chart is incorporating task-based suggestions. For example, we could tell the VRS to concentrate on visualization types that may help identify commonalities on a set of specific features. This way, the VRS, instead of exploring the space of all possible visualizations, would look for only those that could possibly highlight the existence of clusters of data instances, such as scatterplots. The second constraints applied to the recommendation of plots are the syntax rules. For example, if we consider a quantitative feature and a categorical/ordinal one , the syntax might specify that the usage of a bar plot is advisable to convey the correct insight to the end-user, whereas, the usage of a line chart would be meaningless. Once we identify the charts that respect the syntax, a VRS reduces the visualization space by selecting those that best approximate particular perceptual properties. For instance, given a set of scatter plots, not all are appropriate for recommendation due to overplotting333Overplotting is when the data in a visualization overlap, making it difficult to see individual data points. Bertini and Santucci (2006), or cluster ambiguity Behrisch et al. (2018), which hinder humans’ ability to discriminate. Therefore, a VRS should try to select those charts that mitigate/reduce perceptual problems and better visually represent the underlying feature relationships. Lastly, a VRS refines the aesthetics of the recommended charts by tuning retinal properties (e.g., avoiding using indistinguishable colors), and graphical marks (e.g., legend representation) following specific design constraints.
While, in principle, the first three types of constraints can be easily incorporated in a VRS based on well-established sets of rules Hayes-Roth (1985), perceptual features are by far more complex since they are mostly defined at a qualitative level Heer et al. (2009); Reda et al. (2018). It follows that the set of perceptual constraints can be empty, thus enabling intelligent VRS to learn the latent visual relationships of the dataset features from the charts in the training data (see Dibia and Demiralp (2019); Luo et al. (2018)) and exploit the learned constraints to make recommendations at inference time.
Considering that the visualizations that satisfy the constraints above are only correct from a rule-based perspective, they might not best emphasize the relationships among the features . Therefore, they need to be ordered according to a particular effectiveness/insightfulness measure.
Recall that is the space of all possible visualizations induced from the dataset features . According to what we discussed above, we can define a visualization generation function that, given in input a pair of features444For the sake of simplicity, we discuss only 2d charts hereafter. , provides a visualization conditioned on the constraint set . Furthermore, we can define an insightfulness function that, taken in input a visualization, outputs an effectiveness score. Hence, a VRS can order the recommended visualizations for all feature couples as follows:
| (1) |
According to equation 1, all feature pairs have a set of most insightful visualizations associated with them. These visualizations are then sorted according to their insightfulness score and returned to the end-user as a set of the best-representing plots of the underlying feature relationships, conditioned on the constraints learned or provided in input. Equation 1 guarantees to include the most insightful visualization according to function for each feature pair s.t. . Finally, to alleviate the end-user from consulting a plethora of recommendations, in practice, recommender systems may return the top suggestions (or those with an insightfulness score above a threshold ).
Although the previous definition of visual recommenders is useful to clarify the problem and its boundaries, the literature has not yet proposed quantitative measures to assess . Common measures adopted in the literature of recommender systems include memorability Borkin et al. (2013), emotional engagement Kennedy et al. (2016), and serendipity Ziarani and Ravanmehr (2021), but these are mostly qualitative when applied to images. In absence of consolidated metrics, VRS to date rely on crowdsourcing to determine the correctness (rather than an insightfulness score) of a proposed visualization: a visualization is labeled as ”correct” if it has been generated, or approved, by human analysts (see Section 3.2).
3 A VRS taxonomy: methods and open challenges
In this Section, we survey the methods and solutions in the VRS literature, divided into rule-based, ML-based, and hybrid VRS (see Section 3.1). The objective is to investigate how machine learning has affected the development of more complex VRS compared to simple rule-based recommendations, which are not the primary focus of this paper. Our survey delves into the problem of recommending the most informative visualizations to the end-user, unlike prior surveys that focus on the general problem of generating visualizations using ML approaches Wang et al. (2021); Zhu et al. (2020). Here, we present a taxonomy of the state-of-the-art in Section 3.2 and stress the importance of incorporating constraints and using diverse evaluation frameworks. We also emphasize the importance of the built-in interpretability mechanisms to support the user’s understanding of the recommended charts. Finally, we present open challenges and suggest directions for future research in Sections 3.3 and 4.
3.1 Related work
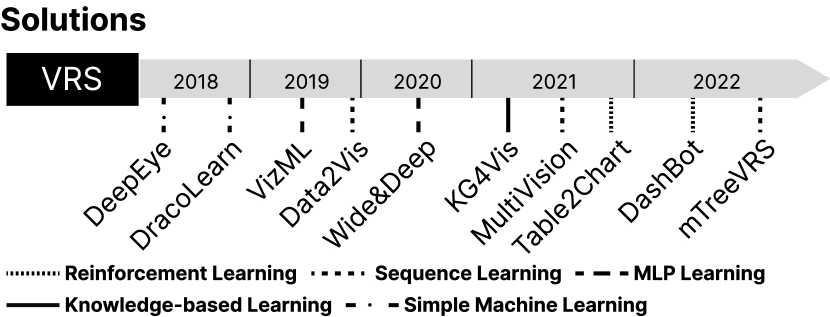
Figure 2 illustrates the distribution of the papers in the VRS literature in time. Notice that the field of VRS had its first contributions in the mid-80s with rule-based methods being the most prominent approaches. Although in this survey we concentrate on intelligent VRS employing machine/deep learning techniques, for completeness purposes, we provide a brief description of the evolution of rule-based VRS in general.
Rule-based VRS: The majority of VRS are rule-based and are built on the foundations laid by the seminal works in Bertin (1983); Cleveland and McGill (1984). A first example of this approach is APT Mackinlay (1986), which generates, filters, and scores visualizations based on criteria such as expressiveness and perceptual effectiveness. Other systems, such as SAGE Roth et al. (1994), BOZ Casner (1991), and Show Me Mackinlay et al. (2007) support a wider range of data, encodings, and tasks. Recently, hybrid systems Chakrabarti et al. (2021); Hu et al. (2018); Viégas et al. (2018); Wongsuphasawat et al. (2015, 2017) have emerged, which blend visual encoding rules with the recommendation of visualizations that include non-selected columns. Lastly, TaskVis Shen et al. (2022) supports user-specified tasks - among 18 possible task choices (e.g., clustering, comparison, correlation) - that narrow down the process of recommending visualizations.
Despite their effectiveness, rule-based systems have limitations in capturing non-linear relationships and require expert judgement and resources for crafting basic rules. Lastly, as input data dimensionality increases, the combinatorial nature of rules results in an exponential increase in the number of possible recommendations.
ML-based VRS: Data2Vis Dibia and Demiralp (2019) is a neural translation model for automated visualization generation where tabular data is mapped to visualization specifications in Vega-Lite Satyanarayan et al. (2016). It relies on a two-layered bidirectional LSTM encoder-decoder architecture with an attention module and trains the model - without any pre-defined constraints - on a corpus of Vega-Lite visualization specifications with six chart types and three data transformations (i.e., aggregate, bin, and time-unit). VizML Hu et al. (2019) tackles the visual recommendation problem as a procedure for making design selections to enhance effectiveness, which depends on the dataset, task, and context. Here, the authors generate a raw dataset of one million unique dataset-visualization pairs. They elaborate on their methodology of collecting, preprocessing and extracting features from the corpus, by identifying five crucial design choices555For example, choosing how to encode a particular column along the x- or y-axis, or selecting a specific chart type. from the visualizations. Finally, they predict these design choices using a three-layer neural network with ReLU activation functions. Wide&Deep Qian et al. (2020), first, encodes the visualizations into meta-features based on the combination of features and some specific configuration. Then, the wide model outputs a wide score using linear manipulations over cross-product feature transformations to capture any occurrence of feature pairs that lead to interesting visualizations. The deep model outputs a deep score using non-linear transformations to generalize unseen feature pairs that might lead to effective visualizations. Table2Chart Zhou et al. (2021) uses an encoder-decoder deep Q-value network (DQN) for table-to-template generation, incorporating a copying mechanism to select relevant features to fill templates. To handle imbalanced data, it relies on a mixed learning approach and trains the DQN on a multi-type task of the main chart types. The authors use a shared encoder for all recommendation tasks, which is exposed to diverse source tables of several chart types. This enables the encoder to learn shared table representations that contain both semantic and statistical information about data features. The pre-trained table representations are then transferred to type-specific decoders for single-type tasks. Multivision Wu et al. (2021b) is a Siamese neural network approach for multi-view recommender systems. It employs a bidirectional LSTM layer to predict an assessment score for data feature selections. Additionally, it incorporates a multiple-view visualization (MV) as a sequence of chart embeddings using scores predicted by a single-chart assessment model and MV design guidelines Baldonado et al. (2000). KG4Vis Li et al. (2021) bridges the gap between manual rule specifications and black-box machine learning approaches. Here, the knowledge graph models the relationship between different entities and TransE Bordes et al. (2013) is used to learn the embeddings of both relations and entities, thus, learning the visualization generation rules. When a new dataset is given, KG4Vis infers the relevant rules and recommends effective visualizations, offering interpretability, and automation (no domain expert knowledge for rule specification). mTreeVRS Wang et al. (2022) encompasses three layers: i.e, Subspace Importance Assessment (SIA), Visualization Type Recommendation (VTR), and Rule-based Chart Encoding (RbCE). The SIA component evaluates the importance of each attribute in the input multidimensional hierarchical tree using a random forest which selects the top three most important attributes. These are fed to the VTR component that predicts chart types for all attributes. Finally, the attribute and the predicted chart type are passed to the RbCE component, which adopts user-defined rules to transcribe them into visualizations. DashBot Deng et al. (2022) is a reinforcement learning strategy for dashboards of charts. The proposed network learns mutual relationships between charts and generates a unified dashboard. It is designed to achieve value estimation, action prediction, and parameter selection with an integrated structure. It can also predict parameters in light of their interrelationships, e.g. when adding a chart, chart configurations should be considered, while, when changing the key column, the columns to be selected should be taken into account.
Hybrid VRS: To the best of our knowledge, DeepEye Luo et al. (2018) and DracoLearn Moritz et al. (2018) are the only hybrid VRS approach, that try to ameliorate, via ML strategies, rules specified by domain experts. DeepEye addresses the visualization recognition, ranking, and selection problems. The system uses a binary classifier, learning-to-rank model, experts’ knowledge, graph-based techniques, and rule-based optimization to select the top-k visualizations and eliminate suboptimal ones. The authors focus on supporting the best choice of bar, line, pie, and scatter charts on real-world datasets from several domains. DracoLearn is a system that utilizes a formal model to encode visualizations with both hard and soft constraints. Hard constraints, as defined by the authors, encompass task-based and syntax constraints that are mandatory for a visualization to be considered suitable for recommendation purposes. In contrast, soft constraints are comprised of design and perceptual criteria that while not essential, may still be taken into consideration during the visualization recommendation process. Therefore, the framework recommends visualizations that do not violate the hard constraints and are ranked highest according to the soft constraints by training a RankSVM classifier on the feature vectors of the visualizations.
3.2 A taxonomic view of VRS
|
|
|
|
|
|||||||||||
|---|---|---|---|---|---|---|---|---|---|---|---|---|---|---|---|
| DeepEye Luo et al. (2018) | Perceptual, Task-based |
|
B, L, P, S | P, R, F1 | |||||||||||
| DracoLearn Moritz et al. (2018) | Perceptual | RankSVM | A, B, D, H, L, S | Ranking accuracy | |||||||||||
| VizML Hu et al. (2019) | Perceptual, Task-based, Syntax | MLP | B, L, S | Accuracy | |||||||||||
| Data2Vis Dibia and Demiralp (2019) | Perceptual, Task-based, Syntax, Design |
|
A, B, C, L, S, T | LSV, GSV | |||||||||||
| Wide&Deep Qian et al. (2020) | Perception, Task-based | MLP | All from Plotly | nDCG@k | |||||||||||
| KG4Vis Li et al. (2021) | Perceptual, Task-based, Syntax, Design | TransE-Adversarial | ✓ | B, Bx, H, Hm, L, S | Axes accuracy, Hits@2 | ||||||||||
| MultiVision Wu et al. (2021b) | Perceptual, Task-based (optional), Syntax | Siamese (Bi LSTM) | A, B, L, P, R, S |
|
|||||||||||
| Table2Chart Zhou et al. (2021) | Perceptual, Task-based | Deep Q-network | A, B, L, P, R S | R@k, k | |||||||||||
| DashBot Deng et al. (2022) | Perception, Task-based (optional) | RL (Bi LSTM) | A, B, L, P, R, S | - | |||||||||||
| mTreeVRS Wang et al. (2022) | Perceptual, Syntax | Bi-LSTM | B, L, P, S | Accuracy, P, R, F1 |
To better categorize the surveyed recommendation approaches, we identify five comparison dimensions (see Table 1): (1) Learning of constraints illustrates whether the constraints are fed to the model or learned automatically; (2) Recommendation model depicts the machine learning approach used to suggest visualizations; (3) Supported interpretability highlights whether the strategy is interpretable; (4) Supported visualizations defines which chart types are supported; (5) VRS evaluation metrics depicts the evaluation measurements used in the literature. In the following, we describe each dimension in detail, and we cover the most interesting aspects of each work according to the considered dimension:
Learning of constraints: Recall that we distinguish between several types of constraints. Generally, a VRS can learn these constraints autonomously or receive them as input which conditions the generation of the visualizations. For each of the works in Table 1, we depict whether they automatically learn each constraint type. Notice that all works, besides DracoLearn and mTreeVRS, learn task-based constraints instead of expecting them in input from the end-user. Thus, these VRS initially explore the search space of all possible visualizations and do not concentrate on a particular user-specified objective/goal: i.e., we can define these systems as task agnostic. Additionally, Multivision and DashBot are capable of learning the task autonomously, or they can optionally receive the task as constraints to shrink the initial search space of visualizations. Contrarily, DracoLearn accepts a mandatory user primary task including task-based constraints, while Multivision extracts the top three attributes with the greatest information gain depending on an initial user-selected feature, which encapsulates the desire to explore specific visualizations correlated to it. Notice that the majority of works (DeepEye, DracoLearn, Wide&Deep, Multivision, Table2Chart, DashBot, mTreeVRS) rely on default and well-established design constraints per chart type to make the recommendations more aesthetic rather than trying to learn them from the training visualizations and data features. Furthermore, most of the enlisted works rely on predefined syntactic constraints that help sieve the space of all visualizations (DeepEye, DracoLearn, Wide&Deep, Table2Chart, DashBot). Interestingly, learning syntactic constraints in Data2Vis happens indirectly. In other words, because the authors pose the visualization recommendation problem as a machine translation problem - i.e., sequence-to-sequence learning - the training input depicts feature relationships, and the training output is a well-defined textual representation of the desired visualization. This textual representation encodes syntax constraints therein. Thus, when the model learns to ”translate” feature relationships to the textual representation of the visualizations, it inherently detects hidden syntax constraints, that can be used at inference time. Finally, as expected from ML-based VRS, all the surveyed works are capable of learning perceptual constraints instead of relying on domain expert rules. Although an ideal VRS is fully agnostics - i.e., learns all constraint types without considering the aspect of human-in-the-loop - we argue that task-based constraints are beneficial in real-world scenarios - see Section 3.3.
Recommendation model: It depicts how the proposed works in literature implement intelligent methods to suggest visualizations automatically. As shown in Figure 2, these methods range from basic machine learning to advanced reinforcement learning. For example, DeepEye uses a decision tree to determine the best chart type (scatter, line, bar, or pie) for a given set of features, and then uses a LambdaMART model Burges (2010) to rank the charts based on effectiveness. DracoLearn uses a RankSVM model to order the visualizations based on input constraints. VizML uses neural network models to make five decision choices from data, while Wide&Deep uses neural networks to infer design decisions without constraints. Data2Vis approaches the problem as a language translation task, using a bidirectional LSTM with attention, KG4Vis uses a knowledge graph and TransE to learn embeddings on it for improving prediction interpretability, Multivision implements learning-to-rank approach using a Siamese network and a bidirectional LSTM, while Table2Chart and DashBot use reinforcement learning to generate visualizations. The former implements an encoder-decoder deep Q-value network, where the encoder learns both semantic and statistical features information. The latter proposes a reinforcement learning technique to generate analytical dashboards that can use well-established visualization knowledge. Lastly, mTreVRS adopts a three-layered architecture, where a random forest layer returns the top three most important attributes, a bidirectional LSTM selects the chart type, and a post-processing rule-based module translates it into the correct visualization.
Supported interpretability: It examines the capability of visualization recommendation strategies to support end-users in understanding the reasoning behind the suggested visualizations: why was a particular visualization selected among the many possible ones? Only a few methods provide inherent interpretability. For example, DeepEye is a method that combines a decision tree, which is interpretable, with LambdaMART, which does not provide any clear explanation of the predicted outcome, leading to the argument that this visualization recommendation strategy is uninterpretable end-to-end. In contrast, KG4Vis is the only strategy that fully supports interpretability by utilizing a knowledge graph, allowing to illustrate the prediction steps by traversing the graph from the initial concept to the final prediction outcome (concept leaves). The remaining studies, due to the complexity of interpreting deep learning Fazi (2021); Olah et al. (2018), do not consider interpretability as an integral part of their strategy.
Supported visualizations: It defines which chart types are supported in the predictions of the VRS in the literature. Notice that here we are examining the case in which the chart types are not specified in the form of task-based or design constraints; rather, they represent an inherent constraint rising from a limitation of the visual representation types available in the provided Training set. Since models are trained on a few chart types, they can only learn to predict the best visualizations belonging to the observed types. In general, the most recurrent chart types are scatter, line, and bar plots. Wide&Deep is the only method that considers all the visualization types available in the Plotly repository. Additionally, KG4Vis supports two less frequently used chart types (i.e., box plots and heatmaps). The rest of the works encompass simpler chart types (e.g., area, pie, radio, and tick charts).
VRS evaluation metrics: We refer the reader to Bobadilla et al. (2013) for a review of recommender systems and their evaluation, as this is out of scope in this survey. First, we note that, as anticipated in Section 2, all systems evaluate the performance only with reference to the (binary) ground truth represented by annotated data, rather than providing some measurable notion of perceptual insightfulness. All works presented in the literature adopt standard evaluation metrics for recommender systems: i.e., Recall@k (used in Multivision and Table2Chart), and Hits@k (used in KG4Vis) However, VizML, DeepEye, and mTreeVRS use evaluation metrics such as accuracy, precision, recall and F1 without considering the ranking aspect of the suggested visualizations, leading to an incomplete understanding of the model performances. Additionally, DracoLearn and Multivision rely on ranked accuracy to account for the imbalance phenomenon. Differently, Data2Vis uses custom metrics such as Language Syntax Validity (LSV) and Grammar Syntax Validity (GSV) to address the lack of appropriate metrics for sequence-to-sequence models in evaluating the transformation of data into visualizations. KG4Vis, besides relying on Hits@k Bordes et al. (2013) for evaluating the performances of their VRS, uses accuracy to determine whether the features used in a particular recommended visualization belong to either one of the axes (binary classification). Finally, Wide&Deep relies on nDCG@k, a modified version of the classic nDCG metric, to account for a correct evaluation of the relevance of the suggested visualizations in VRS.
3.3 Open challenges
Implementing VRS presents challenges that require more robust and effective systems. We identified five recurrent and critical challenges currently hindering the advancement of this research field.
Assessing the effectiveness of visual recommendations: The ability to evaluate the usefulness of suggested charts in visualization recommendation is limited by a lack of clear metrics. These metrics, known as perceptual metrics, assess how well a chart communicates insights. However, creating these metrics is difficult as they depend on the context, task and user’s expertise. Additionally, different chart types have unique properties that affect their ability to communicate insights. For example, scatter plots that show densest areas (clusters) or some visible trend, capture the attention since they tell us something relevant about the relationship between plotted variables. To address this issue, researchers are working on creating cross-chart perceptual metrics for VRS Behrisch et al. (2018). Furthermore, incorporating serendipity in visualization recommendations can improve the users’ experience by providing new and unexpected insights, increasing the chances of discovering hidden patterns or valuable information that they may have missed otherwise. It also allows them to explore the data in new ways and can lead to more creative and innovative solutions.
Unlocking the black box and the interpretability of VRS: Complex VRS rely on deep learning and have demonstrated outstanding performance in generating significant recommendations. However, they suffer from the so-called ”black-box” problem, which hinders interpreting what happens ”under the hood”. Thus, interpretability is an important aspect in the development and deployment of these systems. According to the European Commission Commission (2020), interpretable systems create safer digital environments for users, developers, and business stakeholders, while encouraging privacy, trustworthiness, and fairness. In critical scenarios - e.g., healthcare and finance - the lack of interpretability makes it difficult to trust the model. As a consequence, it renders the predictions useless. Moreover, visualizations could be misleading if the decision process of the model cannot be unrolled and interpreted. Imagine a non-expert user utilizing an uninterpretable VRS to suggest charts for data on non-smoker patients with lung cancer. The VRS suggests a chart showing the relationship between mutations of certain genes Dabir et al. (2014) and the likelihood of having lung cancer. A trained doctor would know that lung cancer is not only caused by these mutations, but a less experienced user might misunderstand the chart. To prevent this, VRS deployed in critical scenarios (like healthcare, finance, and many others) need to incorporate strategies that inherently provide the end-user with human-readable cues that motivate the chart suggestions. Although state-of-the-art explainability mechanisms designed for image classification (e.g., Donnelly et al. (2021) among others) might be a useful starting point, they are not readily useful to indicate which parts of a chart convey relevant and perceptually visible information on an existing relationship between plotted variables. Note that this issue is closely related to the problem of finding good perceptual metrics.
Navigating the sparse search-space in visualization generation: The following arguments rely on a task-agnostic VRS. We observe that the VRS face dimensionality challenges regarding the number of axes, the number of charts, and the number of suitable feature combinations. For instance, the number of possible chart suggestions in 2d is , representing the combinations of features without repetitions for different chart types. For the sake of the argument, let us suppose that all the 2d chart combinations are valid and are recommended to the end-user666We are aware that the entire search space of visualizations is cutoff according to some significance threshold which is generally a learned function in ML-based VRS., and we suggest only bar plots (i.e., ). While the problem is tractable when is relatively small, large feature spaces would entail a high number of potentially significant charts to examine. For example, when , the end-user needs to assess 45 different bar plots to determine whether the information conveyed is useful or not. Notice that, the search space for visual recommendations can be complex even if the VRS has task-based constraints. In these cases, the overall 2d chart combinations are bounded/reduced according to the number of features requested for analysis by the end-user, instead of searching in the entire feature space .
| Work | Generation process | Data-vis pairs | Link | ||
|---|---|---|---|---|---|
| DeepEye | Crowdsourcing (100 users) | Not applicable | - | ||
|
Crowdsourcing (140k users) | 2.3m | 1 | ||
| Data2Vis | Rule-based | 215k | 2 | ||
| Table2Chart, Multivision | Manually-generated | 200k | - | ||
| DracoLearn | Internally created | Not applicable | 3 |
Obtaining high-quality datasets for VRS:
A VRS dataset is structured as a collection of data-visualization (hereafter data-vis) pairs. Starting from available datasets, visualizations are generated using either a JSON-like syntax, which defines the structure and appearance of the plot, or the high-level Vega-Lite syntax, designed for creating interactive visualizations. Regardless of the syntax used to generate visualizations, the plotted variables and types of charts are selected manually either through crowdsourcing, or self-crafted by the VRS authors and their research groups, with the only exception of Data2Vis, where a rule-based approach is adopted. Furthermore, not all authors make their data available, as shown in Table 2.
In Data2Vis, the visualizations are obtained from a collection of 11 datasets using a set of heuristics designed to generate plots based on data and perceptual features. In this way, they generate an initial set of 4.3k Vega-Lite visualizations that are subsequently expanded using a repetitive sampling strategy, resulting in 215k pairs, with six distinct visualization types (area, bar, circle, line, point, tick) and three different transformations (aggregate, bin, time-unit). However, the quality of the pairs is tied to the initial rules, potentially leading to bias in the entire dataset. VizML, Wide&Deep, KG4Vis, and mTreeVRS use a crowdsourced dataset, Plotly, which is a collection of 2.3 million data-vis pairs created by 140k users on the Plotly Community Feed. The Plotly corpus, besides charts generated by experts, contains bogus plots generated by non-experts which pollute the overall visualization distribution, rendering it biased towards insignificant charts. We refer the reader to Podo and Velardi (2022) to address this issue. The authors propose a cleaned version of the Plotly dataset that disambiguates insightful charts from non-insightful ones by relying on a hybrid ML-and-human-in-the-loop approach to reduce bias and increase the dataset’s quality. The authors of Table2Chart and Multivision use a manually crafted dataset of 200k pairs for training, and Plotly for evaluation. The authors of DracoLearn and Deepeye do not exploit data-vis pairs for training. Rather, they use visualization pairs, with annotations to identify the best chart in a pair. The authors of DracoLearn use 1.1k pairs of visualizations, while in DeepEye all possible pairs of visualizations are generated from 42 datasets, and subsequently annotated by 100 students. However, the dataset is not available.
In conclusion, the performance of VRS systems is hindered by the quality of the datasets employed for training and evaluation. The use of biased or noisy datasets may lead to recommendations that exclude certain groups of visualizations and small datasets can limit the diversity and generalizability of the recommendations. Addressing these limitations is crucial for advancing the applicability of VRS in real-world scenarios.
Task-agnostic VRS in complex and critical domains: In VRS the ambitious goal is to generate a visualization from a dataset without the human contribution to the task definition. Recall that task agnosticism means that the end-user receives the best visualizations that encode hidden insights from data with no pre-defined constraints. Although a few systems tried to achieve this goal (see Section 3.2), the majority of them are inherently limited by the types of charts included in the training set. We note, however, that a task-dependent VRS might be useful in critical domains to guide the search mechanism towards useful visualizations w.r.t. a user-specified task. A possible, and relatively unexplored solution (at least with reference to VRS), would be of letting the user define contexts and tasks through lightweight specifications, e.g., in natural language777In other application domains, such as automated code generation, providing specifications in natural language is already a reality https://openai.com/api/.
4 Future Directions
The methods proposed for implementing VRS in the literature are often impractical for real-world scenarios, due to the open challenges outlined in Section 3.3. One major challenge facing VRS is the need for more interpretability for deep learning strategies. In critical fields, the absence of interpretability negatively affects the usability of VRS, making them virtually unusable. As such, an area of potential investigation for future studies would be the creation of more sophisticated and user-friendly built-in interpretability techniques, aimed at assisting end-users in comprehending the visual suggestion mechanism. Additionally, interpretability can be enhanced by incorporating domain-specific knowledge into the VRS, which can aid in identifying meaningful insights in a specific context, and also in effectively reducing the visualization search space. Another significant challenge facing VRS is the lack of standardized and effective quality metrics. In particular, researchers should concentrate on defining quantitative metrics that may capture the perceptual insightfulness of visualizations. This limitation is further exacerbated by the diversity of constraints (see Section 2) in different application contexts. Furthermore, having these metrics would allow researchers to improve existing datasets by reducing bias and discarding non-insightful visualizations, and could even pave the way for unsupervised approaches which are totally absent in literature. Finally, to make VRS usable in real-world and high-stakes situations, future research should focus on task-based VRS rather than one-shot and task-agnostic recommendation approaches, which seem unfeasible in real scenarios. This could lead to a focus on visual generative approaches suggesting insightful and effective visualizations for a provided dataset (e.g., Ramesh et al. (2022); Nichol et al. (2022)) given lightweight task-based constraints, for example, expressed with an input query in natural language.
5 Conclusion
The increasing need for visualization recommendation systems (VRS) is due to a proliferation of daily data and a shortage of data analysts, which has led to growing interest in the field. To the best of our knowledge, this is the first systematic survey on VRS. In our study, we aimed to provide a comprehensive overview of the current state of VRS and its potential for real-world applications.
We began by conducting a thorough review of the literature to establish a uniform definition of VRS. Then, we analyzed the specific constraints and effectiveness measurements that are central to VRS, highlighting the importance of factors such as interpretability, the ability to learn multiple constraint types, and the definition of appropriate evaluation metrics to rank recommended visualizations. Through our analysis, we identified several open challenges that may impede the widespread adoption of VRS in real-world complex scenarios. Furthermore, we also provided guidance for future research to address these challenges and further advance the field of VRS.
References
- Baldonado et al. [2000] M. Q. W. Baldonado, A. Woodruff, and A. Kuchinsky. Guidelines for using multiple views in information visualization. In Proceedings of the working conference on Advanced visual interfaces, AVI 2000, Palermo, Italy, May 23-26, 2000, pages 110–119. ACM Press, 2000.
- Behrisch et al. [2018] M. Behrisch, M. Blumenschein, N. W. Kim, L. Shao, M. El-Assady, J. Fuchs, D. Seebacher, A. Diehl, U. Brandes, H. Pfister, et al. Quality metrics for information visualization. In Computer Graphics Forum, volume 37, pages 625–662. Wiley Online Library, 2018.
- Bertin [1983] J. Bertin. Semiology of graphics. University of Wisconsin press, 1983.
- Bertini and Santucci [2006] E. Bertini and G. Santucci. Give chance a chance: modeling density to enhance scatter plot quality through random data sampling. Information Visualization, 5(2):95–110, 2006.
- Bobadilla et al. [2013] J. Bobadilla, F. Ortega, A. Hernando, and A. Gutiérrez. Recommender systems survey. Knowledge-based systems, 46:109–132, 2013.
- Bordes et al. [2013] A. Bordes, N. Usunier, A. Garcia-Duran, J. Weston, and O. Yakhnenko. Translating embeddings for modeling multi-relational data. Advances in neural information processing systems, 26, 2013.
- Borkin et al. [2013] M. A. Borkin, A. Vo, Z. Bylinskii, P. Isola, S. Sunkavalli, A. Oliva, and H. Pfister. What makes a visualization memorable? IEEE transactions on visualization and computer graphics, 19(12):2306–2315, 2013.
- Burges [2010] Christopher JC Burges. From ranknet to lambdarank to lambdamart: An overview. Learning, 11(23-581):81, 2010.
- Casner [1991] S. M. Casner. Task-analytic approach to the automated design of graphic presentations. ACM Transactions on Graphics (ToG), 10(2):111–151, 1991.
- Chakrabarti et al. [2021] A. Chakrabarti, F. Ahmad, and C. Quix. Towards a rule-based visualization recommendation system. In KDIR, pages 57–68, 2021.
- Cleveland and McGill [1984] W. S. Cleveland and R. McGill. Graphical perception: Theory, experimentation, and application to the development of graphical methods. Journal of the American statistical association, 79(387):531–554, 1984.
- Cole and Balcetis [2021] S. Cole and E. Balcetis. Chapter three - motivated perception for self-regulation: How visual experience serves and is served by goals. volume 64 of Advances in Experimental Social Psychology, pages 129–186. Academic Press, 2021.
- Commission [2020] European Commission. On artificial intelligence—a european approach to excellence and trust, 2020.
- Dabir et al. [2014] S. Dabir, S. Babakoohi, A. Kluge, J. J. Morrow, A. Kresak, M. Yang, D. MacPherson, G. Wildey, and A. Dowlati. Ret mutation and expression in small-cell lung cancer. Journal of Thoracic Oncology, 9(9):1316–1323, 2014.
- Deng et al. [2022] D. Deng, A. Wu, H. Qu, and Y. Wu. Dashbot: Insight-driven dashboard generation based on deep reinforcement learning. IEEE Transactions on Visualization and Computer Graphics, 29(1):690–700, 2022.
- Dibia and Demiralp [2019] V. Dibia and C. Demiralp. Data2vis: Automatic generation of data visualizations using sequence-to-sequence recurrent neural networks. IEEE computer graphics and applications, 39(5):33–46, 2019.
- Donnelly et al. [2021] Jon Donnelly, Alina Jade Barnett, and Chaofan Chen. Deformable protopnet: An interpretable image classifier using deformable prototypes. Computer Vision and Pattern Recognition, 2021.
- Fazi [2021] M. B. Fazi. Beyond human: Deep learning, explainability and representation. Theory, Culture & Society, 38(7-8):55–77, 2021.
- Garrigan and Kellman [2008] P. Garrigan and P. J. Kellman. Perceptual learning depends on perceptual constancy. Proceedings of the National Academy of Sciences, 105(6):2248–2253, 2008.
- Hayes-Roth [1985] F. Hayes-Roth. Rule-based systems. Communications of the ACM, 28(9):921–932, 1985.
- Heer et al. [2009] J. Heer, N. Kong, and M. Agrawala. Sizing the horizon: the effects of chart size and layering on the graphical perception of time series visualizations. In Proceedings of the SIGCHI conference on human factors in computing systems, pages 1303–1312, 2009.
- Hu et al. [2018] K. Z. Hu, D. Orghian, and C. A. Hidalgo. DIVE: A mixed-initiative system supporting integrated data exploration workflows. In Carsten Binnig, Juliana Freire, and Eugene Wu, editors, Proceedings of the Workshop on Human-In-the-Loop Data Analytics, HILDA@SIGMOD 2018, Houston, TX, USA, June 10, 2018, pages 5:1–5:7. ACM, 2018.
- Hu et al. [2019] K. Hu, M. A. Bakker, S. Li, T. Kraska, and C. Hidalgo. Vizml: A machine learning approach to visualization recommendation. In Proceedings of the 2019 CHI Conference on Human Factors in Computing Systems, pages 1–12, 2019.
- Kennedy et al. [2016] H. Kennedy, R. L. Hill, W. Allen, and A. Kirk. Engaging with (big) data visualizations: Factors that affect engagement and resulting new definitions of effectiveness. First Monday, 21(11), 2016.
- Li et al. [2021] H. Li, Y. Wang, S. Zhang, Y. Song, and H. Qu. Kg4vis: A knowledge graph-based approach for visualization recommendation. IEEE Transactions on Visualization and Computer Graphics, 28(1):195–205, 2021.
- Luo et al. [2018] Y. Luo, X. Qin, N. Tang, and G. Li. Deepeye: Towards automatic data visualization. In 2018 IEEE 34th international conference on data engineering (ICDE), pages 101–112. IEEE, 2018.
- Mackinlay et al. [2007] J. Mackinlay, P. Hanrahan, and C. Stolte. Show me: Automatic presentation for visual analysis. IEEE transactions on visualization and computer graphics, 13(6):1137–1144, 2007.
- Mackinlay [1986] J. Mackinlay. Automating the design of graphical presentations of relational information. Acm Transactions On Graphics (Tog), 5(2):110–141, 1986.
- Moritz et al. [2018] D. Moritz, C. Wang, G. L Nelson, H. Lin, A. M. Smith, B. Howe, and J. Heer. Formalizing visualization design knowledge as constraints: Actionable and extensible models in draco. IEEE transactions on visualization and computer graphics, 25(1):438–448, 2018.
- Nichol et al. [2022] A. Q. Nichol, P. Dhariwal, A. Ramesh, P. Shyam, P. Mishkin, B. McGrew, I. Sutskever, and M. Chen. GLIDE: towards photorealistic image generation and editing with text-guided diffusion models. In International Conference on Machine Learning, ICML 2022, 17-23 July 2022, Baltimore, Maryland, USA, volume 162 of Proceedings of Machine Learning Research, pages 16784–16804. PMLR, 2022.
- Olah et al. [2018] C. Olah, A. Satyanarayan, I. Johnson, S. Carter, L. Schubert, K. Ye, and A. Mordvintsev. The building blocks of interpretability. Distill, 3(3):e10, 2018.
- Podo and Velardi [2022] L. Podo and P. Velardi. Plotly. plus, an improved dataset for visualization recommendation. In Proceedings of the 31st ACM International Conference on Information & Knowledge Management, pages 4384–4388, 2022.
- Qian et al. [2020] X. Qian, R. A. Rossi, F. Du, S. Kim, E. Koh, S. Malik, T. Y. Lee, and J. Chan. Ml-based visualization recommendation: Learning to recommend visualizations from data. arXiv preprint arXiv:2009.12316, 2020.
- Ramesh et al. [2022] A. Ramesh, P. Dhariwal, A. Nichol, C. Chu, and M. Chen. Hierarchical text-conditional image generation with CLIP latents. CoRR, abs/2204.06125, 2022.
- Reda et al. [2018] K. Reda, P. Nalawade, and K. Ansah-Koi. Graphical perception of continuous quantitative maps: the effects of spatial frequency and colormap design. In Proceedings of the 2018 CHI Conference on Human Factors in Computing Systems, pages 1–12, 2018.
- Roth et al. [1994] S. F. Roth, J. Kolojejchick, J. Mattis, and J. Goldstein. Interactive graphic design using automatic presentation knowledge. In Proceedings of the SIGCHI conference on Human factors in computing systems, pages 112–117, 1994.
- Satyanarayan et al. [2016] A. Satyanarayan, D. Moritz, K. Wongsuphasawat, and J. Heer. Vega-lite: A grammar of interactive graphics. IEEE transactions on visualization and computer graphics, 23(1):341–350, 2016.
- Shen et al. [2022] Leixian Shen, Enya Shen, Zhiwei Tai, Yihao Xu, Jiaxiang Dong, and Jianmin Wang. Visual data analysis with task-based recommendations. Data Science and Engineering, 7(4):354–369, 2022.
- Taylor and Rodriguez [2022] K. Taylor and J. Rodriguez. Visual discrimination. In StatPearls [Internet]. StatPearls Publishing, 2022.
- Viégas et al. [2018] F. Viégas, M. Wattenberg, D. Smilkov, J. Wexler, and D. Gundrum. Generating charts from data in a data table. US 20180088753 A, 1:2018, 2018.
- Walsh and Kulikowski [1998] V. Walsh and J. Kulikowski. Perceptual constancy: Why things look as they do. Cambridge University Press, 1998.
- Wang et al. [2021] Q. Wang, Z. Chen, Y. Wang, and H. Qu. A survey on ml4vis: Applying machinelearning advances to data visualization. IEEE Transactions on Visualization and Computer Graphics, 2021.
- Wang et al. [2022] G. Wang, B. Tan, Z. Wang, J. Wang, H. Guo, and Y. Wu. A machine learning approach to visual insight discovery in multidimensional hierarchical data. In 2022 5th International Conference on Pattern Recognition and Artificial Intelligence (PRAI), pages 1304–1310. IEEE, 2022.
- Wongsuphasawat et al. [2015] K. Wongsuphasawat, D. Moritz, A. Anand, J. Mackinlay, B. Howe, and J. Heer. Voyager: Exploratory analysis via faceted browsing of visualization recommendations. IEEE transactions on visualization and computer graphics, 22(1):649–658, 2015.
- Wongsuphasawat et al. [2017] K. Wongsuphasawat, Z. Qu, D. Moritz, R. Chang, F. Ouk, A. Anand, J. Mackinlay, B. Howe, and J. Heer. Voyager 2: Augmenting visual analysis with partial view specifications. In Proceedings of the 2017 chi conference on human factors in computing systems, pages 2648–2659, 2017.
- Wu et al. [2021a] A. Wu, Y. Wang, X. Shu, D. Moritz, W. Cui, H. Zhang, D. Zhang, and H. Qu. Ai4vis: Survey on artificial intelligence approaches for data visualization. IEEE Transactions on Visualization and Computer Graphics, 2021.
- Wu et al. [2021b] A. Wu, Y. Wang, M. Zhou, X. He, H. Zhang, H. Qu, and D. Zhang. Multivision: Designing analytical dashboards with deep learning based recommendation. IEEE Transactions on Visualization and Computer Graphics, 28(1):162–172, 2021.
- Zhou et al. [2021] M. Zhou, Q. Li, X. He, Y. Li, Y. Liu, W. Ji, S. Han, Y. Chen, D. Jiang, and D. Zhang. Table2charts: Recommending charts by learning shared table representations. In Proceedings of the 27th ACM SIGKDD Conference on Knowledge Discovery & Data Mining, pages 2389–2399, 2021.
- Zhu et al. [2020] S. Zhu, G. Sun, Q. Jiang, M. Zha, and R. Liang. A survey on automatic infographics and visualization recommendations. Visual Informatics, 4(3):24–40, 2020.
- Ziarani and Ravanmehr [2021] R. J. Ziarani and R. Ravanmehr. Serendipity in recommender systems: a systematic literature review. Journal of Computer Science and Technology, 36(2):375–396, 2021.