Discovery of a spatially and kinematically resolved 55 kpc-scale superbubble inflated by an intermediate redshift non-BAL quasar
Abstract
We report on the discovery of a rare case of spatially and kinematically resolved galactic scale outflow at intermediate redshift, based on VLT/MUSE optical integral field spectroscopic observation of the quasar HE 02381904. This classical non-broad absorption line (non-BAL) quasar at remains underexplored in its optical emission lines, though its UV absorption lines are well-studied. We identify a superbubble driven by HE 02381904 from the emission line morphology, line ratio diagnostics and kinematics, showing a one-sided outflow reaching a projected distance of kpc from the nucleus. The bulk of the ionized gas, with a characteristic mass , is blueshifted by km s-1 with respect to the quasar systemic velocity. The outflows detected using absorption line and the emission line are likely stratified components of different spatial scale and velocity in the ionized phase outflow. Although feedback in HE 02381904 is taking place on kpc scale, the kinetic power of the outflow at 55 kpc () implies that it is inadequate to regulate effectively the evolution of the host galaxy at this large scale.
1 Introduction
Modern galaxy formation theory strongly suggests that there is a fundamental connection between the supermassive black holes (SMBHs) residing in galaxy centres and the formation and evolution of their host galaxies (Kormendy & Ho, 2013). Theoretical studies and simulations show that active galactic nuclei (AGN) feedback can provide an explanation for a variety of observations, from the chemical enrichment of the intergalactic medium to the self-regulation of the growth of the SMBHs and of the galactic bulge (e.g. Ferrarese & Merritt 2000; Gebhardt et al. 2000; Tremaine et al. 2002; Di Matteo et al. 2005; Hopkins & Elvis 2010). Powerful outflows driven by AGN have been invoked as one of the main conveyors, so that SMBH activity has a controlling effect on shaping the global properties of the host galaxies (Tabor & Binney, 1993; Silk & Rees, 1998; Springel et al., 2005; Croton et al., 2006; Hopkins et al., 2006; Choi et al., 2012; Veilleux et al., 2005, 2020).
In the past several years, AGN-driven outflows extending to kpc-scales have been resolved in ionized, atomic and molecular gas around both radio-loud (e.g. Nesvadba et al. 2006, 2008; Vayner et al. 2021a) and radio-quiet quasars (e.g. Nesvadba et al. 2008; Liu et al. 2013a, b) across low (e.g. Feruglio et al. 2010, 2013; Rauch et al. 2013; Cicone et al. 2012, 2014) and high redshift (e.g. Alexander et al. 2010; Nesvadba et al. 2011; Harrison et al. 2012, 2014; Carniani et al. 2015; Vayner et al. 2021b). These energetic outflows and jets emanating from the AGN may inflate galactic scale bubble-like structure along the minor axis (largely perpendicularly to the main plane of the galaxy) extending beyond tens of kpc (e.g., Leung et al., 2021), eventually expanding into the intergalactic medium. This is also referred to as a superbubble. Originally, superbubbles are powered by the combined explosions of supernova in a cluster of massive stars, with cavities of diameter greater than 100 pc and density lower than that of the surrounding interstellar medium (ISM) (Tenorio-Tagle & Bodenheimer, 1988; Rupke & Veilleux, 2013; Zaninetti, 2021). The kinetic energy of the optical line emitting gas may reach several times of ergs (Cecil et al., 2002). In the recent literature this definition extends to AGN inflated bubbles. A well-known local example is the nuclear superbubble emerging from the edge-on galaxy NGC 3079, although the central starburst appears sufficient to power the outflow, with contribution from the AGN (Irwin & Seaquist, 1988; Veilleux et al., 1994; Cecil et al., 2001). A spectacular 10 kpc bipolar superbubble dominated by AGN radiation is detected in the radio, optical and X-ray band in the “Teacup AGN” (SDSSJ 1430+1339) at redshift (Lansbury et al., 2018). So far, 10 kpc-scale optical superbubbles driven by AGN have been found around obscured quasars at low redshift (e.g. Greene et al. 2012). Such spatially resolved cases through ionized emission line gas are still scarce.
Roughly 20% of the quasars show blueshifted broad absorption lines (BALs), implying that radiatively driven high velocity outflows are ubiquitous (Proga et al., 2000; Hewett & Foltz, 2003). Previous work find that such massive, sub-relativistic outflows can be very efficient feedback agents, based on ultraviolet (UV) BAL analyses (McCarthy et al., 2010; Faucher-Giguère et al., 2012; Choi et al., 2014; Miller et al., 2020; Byun et al., 2022). A recent study using the large sample of SDSS quasars (Rankine et al., 2020) concludes that BALs and non-BALs represent different views of the same underlying quasar population, implying that the outflows in BALs and non-BALs quasars are similar. In this work, we present VLT/MUSE discovery of the powerful ionized gas outflow detected in a non-BAL quasar at .
HE 02381904 is a typical non-BAL quasar with a central black hole of 2.41010 M⊙ (Onken et al., 2004). Previous UV spectroscopy reported the detection of highly ionized collimated outflow in this source (Muzahid et al., 2012). Detailed modeling indicates that the outflow has two ionization phases, where the high-ionization phase carries the bulk of the material (Arav et al., 2013). The absorbing gas is blueshifted from the quasar, and the electron density is cm-3 measured by ratio in the absorption troughs. The corresponding mass flux and kinetic luminosity is 40 yr-1 and 1045 erg s-1, respectively, where the latter is roughly equal to 1 per cent of the bolometric luminosity (Arav et al., 2013). Hence, this outflow is capable of strong interaction with the host galaxy. Nevertheless, all these UV absorption line analysis results depend on detailed photoionization modeling, and would benefit from spatially resolved studies.
This paper is structured as follows. We first describe the observations and data reduction in Section 2. In Section 3 and Section 4, we present the analysis of the spectral data and measurements of the gas kinematics. In Section 5, we discuss the gas kinematics measured by integral field spectroscopy (IFS) and BAL analyses. We summarize our findings in Section 6. Throughout this paper, we adopt a cosmology with =70 km s-1 Mpc-1 , , . The redshift of HE 02381904 is adopted as , measured using Mg ii (Wisotzki et al., 2000) and consistent with values in recent papers (e.g., , Flesch 2015; Neeleman et al. 2016; , Muzahid et al. 2012).
2 Observations and Data Reduction
HE 02381904 was observed by VLT/MUSE between November 2016 and February 2017 under European Southern Observatory (ESO) program ID 096.A-0222(A) (PI: Schaye). The spectra were taken in the optical band (wavelength coverage 4750 - 9350 in the observer’s frame), covering 2912 to 5978 in the rest frame for our target at . The total on-source integration time is over 8 hours. The field of view (FOV) approximately covers with a spatial resolution of , and a medium spectral resolution of . The typical seeing is , and the airmass ranges between 1.0 and 1.4.
After removing cosmic rays from the raw data using the L.A. Cosmic procedure (van Dokkum, 2001), we reduce the raw data using the ESO-MUSE pipeline. The final data cubes have a spatial scale of . The estimated angular resolution is 0.8 based on the full width half maximum (FWHM) of point-spread function (PSF) map, which roughly corresponds to a physical scale of 5.5 kpc at the redshift of . We estimate the instrumental PSF using the surface brightness profiles of broad emission lines (BELs), i.e., using a 2D Gaussian to fit the BELs map.
3 IFS data analysis
3.1 Multicomponent Gaussian fitting
In order to understand the dynamics and the main properties of the ionized outflows, we perform a kinematical analysis on the forbidden lines. We remove the broad emission line from the quasar nucleus, which is represented by double Gaussians in the spatial regions where the narrow emission lines are negligible. With the quasar contribution removed, we scrutinize the spatially resolved emission lines following the method described in Zhao et al. (2021).
We perform a two-step spectral fit to delineate the gas kinematics. First, we extract the spectrum in each spaxel, subtract the continuum using interpolation method from wavelength on two sides of the [O iii] line, where the continuum is free of any line emission and artifacts. We use the Fe ii template from Tsuzuki et al. (2006) to subtract the Fe ii emission. Secondly, we assume that the [O iii] doublet is originating from the same upper level, and the intensity ratio is 3. The lines are fitted with the same central velocity and velocity dispersion. The profile of [O iii] 5007 emission line is generally complex. So [O iii] 4959,5007 doublet are fitted with a combination of multiple Gaussians by minimizing using the Python package MPFIT. We fit the [O iii] profiles to no more than three Gaussians, following Liu et al. (2014).
The [O iii] nebulae surrounding HE 02381904 is spatially resolved by our IFS observation. The [O iii] map of HE 02381904 are shown in Figure 1a, where the false color is used to represent the intensity on a logarithmic scale. The surface brightness sensitivity (rms noise) of our [O iii] maps is approximately erg s-1cm-2 arcsec-2. We use a 1.5 threshold to create this map.
3.2 Non-Parametric measurements
We obtain non-parametric measurements of the emission line profiles following the method described in Liu et al. (2013a). These include:
(i) zeroth-moment map: intensity map of the [O iii] 5007 line.
(ii) first-moment map: , median velocity map.
(iii) second-moment map: line width map, , the velocity width of the line that encloses 80 per cent of the total flux. This is defined as the difference between the velocities at 10 and 90 per cent of cumulative flux: .
(iv) asymmetry, defined as . With our definition, a profile with a significantly blueshifted wing has a negative value, while a symmetric profile has .
We perform these non-parametric measurements on the best-fitting profiles. Figure 1 shows these parameters of the ionized gas derived from the fit of the [O iii] 5007 line. The maps are obtained by selecting only pixels with a .
4 Properties of the Outflow
4.1 Gas Kinematics
The forbidden emission line [O iii] 5007,4969 doublet is adopted as a tracer of ionized outflows on large scale. Figure 1 shows the [O iii] intensity, velocity, velocity dispersion, and asymmetry map. Our IFS data confirmed that [O iii] 5007 lines is spatially and kinematically resolved. In the following, we discuss the velocity, velocity dispersion and asymmetry of the ionized gas and compare them with previous works (e.g. Arav et al. 2013; Liu et al. 2013a; Carniani et al. 2015).
The velocity field of the [O iii] nebulae is remarkably well organized (Figure 1b). Only the blue-side outflows is detected, whereas the red side is probably obscured by the host galaxy along the line of sight. For this reason, the [O iii] line profile is asymmetric, with a prominent blueshifted wing (Figure 1d and Figure 2).
We find the maximum value 1600 km s-1 in the center, which is comparable to that of known quasar outflows (e.g. Liu et al. 2013a; Carniani et al. 2015; Zakamska et al. 2016; Kubo et al. 2022), but considerably larger than usual narrow lines in quasar (Lonsdale et al., 1993). The value lowers to 200 km s-1 in the outer region. The asymmetry map shows regions with heavy blueshifted wings ( 0) that are spatially associated with high-velocity dispersion ( 1600 km s-1, see Figure 1c).
In Figure 1(d), we show the map of asymmetry parameter . The asymmetry parameter is uniformly negative in the bright central part of HE 02381904, indicating heavily blueshifted wings in the line profiles. This is the tell-tale signature of an outflow which may be proceeding in a symmetric fashion but whose redshifted part is obscured by the material in the host galaxy or near the nucleus (Whittle, 1985). In the fainter outer region where the peak S/N of even the brightest emission line [O iii] is just a few, typically one Gaussian component is sufficient to fit the line profile. Therefore the asymmetry parameter tends to be at zero values ().
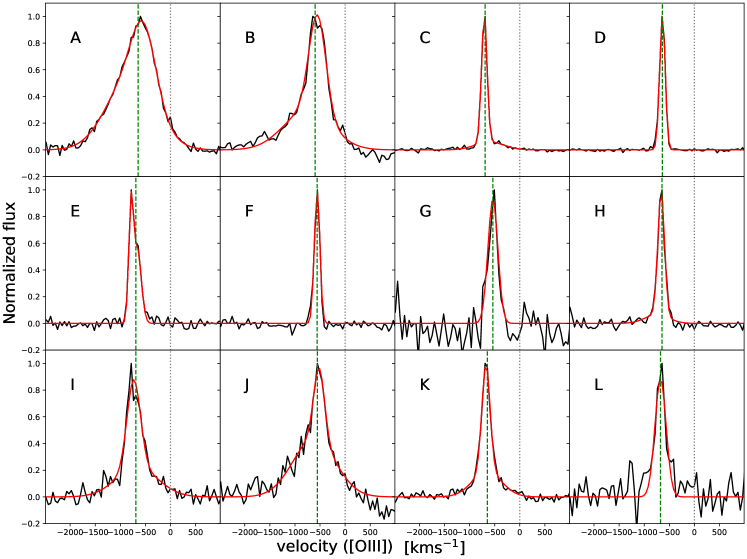
Motivated by the different kinematic components apparent in the velocity map, we extract and fit the [O iii] lines in 12 regions. Figure 1b and Figure 2 show the position and spectra of these extraction regions, referred to as A-L. Region A and B correspond to the position of the quasar itself and its immediate vicinity, while C-L correspond to the outer regions. The spectral fits reveal that the width of line profile in center is broader than that of the outer regions. The most significant asymmetry in the line profile is present in the center. Consequently, the smooth morphology of [O iii] nebulae, the velocity, the high velocity dispersions of the gas and the blue-shifted asymmetry map all suggest that we have detected ionized outflowing gas in HE 02381904.
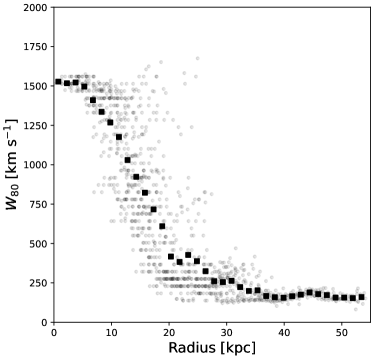
In Figure 3, we show values of in all spaxels as a function of projected distance from the centre. The radial profiles of are almost flat at projected distances kpc and appear to decrease at larger radii. This is different from previous results found in other quasars based on long-slit and IFS observations, which reported flat profiles (Greene et al., 2011; Liu et al., 2013a). One of the concern with the measured decline in is that the broad component can no longer be identified in the outer parts, and the measurement is due to the narrow component, hence the declining . In this case, parameter would be almost constant across the nebulae in most cases, perhaps declining slightly towards the outer parts. This is not consistent with our profile. The possible origin of the rapid decline in is discussed in Section 5.1.
4.2 The spatially resolved blobs
The ionized gas extends to the southeast of the nucleus (see Figure 1), where three blobs (region II-IV, Figure 1a) and a nuclear region (region I) are present. Both the velocity, velocity dispersion of region II-IV are similar ( km s-1, km s-1).
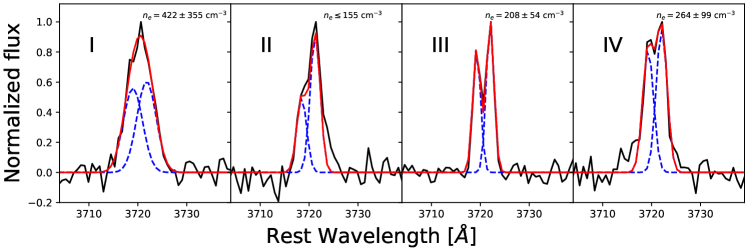
The electron density can be derived from [O ii] ratios. For this purpose, we stack the spectra taken from the regions I-IV, and fit the [O ii] doublet emission lines by fixing the kinematics of the two line (Figure 4). Assuming an electron temperature of 10000 K, we estimate the electron density to be cm-3 in region I, III, and IV, respectively. The electron density in region II is 155 cm-3, which is the upper limit at three sigma significance. This result is close to that of other quasar outflows (a few 100 cm-3; Nesvadba et al. 2006, 2008). Note that, [O ii] doublet are blended together in the center and difficult to fit, so we stack and fit the spectra from the relatively outer region around the nucleus (region I). Hence, the actual electron density can be higher in the nuclear region.
5 Discussion
5.1 Origin of the ionized gas
There are two possibilities for the origin of these ionized gas. The gas can be either a nuclear outflow launched by AGN, or a tidal tail due to galaxy interaction. First, the extended ionized gas is ubiquitous in quasars and generally driven by radiation pressure, so the ionized gas in HE 02381904 could well be the same. On the other hand, one could suspect that this spatially extended feature with low velocity dispersion (region II-IV) is in fact a tidal tail resulted from interaction with a lower-mass companion. We analyse all the spectra of companion galaxies around HE 02381904 in the field of view, and the difference between galaxy systemic velocity and these extended emission line gas velocity is found to be at least several hundred km s-1. This excludes the possibility of ionized gas being tidal tail, because the velocity difference between companion galaxies and tidal tails is generally 100 km s-1 (e.g. Fu et al. 2021).
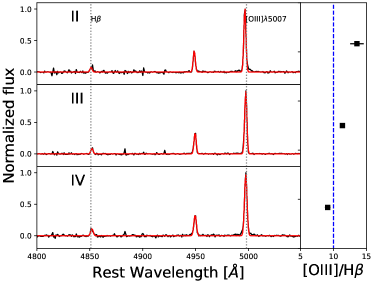
In addition, the intensity ratios of the emission lines facilitate our analysis on the physical conditions of the ionized gas. Specifically, we use the [O iii]/H ratios to quantify the degree of ionization. To obtain higher S/N ratios, we stack the spectra from the regions II-IV shown in Figure 1(a). The H and [O iii] spectra and the [O iii]/H ratios in the extended regions (II-IV) are shown in Figure 5. In this object, H almost follows the same spatial distribution as that of [O iii] because [O iii]/H is almost a constant. The ratio reveals that [O iii]/H is close to 10 in these three regions, implying a high-ionization state in general. Based on the BPT diagram (Baldwin et al., 1981), [O iii]/H 10 implies AGN dominance. The [O iii]/H profile indicates that the AGN plays a dominant role in the ionization of the large scale gas.
In Figure 3, we find that the parameter is almost flat at projected distances kpc and appear to decrease rapidly at larger radii. Here we discuss the possible origins of the rapid decline of with increasing distance from the centre. This decline of implying an apparent narrowing of the line profile is likely due to the fact that the outflow becomes more directional or more collimated within these structures. We thus confirm the previous results based on UV analyses which indicated collimated outflow (Muzahid et al., 2012).
There are various mechanisms capable of establishing an apparently declining profile. First, in the central region the wind expands in all directions from the quasar, whereas at larger distances the opening angle of the outflow is decreased, perhaps because there are low-density regions along which the wind prefers to propagate. Also the outflow in the central region may be experiencing large turbulent motions due to interaction with ISM, but once they escape out of the inner galaxies the flow becomes more organized and mostly radial. The episodic quasar outbursts may drive a shock wave through the ISM of the galaxy and clear out some of it (Novak et al., 2011). In any subsequent episodes, the wind suffer less resistance from the ISM and would break out in these directions, producing the large scale bubbles (Faucher-Giguère et al., 2012). Numerical simulations show that this phenomenon is expected for jet-driven winds (Sutherland & Bicknell, 2007). We detected three spatially resolved blobs, which are likely part of the rim of the superbubble. In addition, the outflowing gas is launched and accelerated somewhere close to the quasar, and proceeds ballistically. Thus they eventually slow down as they overcome the potential well of the host galaxy, producing a decline in .
The ionized outflow traced by [O iii] emission extends to 50 kpc and beyond, and the remains larger than 500 km s-1 up to 20 kpc (Figure 3). Combined with the large-scale morphology and the profile, the extended gas we detected closely resembles a superbubble. Future high-quality soft X-ray observations are needed to fully investigate the origin of these ionized gas.
5.2 Energetics of the Outflow
We find that the ionized gas in southwest of the nucleus extends to a projected distance reaching 55 kpc (Figure 1). Some characteristic parameters of the ionized gas are further estimated. Adopting blueshifted velocity of km s-1, and the distance to the galaxy nucleus kpc. We estimate a dynamical timescale to be yr, i.e. the time required for the gas from the nuclear region to reach such a distance with an average velocity of . The mass of gas can typically be estimated using H luminosity and electron density (e.g Liu et al. 2013a; Harrison et al. 2014). The total mass of these ionized extended gas can be derived as:
| (1) |
We take the electron density of 400 cm-3 in region I, because bulk of the ionized gas is concentrated in central region. We find erg s-1, and . Combining with the average velocity of 690 km s-1, the total kinetic energy of the gas can be estimated as:
| (2) |
We can also estimate that the mass outflow rate is 2.7 M⊙ yr-1, and a kinetic energy rate 4.1 erg s-1. The momentum flux of the outflow () of 1.2 dynes, or . The ratio of the momentum flux of the outflow to the AGN radiation is only 0.002.
Theoretical modeling predicts that significant feedback requires the kinetic power of the outflow reaches 0.5%-5% of the AGN’s bolometric luminosity (e.g., Hopkins & Elvis, 2010). The kinetic luminosity of the outflow detected at 55 kpc is insignificant, only 0.0002% of its bolometric luminosity ( erg s-1, Arav et al. 2013). This is much lower than the previously estimated 1% from absorption on 3 kpc scale (Arav et al., 2013), or the estimated for a sample of quasars (Carniani et al., 2015). Carniani et al. (2015) fit a a log-linear relation between and for the ionized outflows detected on kpc scale in their quasar sample. Adopting their Equation 10, the expected yr-1 for HE 02381904 agrees fairly well with the derived yr-1 in Arav et al. (2013). In contrast, our estimated mass outflow rate at large scale (55 kpc) in HE 02381904 is an order of magnitude lower. The kinetic power of the outflow () implies it is no longer an important contributor to feedback at this scale.
5.3 Comparison with previous UV analysis
Using the HST/COS and FUSE UV spectra of HE 02381904, Muzahid et al. (2012) reported detection of outflowing gas in multiple absorption lines O vi, Ne viii, and Mg X. They identified evidence for similar covering factor in several absorption components that kinematically spread over 1800 km s-1, suggesting a collimated outflow. This is consistent with our expectation from radial variation of .
Determining the location of the absorption outflow is usually challenging. Nevertheless, assuming a spherical geometry, Muzahid et al. (2012) constrained the radial distance of the absorbing gas to be pc based on the photoionization modeling result. The detailed UV absorption line analysis by Arav et al. (2013) was able to derive robustly a distance of 3 kpc from the outflow to the nucleus using absorption troughs of O iv, and O iv*. As revealed by the MUSE data, the projected distance of the outflow from the AGN is kpc for the blueshifted side. This is significantly further from the previous locations of the absorbing gas. In addition, both electron density and the kinematics of these outflows determined from IFS spectroscopy of emission lines are different with those derived from previous UV absorption line analyses (e.g., Arav et al., 2013). The velocity of the absorption line (5000 km s-1) is much higher than the velocity of the emission line (700 km s-1). This strongly indicates that the outflows detected using absorption line and the emission line are clearly not the same component, but likely stratified components of different spatial scale and velocity in the ionized phase outflow.
6 summary
In this paper, we present VLT/MUSE IFS observations of a non-BAL quasar HE 02381904 at redshift . [O iii] emssion lines, are characterised by large line width and prominent blue wings in center, indicative of fast outflows accelerated by the powerful AGN. We summarise our results below:
(1) For the first time, we identify a spatially and kinematically resolved superbubble driven by AGN at intermediate redshift. From the emission line map, ionizing structure and kinematics, we identify a spatially resolved superbubble surrounding HE 02381904, showing a one-sided structure reaching a projected distance of kpc from the nucleus. We calculate an electron density of a few 100 cm-3 for three blobs and the central region. The electron density in center is higher than that in outer regions. The velocity of ionized gas is blueshifted 700 km s-1, with a rapidly decline in the radial profile of .
(2) We estimate for the ionized gas mass. The dynamical timescale of the blobs is estimated to be Myr, the travel time of the clouds from the centre to reach the observed distance. The resulting mass outflow rate is 2.7 M⊙ yr-1. The kinetic energy carried by the ionized gas is erg, with an estimated kinetic energy rate 4.1 erg s-1. Feedback in HE 02381904 is taking place on kpc scale as previously reported, but the outflow on the 55 kpc scale is inadequate to regulate effectively the evolution of its host galaxy (the kinetic luminosity is only 0.0002% of the bolometric luminosity).
(3) The inferred mass flow rate and kinetic luminosity of the outflow are different from that of previously identified absorption system. The outflows detected in absorption and emission lines are most likely stratified components at different spatial scales and velocities.
References
- Alexander et al. (2010) Alexander, D. M., Swinbank, A. M., Smail, I., McDermid, R., & Nesvadba, N. P. H. 2010, MNRAS, 402, 2211, doi: 10.1111/j.1365-2966.2009.16046.x
- Arav et al. (2013) Arav, N., Borguet, B., Chamberlain, C., Edmonds, D., & Danforth, C. 2013, MNRAS, 436, 3286, doi: 10.1093/mnras/stt1812
- Baldwin et al. (1981) Baldwin, J. A., Phillips, M. M., & Terlevich, R. 1981, PASP, 93, 5, doi: 10.1086/130766
- Byun et al. (2022) Byun, D., Arav, N., & Hall, P. B. 2022, MNRAS, 517, 1048, doi: 10.1093/mnras/stac2638
- Carniani et al. (2015) Carniani, S., Marconi, A., Maiolino, R., et al. 2015, A&A, 580, A102, doi: 10.1051/0004-6361/201526557
- Cecil et al. (2002) Cecil, G., Bland-Hawthorn, J., & Veilleux, S. 2002, ApJ, 576, 745, doi: 10.1086/341861
- Cecil et al. (2001) Cecil, G., Bland-Hawthorn, J., Veilleux, S., & Filippenko, A. V. 2001, ApJ, 555, 338, doi: 10.1086/321481
- Choi et al. (2014) Choi, E., Naab, T., Ostriker, J. P., Johansson, P. H., & Moster, B. P. 2014, MNRAS, 442, 440, doi: 10.1093/mnras/stu874
- Choi et al. (2012) Choi, E., Ostriker, J. P., Naab, T., & Johansson, P. H. 2012, ApJ, 754, 125, doi: 10.1088/0004-637X/754/2/125
- Cicone et al. (2012) Cicone, C., Feruglio, C., Maiolino, R., et al. 2012, A&A, 543, A99, doi: 10.1051/0004-6361/201218793
- Cicone et al. (2014) Cicone, C., Maiolino, R., Sturm, E., et al. 2014, A&A, 562, A21, doi: 10.1051/0004-6361/201322464
- Croton et al. (2006) Croton, D. J., Springel, V., White, S. D. M., et al. 2006, MNRAS, 365, 11, doi: 10.1111/j.1365-2966.2005.09675.x
- Di Matteo et al. (2005) Di Matteo, T., Springel, V., & Hernquist, L. 2005, Nature, 433, 604, doi: 10.1038/nature03335
- Faucher-Giguère et al. (2012) Faucher-Giguère, C.-A., Quataert, E., & Murray, N. 2012, MNRAS, 420, 1347, doi: 10.1111/j.1365-2966.2011.20120.x
- Ferrarese & Merritt (2000) Ferrarese, L., & Merritt, D. 2000, ApJ, 539, L9, doi: 10.1086/312838
- Feruglio et al. (2010) Feruglio, C., Maiolino, R., Piconcelli, E., et al. 2010, A&A, 518, L155, doi: 10.1051/0004-6361/201015164
- Feruglio et al. (2013) Feruglio, C., Fiore, F., Maiolino, R., et al. 2013, A&A, 549, A51, doi: 10.1051/0004-6361/201219746
- Flesch (2015) Flesch, E. W. 2015, PASA, 32, e010, doi: 10.1017/pasa.2015.10
- Fu et al. (2021) Fu, Z.-X., Sengupta, C., Sethuram, R., et al. 2021, Research in Astronomy and Astrophysics, 21, 043, doi: 10.1088/1674-4527/21/2/43
- Gebhardt et al. (2000) Gebhardt, K., Bender, R., Bower, G., et al. 2000, ApJ, 539, L13, doi: 10.1086/312840
- Greene et al. (2011) Greene, J. E., Zakamska, N. L., Ho, L. C., & Barth, A. J. 2011, ApJ, 732, 9, doi: 10.1088/0004-637X/732/1/9
- Greene et al. (2012) Greene, J. E., Zakamska, N. L., & Smith, P. S. 2012, ApJ, 746, 86, doi: 10.1088/0004-637X/746/1/86
- Harrison et al. (2014) Harrison, C. M., Alexander, D. M., Mullaney, J. R., & Swinbank, A. M. 2014, MNRAS, 441, 3306, doi: 10.1093/mnras/stu515
- Harrison et al. (2012) Harrison, C. M., Alexander, D. M., Swinbank, A. M., et al. 2012, MNRAS, 426, 1073, doi: 10.1111/j.1365-2966.2012.21723.x
- Hewett & Foltz (2003) Hewett, P. C., & Foltz, C. B. 2003, AJ, 125, 1784, doi: 10.1086/368392
- Hopkins & Elvis (2010) Hopkins, P. F., & Elvis, M. 2010, MNRAS, 401, 7, doi: 10.1111/j.1365-2966.2009.15643.x
- Hopkins et al. (2006) Hopkins, P. F., Hernquist, L., Cox, T. J., et al. 2006, ApJS, 163, 1, doi: 10.1086/499298
- Irwin & Seaquist (1988) Irwin, J. A., & Seaquist, E. R. 1988, ApJ, 335, 658, doi: 10.1086/166956
- Kormendy & Ho (2013) Kormendy, J., & Ho, L. C. 2013, ARA&A, 51, 511, doi: 10.1146/annurev-astro-082708-101811
- Kubo et al. (2022) Kubo, M., Umehata, H., Matsuda, Y., et al. 2022, ApJ, 935, 89, doi: 10.3847/1538-4357/ac7f2d
- Lansbury et al. (2018) Lansbury, G. B., Jarvis, M. E., Harrison, C. M., et al. 2018, ApJ, 856, L1, doi: 10.3847/2041-8213/aab357
- Leung et al. (2021) Leung, G. C. K., Coil, A. L., Rupke, D. S. N., & Perrotta, S. 2021, ApJ, 914, 17, doi: 10.3847/1538-4357/abf4da
- Liu et al. (2014) Liu, G., Zakamska, N. L., & Greene, J. E. 2014, MNRAS, 442, 1303, doi: 10.1093/mnras/stu974
- Liu et al. (2013a) Liu, G., Zakamska, N. L., Greene, J. E., Nesvadba, N. P. H., & Liu, X. 2013a, MNRAS, 436, 2576, doi: 10.1093/mnras/stt1755
- Liu et al. (2013b) —. 2013b, MNRAS, 430, 2327, doi: 10.1093/mnras/stt051
- Lonsdale et al. (1993) Lonsdale, C. J., Barthel, P. D., & Miley, G. K. 1993, ApJS, 87, 63, doi: 10.1086/191799
- McCarthy et al. (2010) McCarthy, I. G., Schaye, J., Ponman, T. J., et al. 2010, MNRAS, 406, 822, doi: 10.1111/j.1365-2966.2010.16750.x
- Miller et al. (2020) Miller, T. R., Arav, N., Xu, X., & Kriss, G. A. 2020, MNRAS, 499, 1522, doi: 10.1093/mnras/staa2981
- Muzahid et al. (2012) Muzahid, S., Srianand, R., Savage, B. D., et al. 2012, MNRAS, 424, L59, doi: 10.1111/j.1745-3933.2012.01288.x
- Neeleman et al. (2016) Neeleman, M., Prochaska, J. X., Ribaudo, J., et al. 2016, ApJ, 818, 113, doi: 10.3847/0004-637X/818/2/113
- Nesvadba et al. (2008) Nesvadba, N. P. H., Lehnert, M. D., De Breuck, C., Gilbert, A. M., & van Breugel, W. 2008, A&A, 491, 407, doi: 10.1051/0004-6361:200810346
- Nesvadba et al. (2006) Nesvadba, N. P. H., Lehnert, M. D., Eisenhauer, F., et al. 2006, ApJ, 650, 693, doi: 10.1086/507266
- Nesvadba et al. (2011) Nesvadba, N. P. H., Polletta, M., Lehnert, M. D., et al. 2011, MNRAS, 415, 2359, doi: 10.1111/j.1365-2966.2011.18862.x
- Novak et al. (2011) Novak, G. S., Ostriker, J. P., & Ciotti, L. 2011, ApJ, 737, 26, doi: 10.1088/0004-637X/737/1/26
- Onken et al. (2004) Onken, C. A., Ferrarese, L., Merritt, D., et al. 2004, ApJ, 615, 645, doi: 10.1086/424655
- Proga et al. (2000) Proga, D., Stone, J. M., & Kallman, T. R. 2000, ApJ, 543, 686, doi: 10.1086/317154
- Rankine et al. (2020) Rankine, A. L., Hewett, P. C., Banerji, M., & Richards, G. T. 2020, MNRAS, 492, 4553, doi: 10.1093/mnras/staa130
- Rauch et al. (2013) Rauch, M., Becker, G. D., Haehnelt, M. G., Carswell, R. F., & Gauthier, J.-R. 2013, MNRAS, 431, L68, doi: 10.1093/mnrasl/slt010
- Rupke & Veilleux (2013) Rupke, D. S. N., & Veilleux, S. 2013, ApJ, 768, 75, doi: 10.1088/0004-637X/768/1/75
- Silk & Rees (1998) Silk, J., & Rees, M. J. 1998, A&A, 331, L1. https://arxiv.org/abs/astro-ph/9801013
- Springel et al. (2005) Springel, V., Di Matteo, T., & Hernquist, L. 2005, MNRAS, 361, 776, doi: 10.1111/j.1365-2966.2005.09238.x
- Sutherland & Bicknell (2007) Sutherland, R. S., & Bicknell, G. V. 2007, ApJS, 173, 37, doi: 10.1086/520640
- Tabor & Binney (1993) Tabor, G., & Binney, J. 1993, MNRAS, 263, 323, doi: 10.1093/mnras/263.2.323
- Tenorio-Tagle & Bodenheimer (1988) Tenorio-Tagle, G., & Bodenheimer, P. 1988, ARA&A, 26, 145, doi: 10.1146/annurev.aa.26.090188.001045
- Tremaine et al. (2002) Tremaine, S., Gebhardt, K., Bender, R., et al. 2002, ApJ, 574, 740, doi: 10.1086/341002
- Tsuzuki et al. (2006) Tsuzuki, Y., Kawara, K., Yoshii, Y., et al. 2006, ApJ, 650, 57, doi: 10.1086/506376
- van Dokkum (2001) van Dokkum, P. G. 2001, PASP, 113, 1420, doi: 10.1086/323894
- Vayner et al. (2021a) Vayner, A., Wright, S. A., Murray, N., et al. 2021a, ApJ, 919, 122, doi: 10.3847/1538-4357/ac0f56
- Vayner et al. (2021b) Vayner, A., Zakamska, N. L., Riffel, R. A., et al. 2021b, MNRAS, 504, 4445, doi: 10.1093/mnras/stab1176
- Veilleux et al. (2005) Veilleux, S., Cecil, G., & Bland-Hawthorn, J. 2005, ARA&A, 43, 769, doi: 10.1146/annurev.astro.43.072103.150610
- Veilleux et al. (1994) Veilleux, S., Cecil, G., Bland-Hawthorn, J., et al. 1994, ApJ, 433, 48, doi: 10.1086/174624
- Veilleux et al. (2020) Veilleux, S., Maiolino, R., Bolatto, A. D., & Aalto, S. 2020, A&A Rev., 28, 2, doi: 10.1007/s00159-019-0121-9
- Whittle (1985) Whittle, M. 1985, MNRAS, 216, 817, doi: 10.1093/mnras/216.4.817
- Wisotzki et al. (2000) Wisotzki, L., Christlieb, N., Bade, N., et al. 2000, A&A, 358, 77. https://arxiv.org/abs/astro-ph/0004162
- Zakamska et al. (2016) Zakamska, N. L., Hamann, F., Pâris, I., et al. 2016, MNRAS, 459, 3144, doi: 10.1093/mnras/stw718
- Zaninetti (2021) Zaninetti, L. 2021, International Journal of Astronomy and Astrophysics, 11, 370, doi: 10.4236/ijaa.2021.113017
- Zhao et al. (2021) Zhao, Q., Sun, L., Shen, L., et al. 2021, ApJ, 913, 111, doi: 10.3847/1538-4357/abf4de