Exploring QSAR Models for Activity-Cliff Prediction
Abstract
\parttitleIntroduction and Methodology Pairs of similar compounds that only differ by a small structural modification but exhibit a large difference in their binding affinity for a given target are known as activity cliffs (ACs). It has been hypothesised that QSAR models struggle to predict ACs and that ACs thus form a major source of prediction error. However, a study to explore the AC-prediction power of modern QSAR methods and its relationship to general QSAR-prediction performance is lacking. We systematically construct nine distinct QSAR models by combining three molecular representation methods (extended-connectivity fingerprints, physicochemical-descriptor vectors and graph isomorphism networks) with three regression techniques (random forests, k-nearest neighbours and multilayer perceptrons); we then use each resulting model to classify pairs of similar compounds as ACs or non-ACs and to predict the activities of individual molecules in three case studies: dopamine receptor D2, factor Xa, and SARS-CoV-2 main protease.
\parttitleResults and Conclusions We observe low AC-sensitivity amongst the tested models when the activities of both compounds are unknown, but a substantial increase in AC-sensitivity when the actual activity of one of the compounds is given. Graph isomorphism features are found to be competitive with or superior to classical molecular representations for AC-classification and can thus be employed as baseline AC-prediction models or simple compound-optimisation tools. For general QSAR-prediction, however, extended-connectivity fingerprints still consistently deliver the best performance. Our results provide strong support for the hypothesis that indeed QSAR methods frequently fail to predict ACs. We propose twin-network training for deep learning models as a potential future pathway to increase AC-sensitivity and thus overall QSAR performance.
keywords:
Research
![[Uncaptioned image]](/html/2301.13644/assets/x1.png)
Introduction
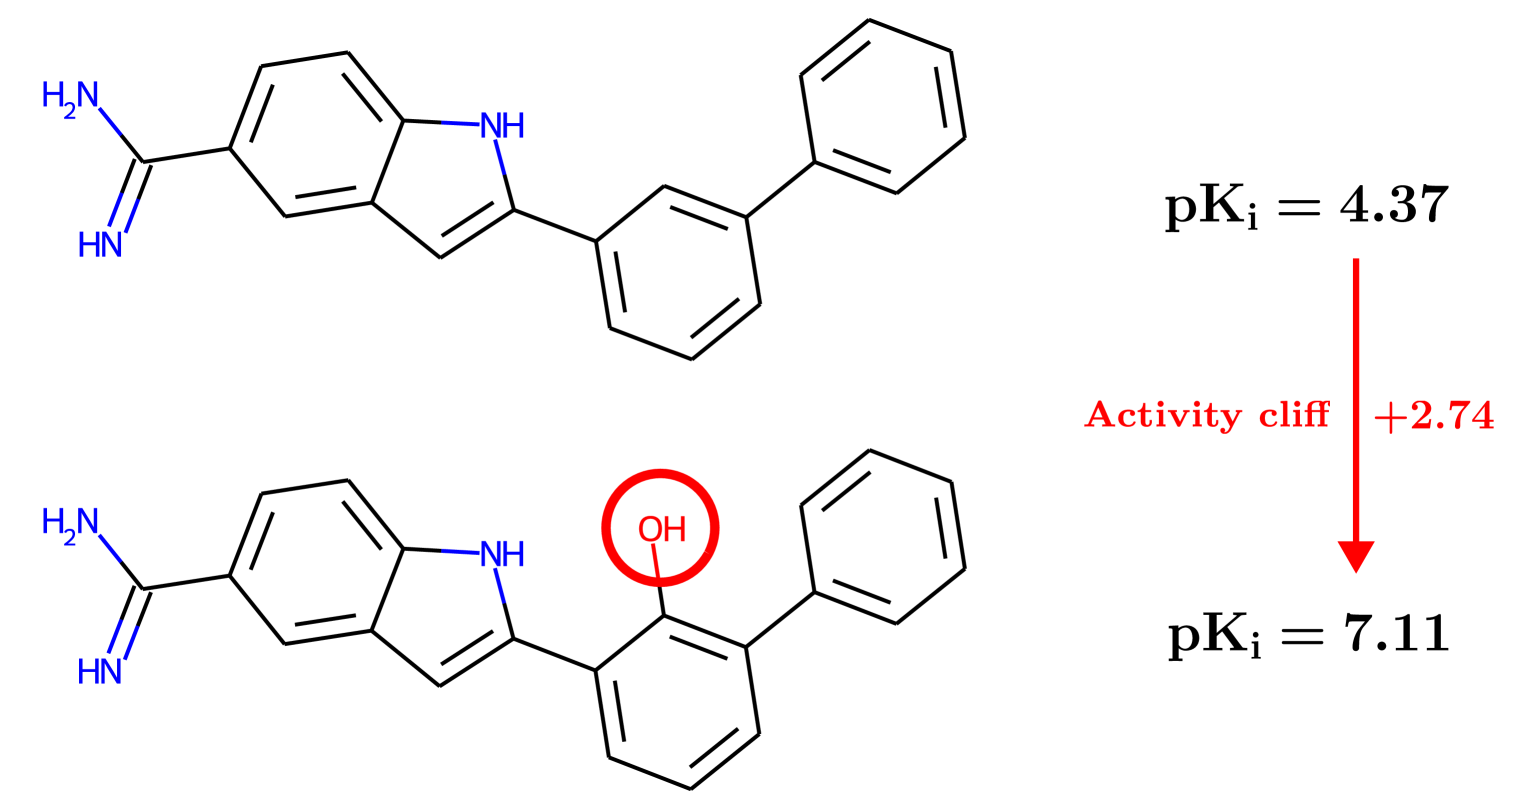
Activity cliffs (ACs) are pairs of small molecules that exhibit high structural similarity but at the same time show an unexpectedly large difference in their binding affinity against a given pharmacological target [64, 47, 63, 14, 67, 68, 69]. The existence of ACs directly defies the intuitive idea that chemical compounds with similar structures should have similar activities, often referred to as the molecular similarity principle. An example of an AC between two inhibitors of blood coagulation factor Xa [43] is depicted in Figure 1; a small chemical modification involving the addition of a hydroxyl group leads to an increase in inhibition of almost three orders of magnitude.
For medicinal chemists, ACs can be puzzling and confound their understanding of structure-activity relationships (SARs) [67, 77, 19]. ACs reveal small compound-modifications with large biological impact and thus represent rich sources of pharmacological information. Mechanisms by which a small structural transformation can give rise to an AC include a drastic change in 3D-conformation and/or the switching to a different binding mode or even binding site. ACs form discontinuities in the SAR-landscape and can therefore have a crucial impact on the success of lead-optimisation programmes. While knowledge about ACs can be powerful when trying to escape from flat regions of the SAR-landscape, their presence can be detrimental in later stages of the drug development process, when multiple molecular properties beyond mere activity need to be balanced carefully to arrive at a safe and effective compound [14, 67].
In the field of computational chemistry, ACs are suspected to form one of the major roadblocks for successful quantitative structure-activity relationship (QSAR) modelling [26, 14, 47, 63]; abrupt changes in potency are expected to negatively influence machine learning algorithms for pharmacological activity prediction. During the development of QSAR models, ACs are sometimes dismissed as measurement errors [49], but simply removing ACs from a training data set can result in a loss of precious SAR-information [15].
Golbraikh et al. [26] developed the MODI metric to quantify the smoothness of the SAR-landscape of binary molecular classification data sets and showed that the SAR-landscape smoothness is a strong determinant for downstream QSAR-modelling performance. In a related work, Sheridan et al. [63] found that the density of ACs in a molecular data set is strongly predictive of its overall modelability by classical descriptor- and fingerprint-based QSAR methods. Furthermore, they found that such methods incur a significant drop in performance when the test set is restricted to “cliffy” compounds that form a large number of ACs. In a more extensive study, van Tilborg et al. [75] observed a similar drop in performance when testing classical and graph-based QSAR techniques on compounds involved in ACs. Notably, in both studies this performance drop was also observed for highly nonlinear and adaptive deep learning models. In fact, van Tilborg reports that descriptor-based QSAR methods even outperform more complex deep learning models on “cliffy” compounds associated with ACs. This runs counter to earlier hopes expressed in the literature that the approximation power of deep neural networks might ameliorate the problem of ACs [79].
While these works provide valuable insights into the detrimental effects of SAR discontinuity on QSAR models, they consider ACs mainly indirectly by focussing on individual compounds involved in ACs. Arguably, a distinct and more natural approach would be to investigate ACs directly at the level of compound pairs. This approach has been followed in the AC-prediction field which is concerned with developing techniques to classify whether a pair of similar compounds forms an AC or not. An effective AC-prediction method would be of high value for drug development with important applications in rational compound optimisation and automatic SAR-knowledge acquisition.
The AC-prediction literature is still very thin compared to the QSAR-prediction literature. An attempt to conduct an exhaustive literature review on AC-prediction techniques revealed a total number of methods [27, 71, 44, 7, 51, 52, 32, 29, 57, 4, 39, 34, 54, 10], all of which have been published since 2012. Current AC-prediction methods are often based on creative ways to extract features from pairs of molecular compounds in a manner suitable for standard machine learning pipelines. For example, Horvath et al. [29] used condensed graphs of reactions [28, 35], a representation technique originally introduced for modelling of chemical reactions, to encode pairs of similar compounds and subsequently predict ACs. Another method was recently described by Iqbal et al. [34] who investigated the abilities of convolutional neural networks operating on 2D images of compound pairs to distinguish between ACs and non-ACs. Interestingly, none of the AC-prediction methods we identified employ feature extraction techniques built on modern graph neural networks (GNNs) [20, 40, 25, 76, 81] with the exception of Park et al. [54] who recently applied graph convolutional methods to compound-pairs to predict ACs.
In spite of the existence of advanced AC-prediction models there are significant gaps left in the current AC-prediction literature. Note that any QSAR model can immediately be repurposed as an AC-prediction model by using it to individually predict the activities of two structurally similar compounds and then thresholding the predicted absolute activity difference. Nevertheless, at the moment there is no study that uses this straightforward technique to investigate the potential of current QSAR models to classify whether a pair of compounds forms an AC or not. Importantly, this also entails that the most salient AC-prediction models [27, 44, 29, 71, 34] have not been compared to a simple QSAR-modelling baseline applied to compound pairs. It is thus an open question to what extent (if at all) these tailored AC-prediction techniques outcompete repurposed QSAR methods in the detection of ACs. This is especially relevant in light of the fact that several published AC-predict¸ion models [27, 44, 34] are evaluated via compound-pair-based data splits which incur a significant overlap between training set and test set at the level of individual molecules; this type of data split should strongly favour standard QSAR models for AC-prediction, yet a comparison to such baseline methods is lacking.
We address these gaps by systematically investigating the abilities of nine frequently used QSAR models to classify pairs of similar compounds as ACs or non-ACs within three pharmacological data sets: dopamine receptor D2, factor Xa, and SARS-CoV-2 main protease. Each QSAR model is constructed by combining a molecular representation method (physicochemical-descriptor vectors (PDVs) [72], extended-connectivity fingerprints (ECFPs) [59], or graph isomorphism networks (GINs) [81]) with a regression technique (random forests (RFs), k-nearest neighbours (kNNs), or multilayer perceptrons (MLPs)). All models are used for two distinct prediction tasks: QSAR-prediction at the level of individual molecules, and AC-classification at the level of compound-pairs. The main contribution of this study is to shed light on the following questions:
-
•
What is the relationship between the ability of a QSAR model to predict the activities of individual compounds, versus its ability to classify whether pairs of similar compounds form ACs?
-
•
When (if at all) are common QSAR models capable of predicting ACs?
-
•
When (if at all) are common QSAR models capable of predicting which of two similar compounds is the more active one?
-
•
Which QSAR model shows the strongest AC-prediction performance, and should thus be used as a baseline against which to compare tailored AC-prediction models?
-
•
Do differentiable GINs outperform classical non-trainable ECFPs and PDVs as molecular representations for QSAR- and/or AC-prediction?
-
•
How could ACs potentially be used to improve QSAR-modelling performance?
Experimental Methodology
Molecular Data Sets
We built three binding affinity data sets of small-molecule inhibitors of dopamine receptor D2, factor Xa, and SARS-CoV-2 main protease. Factor Xa is an enzyme in the coagulation cascade and a canonical target for blood-thinning drugs [43]. Dopamine receptor D2 is the main site of action for classic antipsychotic drugs which act as antagonists of the D2 receptor [62]. SARS-CoV-2 main protease is one of the key enzymes in the viral replication cycle of the SARS coronavirus 2, that recently caused the unprecedented COVID-19 pandemic; it is one of the most promising targets for antiviral drugs against this coronavirus [74].
For dopamine receptor D2 and factor Xa, data was extracted from the ChEMBL database [45] in the form of SMILES strings with associated Ki [nM] values. For SARS-CoV-2 main protease, data was obtained from the COVID moonshot project [1] in the form of SMILES strings with associated IC50 [µM] values. SMILES strings were standardised and desalted via the ChEMBL structure pipeline [8]. This step also removed solvents and all isotopic information. Following this, SMILES strings that produced error messages when turned into an RDKit mol object were deleted. Finally, a scan for duplicate molecules was performed: If the activities in a set of duplicate molecules were within the same order of magnitude then the set was unified via geometric averaging. Otherwise, the measurements were considered unreliable and the corresponding set of duplicate molecules was removed. This procedure reduced the data set for dopamine receptor D2 / factor Xa / SARS-CoV-2 main protease from / / compounds to / / unique compounds whereby / / sets of duplicate SMILES were removed and the rest was unified.
Activity Cliffs: Definition of Binary Classification Tasks
The exact definition of an AC hinges on two concepts: structural similarity and large activity difference. An elegant technique to measure structural similarity in the context of AC analysis is given by the matched molecular pair (MMP) formalism [38, 31]. An MMP is a pair of compounds that share a common structural core but differ by a small chemical transformation at a specific site. Figure 1 depicts an example of an MMP whose variable parts are formed by a hydrogen atom and a hydroxyl group. To detect MMPs algorithmically, we used the mmpdb Python-package provided by Dalke et al. [17]. We restricted ourselves to MMPs with the following commonly used [27, 29, 71] size constraints: the MMP core was required to contain at least twice as many heavy atoms as either of the two variable parts; each variable part was required to contain no more than heavy atoms; the maximal size difference between both variable parts was set to eight heavy atoms; and bond cutting was restricted to single exocyclic bonds. To guarantee a well-defined mapping from each MMP to a unique structural core, we canonically chose the core that contained the largest number of heavy atoms whenever there was ambiguity.
| Data Set | Dopamine Receptor D2 | Factor Xa |
SARS-CoV-2
Main Protease |
| \hlineB4 Compounds | |||
| MMPs | |||
| ACs | |||
| Half-ACs | |||
| Non-ACs | |||
| ACs : Non-ACs |
Based on the ratio of the activity values of both MMP compounds, each MMP was assigned to one of three classes: “AC”, “non-AC” or “half-AC”. In accordance with the literature [27, 52, 29, 77, 5] we assigned an MMP to the “AC”-class if both activity values differed by at least a factor of . If both activity values differed by no more than a factor of , then the MMP was assigned to the “non-AC”-class. In the residual case the MMP was assigned to the “half-AC”-class. To arrive at a well-separated binary classification task, we labelled all ACs as positives and all non-ACs as negatives. The half-ACs were removed and not considered further in our experiments. It is relevant to know the direction of a potential activity cliff, i.e. which of the compounds in the pair is the more active one. We thus assigned a binary label to each MMP indicating its potency direction (PD). PD-classification is a balanced binary classification task. Table 1 gives an overview of all our curated data sets.
Data Splitting Technique
ACs are molecular pairs rather than single molecules; it is thus not obvious how best to split up a chemical data set into non-overlapping training- and test sets for the fair evaluation of an AC-prediction method. There seems to be no consensus about which data splitting strategy should be canonically used. Several authors [27, 44, 34] have employed a random split at the level of compound pairs. While this technique is conceptually straightforward, it must be expected to incur a significant overlap between training- and test set at the level of individual molecules. For example, randomly splitting up a set of three MMPs into a training- and a test set might lead to and getting assigned to the training- and getting assigned to the test set which leads to a full inclusion of the test set in the training set at the level of individual molecules. This molecular overlap is problematic for at least three reasons: Firstly, it likely leads to overly optimistic results for AC-prediction methods since they will have already encountered some of the test compounds during training. Secondly, it does not model the natural situation encountered by medicinal chemists who we assume will not know the activity value of at least one compound in a test-set pair. Thirdly, the mentioned molecular overlap should lead to strong AC-prediction results for standard QSAR models, but to the best of our knowledge, no such control experiments have been run in the literature.
Horvath et al. [29] and Tamura et al. [71] have made efforts to address the shortcomings of a compound-pair-based random split. They came up with advanced data splitting algorithms designed to mitigate the molecular-overlap problem by either managing distinct types of test sets according to compound membership in the training set or by designing splitting techniques based on the structural cores of MMPs. However, their data splitting schemes exhibit a relatively high degree of complexity which can make their implementation and interpretation difficult.
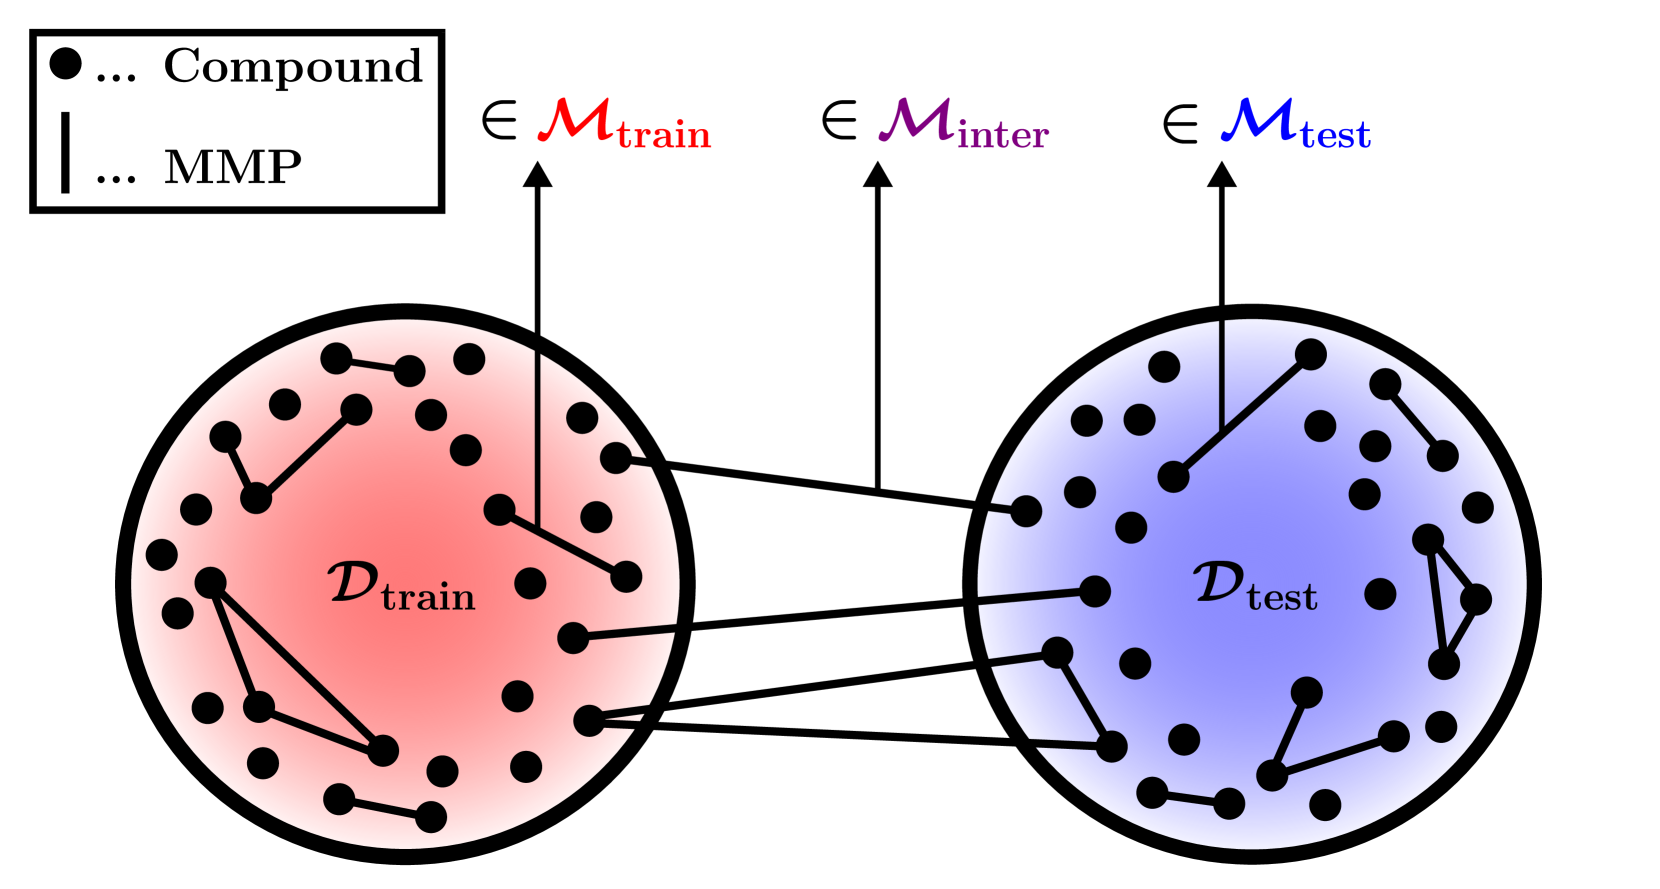
We propose a novel data splitting method which represents a favourable trade-off between rigour, interpretability and simplicity. Our technique shares some of its concepts with the methods proposed by Horvath et al. [29] and Tamura et al. [71] but might be simpler to implement and interpret. We first split the data into a training- and test set at the level of individual molecules and then use this basic split to distinguish several types of test sets at the level of compound pairs. Let
be the given data set of individual molecules. Furthermore, let
be the set of all MMPs in that have been labelled as either ACs or non-ACs. Each MMP shares a common structural core denoted as . We use a random split to partition into a training set and a test set and then define the following MMP-sets:
Here,
which describes the set of MMP-cores that appear in .
Note that . The pair describes the training space at the level of individual molecules and MMPs, and can be used to train a QSAR- or AC-prediction method. A trained method can then classify MMPs in , and . models an AC-prediction setting where the activities of both MMP-compounds are unknown. represents the subset of MMPs in whose structural cores do not appear in ; thus models the difficult task of predicting ACs in a strucurally novel area of chemical space. Finally, represents an AC-prediction scenario where the activity of one MMP-compound is given a priori; this can be interpreted as a compound-optimisation task where one strives to predict small AC-inducing modifications of a query compound with known activity. An illustration of our data splitting strategy is given in Figure 2.
We implemented our data splitting strategy within a -fold cross validation scheme repeated with random seeds. This generated data splits of the form
for and where represents the -th split of in the cross validation round with random seed . The overall QSAR- and AC-prediction performance of each model was recorded as the average over the training- and test runs based on all data splits . We chose the configuration which gave a good trade-off between computational costs and accuracy and reasonable numbers of MMPs in the compound-pair-sets. In particular, random cross-validation with gave expected relative sizes of:
On average, , , and of MMPs in were also in for dopamine receptor D2, factor Xa, and SARS-CoV-2 main protease, respectively.
Prediction Strategies and Performance Measures
In a data split of the form
each individual compound, can be associated with an activity label , defined as the negative decadic logarithm of the experimentally measured activity of . We stuck with the canonical units used in the ChEMBL database and the COVID moonshot project ([nM] for Ki and [µM] for IC50); each activity label thus represents a standard pKi- or pIC50 value (with an additive shift towards caused by the units which might slightly benefit prediction techniques initialised around the origin). We are interested in QSAR-prediction functions,
that can map a chemical structure to an estimate of its binding affinity . The mapping is found via an algorithmic training process on the labelled data set
and can then either be used to predict the activity labels of compounds in , or it can be repurposed to classify whether an MMP forms an activity cliff (AC-classification) and what the potency direction of an MMP is (PD-classification). If , then one can assume that the activity label of one of the compounds, say , is known; is then used to classify via:
Here is a critical threshold above which an MMP is classified as an AC. Throughout this work we use (in pKi- or pIC50 units) since this value represents the middle point between the intervals and which correspond to absolute activity-label differences associated with non-ACs and ACs respectively.
If then the activities of both compounds are unknown and we classify via:
PD-classification for MMPs is performed in a straightforward manner: the activity labels of both MMP-compounds are predicted via and then compared to classify which compound is the more active one.
The performance of for standard QSAR prediction in is measured via the mean absolute error (MAE). For the balanced PD-classification problem we rely on accuracy as a suitable performance measure. For the highly imbalanced task of AC-classification, however, we use the Matthews correlation coefficient (MCC), as well as sensitivity and precision. For the relatively small SARS-CoV-2 main protease data set we sometimes encountered the edge case where there were no positive predictions; we then set and ignored ill-defined precision measurements when averaging the performance metrics to obtain the final results.
Molecular Representation- and Regression Techniques
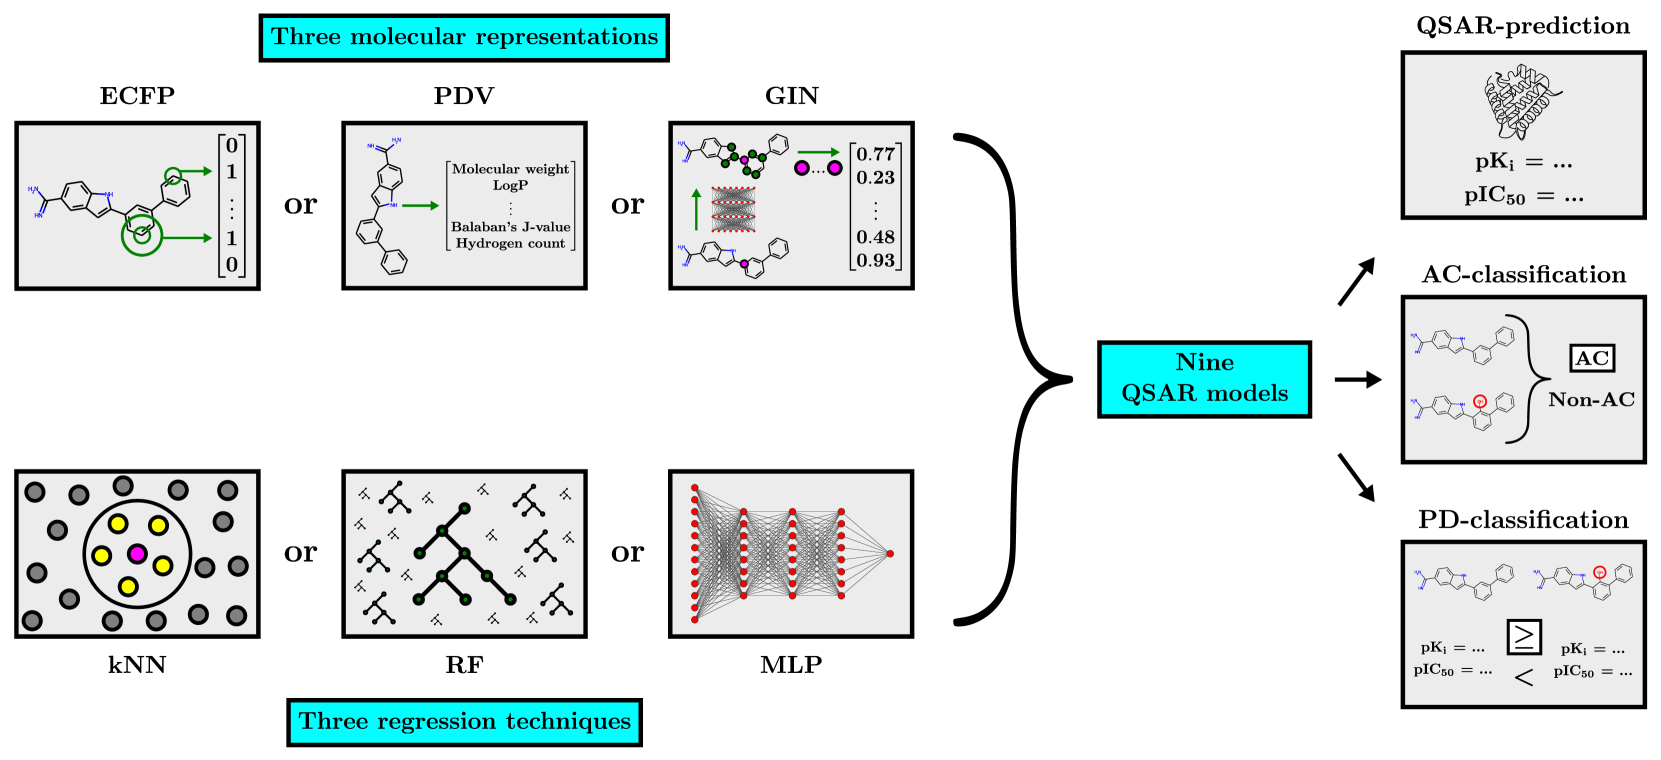
We constructed nine QSAR models via a robust combinatorial methodology that systematically combines three molecular representation methods with three regression techniques. This setup allows, for example, to compare the performance of molecular representation methods across regression techniques, data sets and predictions tasks.
For molecular representation, we used extended-connectivity fingerprints [59] (ECFPs), physicochemical molecular descriptor vectors [72] (PDVs), and graph isomorphism networks (GINs) [81]. Both ECFPs and PDVs were computed via RDKit [42]. The ECFPs were chosen to use a radius of two, a length of bits, and active chirality flags. The PDVs had a dimensionality of and were constructed using the general list of descriptors from the work of Fabian et al. [21]. This list encompasses properties related to druglikeness, logP, molecular refractivity, electrotopological state, molecular graph-structure, fragment profile, charge, and topological surface properties. The GIN was implemented using PyTorch Geometric [23] and consisted of a variable number of graph convolutional layers, each with two internal hidden layers with ReLU activations and batch normalisation [33]. We further chose the maxpool operator which computes the component-wise maximum over all atom feature vectors in the final graph layer to obtain a graph-level representation.
Each molecular representation was used as an input featurisation for three regression techniques: random forests (RFs), k-nearest neigbours (kNNs) and multilayer perceptrons (MLPs). The RF- and kNN-models were implemented via scikit-learn [56] and the MLP-models via PyTorch [55]. The MLPs used ReLU activations and batch normalisation at each hidden layer.
The GIN was combined with the regression techniques as follows: For MLP regression, the GIN was trained with the MLP as a projection head after the pooling step in the usual end-to-end manner. For RF- or kNN-regression, the GIN was first trained with a single linear layer added after the global pooling step that directly mapped the graph-level representation to an activity prediction. After this training phase the weights of the GIN were frozen and it was used as a static feature extractor. The RF- or kNN-regressor was then trained on the features extracted by the frozen GIN. Figure 3 illustrates our combinatorial experimental methodology.
Model Training and Hyperparameter Optimisation
All models were trained using full inner hyperparameter-optimisation loops. Hyperparameters of RFs and kNNs were optimised in scikit-learn [56] by uniformly random sampling of hyperparameters from a predefined grid. The hyperparameters of MLPs and GINs were sampled from a predefined grid via the tree-structured Parzen estimator algorithm implemented in Optuna [2]. Deep learning models were trained for epochs on a single NVIDIA GeForce RTX 3060 GPU via the mean squared error loss function using AdamW optimisation [46]. Weight decay, learning rate decay and dropout [65] were employed at all hidden layers for regularisation. Batch size, learning rate, learning rate decay rate, weight decay rate, and dropout rate were treated as hyperparameters and subsequently optimised. Note that the training length (i.e. the number of gradient updates) was implicitly optimised by tuning the batch size for the fixed number of training epochs. Further implementation details can be found in our public code repository111https://github.com/MarkusFerdinandDablander/QSAR-activity-cliff-experiments.
Results and Discussion
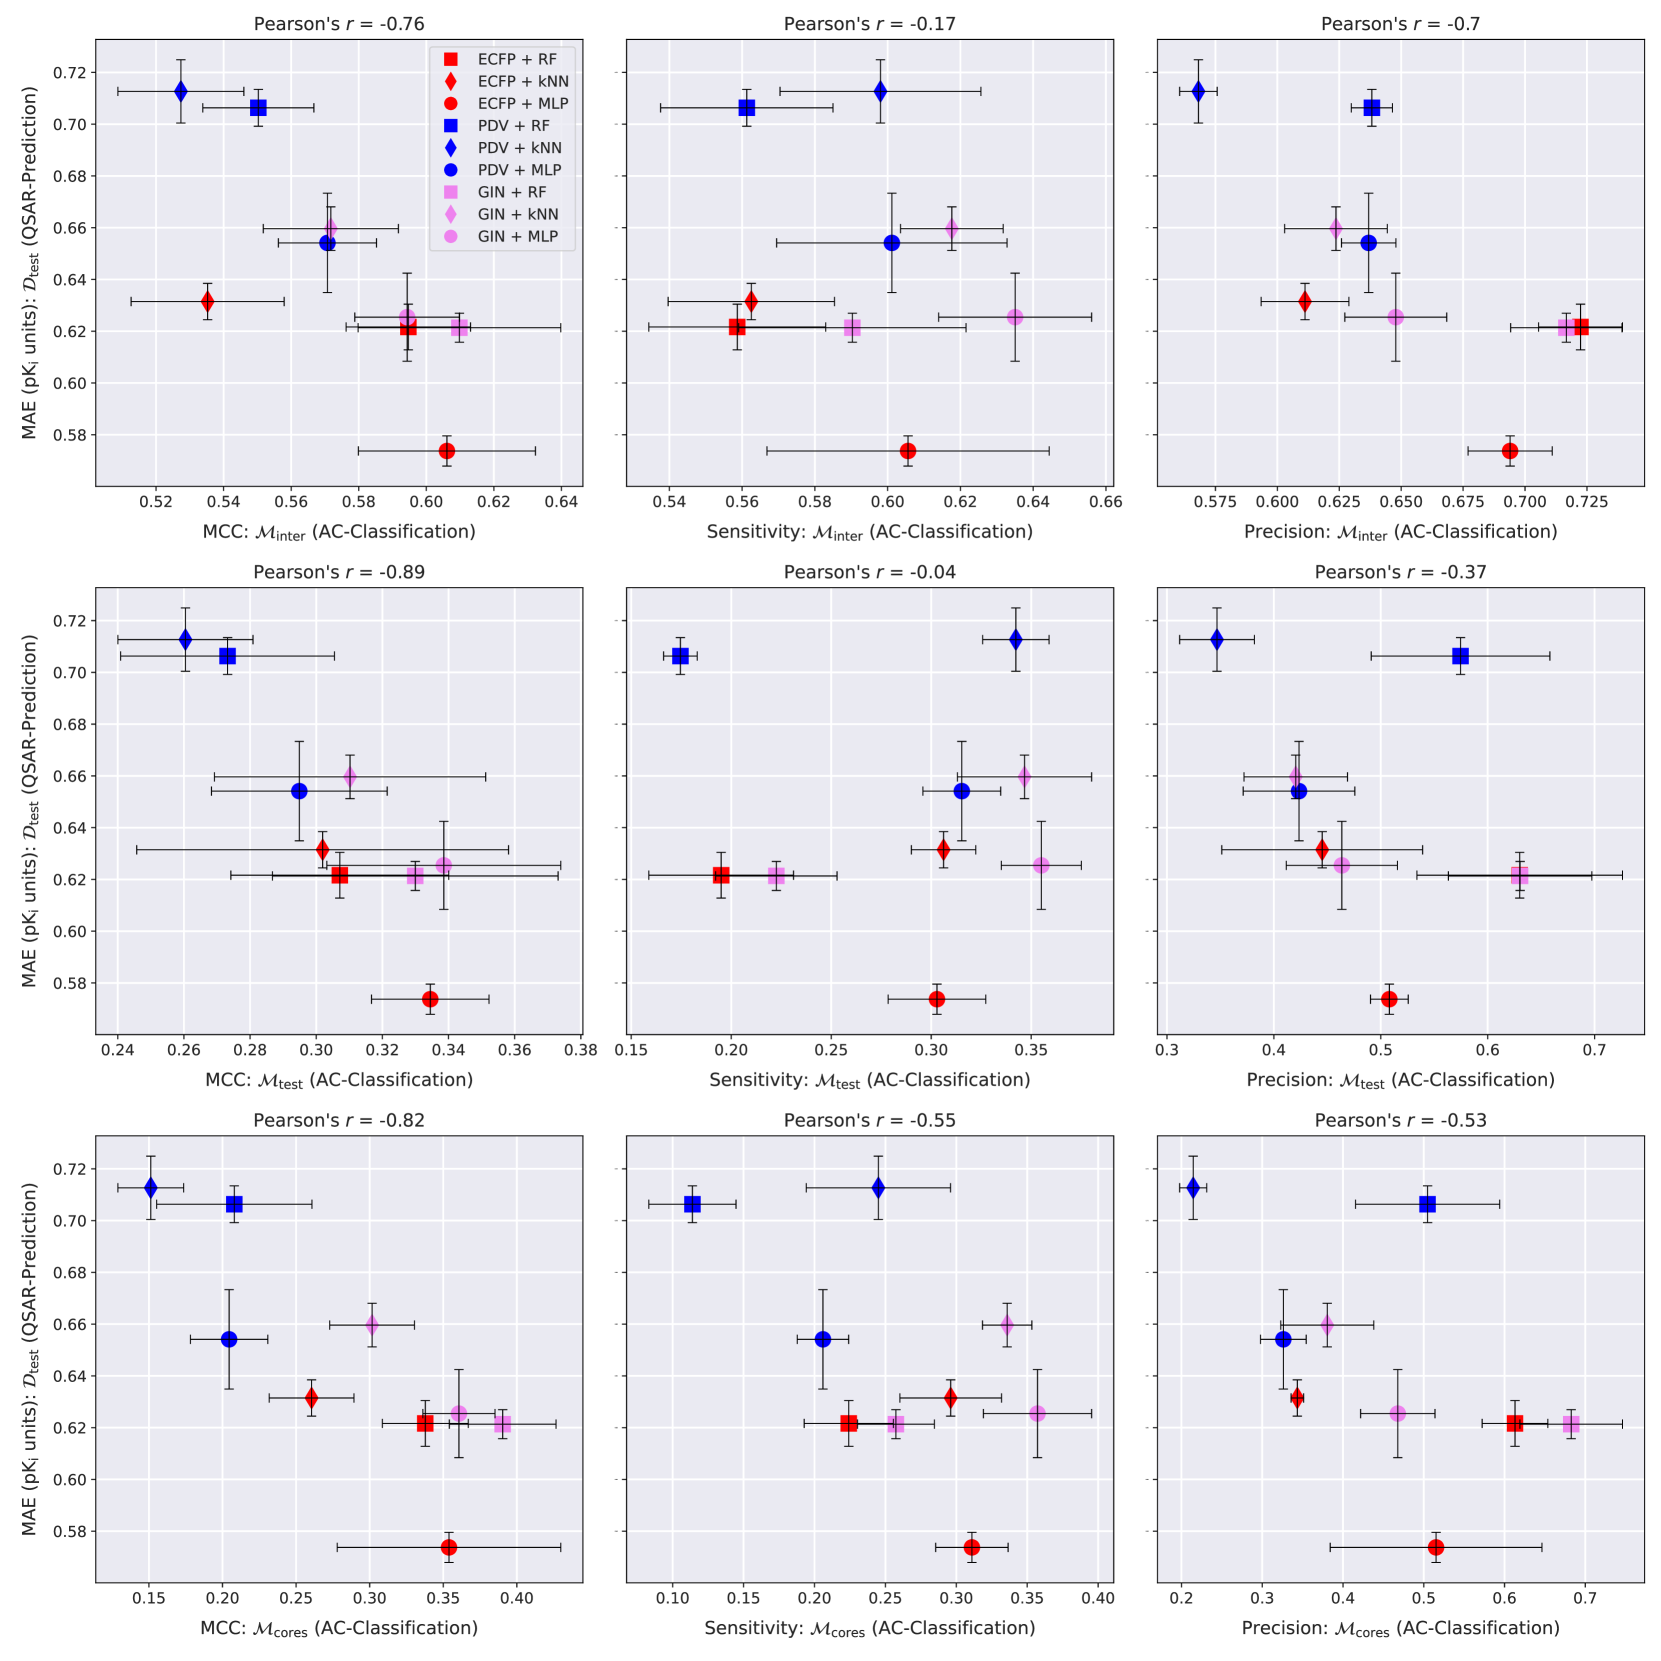
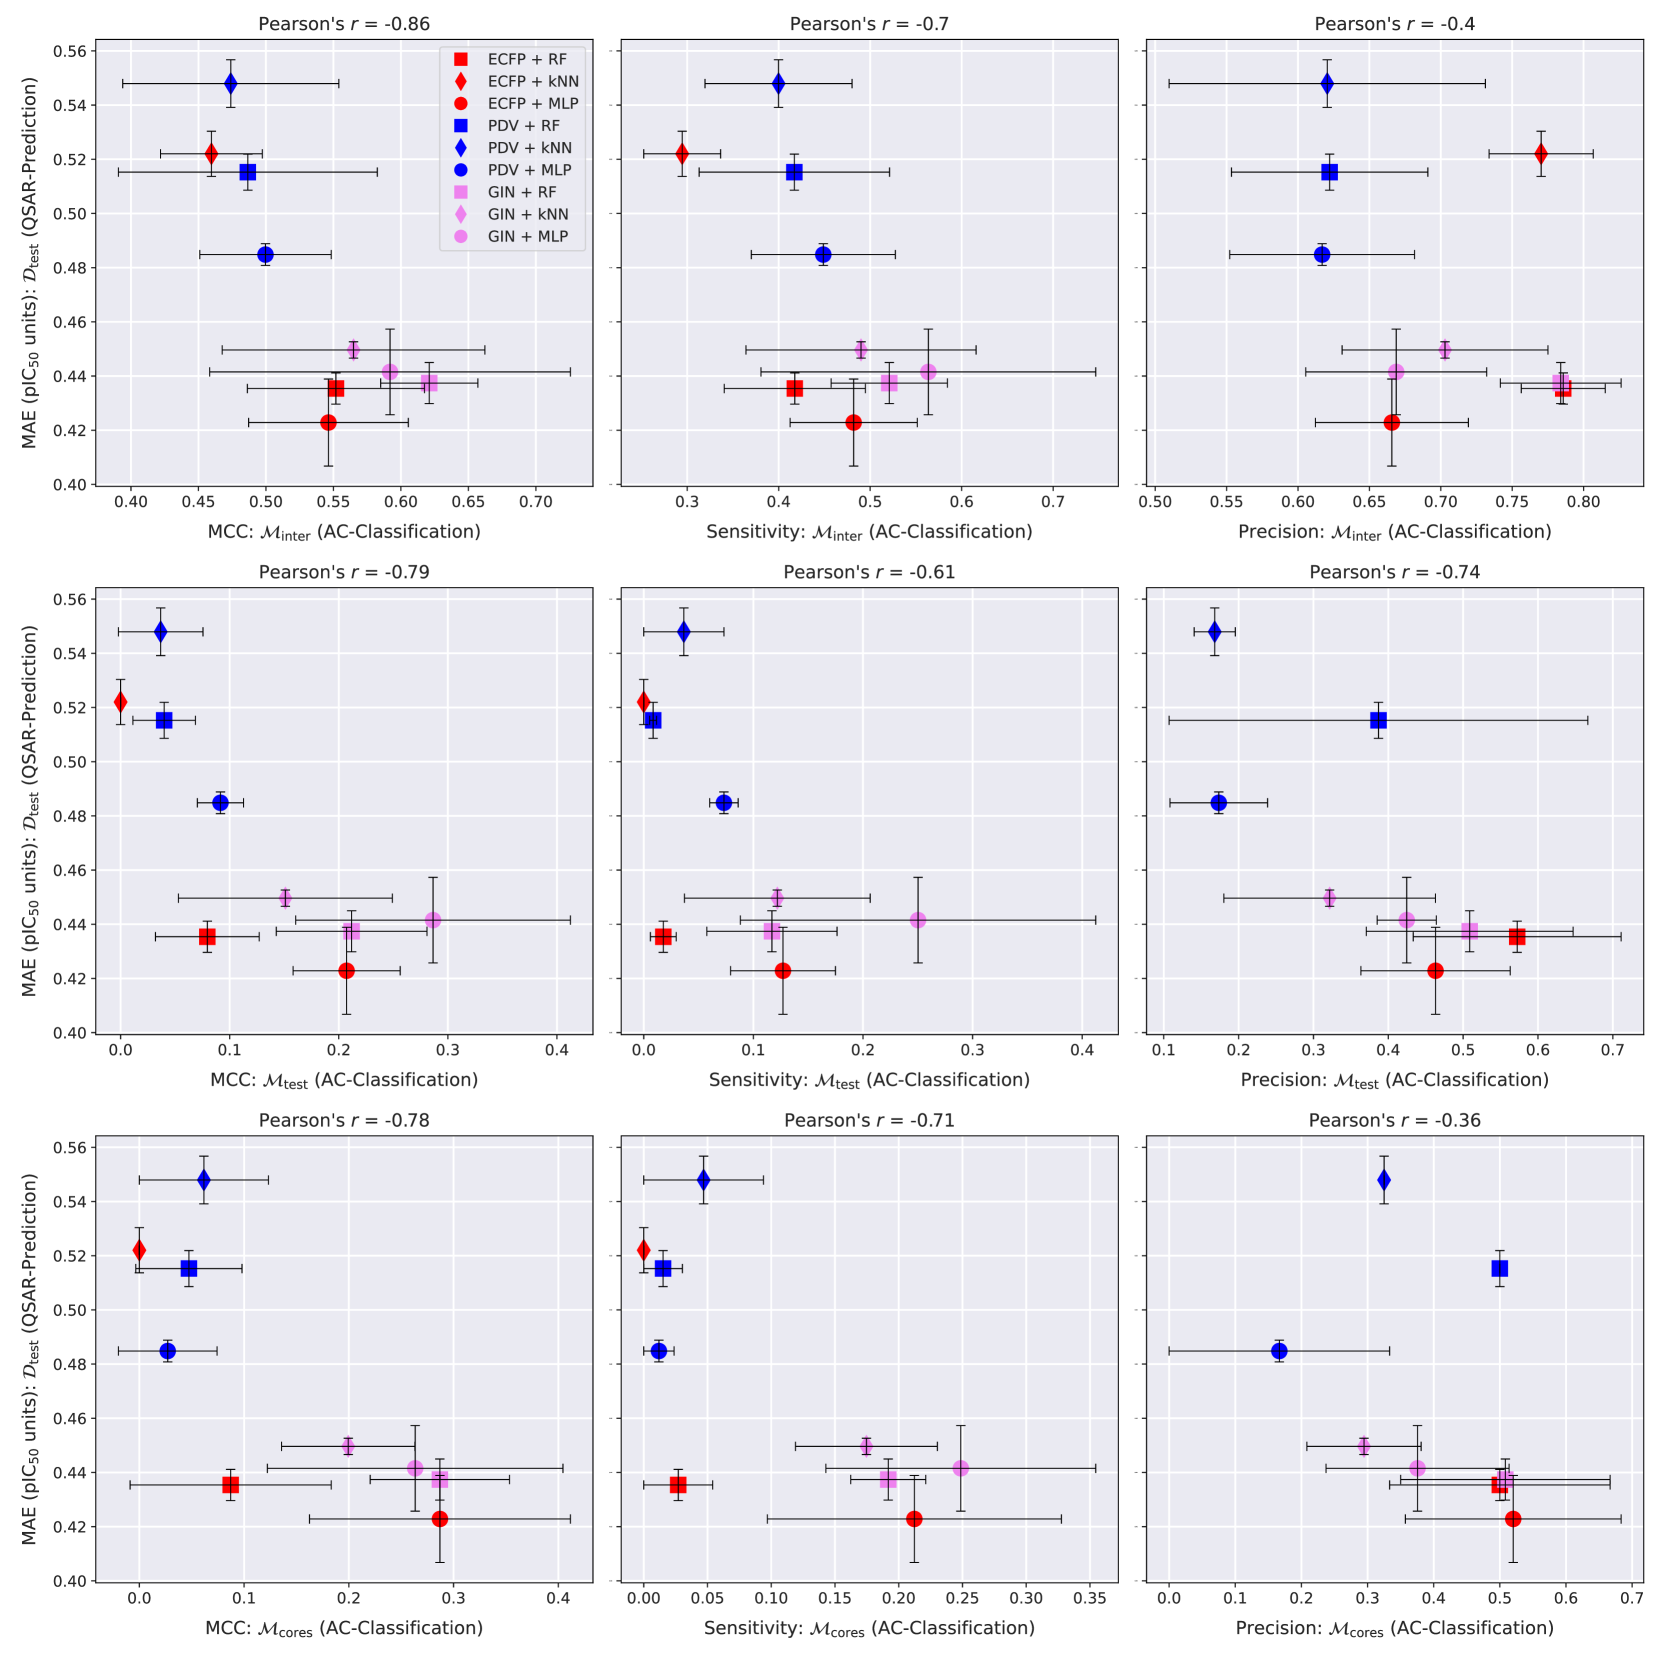
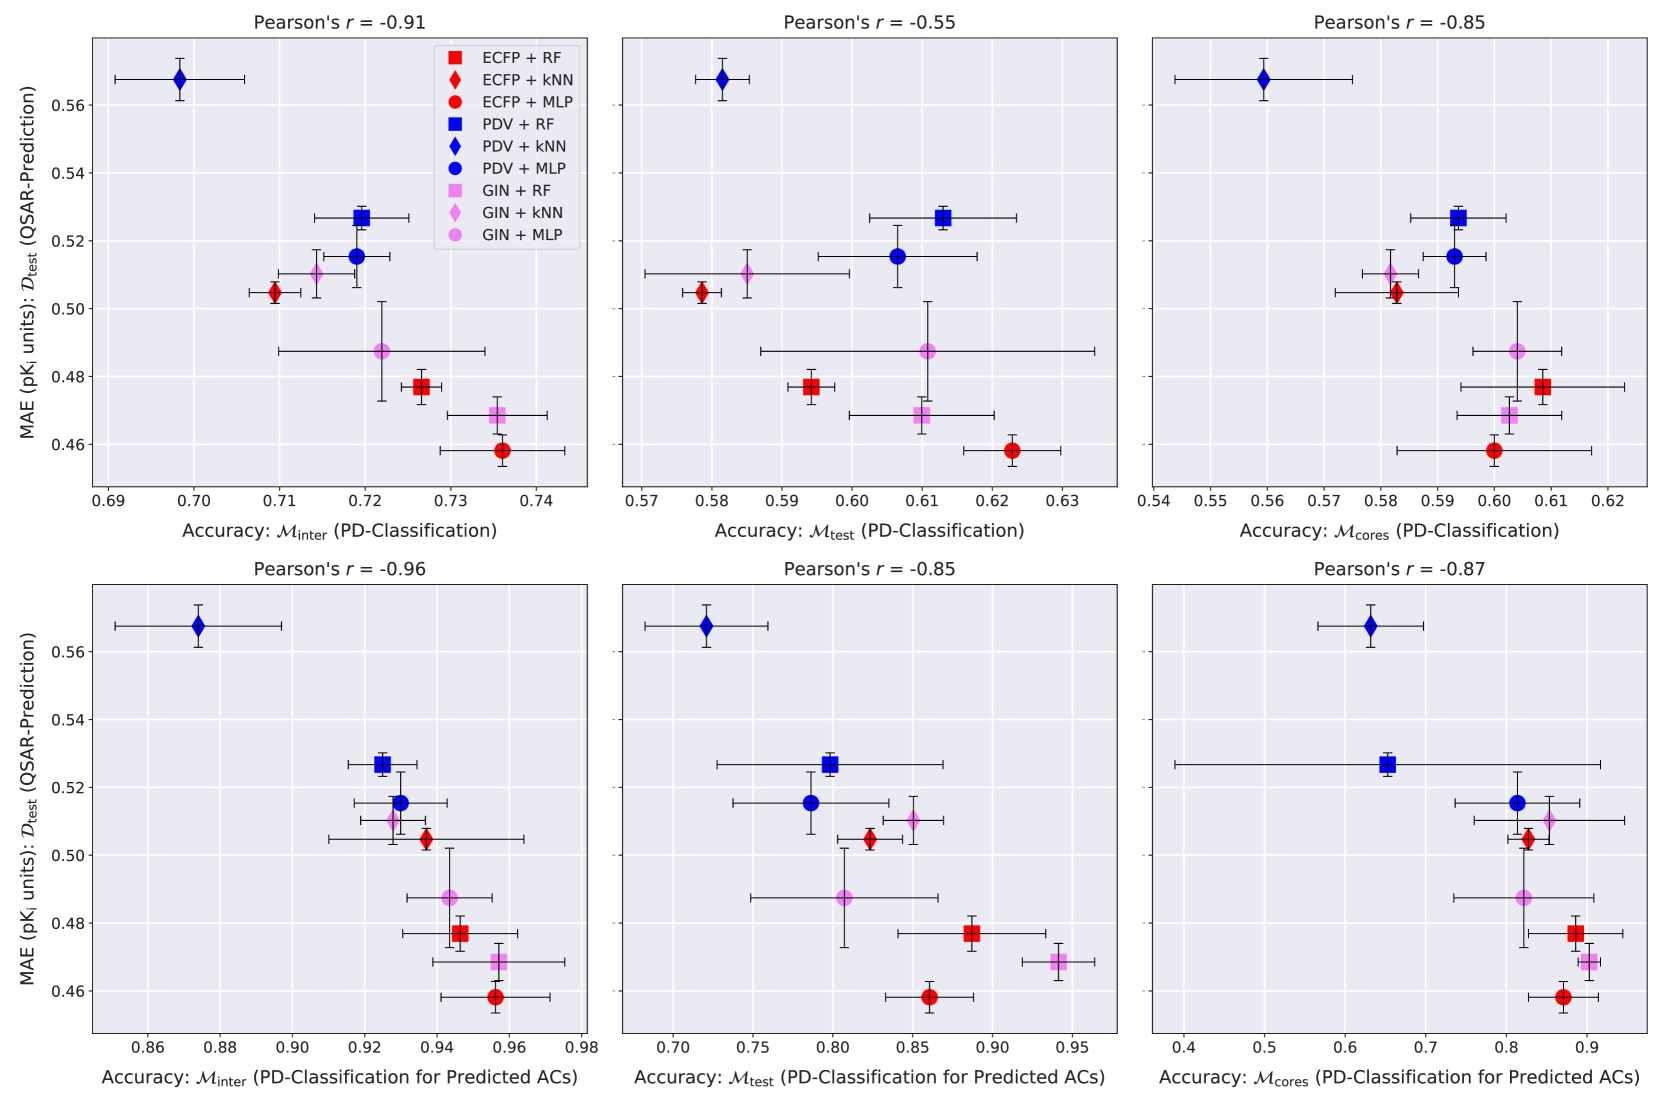
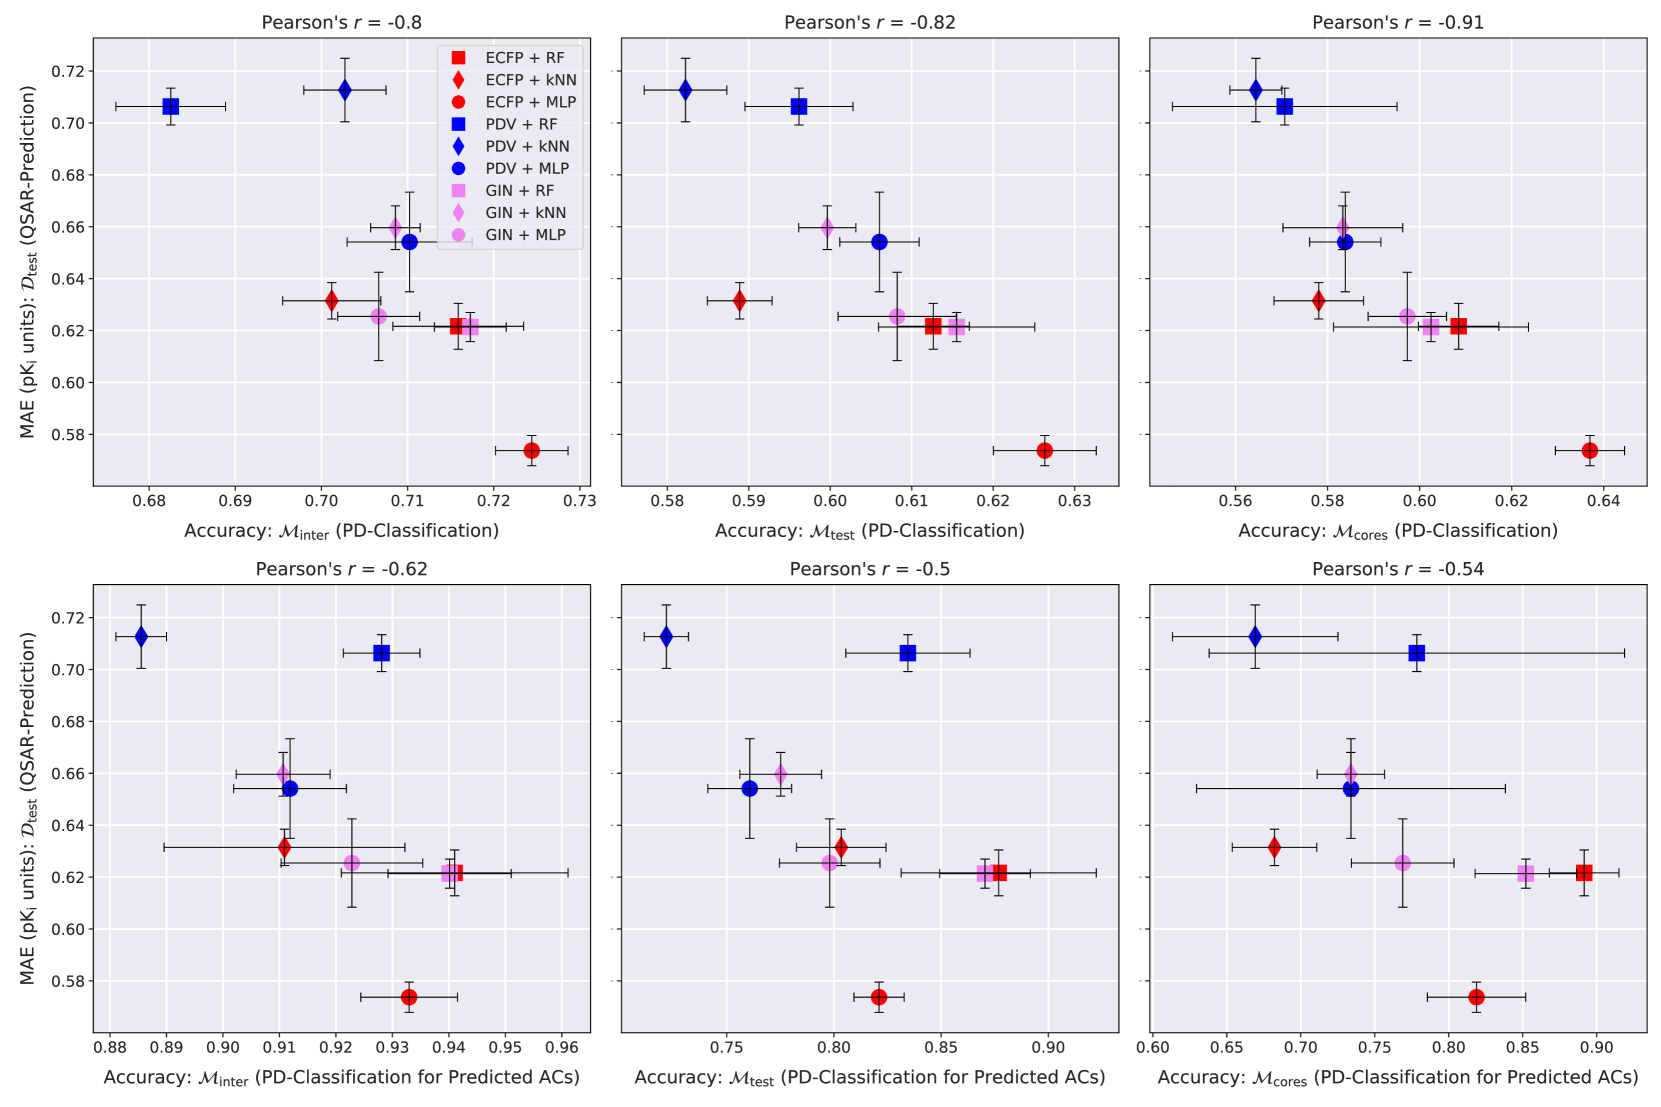
The QSAR-prediction-, AC-classification- and PD-classification results for all three data sets are depicted in Figures 4, 5, 6, 7, 8 and 9.
QSAR-Prediction Performance
When considering the results depicted in Figures 4, 5, 6, 7, 8 and 9 with respect to QSAR-prediction performance, one can see that ECFPs tend to lead to better performance (i.e. a lower QSAR-MAE) compared to GINs, which in turn tend to lead to better performance compared to PDVs. In particular, the combination MLP-ECFP consistently produced the lowest QSAR-MAE across all three targets. These observations reinforce a growing corpus of literature that suggests that trainable GNNs have not yet reached a level of technical maturity by which they consistently and definitively outperform the much simpler non-differentiable ECFPs at important molecular property prediction tasks [66, 48, 37, 50, 13, 60, 80].
AC-Classification Performance
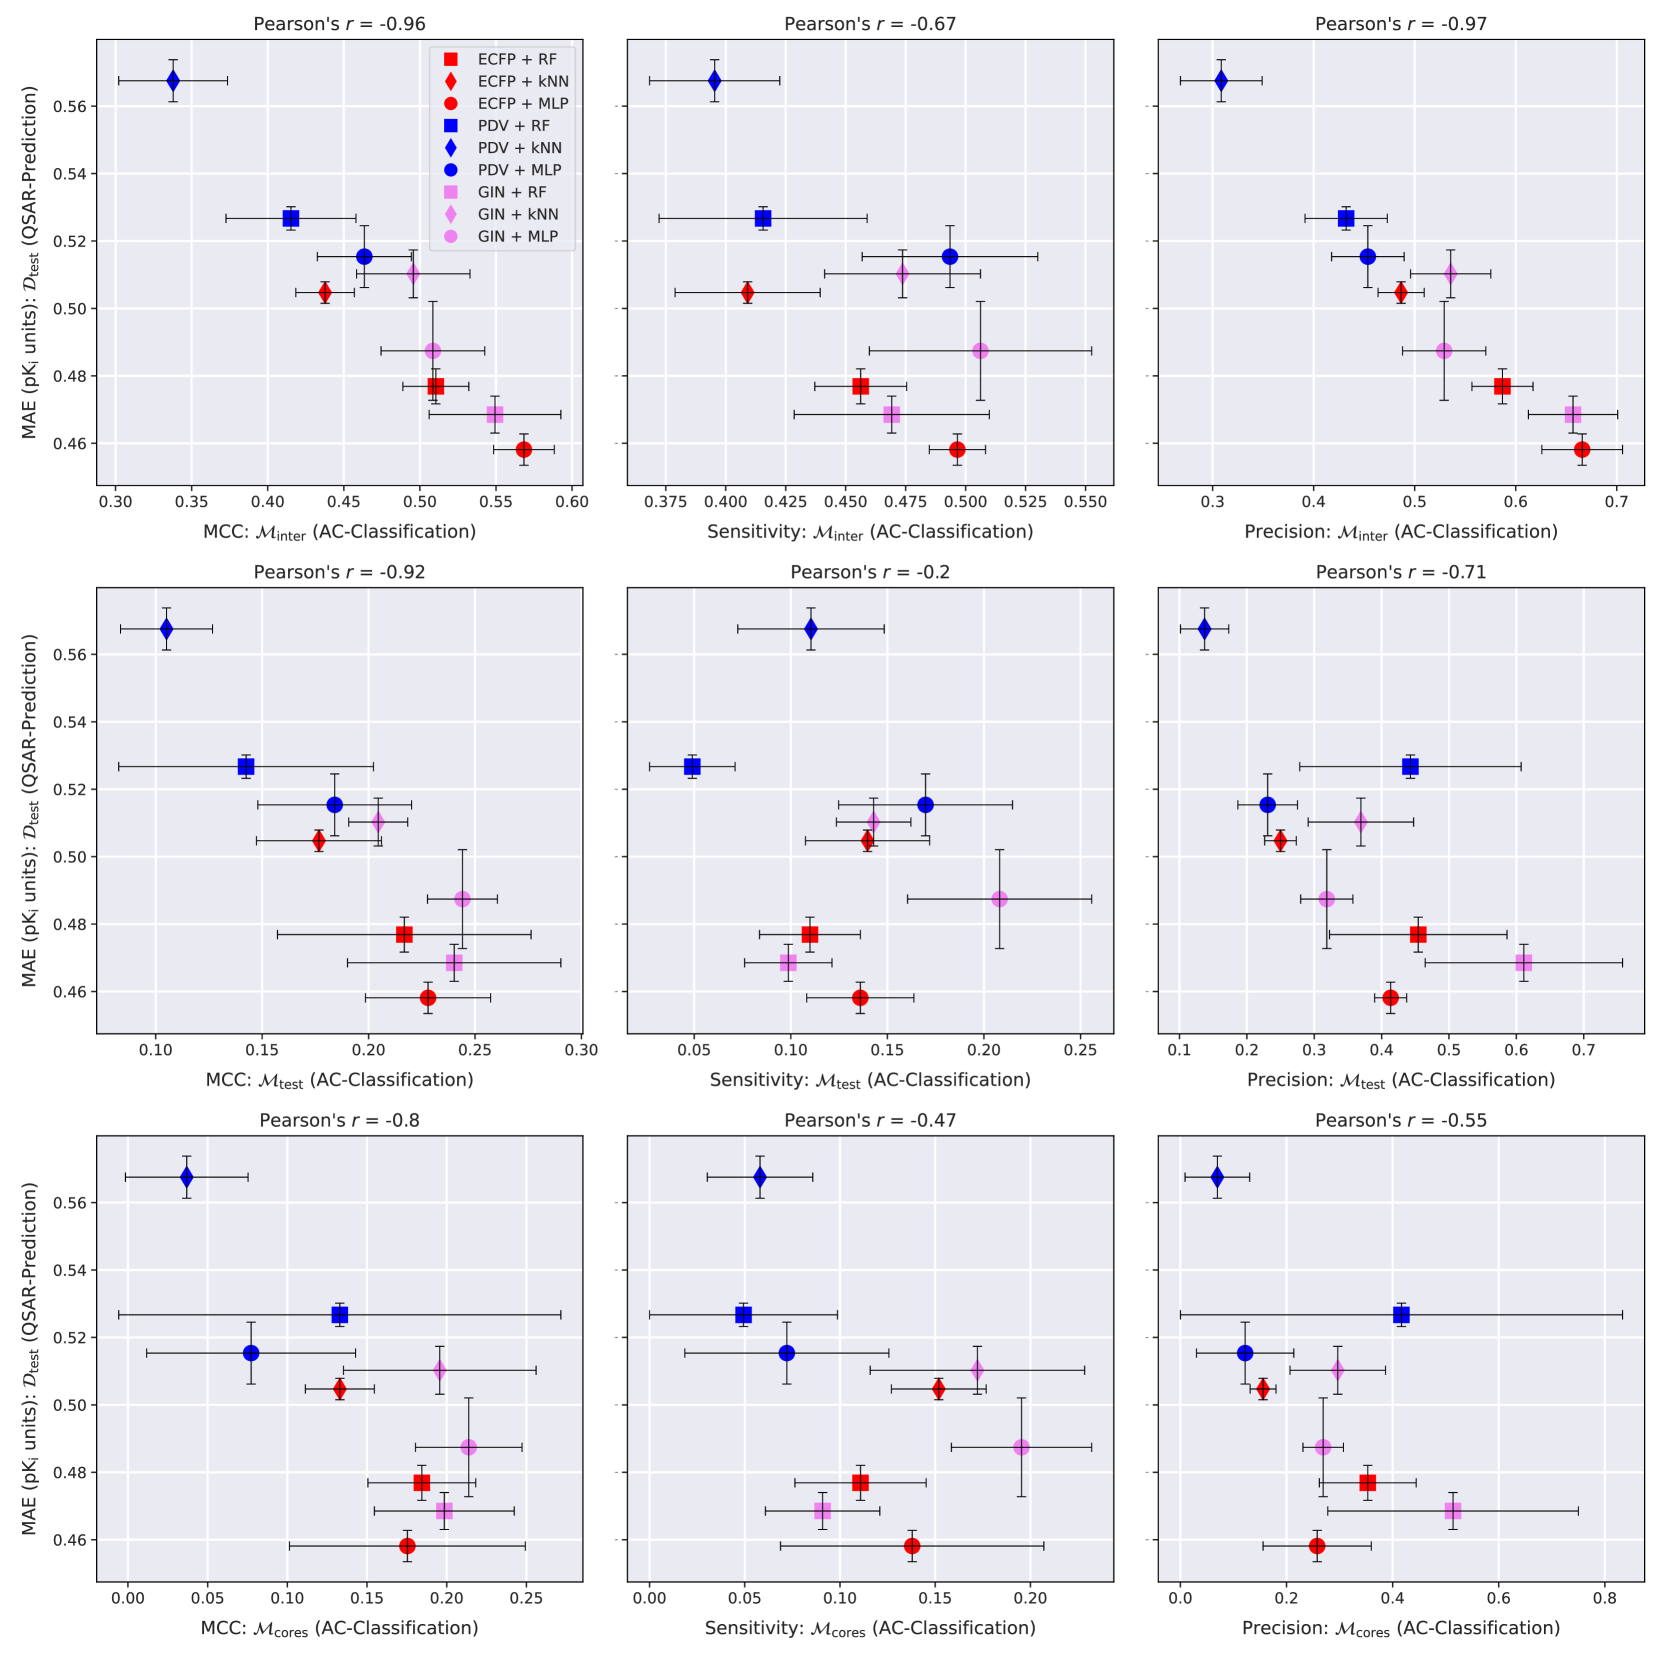
The AC-MCC plots in Figures 4, 5 and 6 reveal surprisingly strong overall AC-classification results on . This type of MMP-set models a compound-optimisation scenario where a researcher strives to identify small structural modifications with a large impact on the activity of query compounds with known activities. For this task, a significant portion of our QSAR models exhibit an AC-MCC value greater than across targets, which appears impressive considering the simplicity of the approach. Exchanging with either or leads to a substantial drop in the AC-MCC to approximately that appears to be mediated by a large drop in AC-sensitivity.
In most cases, GINs perform better than the other molecular representation methods with respect to the AC-MCC. Notably, kNN-regressors consistently perform best for AC-classification when combined with GIN-features; this supports the idea that GINs might have a heightened ability to resolve ACs by learning an embedding of chemical space in which the distance between two compounds is reflective of activity difference rather than structural difference. The combinations GIN-MLP, GIN-RF and ECFP-MLP exhibit particularly high AC-MCC values relative to the other methods. We recommend using at least one of these three models as a baseline against which to compare tailored AC-prediction models; the practical utility of any AC-prediction technique that cannot outperform these three common QSAR methods is questionable.
Across all three targets, AC-sensitivity is moderately high on but universally low on and . This is consistent with the hypothesis that ACs form one of the major sources of prediction error for QSAR models. The weak AC-sensitivity on and indicates that modern QSAR methods are largely blind to ACs in novel areas of chemical space and thus lack essential chemical knowledge. GINs clearly outperform the other two more classical molecular representations across regression techniques with respect to AC-sensitivity. In particular, the GIN-MLP combination leads to the highest AC-sensitivity in all examined cases and thus discovers the most ACs. The highly parametric nature of GINs that makes them prone to overfitting could at the same time enable them to better model jagged regions of the SAR-landscape that contain ACs than classical task-agnostic representations.
There is a wide gap between distinct prediction techniques with respect to AC-precision: some models achieve a considerable level of AC-precision such that over % of positively predicted MMPs in and are indeed actual ACs. Other QSAR models, however, seem to fail almost entirely with respect to this metric on and and only deliver modest performance on . RFs tend to exhibit the strongest AC-precision and the weakest AC-sensitivity. This might be as a result of their ensemble nature which should intuitively lead to conservative but trustworthy predictions of extreme effects such as ACs.
PD-Classification Performance
The abilities of the evaluated QSAR models to identify which is the more active compound in an MMP is universally weak, with PD-accuracies clustering around on and around on and , as can be seen in the top rows of Figures 7, 8 and 9. Predicting the potency direction for two compounds with similar structures and thus usually similar activity levels must be considered a challenging task. The combination ECFP-MLP reaches the strongest PD-accuracy in the majority of cases and we recommend starting with this model as a baseline for more advanced PD-prediction methods.
One can argue that the activity order of two similar compounds is of little interest if the true activity difference is small, as is often the case. We therefore also restricted PD-classification to predicted ACs. The three plots in the bottom rows of Figures 7, 8 and 9 depict the PD-accuracy of each QSAR model on the subset of MMPs that were also predicted to be ACs by the same model. In this practically more relevant scenario PD-prediction accuracy tends to exceed on and on and . The QSAR models investigated here are thus able to identify the correct activity order of MMPs if they also predict them to be ACs. The relatively rare instances in which the PD of a predicted AC is misclassified, however, reflect severe QSAR-prediction errors.
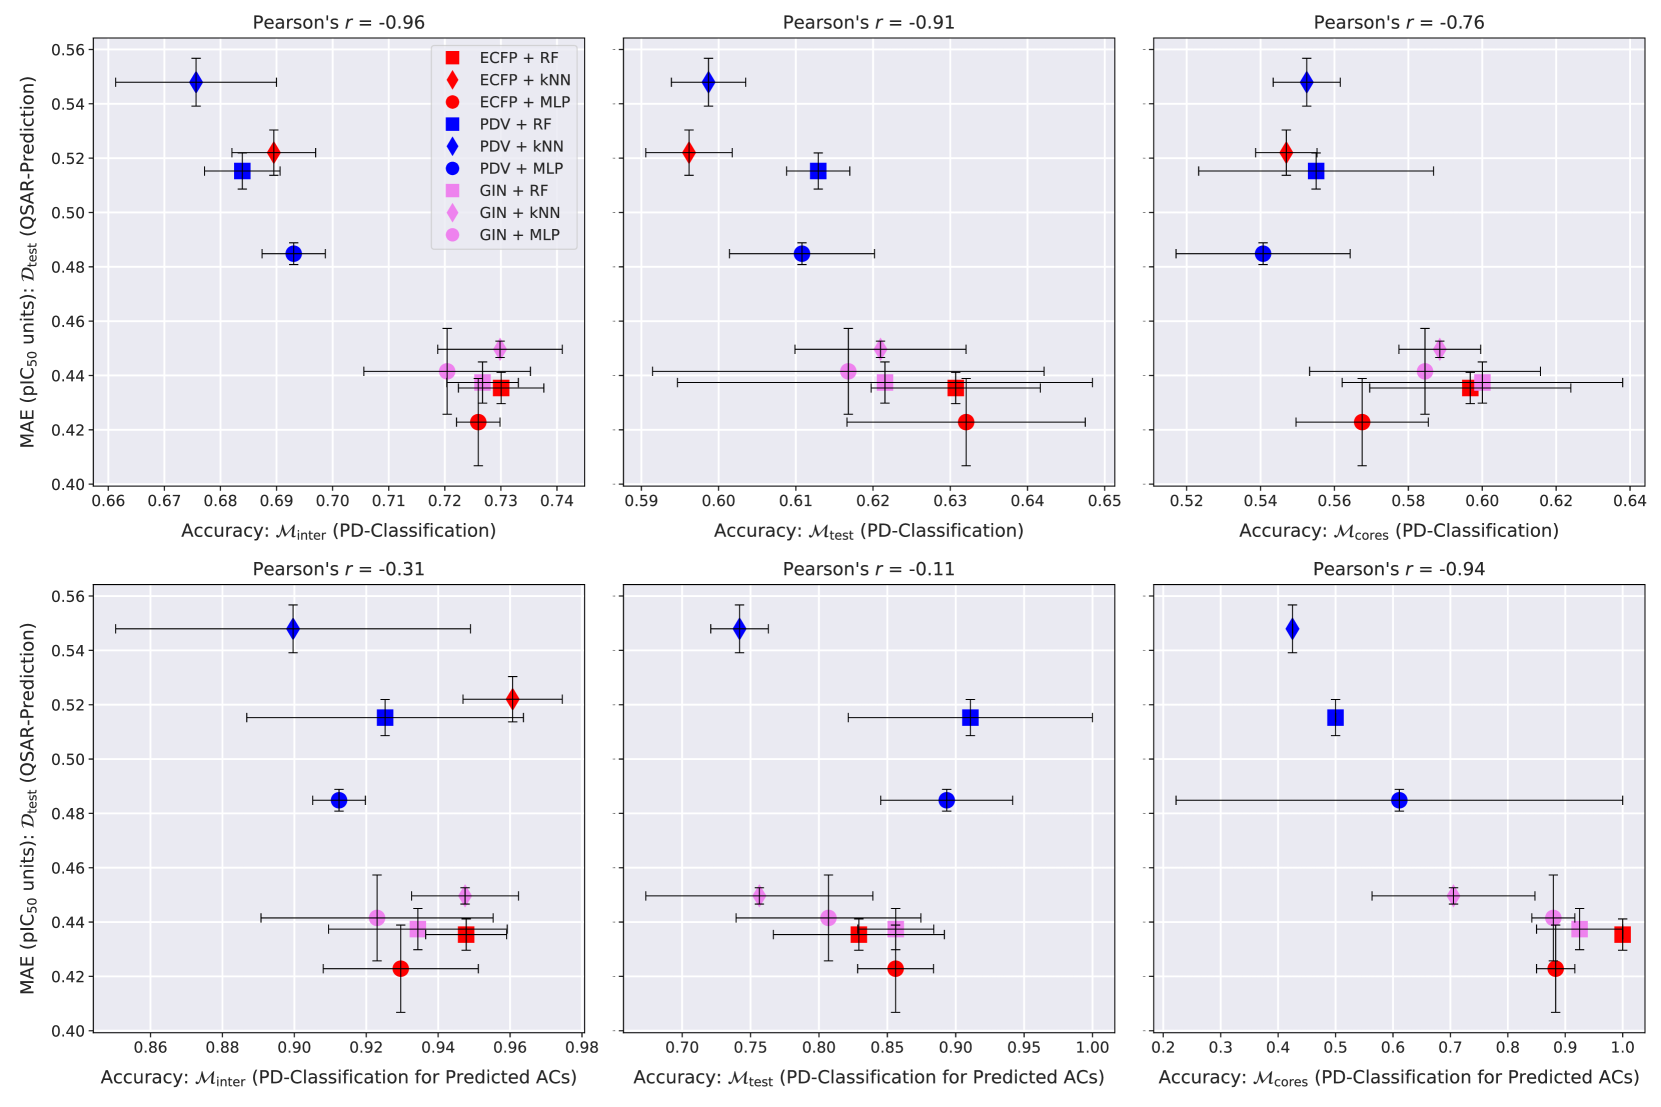
Linear Relationship between QSAR-MAE and AC-MCC
Our experiments reveal a consistent linear relationship between the QSAR-MAE and the AC-MCC as can be seen in the left columns of Figures 4, 5 and 6. A potential mechanism driving this effect could be that as the overall QSAR-MAE of a model improves, its accuracy at predicting activity differences between similar molecules might be expected to improve as well; previously misclassified MMPs whose predicted absolute activity differences were already close to the critical value might then gradually move to the correct side of the decision boundary and increase the AC-MCC. The results suggest that for real-world QSAR models the AC-MCC and the QSAR-MAE are strongly predictive of each other; while this observation only rests on nine models, it is highly consistent across MMP-sets and pharmacological targets.
Future Research: Exploring Twin-Network Training Schemes
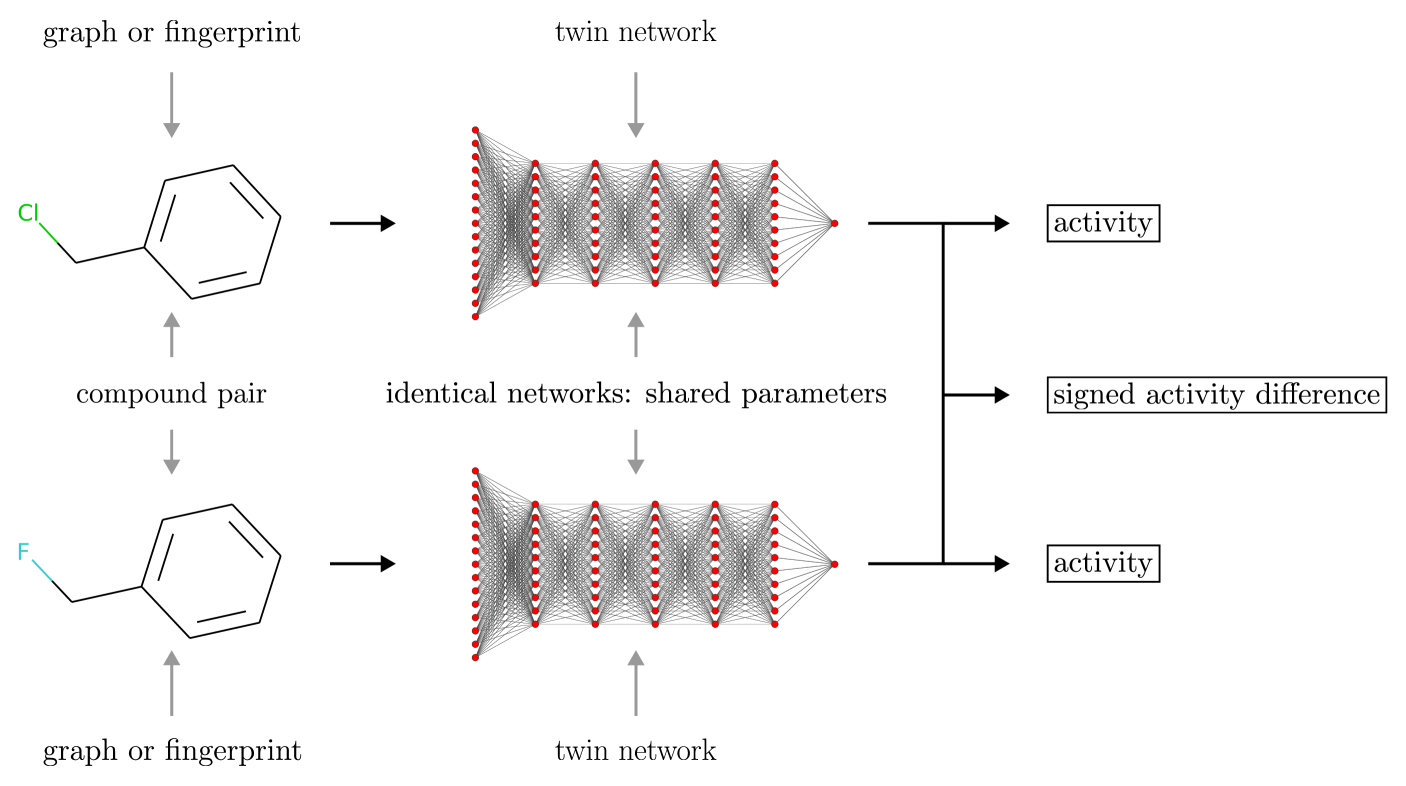
ACs are rich in pharmacological information; at the same time the experiments have shown that QSAR models exhibit low AC-sensitivity and thus frequently fail to predict ACs. In spite of this, to the best of our knowledge so far no method has been described to tackle this problem by attempting to increase the AC-sensitivity of QSAR models. We propose twin-network training of deep-learning models as a potential strategy to increase AC-sensitivity. Comparatively little work has been done to investigate twin neural network architectures (also referred to as Siamese networks [12, 9, 41, 70]) in computational drug discovery [18, 82, 61, 73, 6, 3, 11, 22, 36, 58, 53, 24]. However, twin networks provide a natural way to tackle chemical prediction problems on compound pairs such as AC-classification.
Instead of training a deep network, , on an individual compound, , with activity label, , via a classical squared error loss, , we suggest to train on compound pairs, , using a pair-based loss:
The quantity is used to specify the weight put on the compound pair during training; determines the relative importance of predicting the individual activities of and versus predicting the activity difference associated with . Twin-network training could be conducted in two phases: first on general compound pairs in and then on MMPs in . In the second phase, the weight function could be used to assign training weights to MMPs proportional to their associated activity differences; MMPs that represent larger activity differences might encode structural transformations that are pharmacologically more relevant and thus should receive more attention during training. This weighting procedure could lead to increased AC-sensitivity and the extraction of more chemical knowledge. Our pair-based training strategy is depicted in Figure 10 and is based on a twin neural network model for AC-prediction with discrete outputs that we explored in a previous research study [16]. We intend to evaluate the proposed twin-network training scheme in a future study.
Conclusions
To the best of our knowledge this is the first study to investigate the AC-prediction capabilities of QSAR models. It is also the first work to explore the quantitative relationship between QSAR-prediction (at the level of individual molecules) and AC-prediction (at the level of compound-pairs). As part of our methodology we have additionally introduced a simple, interpretable, and rigorous data-splitting technique for pair-based prediction tasks.
When the activities of both MMP-compounds are unknown (i.e. absent from the training set) then common QSAR models exhibit low AC-sensitivity which limits their utility for AC-prediction. This strongly supports the hypothesis that QSAR methods do indeed regularly fail to predict ACs which might thus form a major source of prediction errors in QSAR modelling [26, 14, 47, 63]. However, if the activity of one MMP-compound is known (i.e. present in the training set) then AC-sensitivity increases substantially; for query compounds with known activities, QSAR methods can therefore be used as simple AC-prediction-, compound-optimisation- and SAR-knowledge-acquisition tools. Furthermore, based on the observed potency-directon (PD) classification results we can expect the estimated activity direction of predicted ACs to have a high degree of accuracy.
With respect to molecular representation, we have found robust evidence that non-trainable task-agnostic ECFPs still outcompete differentiable GINs at general QSAR-prediction. This adds to a growing awareness that standard message-passing GNNs might need to be improved further to definitively beat classical molecular featurisations such as ECFPs [66, 48, 37, 50, 13, 60, 80]. One potential angle to achieve this could be self-supervised GNN-pretraining, which has recently shown promising results in the molecular domain [30, 78]. However, while GINs appear to be inferior to ECFPs for QSAR-prediction, they tend to be advantageous for AC-classification; their highly parametric nature might simultaneously lead to increased overfitting but to a better modelling of the more jagged regions of the SAR-landscape. We thus recommend using GINs as an AC-classification baseline since such an agreed-upon baseline is currently lacking.
Finally, the low AC-sensitivity of QSAR models when the activites of both MMP-compounds are unknown suggests that such methods are still lacking essential SAR knowledge; on the flip side, it might be possible to boost QSAR-modelling performance and increase the amount of extracted SAR knowledge by developing techniques to increase AC-sensitivity. To this end, we propose an AC-sensitive twin-network [12, 9, 41, 70] training scheme for deep-learning models that we intend to explore in the future.
Funding
This research was supported by the University of Oxford’s UK EPSRC Centre For Doctoral Training in Industrially Focused Mathematical Modelling (EP/L015803/1) and by the not-for-profit organisation and educational charity Lhasa Limited (https://www.lhasalimited.org/).
Abbreviations
-
•
AC = Activity Cliff
-
•
ECFP = Extended-Connectivity Fingerprint
-
•
GIN = Graph Isomorphism Network
-
•
GNN = Graph Neural Network
-
•
kNN = k-Nearest Neighbour
-
•
MAE = Mean Absolute Error
-
•
MCC = Matthews Correlation Coefficient
-
•
MLP = Multilayer Perceptron
-
•
MMP = Matched Molecular Pair
-
•
PD = Potency Direction
-
•
PDV = Physicochemical-Descriptor Vector
-
•
QSAR = Quantitative Structure-Activity Relationship
-
•
RF = Random Forest
-
•
SAR = Structure-Activity Relationship
Availability of data and materials
All used data sets, the code to reproduce and visualise the experimental results, and the exact numerical results generated by the original experiments are available in our public code repository https://github.com/MarkusFerdinandDablander/QSAR-activity-cliff-experiments.
Competing interests
The authors declare that they have no competing interests.
Authors’ contributions
The computational study was designed, implemented, conducted and interpreted by the first author M.D. The research was supervised by R.L., G.M.M., and T.H. who gave valuable scientific advice during weekly meetings. The computer code was written by M.D. The paper manuscript was written by M.D. Feedback was provided by R.L., G.M.M. and T.H. during the writing process. The novel data splitting technique for MMP-data, the QSAR-modelling-based activity cliff prediction strategies and the proposed twin-network training scheme were developed by M.D. All scientific figures were designed by M.D., with input from G.M.M., R.L. and T.H. All chemical data sets were gathered and cleaned by M.D. All authors read and approved the final manuscript.
References
- Achdout et al [2022] Achdout H, Aimon A, Bar-David E, Barr H, Ben-Shmuel A, Bennett J, Bilenko VA, Bilenko VA, Boby ML, Borden B, Bowman GR, Brun J, et al (2022) Open science discovery of oral non-covalent SARS-CoV-2 main protease inhibitor therapeutics. bioRxiv. https://www.biorxiv.org/content/early/2022/01/30/2020.10.29.339317
- Akiba et al [2019] Akiba T, Sano S, Yanase T, Ohta T, Koyama M (2019) Optuna: a next-generation hyperparameter optimization framework. In: Proceedings of the 25th ACM SIGKDD International Conference on Knowledge Discovery & Data Mining, pp 2623–2631
- Alvarez and Pahissa [2010] Alvarez PA, Pahissa J (2010) QT alterations in psychopharmacology: proven candidates and suspects. Current Drug Safety 5(1):97–104
- Asawa et al [2020] Asawa Y, Yoshimori A, Bajorath J, Nakamura H (2020) Prediction of an MMP-1 inhibitor activity cliff using the SAR matrix approach and its experimental validation. Scientific Reports 10(1):14,710
- Bajorath [2014] Bajorath J (2014) Exploring activity cliffs from a chemoinformatics perspective. Molecular Informatics 33(6-7):438–442
- Baskin et al [2006] Baskin II, Palyulin VA, Zefirov NS (2006) Neural networks in building QSAR models. In: Artificial Neural Networks, Springer, pp 133–154
- Beck and Springer [2014] Beck JM, Springer C (2014) Quantitative structure-activity relationship models of chemical transformations from matched pairs analyses. Journal of Chemical Information and Modeling 54(4):1226–1234
- Bento et al [2020] Bento AP, Hersey A, Félix E, Landrum G, Gaulton A, Atkinson F, Bellis LJ, de Veij M, Leach AR (2020) An open source chemical structure curation pipeline using RDKit. Journal of Cheminformatics 12(1):1–16
- Bromley et al [1993] Bromley J, Bentz JW, Bottou L, Guyon I, LeCun Y, Moore C, Säckinger E, Shah R (1993) Signature verification using a ”Siamese” time delay neural network. International Journal of Pattern Recognition and Artificial Intelligence 7(04):669–688
- Chen et al [2022] Chen H, Vogt M, Bajorath J (2022) DeepAC - conditional transformer-based chemical language model for the prediction of activity cliffs formed by bioactive compounds. Digital Discovery 1:898–909
- Chen et al [2019] Chen M, Ju CJT, Zhou G, Chen X, Zhang T, Chang KW, Zaniolo C, Wang W (2019) Multifaceted protein-protein interaction prediction based on Siamese residual RCNN. Bioinformatics 35(14):i305–i314
- Chicco [2021] Chicco D (2021) Siamese neural networks: an overview. Artificial Neural Networks 2190:73–94
- Chithrananda et al [2020] Chithrananda S, Grand G, Ramsundar B (2020) ChemBERTa: large-scale self-supervised pretraining for molecular property prediction. arXiv:201009885
- Cruz-Monteagudo et al [2014] Cruz-Monteagudo M, Medina-Franco JL, Pérez-Castillo Y, Nicolotti O, Cordeiro MNDS, Borges F (2014) Activity cliffs in drug discovery: Dr Jekyll or Mr Hyde? Drug Discovery Today 19(8):1069–1080
- Cruz-Monteagudo et al [2016] Cruz-Monteagudo M, L Medina-Franco J, Perera-Sardiña Y, Borges F, Tejera E, Paz-y Mino C, Pérez-Castillo Y, Sánchez-Rodríguez A, Contreras-Posada Z, Cordeiro ND (2016) Probing the hypothesis of SAR continuity restoration by the removal of activity cliffs generators in QSAR. Current Pharmaceutical Design 22(33):5043–5056
- Dablander et al [2021] Dablander M, Lambiotte R, Morris GM, Hanser T (2021) Siamese neural networks work for activity cliff prediction. In: Poster presented at the 4th RSC-BMCS / RSC-CICAG Artificial Intelligence in Chemistry Symposium. https://www.researchgate.net/publication/362875964_Siamese_Neural_Networks_Work_for_Activity_Cliff_Prediction
- Dalke et al [2018] Dalke A, Hert J, Kramer C (2018) mmpdb: an open-source matched molecular pair platform for large multiproperty data sets. Journal of Chemical Information and Modeling 58(5):902–910
- Dhami et al [2019] Dhami DS, Kunapuli G, Page D, Natarajan S (2019) Predicting drug-drug interactions from molecular structure images. In: Proceedings of AAAI Fall Symposium on AI for Social Good. https://www.researchgate.net/publication/335870742_Predicting_Drug-Drug_Interactions_from_Molecular_Structure_Images
- Dimova et al [2015] Dimova D, Stumpfe D, Hu Y, Bajorath J (2015) Activity cliff clusters as a source of structure–activity relationship information. Expert Opinion on Drug Discovery 10(5):441–447
- Duvenaud et al [2015] Duvenaud DK, Maclaurin D, Iparraguirre J, Bombarell R, Hirzel T, Aspuru-Guzik A, Adams RP (2015) Convolutional networks on graphs for learning molecular fingerprints. In: Advances in Neural Information Processing Systems, pp 2224–2232
- Fabian et al [2020] Fabian B, Edlich T, Gaspar H, Segler M, Meyers J, Fiscato M, Ahmed M (2020) Molecular representation learning with language models and domain-relevant auxiliary tasks. arXiv:201113230
- Fernández-Llaneza et al [2021] Fernández-Llaneza D, Ulander S, Gogishvili D, Nittinger E, Zhao H, Tyrchan C (2021) Siamese recurrent neural network with a self-attention mechanism for bioactivity prediction. ACS Omega 6(16):11,086–11,094
- Fey and Lenssen [2019] Fey M, Lenssen JE (2019) Fast graph representation learning with PyTorch Geometric. arXiv:190302428
- Gao et al [2018] Gao KY, Fokoue A, Luo H, Iyengar A, Dey S, Zhang P (2018) Interpretable drug-target prediction using deep neural representation. In: Proceedings of International Joint Conference on Artificial Intelligence, vol 2018, pp 3371–3377
- Gilmer et al [2017] Gilmer J, Schoenholz SS, Riley PF, Vinyals O, Dahl GE (2017) Neural message passing for quantum chemistry. In: International Conference on Machine Learning, PMLR, pp 1263–1272
- Golbraikh et al [2014] Golbraikh A, Muratov E, Fourches D, Tropsha A (2014) Data set modelability by QSAR. Journal of Chemical Information and Modeling 54(1):1–4
- Heikamp et al [2012] Heikamp K, Hu X, Yan A, Bajorath J (2012) Prediction of activity cliffs using support vector machines. Journal of Chemical Information and Modeling 52(9):2354–2365
- Hoonakker et al [2011] Hoonakker F, Lachiche N, Varnek A, Wagner A (2011) Condensed graph of reaction: considering a chemical reaction as one single pseudo molecule. Int J Artif Intell Tools 20(2):253–270
- Horvath et al [2016] Horvath D, Marcou G, Varnek A, Kayastha S, de la Vega de León A, Bajorath J (2016) Prediction of activity cliffs using condensed graphs of reaction representations. Journal of Chemical Information and Modeling 56(9):1631–1640
- Hu et al [2019] Hu W, Liu B, Gomes J, Zitnik M, Liang P, Pande V, Leskovec J (2019) Strategies for pre-training graph neural networks. arXiv:190512265
- Hu and Bajorath [2012] Hu Y, Bajorath J (2012) Extending the activity cliff concept: structural categorization of activity cliffs and systematic identification of different types of cliffs in the ChEMBL database. Journal of Chemical Information and Modeling 52(7):1806–1811
- Husby et al [2015] Husby J, Bottegoni G, Kufareva I, Abagyan R, Cavalli A (2015) Structure-based predictions of activity cliffs. Journal of Chemical Information and Modeling 55(5):1062–1076
- Ioffe and Szegedy [2015] Ioffe S, Szegedy C (2015) Batch normalization: accelerating deep network training by reducing internal covariate shift. In: Proceedings of Machine Learning Research, pp 448–456
- Iqbal et al [2021] Iqbal J, Vogt M, Bajorath J (2021) Prediction of activity cliffs on the basis of images using convolutional neural networks. Journal of Computer-Aided Molecular Design 35:1157–1164
- Jauffret et al [1990] Jauffret P, Tonnelier C, Hanser T, Kaufmann G, Wolff R (1990) Machine learning of generic reactions: 2. toward an advanced computer representation of chemical reactions. Tetrahedron Computer Methodology 3(6):335–349
- Jeon et al [2019] Jeon M, Park D, Lee J, Jeon H, Ko M, Kim S, Choi Y, Tan AC, Kang J (2019) ReSimNet: drug response similarity prediction using Siamese neural networks. Bioinformatics 35(24):5249–5256
- Jiang et al [2021] Jiang D, Wu Z, Hsieh CY, Chen G, Liao B, Wang Z, Shen C, Cao D, Wu J, Hou T (2021) Could graph neural networks learn better molecular representation for drug discovery? A comparison study of descriptor-based and graph-based models. Journal of Cheminformatics 13(1):1–23
- Kenny and Sadowski [2005] Kenny PW, Sadowski J (2005) Structure modification in chemical databases. Chemoinformatics in Drug Discovery 23:271–285
- Keyvanpour et al [2021] Keyvanpour MR, Barani Shirzad M, Moradi F (2021) PCAC: a new method for predicting compounds with activity cliff property in QSAR approach. International Journal of Information Technology 13(6):2431–2437
- Kipf and Welling [2016] Kipf TN, Welling M (2016) Semi-supervised classification with graph convolutional networks. arXiv:160902907
- Koch et al [2015] Koch G, Zemel R, Salakhutdinov R (2015) Siamese neural networks for one-shot image recognition. In: ICML deep learning workshop, Lille, vol 2, p 0
- Landrum [2006] Landrum G (2006) RDKit: open-source cheminformatics
- Leadley [2001] Leadley J (2001) Coagulation factor Xa inhibition: biological background and rationale. Current Topics in Medicinal Chemistry 1(2):151–159
- De la Vega de León and Bajorath [2014] De la Vega de León A, Bajorath J (2014) Prediction of compound potency changes in matched molecular pairs using support vector regression. Journal of Chemical Information and Modeling 54(10):2654–2663
- Liu et al [2007] Liu T, Lin Y, Wen X, Jorissen RN, Gilson MK (2007) BindingDB: a web-accessible database of experimentally determined protein-ligand binding affinities. Nucleic Acids Research 35:D198–D201
- Loshchilov and Hutter [2017] Loshchilov I, Hutter F (2017) Decoupled weight decay regularization. arXiv:171105101
- Maggiora [2006] Maggiora GM (2006) On outliers and activity cliffs: why QSAR often disappoints. Journal of Chemical Information and Modeling 46(4):1535–1535
- Mayr et al [2018] Mayr A, Klambauer G, Unterthiner T, Steijaert M, Wegner JK, Ceulemans H, Clevert DA, Hochreiter S (2018) Large-scale comparison of machine learning methods for drug target prediction on ChEMBL. Chemical Science 9(24):5441–5451
- Medina-Franco [2013] Medina-Franco JL (2013) Activity cliffs: facts or artifacts? Chemical Biology & Drug Design 81(5):553–556
- Menke and Koch [2021] Menke J, Koch O (2021) Using domain-specific fingerprints generated through neural networks to enhance ligand-based virtual screening. Journal of Chemical Information and Modeling 61(2):664–675
- Namasivayam and Bajorath [2012] Namasivayam V, Bajorath J (2012) Searching for coordinated activity cliffs using particle swarm optimization. Journal of Chemical Information and Modeling 52(4):927–934
- Namasivayam et al [2013] Namasivayam V, Iyer P, Bajorath J (2013) Prediction of individual compounds forming activity cliffs using emerging chemical patterns. Journal of Chemical Information and Modeling 53(12):3131–3139
- Nourani et al [????] Nourani E, Asgari E, McHardy AC, Mofrad MR (????) TripletProt: deep representation learning of proteins based on Siamese networks
- Park et al [2022] Park J, Sung G, Lee S, Kang S, Park C (2022) ACGCN: graph convolutional networks for activity cliff prediction between matched molecular pairs. Journal of Chemical Information and Modeling 62(10):2341–2351. https://doi.org/10.1021/acs.jcim.2c00327
- Paszke et al [2019] Paszke A, Gross S, Massa F, Lerer A, Bradbury J, Chanan G, Killeen T, Lin Z, Gimelshein N, Antiga L, Desmaison A, Kopf A, Yang E, DeVito Z, Raison M, Tejani A, Chilamkurthy S, Steiner B, Fang L, Bai J, Chintala S (2019) PyTorch: an imperative style, high-performance deep learning library. In: Wallach H, Larochelle H, Beygelzimer A, d'Alché-Buc F, Fox E, Garnett R (eds) Advances in Neural Information Processing Systems, Curran Associates, Inc., vol 32. https://proceedings.neurips.cc/paper/2019/file/bdbca288fee7f92f2bfa9f7012727740-Paper.pdf
- Pedregosa et al [2011] Pedregosa F, Varoquaux G, Gramfort A, Michel V, Thirion B, Grisel O, Blondel M, Prettenhofer P, Weiss R, Dubourg V, et al (2011) Scikit-learn: machine learning in Python. Journal of Machine Learning Research 12:2825–2830
- Pérez-Benito et al [2019] Pérez-Benito L, Casajuana-Martin N, Jiménez-Rosés M, van Vlijmen H, Tresadern G (2019) Predicting activity cliffs with free-energy perturbation. Journal of Chemical Theory and Computation 15(3):1884–1895
- Roberts et al [2019] Roberts N, Purushothama PS, Vasudevan VT, Ravichandran S, Zhang C, Gerwick WH, Cottrell GW (2019) Using deep Siamese neural networks to speed up natural products research. In: ICLR 2019 Conference Blind Submission. https://openreview.net/forum?id=B1ggosR9Ym
- Rogers and Hahn [2010] Rogers D, Hahn M (2010) Extended-connectivity fingerprints. Journal of Chemical Information and Modeling 50(5):742–754
- Sabando et al [2021] Sabando MV, Ponzoni I, Milios EE, Soto AJ (2021) Using molecular embeddings in QSAR modeling: does it make a difference? arXiv:210402604
- Schwarz et al [2020] Schwarz K, Allam A, Gonzalez NAP, Krauthammer M (2020) AttentionDDI: Siamese attention-based deep learning method for drug-drug interaction predictions. arXiv:201213248
- Seeman [1987] Seeman P (1987) Dopamine receptors and the dopamine hypothesis of schizophrenia. Synapse 1(2):133–152
- Sheridan et al [2020] Sheridan RP, Karnachi P, Tudor M, Xu Y, Liaw A, Shah F, Cheng AC, Joshi E, Glick M, Alvarez J (2020) Experimental error, kurtosis, activity cliffs, and methodology: what limits the predictivity of quantitative structure–activity relationship models. Journal of Chemical Information and Modeling 60(4):1969–1982
- Silipo and Vittoria [1991] Silipo C, Vittoria A (1991) QSAR, rational approaches to the design of bioactive compounds. In: Proceedings of European Symposium on Quantitative Structure-Activity Relationships, Distributors for the US and Canada, Elsevier Science
- Srivastava et al [2014] Srivastava N, Hinton G, Krizhevsky A, Sutskever I, Salakhutdinov R (2014) Dropout: a simple way to prevent neural networks from overfitting. The Journal of Machine Learning Research 15(1):1929–1958
- Stepišnik et al [2021] Stepišnik T, Škrlj B, Wicker J, Kocev D (2021) A comprehensive comparison of molecular feature representations for use in predictive modeling. Computers in Biology and Medicine 130:104,197
- Stumpfe et al [2014] Stumpfe D, Hu Y, Dimova D, Bajorath J (2014) Recent progress in understanding activity cliffs and their utility in medicinal chemistry: miniperspective. Journal of Medicinal Chemistry 57(1):18–28
- Stumpfe et al [2019] Stumpfe D, Hu H, Bajorath J (2019) Evolving concept of activity cliffs. ACS Omega 4(11):14,360–14,368
- Stumpfe et al [2020] Stumpfe D, Hu H, Bajorath J (2020) Advances in exploring activity cliffs. Journal of Computer-Aided Molecular Design 34(9):929–942
- Taigman et al [2014] Taigman Y, Yang M, Ranzato M, Wolf L (2014) Deepface: closing the gap to human-level performance in face verification. In: Proceedings of the IEEE Conference on Computer Vision and Pattern Recognition, pp 1701–1708
- Tamura et al [2020] Tamura S, Miyao T, Funatsu K (2020) Ligand-based activity cliff prediction models with applicability domain. Molecular Informatics 39(12):2000,103
- Todeschini and Consonni [2008] Todeschini R, Consonni V (2008) Handbook of Molecular Descriptors. John Wiley & Sons
- Torres et al [2020] Torres L, Monteiro N, Oliveira J, Arrais J, Ribeiro B (2020) Exploring a Siamese neural network architecture for one-shot drug discovery. In: Proceedings of 20th International Conference on Bioinformatics and Bioengineering (BIBE), pp 168–175
- Ullrich and Nitsche [2020] Ullrich S, Nitsche C (2020) The SARS-CoV-2 main protease as drug target. Bioorganic & Medicinal Chemistry Letters 30(17):127,377
- Van Tilborg et al [2022] Van Tilborg D, Alenicheva A, Grisoni F (2022) Exposing the limitations of molecular machine learning with activity cliffs. ChemRxiv. https://chemrxiv.org/engage/chemrxiv/article-details/623de3fbab0051148698fbcf
- Veličković et al [2017] Veličković P, Cucurull G, Casanova A, Romero A, Lio P, Bengio Y (2017) Graph attention networks. arXiv:171010903
- Vogt et al [2011] Vogt M, Huang Y, Bajorath J (2011) From activity cliffs to activity ridges: informative data structures for SAR analysis. Journal of Chemical Information and Modeling 51(8):1848–1856
- Wang et al [2021] Wang Y, Wang J, Cao Z, Farimani AB (2021) MolCLR: molecular contrastive learning of representations via graph neural networks. arXiv:210210056
- Winkler and Le [2017] Winkler DA, Le TC (2017) Performance of deep and shallow neural networks, the universal approximation theorem, activity cliffs, and QSAR. Molecular Informatics 36(1-2):1600,118
- Winter et al [2019] Winter R, Montanari F, Noé F, Clevert DA (2019) Learning continuous and data-driven molecular descriptors by translating equivalent chemical representations. Chemical Science 10(6):1692–1701
- Xu et al [2018] Xu K, Hu W, Leskovec J, Jegelka S (2018) How powerful are graph neural networks? arXiv:181000826
- Zhong et al [2019] Zhong Y, Chen X, Zhao Y, Chen X, Gao T, Weng Z (2019) Graph-augmented convolutional networks on drug-drug interactions prediction. arXiv:191203702