Effects of turbulent diffusion and back-reaction on the dust distribution around two resonant planets
Abstract
In evolved and dusty circumstellar discs, two planets with masses comparable to Jupiter and Saturn that migrate outwards while maintaining an orbital resonance can produce distinctive features in the dust distribution. Dust accumulates at the outer edge of the common gas gap, which behaves as a dust trap, where the local dust concentration is significantly enhanced by the planets’ outward motion. Concurrently, an expanding cavity forms in the dust distribution inside the planets’ orbits, because dust does not filter through the common gaseous gap and grain depletion in the region continues via inward drifting. There is no cavity in the gas distribution because gas can filter through the gap, although ongoing gas accretion on the planets can reduce the gas density in the inner disc. Such behaviour was demonstrated by means of simulations neglecting the effects of dust diffusion due to turbulence and of dust backreaction on the gas. Both effects may alter the formation of the dust peak at the gap outer edge and of the inner dust cavity, by letting grains filter through the dust trap. We performed high resolution hydrodynamical simulations of the coupled evolution of gas and dust species, the latter treated as pressureless fluids, in the presence of two giant planets. We show that diffusion and backreaction can change some morphological aspects of the dust distribution but do not alter some main features, such as the outer peak and the expanding inner cavity. These findings are confirmed for different parametrizations of gas viscosity.
keywords:
accretion, accretion discs — methods: numerical — planets and satellites: gaseous planets — planet–disc interactions1 Introduction
In a recent study, Marzari et al. (2019) examined the distribution of dust particles around two resonant planets embedded in a circumstellar disc. The two planets, with masses comparable to those of Jupiter and Saturn, had orbits in a resonant configuration, with ratios of the mean motion equal to either 2:1 or 3:2. Because of the type of resonance and of the applied disc conditions, the planets tend to migrate outwards and dust particles tend to accumulate outside of the orbit of the exterior planet. Concurrently, the inward migration of dust grains that move inside of the orbit of the interior planet leads to an enlargement of the dust gap compared to the gap in the gas and to a dynamical decoupling between the gaps in the gas and dust distributions. The build-up of the dust density at the outer edge of the gap surrounding the planets is markedly higher in the case of the 2:1 mean-motion resonance and may appear as a bright ring (at appropriate wavelengths) in resolved observations of discs. A similar phenomenon was also found for lower-mass planets (in the Super-Earth mass range, Marzari & D’Angelo, 2020), although less pronounced. All those simulations were performed without including the effects of possible dust diffusion due to gas turbulence and of dust back-reaction on the gas. Here we explore the consequences of these two mechanism on the accumulation of dust grains at the outer edge of the gap and on the formation of a wider gap in the dust distribution compared to the density gap in the gas. This latter feature may lead to the formation of a transition disc, if the planets are close enough to the star (low gas surface density inside the planets’ orbits can be caused by ongoing accretion of gas on star and planets).
Circumstellar discs are likely turbulent (e.g., Hughes et al., 2011). Various mechanisms have been proposed as drivers of turbulence, such as convective instability (e.g., Klahr & Hubbard, 2014; Lyra, 2014), vertical shear instability (e.g., Urpin, 2003; Nelson et al., 2013; Stoll et al., 2017), and magneto-rotational instability (e.g., Balbus & Hawley, 1991, 1998, 2003). Gas turbulence may force dust grains to diffuse (over a length-scale dictated by the type of turbulence), a process that not only may affect dust accumulation but can also hinder the efficiency of dust entrapment at radial location of gas pressure maxima. In fact, according to Sierra et al. (2019) and Pinilla et al. (2020), dust diffusion may reduce, or even prevent, significant concentrations of grains at locations of gas “bumps”, since the grains can disperse out of the region. This process might affect the conclusions of our previous results on the accumulation of dust at the outer edge of the gaseous gap of two planets in resonance by letting dust seep through the gap and reach the inner disc regions. If the effect is large enough, the concentration of dust at those radial locations, obtained in the numerical simulations by Marzari et al. (2019) and Marzari & D’Angelo (2020), may be severely depleted or even largely absent.
In addition to dust diffusion, the back-reaction of dust on gas can also impact the formation of grain concentration at a local pressure maximum. According to Taki et al. (2016), dust back-reaction can deform the pressure gradient of the gas when high-enough values of the dust-to-gas mass ratio are reached. This may be the case of the dust concentration attained at the outer edge of gaseous gaps, observed in the simulations of two planets in resonance migrating away from the star.
To test the relevance of these two mechanisms, diffusion and back-reaction, on the formation of dust over-dense regions caused by the outward migration of two planets in resonance, we performed simulations of the evolution of two planets in resonance in which both these two mechanisms are taken into account. In Section 2, we describe the numerical model exploited to study the coupled evolution of dust and gas in presence of the two resonant planets. In Section 3, we outline the dust behaviour when the planets evolve in the 3:2 mean-motion resonance whereas, in Section 4, we analyse the case of the 2:1 mean-motion resonance. In Section 5, we test the robustness of our results by changing the viscosity parameterization, including a constant kinematic viscosity the one that applies a constant value of the parameter. Finally, in Section 6, we discuss our results.
2 Methods and Algorithms
In past work on the coupled evolution of dust and gas in protoplanetary discs, we adopted a Lagrangian description of the solid component. Instead, an Eulerian formalism is applied in the present study, since solids are treated as pressureless fluids. Some details on the involved equations are provided below to highlight the differences between the two approaches. Marzari et al. (2019) and Marzari & D’Angelo (2020) used the two-dimensional (2D) FARGO hydrodynamics code (Masset, 2000), modified to include the dynamical evolution of dust particles embedded in the gaseous disc in a Lagrangian fashion (Picogna & Kley, 2015; Picogna et al., 2018).
The drag force on the particles was computed from the local gas density according to the equation (Woitke & Helling, 2003)
| (1) |
where is the Epstein drag contribution, given by
| (2) |
and is the Stokes drag component, given by
| (3) |
In the above equations, is the gas density, is the radius of the particle, is the local thermal velocity of the gas and is the velocity of the dust particle relative to the gas. The quantity is the Knudsen number and is the Mach number (computed from the particle’s relative velocity ). Quantity is the drag coefficient for the Stokes regime.
In this paper, to test the relevance of diffusion and back-reaction on the formation of dust over-dense regions caused by the outward migration of two planets in resonance, we carry out simulations with the code FARGO3D (Benítez-Llambay et al., 2019). In this version of the code, the dust particles are treated as additional pressureless fluids where momentum is transferred between the gas and each of the dust species (but not among dust species). The dust fluid is affected by Epstein drag, which imparts a force per unit volume to a dust species given by
| (4) |
where is the dust density, is the Stokes number of the particle and is the Keplerian frequency of the gas. An equal and opposite force is imparted to the gas. Note that, in Equation (4), information regarding the drag coefficient are incorporated into .
A term is added to the continuity equation to model the diffusion of the dust species within the gas (Morfill & Voelk, 1984)
| (5) |
where and is the density of individual dust species. Equation (5) is only applied to the pressureless fluids and it assumes the same diffusion coefficient for all dust species, which is taken equal to the value of the gas kinematic viscosity (Brauer et al., 2008)
| (6) |
The effects of this choice are not tested.
The original version of the code applies Stokes numbers, , in Equation (4) that are constants. The code was modified so that we can select each pressureless fluid (dust species) not according to a Stokes number, which varies as a function of the local properties of the gas (density, temperature and velocity), but rather according to the particle size.
3 Dust distribution near planets in the 3:2 resonance
We first investigate the case of a pair of planets that become captured in the 3:2 mean-motion resonance and migrate outward thereafter. The interior planet has the mass of Jupiter whereas the exterior planet has the mass of Saturn. A more massive inner planet is a condition conducive to outward migration. The planets orbit in a cold, local-isothermal disc with a fixed aspect ratio . (Calculations with a larger ratio, , are also presented.)
The disc extends from to and is discretised over a grid of area elements (in the radius and azimuth, respectively). The initial surface density of the gas declines as
| (7) |
where is the density at the reference radius .
Three different populations of icy grains (bulk density ) are included in the simulations, whose sizes are , and . For the applied disc conditions, these particles have Stokes numbers less than .
The initial dust-to-gas mass ratio for each of the three dust species is , so that the overall dust-to-gas mass ratio adds up to , which is a typical value adopted for circumstellar discs and is based on values found in the interstellar medium. However, dust needs not be primordial in origin, that is, part of the inventory of solids from which the planets formed. In fact, the dust populations may represent, or contain, second generation dust produced by collisions among leftover planetesimals, after the planets became massive enough (Turrini et al., 2019; D’Angelo & Marzari, 2022; Marta Bernabò et al., 2022). The equations describing the evolution of the system are solved in a non-inertial reference frame centered on the star, including the indirect terms arising from the planets’ and disc’s gravity.
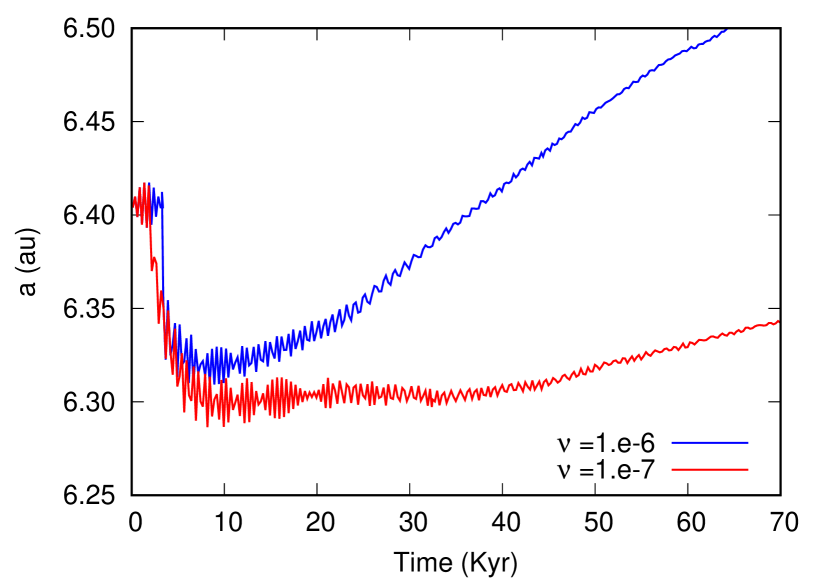
Various values of the gas kinematic viscosity, , are considered because this parameter affects the tidal interactions between the planets and the gas, and also determines the amount of dust diffusion through Equation (6). Additionally, it can also affect the speed of the planets’ outward migration. In these models, we adopt a constant value of kinematic viscosity. The impact of on the efficiency of the outward migration is illustrated in Figure 1, for a given value of the initial gas density at the reference radius . In these models, the planets start to migrate at the beginning of the simulations, when the distributions of gas and dust are unperturbed (hence the initial rapid inward migration of the planets). As the outer planet approaches the inner planet and their orbits become caught in resonance, the tidal perturbations exerted by the outer planet on the circumstellar material alter the torque balance on the inner planet. Consequently, the inner planet first slows down and then migrates away from the star, pushing the outer planet outward through the resonance forcing.
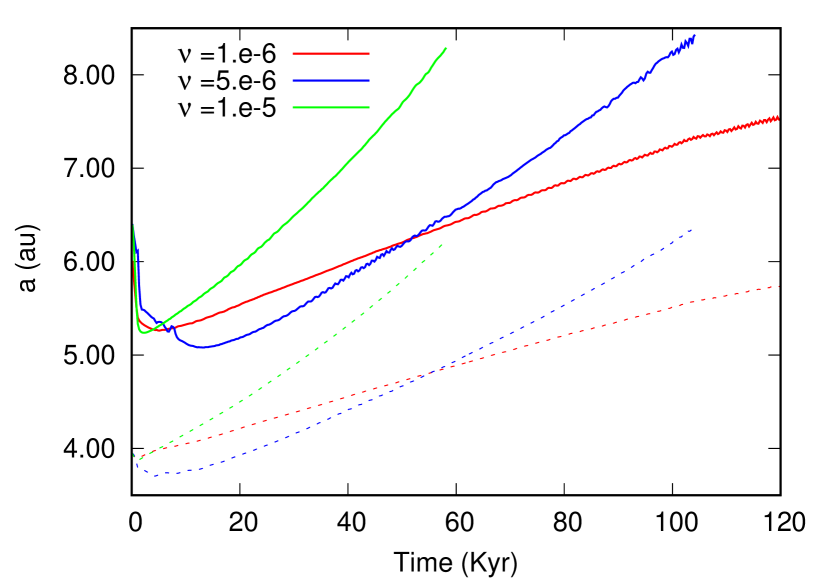
The evolution of the semi-major axis of the outer planet, , is shown for three different values of the gas kinematic viscosity: , , and in units of ( is the Keplerian frequency at ). Note that a constant kinematic viscosity corresponds to a variable parameter, . With our choice of parameters, at , said values of would correspond to , , and , respectively. However, in the disc regions where the planets orbit, would be smaller by a factor of or more.
After a different behaviour at the beginning of the evolution, prior to or shortly after the capture into the 3:2 orbital resonance (see Figure 1), the planets undergo sustained outward migration locked in mean-motion resonance. The migration speed of the pair is related to and determined by the shape of the common (or overlapping) gaseous gap of the two planets. A similar outcome is obtained for the cases involving the 2:1 resonance, as shown in the next section. Notice that the outer planet is subject to a negative torque exerted by the disc material exterior to its orbit, hence it would tend to move inward, whereas the resonance forcing pushes it outward. These two opposing torques allow the resonance to be maintained during the outward migration of the pair.
In the calculations presented herein, all disc material exerts torques on the planets, including material within the planets’ Hill spheres. Since the numerical resolution is limited and density variations close to the planets may not be properly resolved, some spurious effects may arise that affect outward migration. To quantify possible differences, one model was also performed by removing the torques exerted from within the planets’ Hill spheres. The orbital evolution is comparable to that of the calculation with default setup, although at a somewhat reduced outward migration speed. The amount of kinematic viscosity can also alter the local distribution of material around the planets and unresolved density gradients can possibly impact the resulting migration velocity. Nonetheless, it must be pointed out that for the purposes of this study the details of the outward migration process are not important, henceforth tests on the response of the system to numerical parameters are unnecessary. The only requirement is that the planet pair becomes locked in resonance and moves away from the star for a prolonged amount of time.
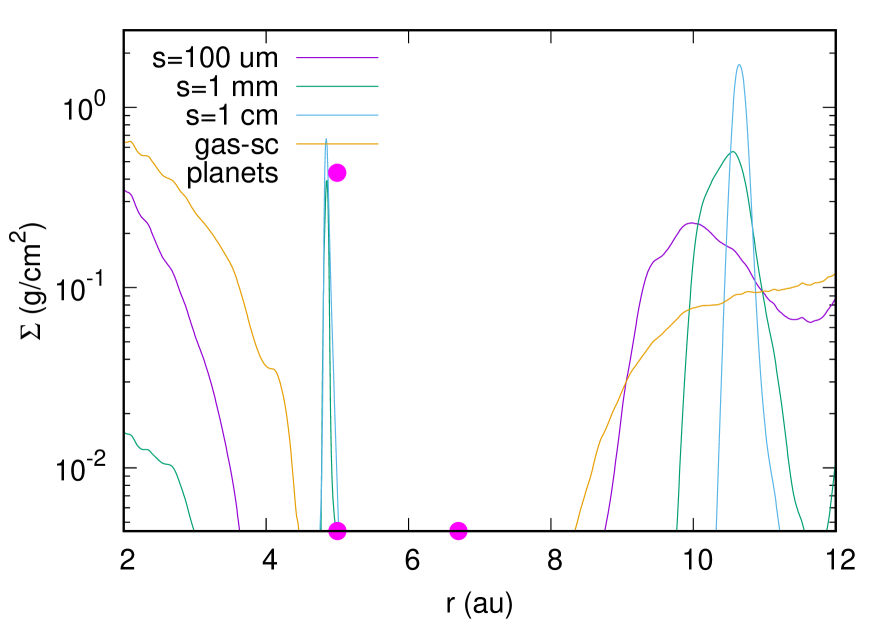
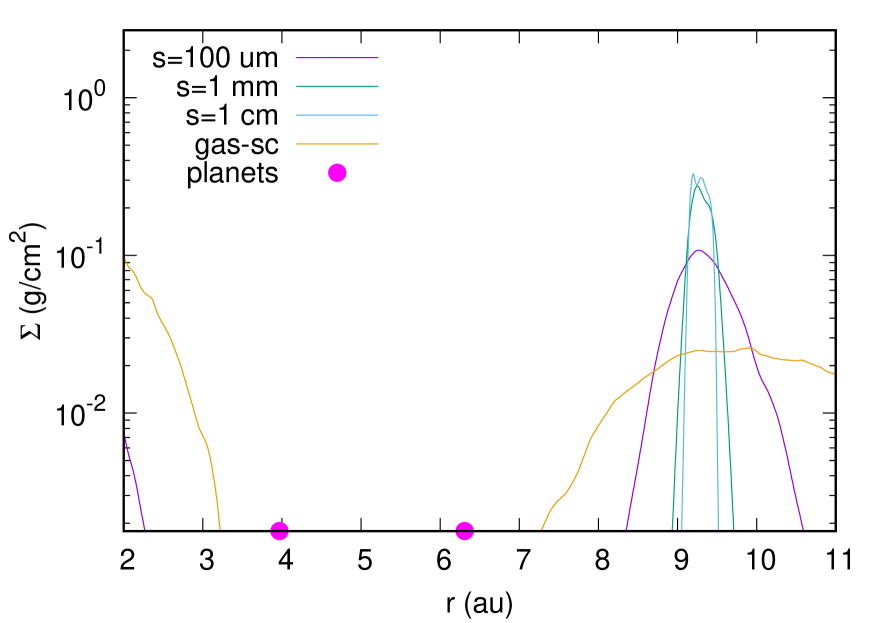
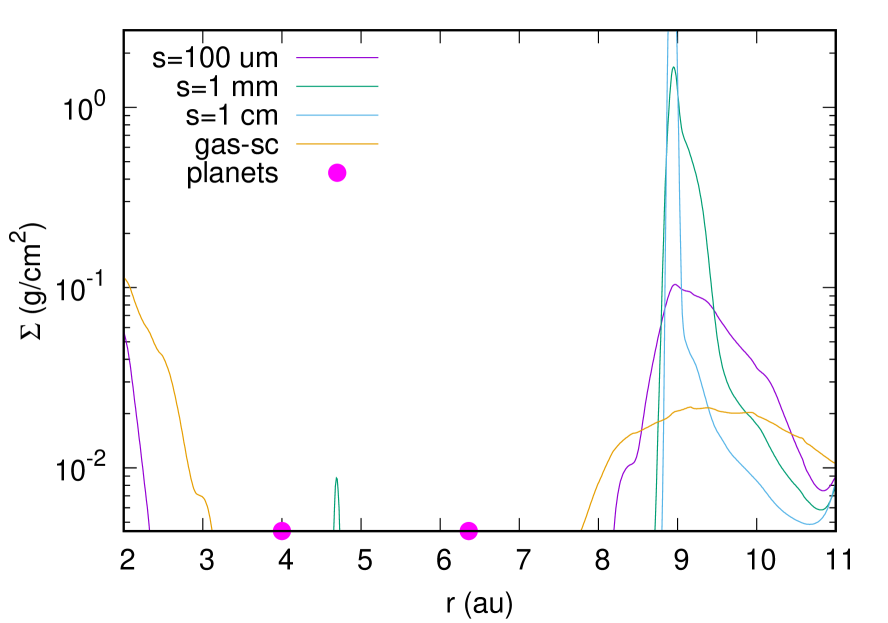
When the outer planet reaches au from the star, we compare the dust distributions in the three cases with different viscosity. This comparison is shown in Figure 2. The dust density profiles show a peak at the outer border of the gas gap carved by the planets’ tidal perturbations. This peak is more marked in the distributions of the largest grains, which are less coupled to the gas (i.e., they have a larger Stokes number and therefore a longer coupling timescale). Dust-to-gas mass ratios at the peak location range from to , increasing as decreases. In the region inside the inner edge of the gap there is a significant depletion of dust due to drifting motion towards the star. Re-supply of dust to this region is reduced, or halted, by the dust trap at the outer edge of the gas gap. After some time, the disc would appear as a transition disc with an inner cavity in the dust density, which expands outward over time due to the outward migration of the planets. These effects appear more evident at lower gas viscosity, which may be due to the lower level of diffusion but it may also be related to the different migration velocity of the planet pair (see Figure 1), as discussed below. Beyond au the disc is depleted of mm- and cm-grains (but not of the smallest grains), an effect associated to the inward drift of the particles via gas drag (which does not affect as much the smallest grains). This is a boundary effect related to the fact that particles are not flowing inward from greater distances (i.e., there is not re-supply of solids at the outer boundary). Test simulations not reported here confirm this issue.
The accumulation efficiency of particles at the outer edge of the gas gap depends on the stopping time of the particles () and the timescale over which the radial pressure gradient of the gas moves (in our case, due to planet migration). For a given stopping time, the shorter the outward migration timescale, the less time dust grains have to accumulate. Stated differently, for a similar orbital configuration of the planets, i.e., similar orbital frequencies , a more rapid outward migration can facilitate the filtering process of dust toward the star. The overall outcome is a less depleted inner disc in the cases with more vigorous outward migration.
For the same reason, the different migration speed also controls the build up of the dust at the outer edge of the gas gap. As a consequence, the reduction in the peak density at the outer edge of the gap observed at higher viscosity values, shown in Figure 2, is likely due to the combination of the two effects: a higher diffusion rate and a decrease in the trapping efficiency of dust grains caused by the faster outward migration rate of the planets.
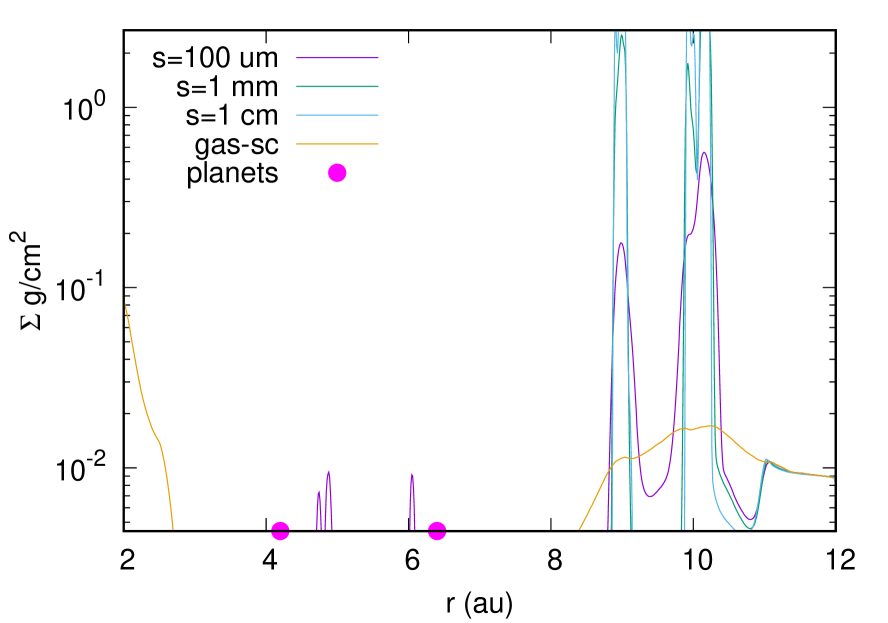
To better characterize the role of diffusion and back-reaction in the formation, size and shape of the outer peak in dust density, we ran a simulation in which both these two processes were neglected, adopting a kinematic viscosity (see Figure 3). In this model, the migration speed is broadly consistent with that of the model illustrated in the bottom panel of Figure 2, but the peak in the dust density distributions of the largest particles tend to be higher and sharper compared to corresponding one in the the bottom panel of Figure 2. The implication is that diffusion is indeed affecting the concentration of the dust by spreading large grains over a broader radial region. Nonetheless, the reduced efficiency in collecting dust caused by diffusion is not strong enough to prevent the formation of a prominent density peak outside the planets’ orbits, which may be detected by high resolution observations.
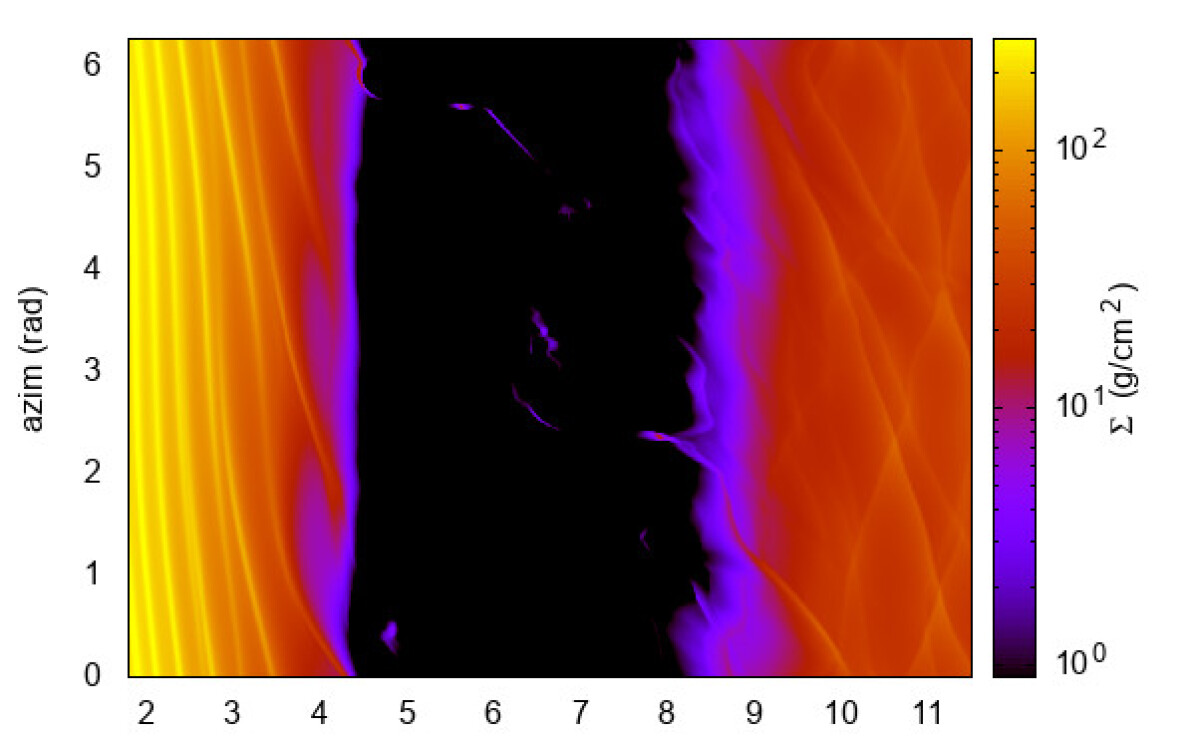
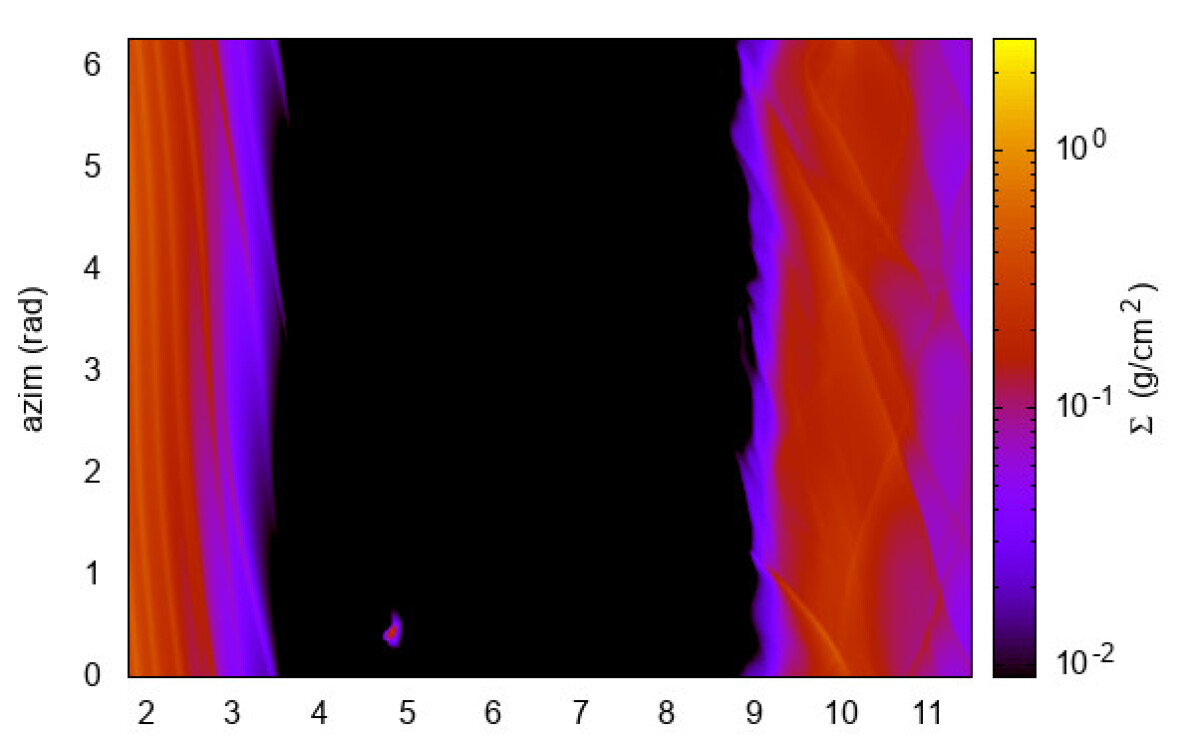
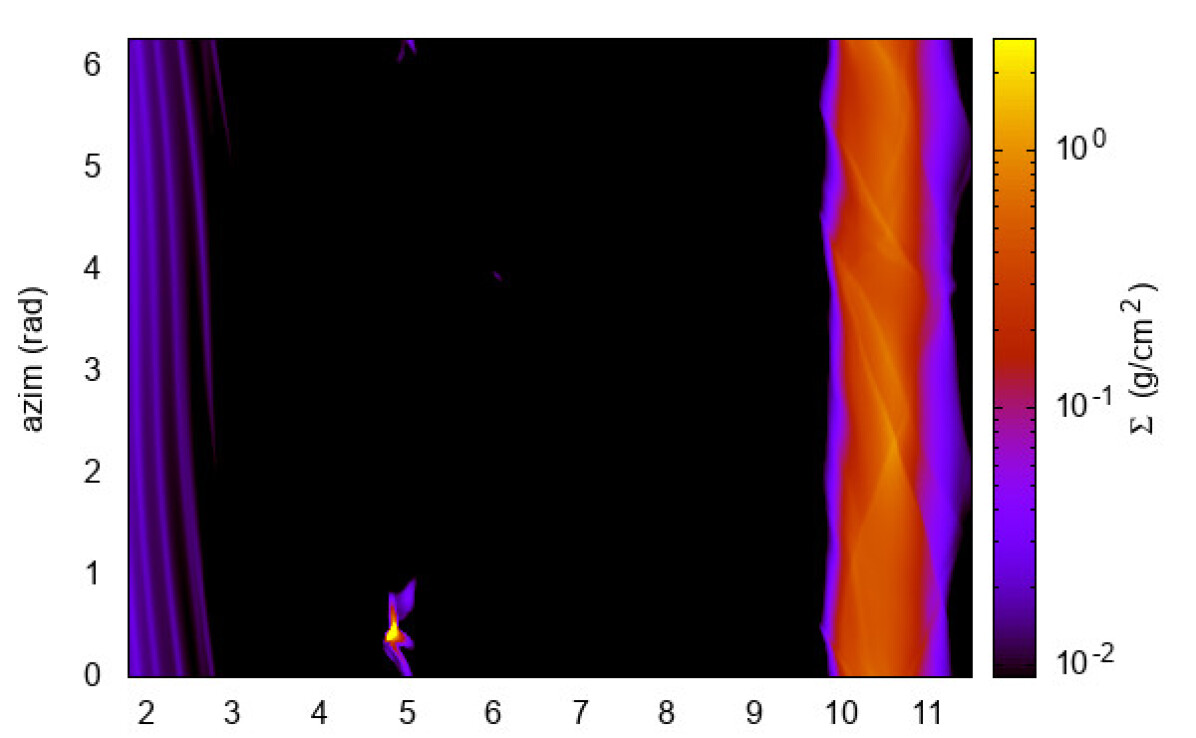
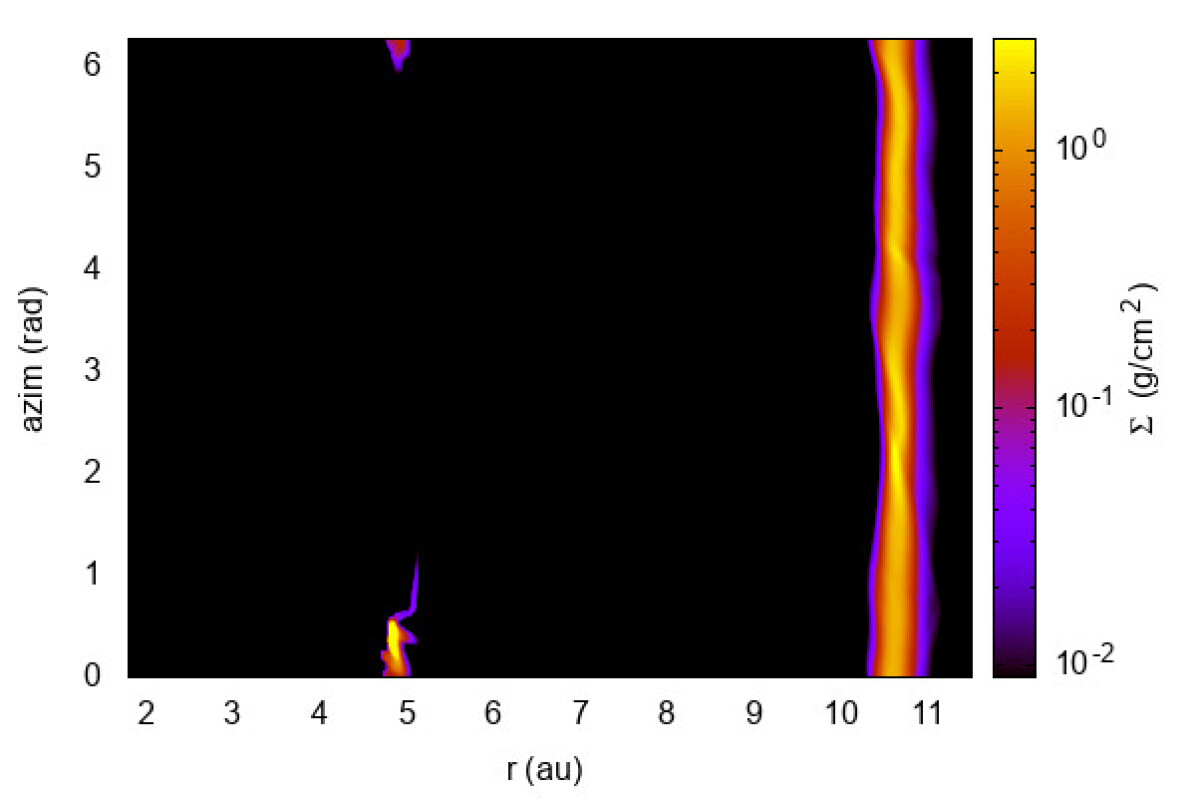
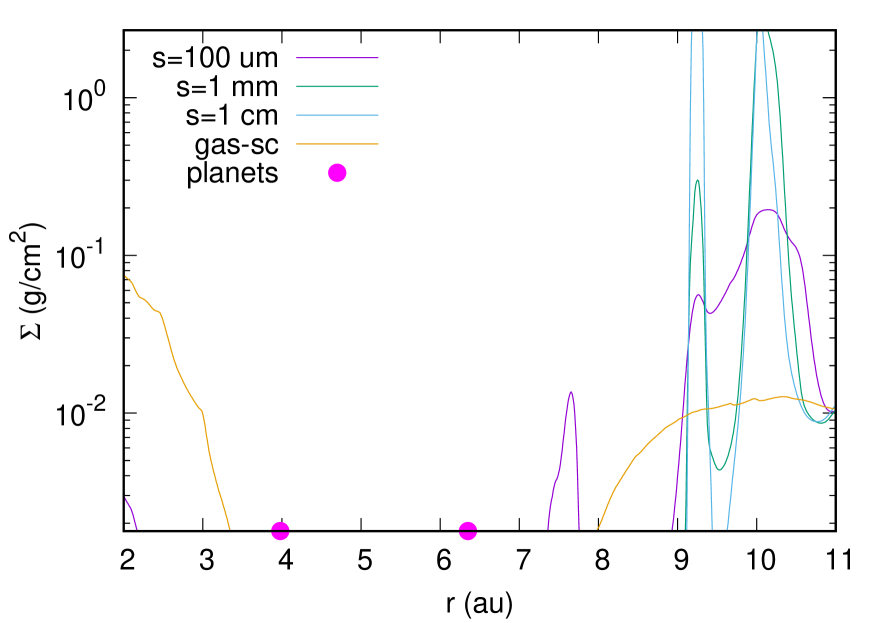
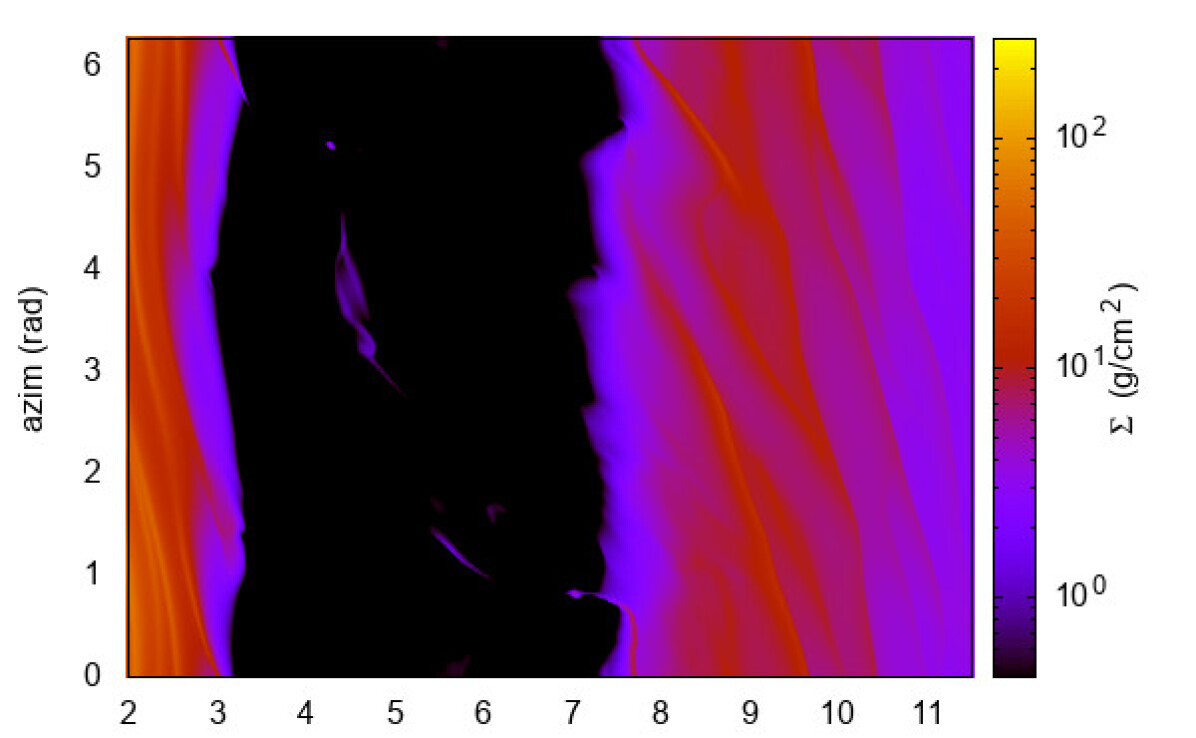
In Figure 4 we plot the surface density distribution of the gas and of dust grains of different sizes for the case with lowest viscosity, . The gas gap is significantly narrower than that of the dust and the width of the latter is larger for larger grain size. For cm size dust grains, the density distribution is confined in an over-dense ring at the outer edge of the gas gap. Therefore, according to these results, dust diffusion and back-reaction are not able to prevent the formation of narrow rings in the dust distribution at the outer edge of the gas gap. In our simulations there is no re-supply of dust at the outer boundary of the simulated disc, but it is expected that a continuous distribution of solids beyond the grid boundary would supply dust to the inner disc regions. In this case, at the outer edge of the gap, we would observe an enhanced density, as predicted by our simulations. Beyond this density peak, however, there would be a continuous distribution of dust originating from more distant regions. Over timescales much longer than those simulated here, dust drifting from larger distances may also affect the density peaks at the outer edge of the gas gap. In fact, an additional simulation with a wider radial boundary (not reported here) does show enhanced peaks in large grains, due to solids drifting from farther distances. Also the population of small grains would increase at the peaks over longer times, but at a slower rate, dictated by the drift velocity. Nonetheless, the depletion of dust within the inner edge of the gas gap would not be affected by this process because the outer dust trap appears to be efficient enough to halt (or severely impede) refilling of grains. In fact, if refilling of the inner disc was sustained, it would occur within the time of our simulations but it is not observed.
Continued supply of dust from farther out in the disc may, at some point, raise the density in the peak regions beyond some threshold value to make the peaks unstable. For example, the dust-to-gas mass ratio may become large enough to induce a back-reaction response on the gas that redistributes the particles over some radial region via collisions and/or enhanced dust coagulation may ensue (coagulation into larger particles would reduce the back-reaction force exerted on the gas, because of the lower surface-to-mass ratio). The back-reaction response may also smooth out the gas density gradient in the radial direction, altering the radial pressure gradient and reducing its ability to retain grains. Such processes are not considered in this study.
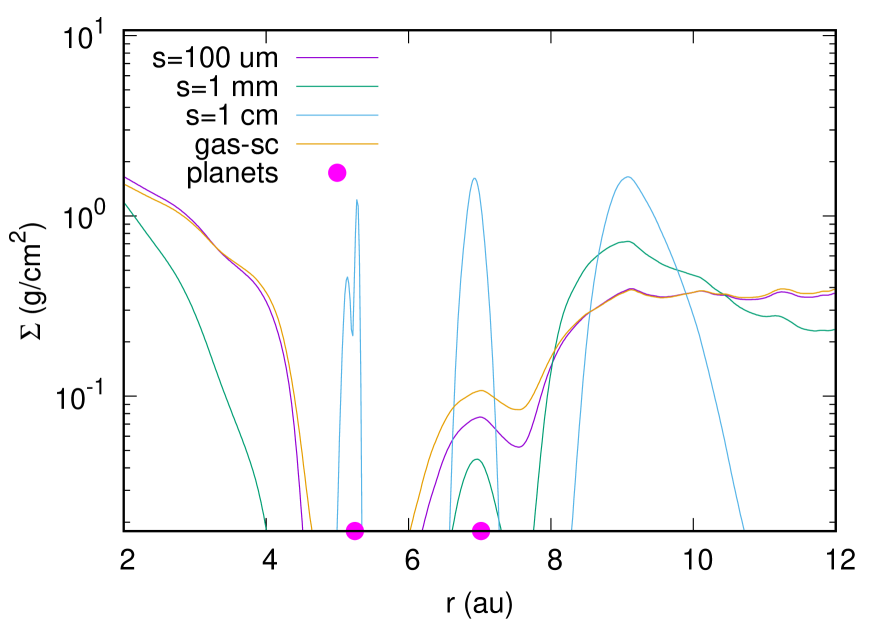
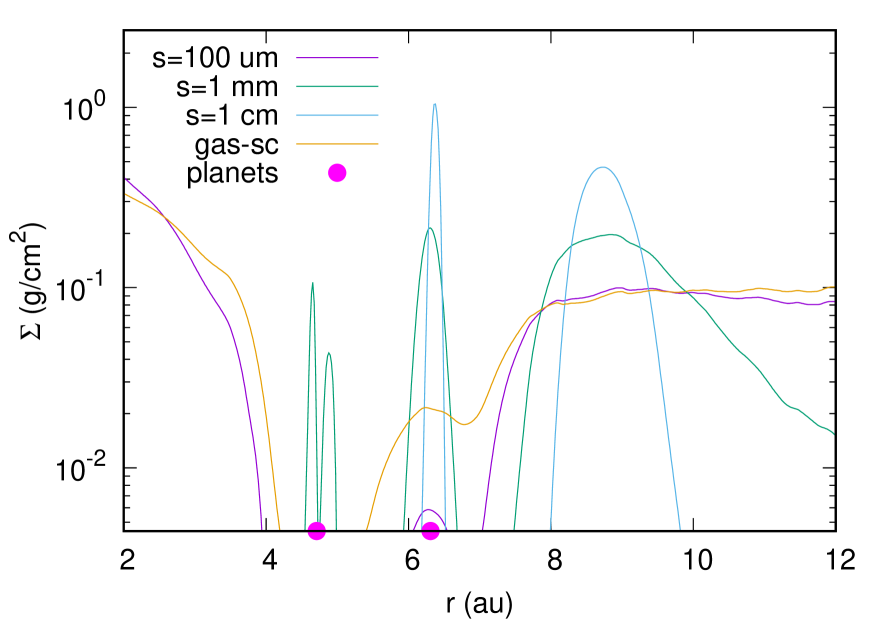
To test the impact of a larger aspect ratio (i.e., warmer disc) on the formation of the inner dust cavity and of the peak external to the gas gap, we performed two additional simulations adopting . In the first model we used a higher gas surface density (), in order to increase the speed of planet, migration while in the second we used the same density as in the previous cases (). In the latter simulation, since the rate of outward migration is smaller, the planets are located closer to the star in the plot. In the top panel of Figure 5, the density profiles are shown for the different grain sizes in the high density case. The bottom panel illustrates those profiles for the low density case. In both simulations the density patterns are similar to those in Figure 2, suggesting that a higher aspect ratio does not impair the ability of two planets in resonance to carve an inner gap in the distribution of the larger grains and to trap dust at the gap’s outer edge (dust-to-gas mass ratios around the peak region are –). Thus, dust filtering through the outer edge of the gas gap is not increased by the different morphology of the dust trap in these warmer discs.
4 Dust distribution near planets in the 2:1 resonance
To test the evolution of the dust when the planets are captured in a 2:1 mean-motion resonance, we decreased the gas density to in order to induce orbital locking in this resonance. It is known that capture in this mean-motion resonance is a more delicate process than capture in the 3:2 resonance. If the relative migration velocity with which the pair of planets approach each other is above a certain threshold, the resonance forcing is overcome and convergent migration continues. Additionally, once the 2:1 orbital resonance is established, migration of the two planets typically proceeds inward because of the way the two gas gaps overlap. In this configuration, outward migration may be obtained by choosing an appropriately low kinematic viscosity so that a wide, common gaseous gap forms around the orbits of the two planets.
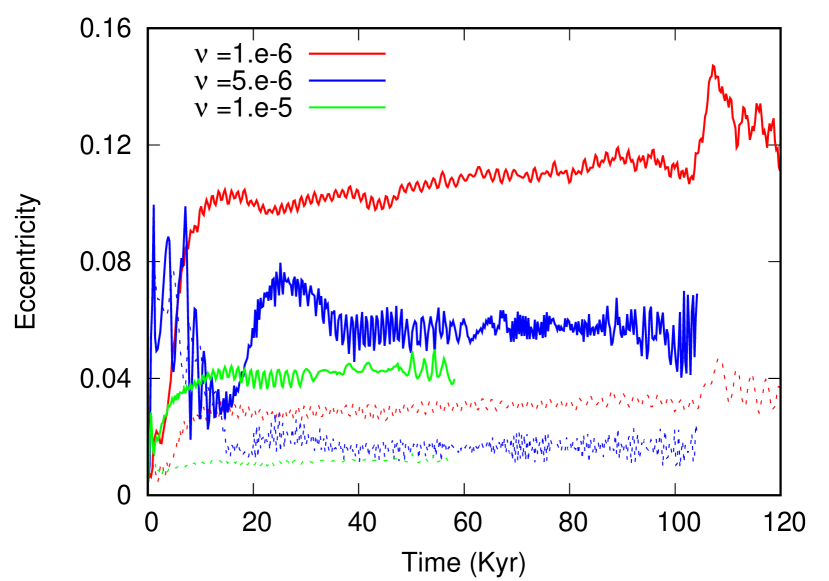
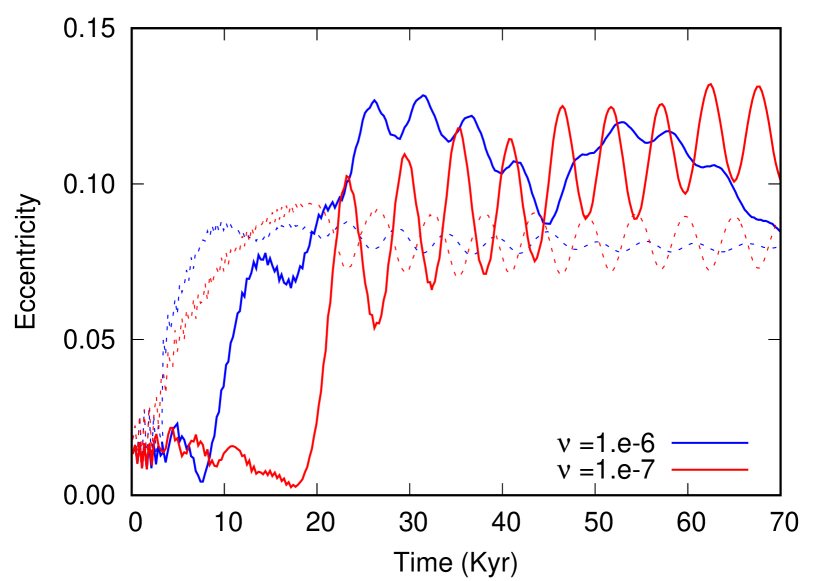
As in the the models of the previous section, the planets start to migrate in unperturbed distributions of gas and therefore the initial inward migration of the planets is artificially rapid. This choice affects the radius at which the planets are trapped in resonance but is otherwise not much relevant for the purposes of this study. As for the models discussed in Section 3, the model with a larger value of the kinematic viscosity results in a more vigorous outward migration of the planets once they become trapped in resonance. This is illustrated in Figure 6 for cases with and ( and , respectively) . Note, however, that the orbits also become significantly eccentric, which also affects outward migration (D’Angelo et al., 2006). We also tested a larger value, , but the outer planet crosses the 2:1 resonance with the inner planet. The pair is temporarily trapped in the 5:3 resonance at which point it begins migrating outwards. That resonance is then broken and the pair becomes finally captured in the 3:2 resonance, continuing to migrate outward. For even higher values of the kinematic viscosity, there is no trapping in the 2:1 resonance, which might be attained by further reducing . However, this possibility was not tested since it could lead to initial dust-to-gas mass ratios too dissimilar from the other simulations presented herein.
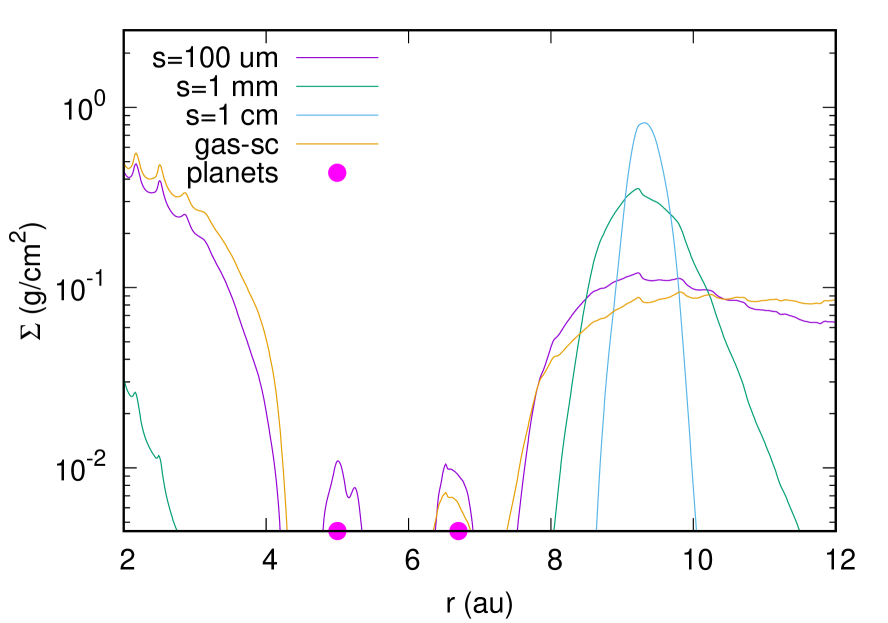
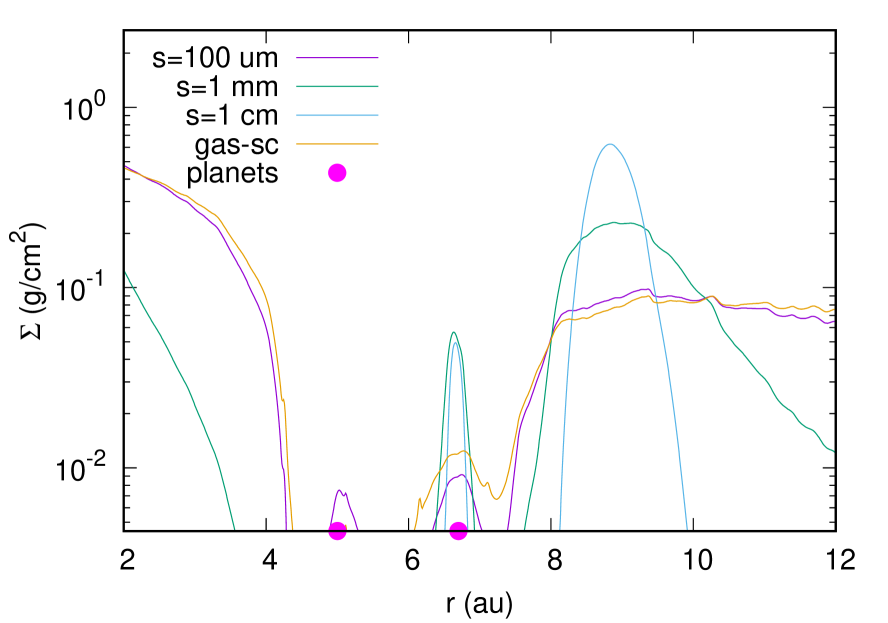
The dust distributions are shown in Figure 7 for the two different values of kinematic viscosity and, in the bottom panel, for a model without the inclusion of diffusion and back-reaction. Because of the significantly different migration speed, we only compare the dust density distributions at the end of the simulation (when the planet are located at different orbital radii). For this resonance too a significant dust enhancement develops at the outer edge of the gas gap, where dust-to-gas mass ratios can achieve values of order unity. The inner cavity is larger at all grain sizes, compared to that produced by the 3:2 resonant configuration. This is possibly related to the slower outward migration rate of the planets in the 2:1 resonance, which can reduce filtering of the dust through the orbits of the planets and toward the star. Additionally, the lower gas density increases the Stokes numbers of the grains, reducing their drift timescale and facilitating grain removal from the inner disc.
Comparing the top and bottom panels of Figure 7, one can notice significant differences in the dusty features exterior to the planets orbits. Since the gas density is also different in the two models (at those times), it is unclear how much of the difference is caused by the action of diffusion and back-reaction of the solids.
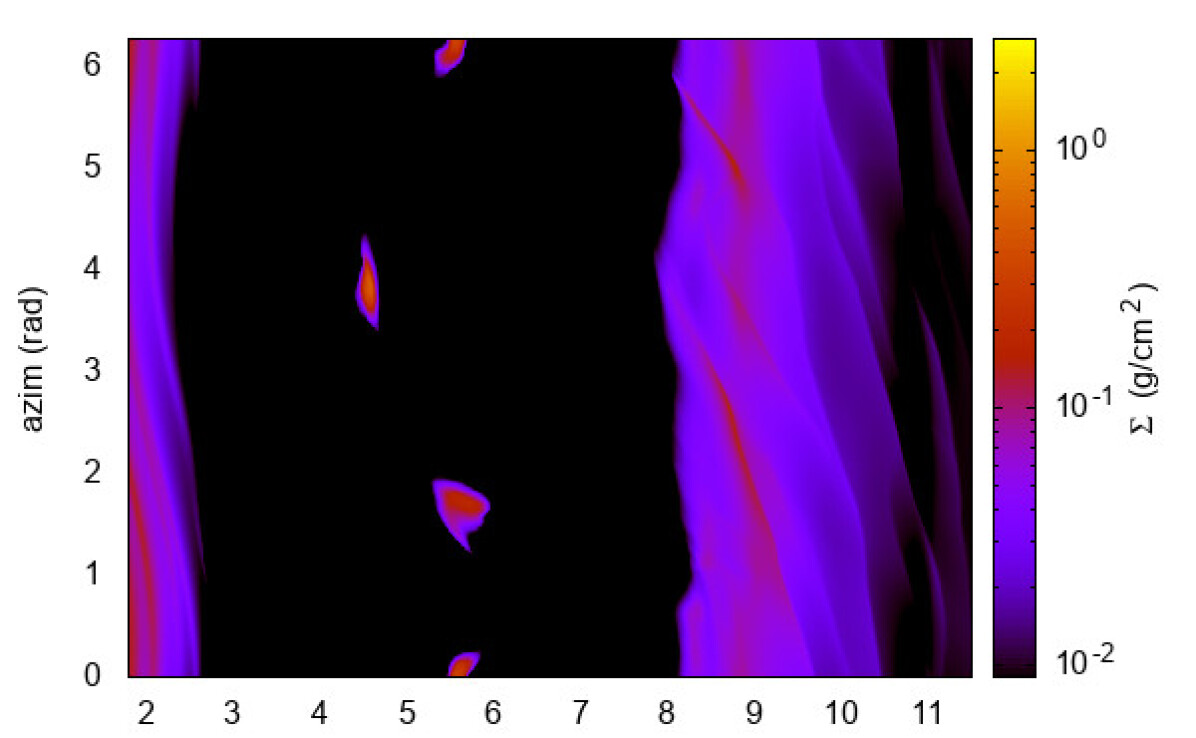
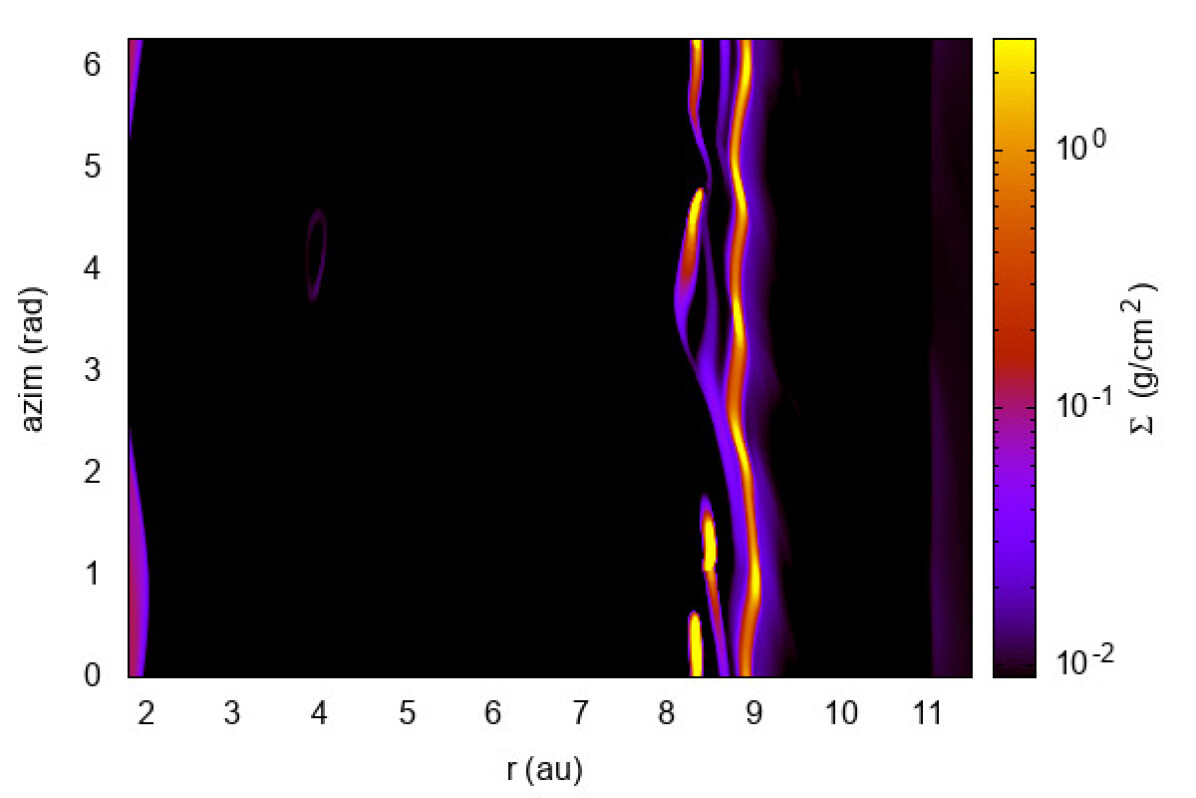
The orbital eccentricity of the planets can drive asymmetries in the distribution of the disc material. Consequently, both the gas gap outer edge and dusty rings can become asymmetric (see Figure 8). We did not perform a detailed analysis of ring asymmetries. However, one possible explanation for the more asymmetric features arising from the planets in the 2:1 resonance (compared to those in the 3:2 resonance, see Figure 4), may be the larger eccentric perturbation driven by the inner (more massive) planet, which tends to have a larger orbital eccentricity in the 2:1 resonance than in the 3:2 resonance (the outer planets can have comparable eccentricities).
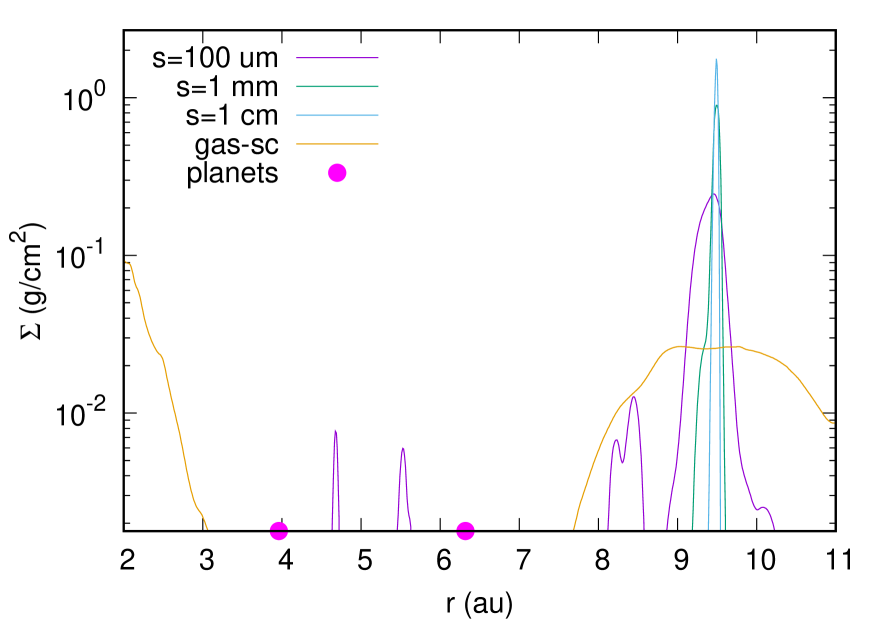
In Figure 8, the dust density distributions are shown for grains of various sizes for the case with lowest viscosity, . As mentioned, the width of the gap is significantly larger compared to the case of the 3:2 resonance and the dusty ring at the outer edge of the gas gap is evident for all particles, more than in the 3:2 resonance. For the 2:1 resonance, the effects of the dust trap appear more marked, both at the inner and at the outer edge of the gas gap. It is expected that after sufficient time from the beginning of the outward migration, the disc reduces to a single overdense ring at the outer edge of the gap, close to the outer planet orbit. As discussed in the previous section, this feature would result from the lack of dust supply from larger orbital radii, beyond the outer boundary of the grid.
5 Comparison with Alpha Viscosity
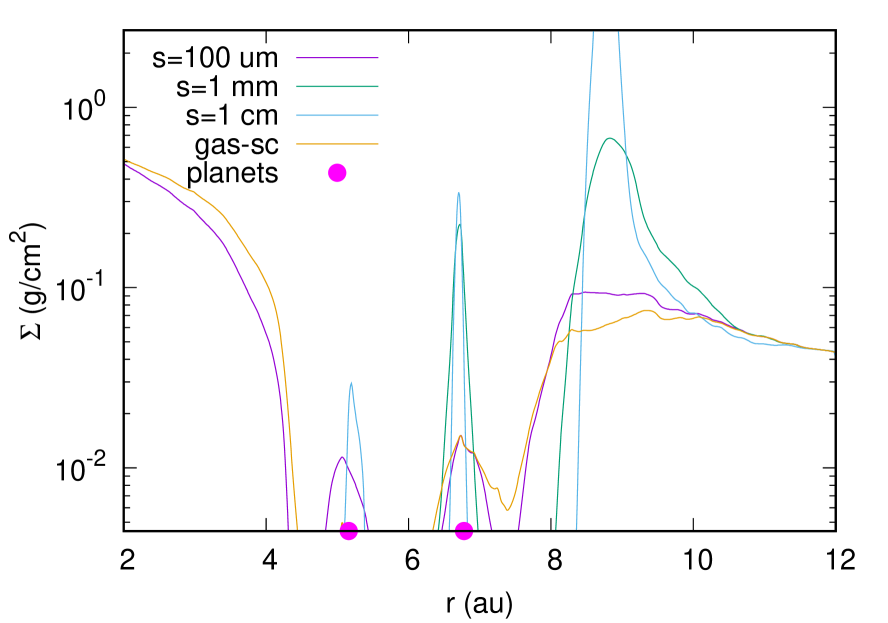
To test the robustness of our results, we performed two additional simulations, for the 2:1 resonance, in which the kinematic viscosity is set as , where is the local pressure scale height of the disc and the parameter is assumed to be a constant. Since we work with a local-isothermal disc and a constant aspect ratio, and . In the first model, we set whereas we set in the second. These parameters result in and around the middle radius of the computational domain.
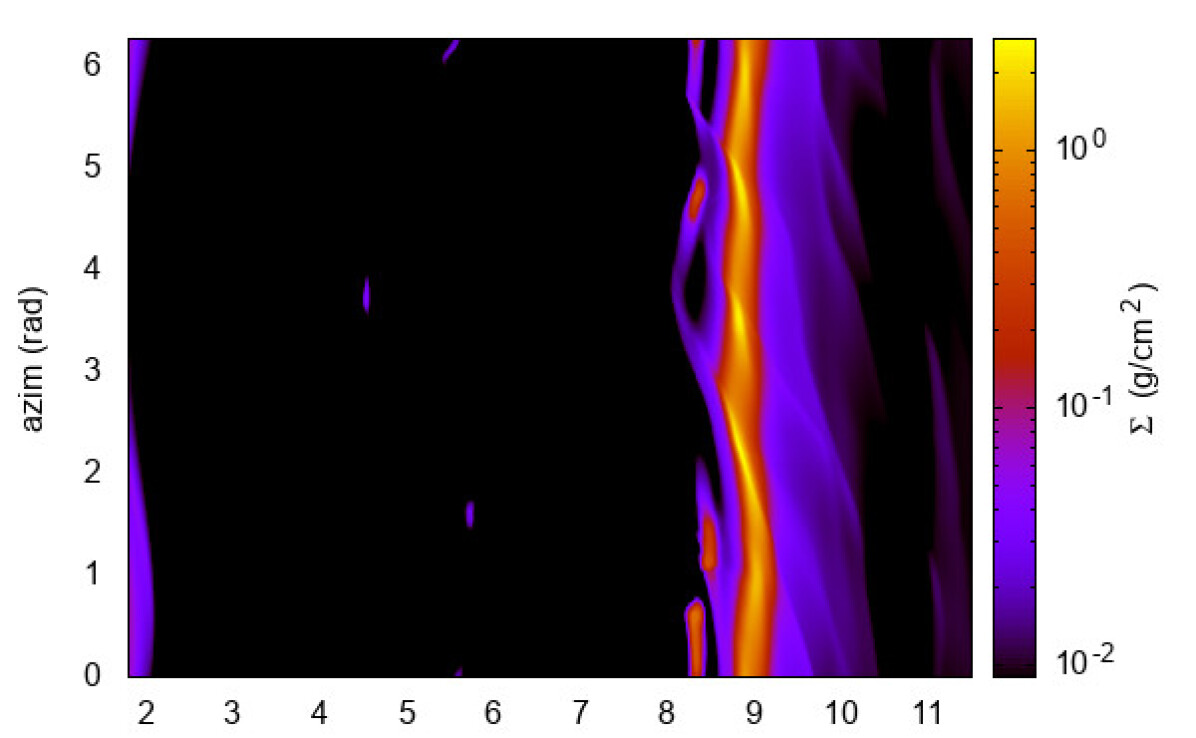
The outcomes of these simulations are illustrated in Figure 9, after yrs of evolution. The density peak at the outer edge of the gas gap is clearly visible in both cases, although there are differences in over-density morphology. In the top panel, at , the peak appears similar at all sizes while, in the bottom panel (), the peak is split in two for the largest particles ( mm and cm) and composed of three separate maxima for m. This behaviour was not observed for the 3:2 resonance but it was already present in the simulation involving the 2:1 mean-motion resonance obtained with a constant kinematic viscosity (see Figure 7, top panel). A possible interpretation is that for the 2:1 resonance multiple dust traps develop at the outer border of the gap. By comparing the gas density distribution in the two cases shown in Figure 9, this hypothesis appears to be confirmed since, in the case with , at the outer border of the gas gap appears more variable compared to that of the case with .
The splitting of the peak in various maxima can be also observed in the simulations of Marzari et al. (2019), for the case involving a pair of planet locked in the 2:1 resonance, even if their physical model (radiative disc), the initial parameters for the gas density and the viscosity values are different.
6 Conclusions
According to the models presented by Marzari et al. (2019), two planets in the mass range of Jupiter and Saturn, embedded in a circumstellar disc and migrating outwards, can strongly affect the dust distribution in their surroundings. They can create a transition disc with an inner cavity in the dust distribution that expands following the outward migration of the planets. They can also build a strong peak in the dust density at the outer edge of the gas gap carved by the resonant planets, which would appear as a bright dust ring. However, these findings may be altered by the dust diffusion due to gas turbulence and by a change in gap morphology due to the back-reaction of the dust on the gas. It is, therefore, important to test if these two processes weaken the dust trap at the outer edge of the gap, allowing the dust to filter through the gap and preventing the formation of an inner dust cavity and of the outer over-density ring.
We used the code FARGO3D (Benítez-Llambay et al., 2019), in which dust species are treated as additional pressureless fluids, and performed a set of local-isothermal, high resolution simulations involving giant planets locked in the 3:2 and 2:1 orbital resonances and including the effects of diffusion and dust back-reaction. For the 3:2 resonance, the diffusion and back-reaction slightly affect the dust distribution by reducing the height of the overdense region at the outer edge of the gas gap but without removing it. This has been tested for different values of the disc viscosity, which determines the amount of diffusion. This outcome proves that the dust trap is still strong enough to halt the inward drift of the dust and to lead to the formation of an inner cavity in the dust distribution and an overdense ring at the outer edge of the gap. The details of peak heights can also be affected by continued supply of solids from large radial distances and, therefore, depend on boundary effects and evolution timescales. Given the limited radial extent of the models presented herein, the possible feedback of very dense rings of solids on the gas distribution was not investigated.
The 2:1 resonance also provides a robust mechanism capable of creating an efficient dust trap. The height of the outer peak (outside the planets’ orbits) is not much affected by diffusion. Its morphology, however, appears more complex than it does in the 3:2 resonance situation, since in some cases two dust peaks form at the outer edge of the gas gap, possibly due to the development of multiple dust traps. The robustness of these results for this resonance were tested by performing two additional simulations in which we switched from a constant kinematic viscosity, , to a constant viscosity parameter. In terms of large-scale features, the outcome of these simulations do not significantly differ from those with constant , showing that the formation of the inner dust cavity and the outer peak(s) are not due to the viscosity parametrization (although details can depend on the type of viscosity).
In the models presented herein, the gas distribution interior to the planets’ orbits is not significantly depleted. However, ongoing accretion on the planets, neglected here, is expected to reduce the gas mass flux toward the inner disc (Lubow & D’Angelo, 2006), possibly leading to the formation of an inner cavity in the gas distribution as well.
Acknowledgements
We thank the reviewer, Clément Baruteau, whose comments helped us improve this paper. GD acknowledges support provided by NASA’s Research Opportunities in Space and Earth Science. Computational resources supporting this work were provided by the NASA High-End Computing (HEC) Program through the NASA Advanced Supercomputing (NAS) Division at Ames Research Center.
Data Availability
The data underlying the research results described in the article will be shared upon reasonable request to the authors.
References
- Balbus & Hawley (1991) Balbus S. A., Hawley J. F., 1991, ApJ, 376, 214
- Balbus & Hawley (1998) Balbus S. A., Hawley J. F., 1998, Reviews of Modern Physics, 70, 1
- Balbus & Hawley (2003) Balbus S. A., Hawley J. F., 2003, in Falgarone E., Passot T., eds, , Vol. 614, Turbulence and Magnetic Fields in Astrophysics. pp 329–348, doi:10.48550/arXiv.astro-ph/0203353
- Benítez-Llambay et al. (2019) Benítez-Llambay P., Krapp L., Pessah M. E., 2019, ApJS, 241, 25
- Brauer et al. (2008) Brauer F., Dullemond C. P., Henning T., 2008, A&A, 480, 859
- D’Angelo & Marzari (2022) D’Angelo G., Marzari F., 2022, MNRAS, 509, 3181
- D’Angelo et al. (2006) D’Angelo G., Lubow S. H., Bate M. R., 2006, ApJ, 652, 1698
- Hughes et al. (2011) Hughes A. M., Wilner D. J., Andrews S. M., Qi C., Hogerheijde M. R., 2011, ApJ, 727, 85
- Klahr & Hubbard (2014) Klahr H., Hubbard A., 2014, ApJ, 788, 21
- Lubow & D’Angelo (2006) Lubow S. H., D’Angelo G., 2006, ApJ, 641, 526
- Lyra (2014) Lyra W., 2014, ApJ, 789, 77
- Marta Bernabò et al. (2022) Marta Bernabò L., Turrini D., Testi L., Marzari F., Polychroni D., 2022, arXiv e-prints, p. arXiv:2202.13891
- Marzari & D’Angelo (2020) Marzari F., D’Angelo G., 2020, A&A, 641, A125
- Marzari et al. (2019) Marzari F., D’Angelo G., Picogna G., 2019, AJ, 157, 45
- Masset (2000) Masset F., 2000, A&AS, 141, 165
- Morfill & Voelk (1984) Morfill G. E., Voelk H. J., 1984, ApJ, 287, 371
- Nelson et al. (2013) Nelson R. P., Gressel O., Umurhan O. M., 2013, MNRAS, 435, 2610
- Picogna & Kley (2015) Picogna G., Kley W., 2015, A&A, 584, A110
- Picogna et al. (2018) Picogna G., Stoll M. H. R., Kley W., 2018, A&A, 616, A116
- Pinilla et al. (2020) Pinilla P., Pascucci I., Marino S., 2020, A&A, 635, A105
- Sierra et al. (2019) Sierra A., Lizano S., Macías E., Carrasco-González C., Osorio M., Flock M., 2019, ApJ, 876, 7
- Stoll et al. (2017) Stoll M. H. R., Kley W., Picogna G., 2017, A&A, 599, L6
- Taki et al. (2016) Taki T., Fujimoto M., Ida S., 2016, A&A, 591, A86
- Turrini et al. (2019) Turrini D., Marzari F., Polychroni D., Testi L., 2019, ApJ, 877, 50
- Urpin (2003) Urpin V., 2003, A&A, 404, 397
- Woitke & Helling (2003) Woitke P., Helling C., 2003, A&A, 399, 297