∎
22email: Jean-Marie.Malherbe@obspm.fr 33institutetext: T. Corbard 44institutetext: Lagrange, Observatoire et Université de la Côte d’Azur, CNRS, Nice, France
44email: Thierry.Corbard@oca.eu 55institutetext: G. Barbary 66institutetext: LESIA, Observatoire de Paris, PSL Research University, CNRS, Meudon, France
66email: Gaele.Barbary@obspm.fr 77institutetext: F. Morand 88institutetext: Calern station, Observatoire et Université de la Côte d’Azur, CNRS, Caussols, France
88email: Frederic.Morand@oca.eu 99institutetext: C. Collin 1010institutetext: LESIA, Observatoire de Paris, PSL Research University, CNRS, Meudon, France
1010email: Claude.Collin@obspm.fr 1111institutetext: D. Crussaire 1212institutetext: LESIA, Observatoire de Paris, PSL Research University, CNRS, Meudon, France
1212email: Daniel.Crussaire@obspm.fr 1313institutetext: F. Guitton 1414institutetext: Lagrange, Observatoire et Université de la Côte d’Azur, CNRS, Nice, France
1414email: florence.Guitton@oca.eu
Monitoring fast solar chromospheric activity: the MeteoSpace project
Abstract
We present in this reference paper an instrumental project dedicated to the monitoring of solar activity during solar cycle 25. It concerns the survey of fast evolving chromospheric events implied in Space Weather, such as flares, coronal mass ejections, filament instabilities and Moreton waves. Coronal waves are produced by large flares around the solar maximum and propagate with chromospheric counterparts; they are rare, faint, difficult to observe, and for that reason, challenging. They require systematic observations with automatic, fast and multi-channel optical instruments. MeteoSpace is a high cadence telescope assembly specially designed for that purpose. The large amount of data will be freely available to the solar community. We describe in details the optical design, the qualification tests and capabilities of the telescopes, and show how waves can be detected. MeteoSpace will be installed at Calern observatory (Côte d’Azur, 1270 m) and will be in full operation in 2023.
Keywords:
Sun – Chromosphere – Instrumentation – Imagery – Solar activity – Flares – Moreton waves1 Introduction
Solar activity is the primary driver of Space Weather phenomena, such as Coronal Mass Ejections (CMEs), flares, energetic particles and wind streams which may reach and perturb the Earth environment. The solar perspectives of Space Weather are reviewed by Schwenn (2006) and more recently by Temmer (2021), while the terrestrial consequences are discussed by Pulkkinen (2007). Solar activity occurs over timescales ranging from seconds to minutes in flares and CMEs, which are fast evolving and highly dynamic events, originating in the solar atmosphere from non-potential magnetic energy. It can be stored in bright faculae (B 100 G, 1 G = 10-4 T), sunspots (B 1000 G) and large coronal loops above active regions (review by Reale (2010)). The monitoring of solar activity requires a systematic survey of the chromosphere (8000 K), as it is the source of solar events, which propagate to the hot corona above (1-2 MK or more). For that purpose, ground-based networks with many stations around the world have been organized, such as the Global H network (GHN, Steinegger et al. (2000)), the Continuous H Imaging Network (CHAIN, Ueno et al. (2010)) or the GONG H network with seven identical telescopes (Harvey et al., 2011). In space, observations of various EUV emission lines, formed in the temperature range 0.1-10 MK of the corona, started with the SOHO/ESA/NASA mission (1996) and continue with the improved Solar Dynamics Observatory (SDO/NASA, 2010). New data are now available from recent spacecrafts, such as Parker Solar Probe (NASA, 2018) and Solar Orbiter (ESA, 2020).
The Space Weather is mainly affected by CMEs (Chen, 2011) and energetic flares (Oloketuyi et al., 2019). The integrated X-ray flux of the Sun is permanently monitored by the GOES/NASA satellites and is a good indicator of solar activity and the flare energy. The flux is usually symbolized by letters A, B, C, M and X, respectively for 10-8 to 10-4 W m-2 in logarithmic scale, and a multiplicative number. Only C, M and X-class flares are significant. Among them, energetic events (M and X) are relatively rare (respectively 9% and 1%, with only 50 flares between X2.6 and X28 during the past 25 years). The largest recent event (4 November 2003, X28, about J) could be compared to the famous and historic Carrington flare (1 September 1859 seen in white light, maybe X50). Highest energy flares (X-Class) trigger fast coronal MHD shock waves (Warmuth, 2015) which propagate at super-magnetosonic speeds (500-1000 km s-1) and can produce chromospheric counterparts, discovered much earlier by Moreton (1960). They are often described as the signature of the downward compression by the moving coronal shock above. Chromospheric Moreton waves are fast and rare phenomena, so that study cases are not very numerous (Zhang (2001), Narukage et al. (2004), Balasubramaniam et al. (2007), Zhang et al. (2011), Asai et al. (2012), Krause et al. (2015), Admiranto et al. (2015), Krause et al. (2018), Cabezas et al. (2019)). The usual observing cadence is about 45-60 s, but faster frame rates (5 images/minute or more) would be better to investigate with more details the chronology and the physics of such events.
The MeteoSpace (MTSP) instrument presented in this paper will provide a unique opportunity to monitor highly dynamic phenomena around the next solar maximum (2025). Our paper is organized as follows. Section 2 summarizes the architecture of the MTSP project, while Section 3 presents the CaII K channel. The goals and capabilities of the two H telescopes are described in Section 4, while Section 5 discusses the detection of Moreton waves, which is the most challenging purpose of the H channels. At last, Section 6 describes a possible extension for the future.
2 Architecture of the MeteoSpace (MTSP) project
MTSP has an historical background. The chromosphere is observed daily at Meudon with Deslandres’s spectroheliograph since 1908. It produces now (x, y, ) data-cubes from which monochromatic images are derived (Malherbe and Dalmasse, 2019). In 1957, during the International Geophysical Year (IGY), the french astronomers decided to organize a survey of H chromospheric activity at high cadence (60 s) using the Lyot filter technology (Lyot, 1944). Two instruments were built for Meudon and Haute Provence observatories (Grenat and Laborde (1954), Michard (1965)). In 1965, a new generation of tunable Lyot filters allowed to observe sequentially the H line centre and wings, in order to measure Doppler-shifts. This routine, improved in 1985, was stopped in 2004, due to the filter obsolescence and the retirement of operators. About 7 million images have been recorded. In the competitive context of Space Weather research and applications, we wish to restart a survey with new automatic telescopes and faster cadence (10-15 s), on a sunnier site in order to increase the probability of catching rare events, such as large X-class flares and Moreton waves. MTSP is a joint project between Paris (OP) and Côte d’Azur (OCA) observatories. Overall characteristics are summarized in Malherbe et al. (2019). We provide here much more instrumental details in order to constitute a reference paper for MTSP.
The architecture of the MTSP project (Figure 1) is organized around three main tasks:
-
•
Automation procedures (OCA)
-
•
The real time data processing and archiving procedures (OCA)
-
•
The telescopes and data acquisition system (OP)
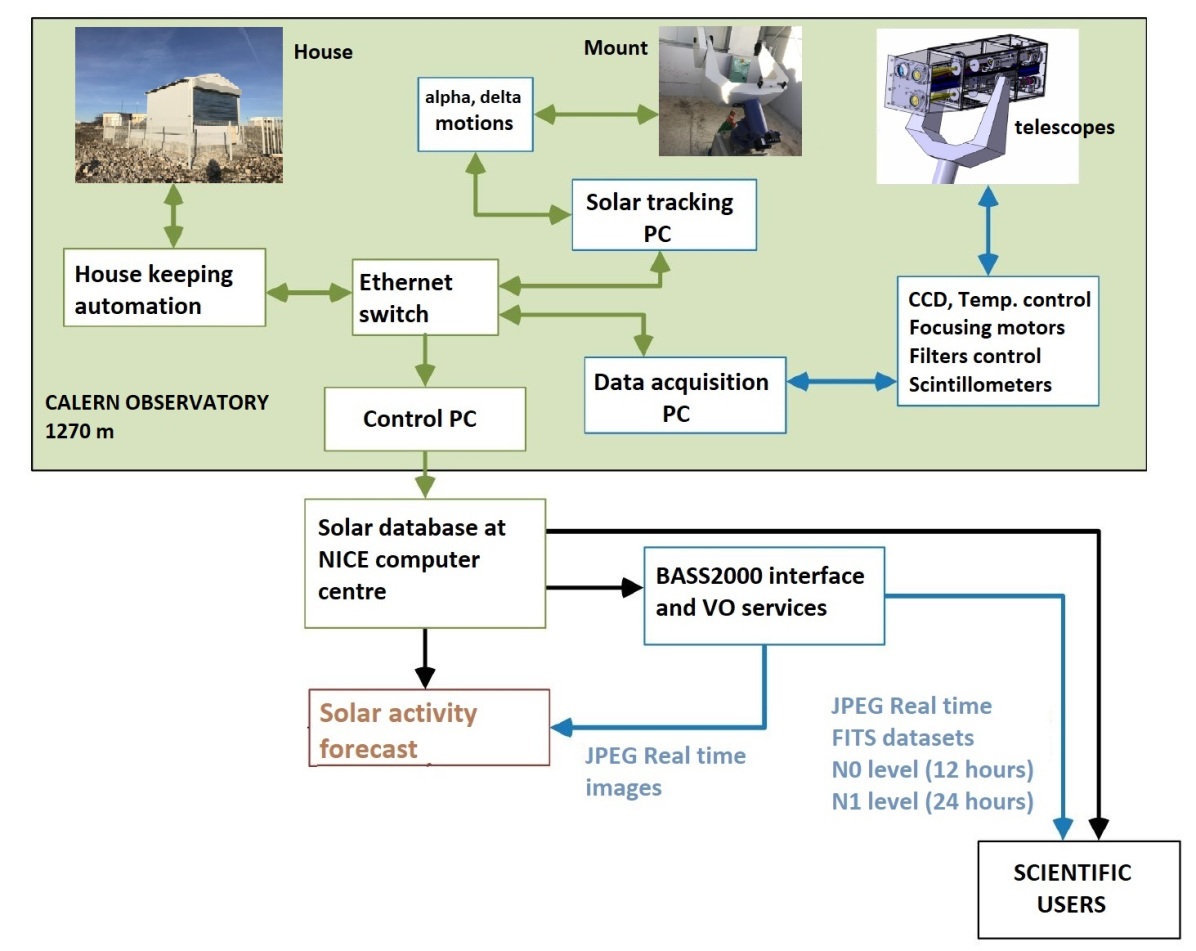
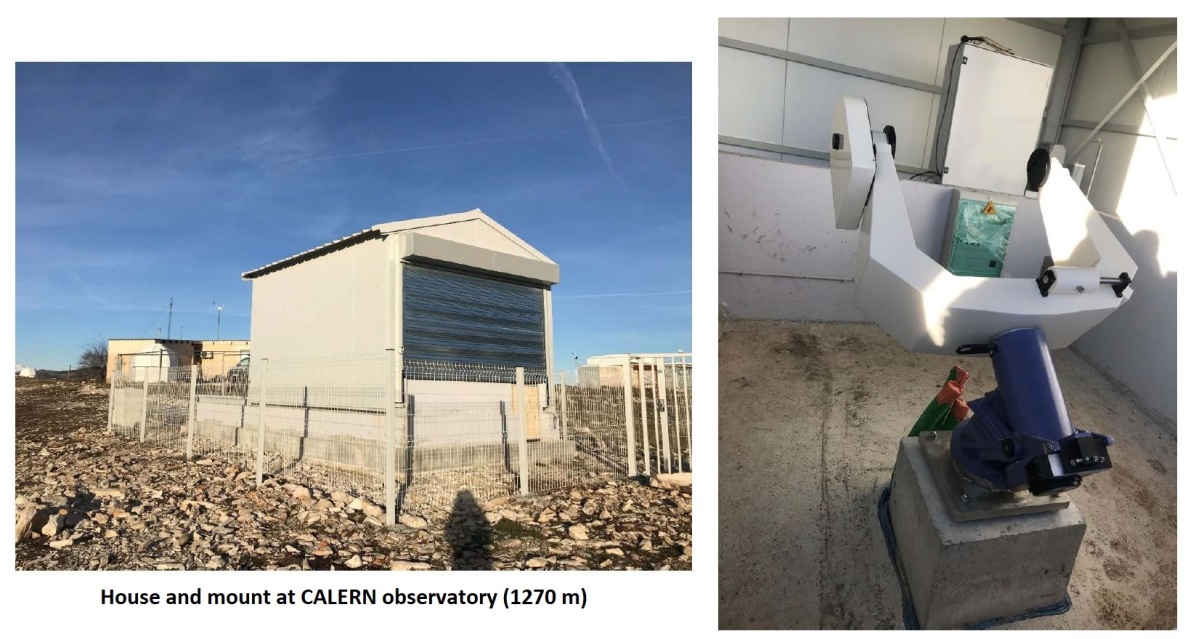
The assembly of three telescopes (two H 6563 Å channels for solar activity, and a CaII K 3934 Å magnetic proxy) is built by OP. A new housing and equatorial mount have been installed at Calern observatory (1270 m, OCA, Figure 2). The instruments (Figure 3) will be integrated mid 2022, then tested and commissioned in 2023 for systematic and automatic observations. Data will be freely available to the international community, without any delay, both for operational and scientific purpose. MSTP comes with a specific database (located at Nice computer centre with 100 TB of disk storage), with possible access through the BASS2000 solar database, and will offer later virtual observatory services.
2.1 Automation procedures
MTSP is the first automatic solar telescope assembly available in France (other solar instruments are under human control). The telescopes (Figure 3) and housing (Figure 2) are under the supervision of a control/command computer (Figure 1). This PC is interconnected with other slave machines, such as the data acquisition computer (which handles cameras, filters, motor focus, scintillometers, thermal units), the solar tracking computer (which drives the equatorial mount) and the House Keeping (HK) automation. HK is a complex system for a fully automatic instrument, because many environment detectors and cameras must be controlled permanently, concerning the telescope status and meteorology (clouds, temperature, humidity, wind). In particular, the HK system will decide to start or interrupt observations according to informations provided by the environment parameters. Under good observing conditions, the HK will roll the housing and open front curtains; the tracking PC will catch and follow the Sun, and the instrument PC will start data acquisition after checking the different components. In case of danger (such as wind, rain, snow), the HK procedure will return an alarm to the central PC which will interrupt observations, order the mount to return to the garage position and ask the HK to close the building. SMS messages will inform the technical staff of Calern observatory, in particular in case of alarms.
2.2 Real time data processing and archiving procedures
Raw 12 bits data are collected by the acquisition PC and transmitted to the control computer. There are two data levels, N0 and N1. N0 are raw data written in FITS format. For that purpose, FITS keywords with exhaustive data descriptors are simply added and N0 images are directed to the Nice archive via the fast network link between the observing site and the data centre. N1 is the first level of scientific data. For each image, the Sun radius and centre are detected and the solar disk is centred in the 35 arcmin FOV. A rotation is then applied in order to present the North up. The dark current is subtracted. Corrections of optical distortions are applied, if needed. A 8 bits JPEG real time image is derived and is immediately uploaded into the database. Keywords are added to scientific images to form FITS data-sets, which will be transferred after observations (by night), so that the delay for scientific data will be about 12 hours. The query system of the Nice database will offer, for each channel, individual images or large data-sets (zip or tar.gz files) that will be built on line using the time interval provided by the requestor. The database is dimensioned to store all observations of cycle 25 and will start to operate in 2023. In parallel, the query system will be incorporated to the solar BASS2000 data portal. Progressively, it will offer virtual observatory services, so that links to other wavelengths will be offered together with MTSP data (such as EUV from SDO/AIA or radio from Nançay Radioheliograh). Observations will start with two operating modes: a standard one in the case of low activity level (60 s cadence), and a fast mode (10-15 s) in the case of high level. This mode will be systematically used at the approach of the next solar maximum (2025), or will be triggered by indicators such as the real-time GOES/NASA X-ray flux.
2.3 The telescopes
Three telescopes, with equivalent focal length 983 mm, forming a solar image of 9.14 mm diameter, have been developed (Figure 3). The CaII K line channel provides a magnetic proxy. It reveals the magnetized areas such as dark spots (1000 G typical) and bright facular regions (100 G typical), through broad-band interference filters integrating the line core (K3), K2 close wings (0.2 Å) and partially K1 far wings (1.5 Å). The two H channels monitor chromospheric activity, such as filament instabilities, flares, CMEs and eventually Moreton waves. They use narrow bandpass filters. In order to have a compact instrument, we selected Fabry-Pérot filters instead of Lyot filters previously used at Meudon.
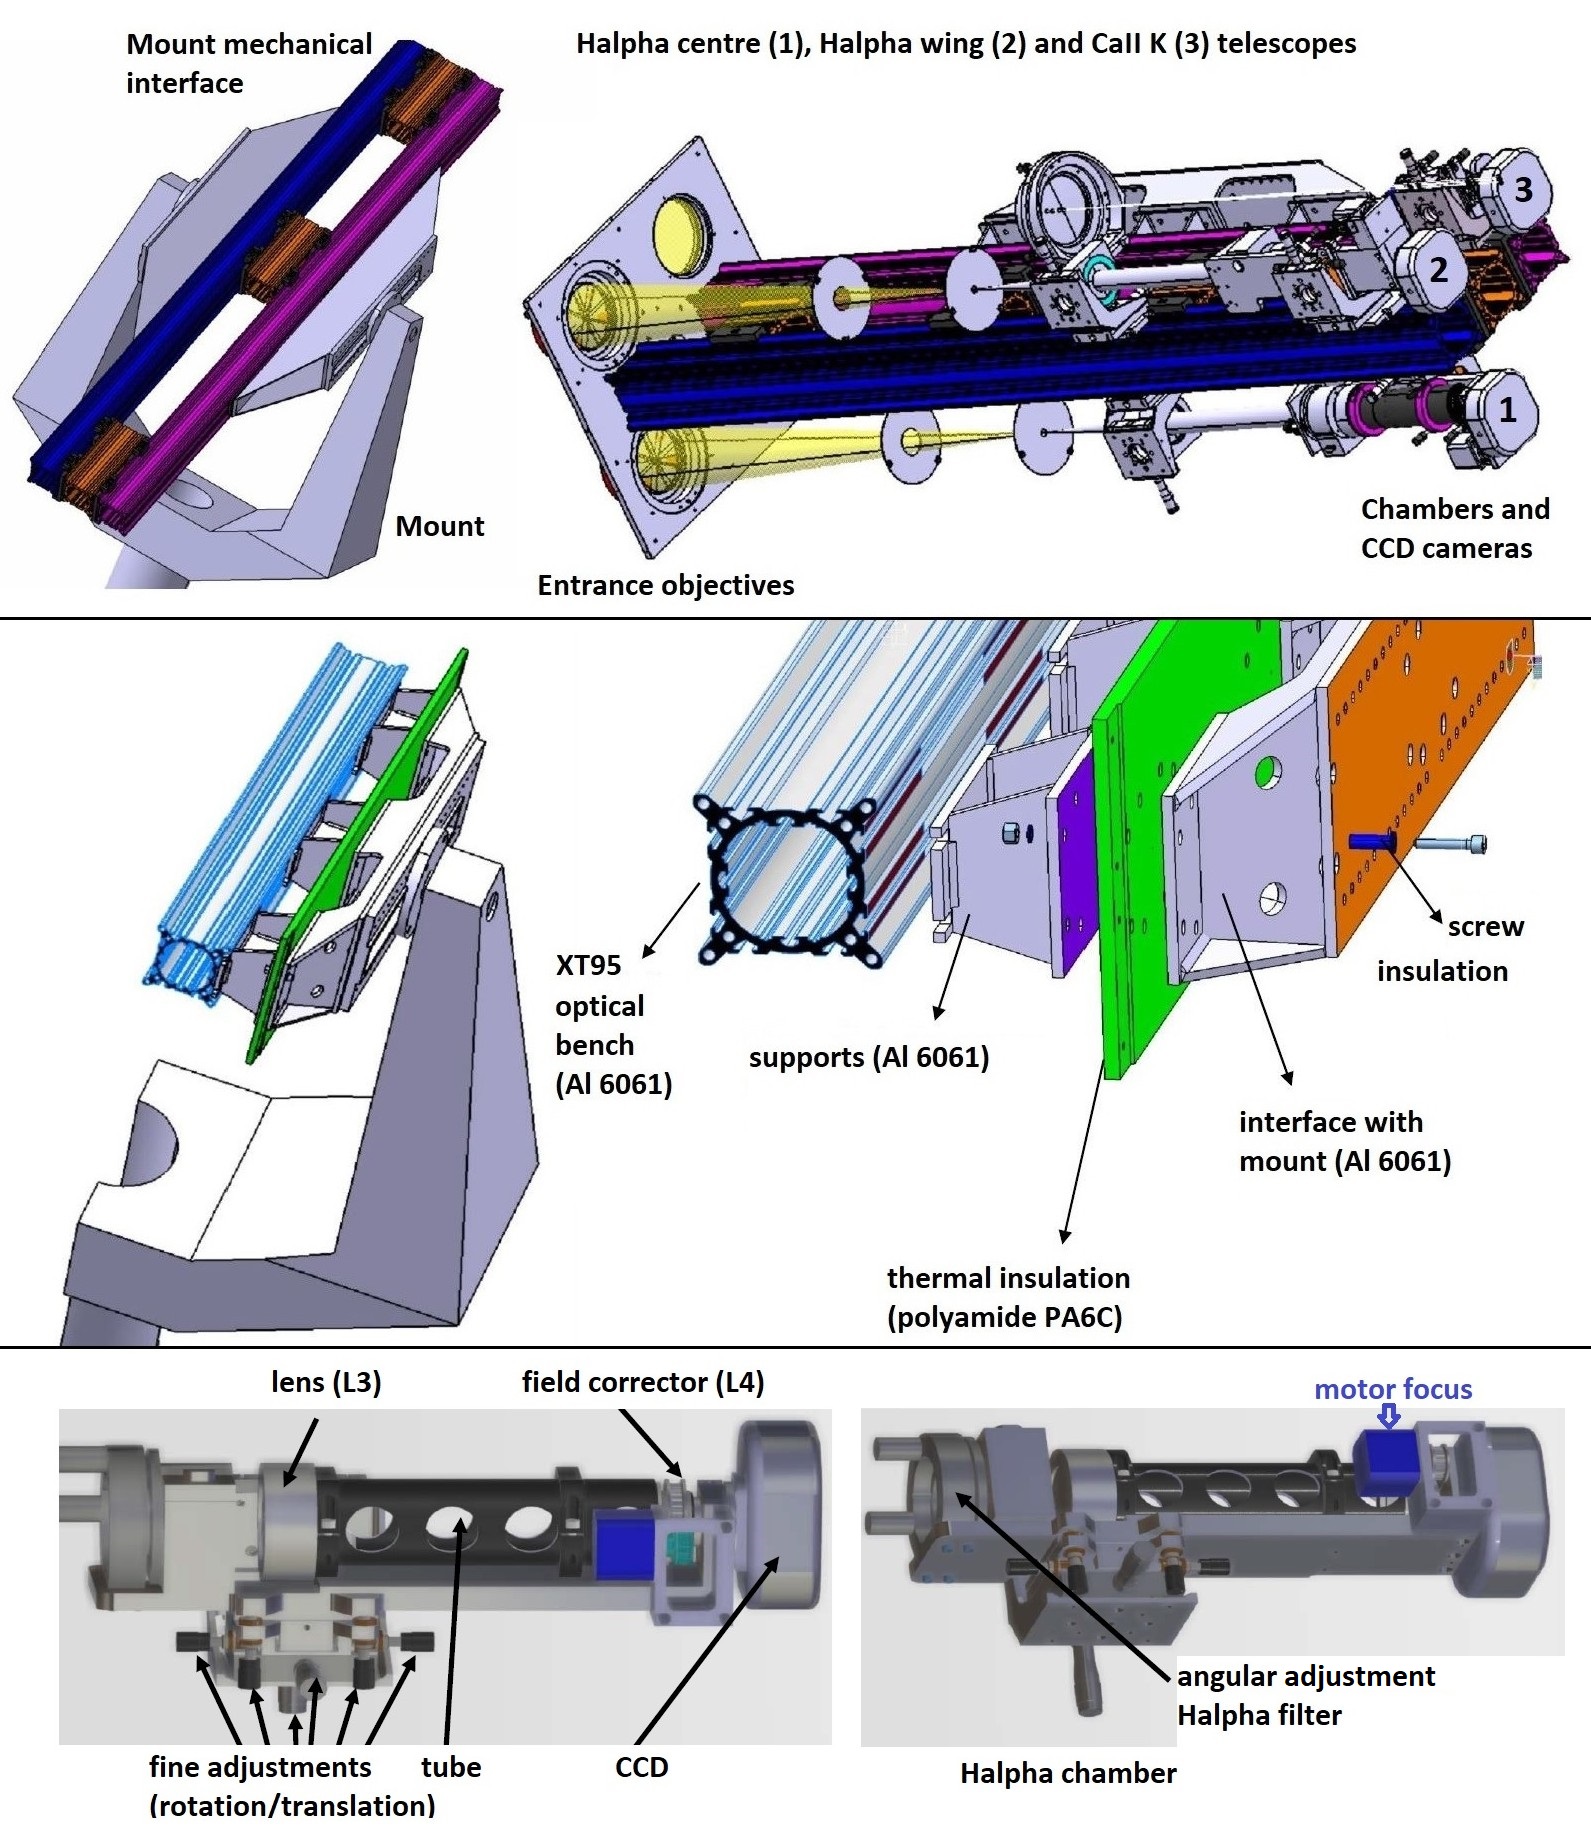
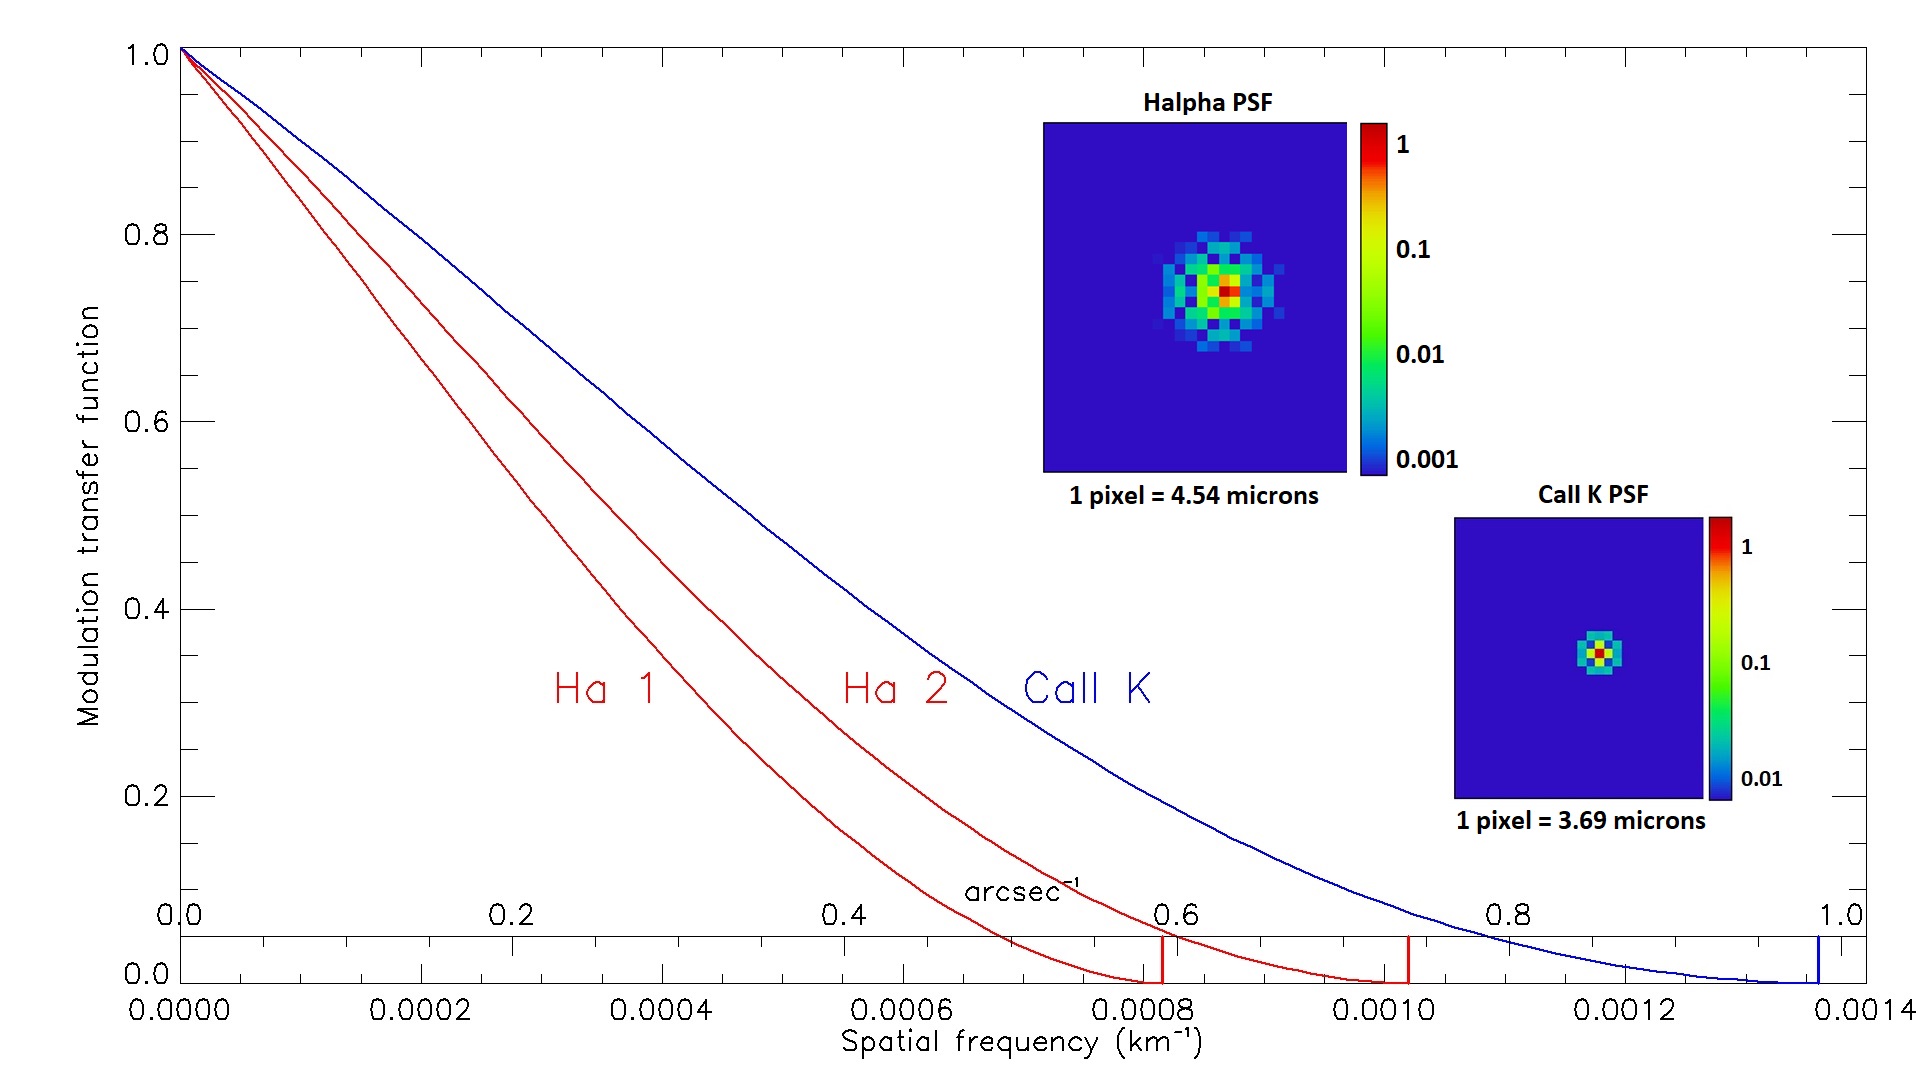
The telescopes (except filters) have been simulated with the Zemax software. Figure 4 shows the Modulation Transfer Functions (MTF) of the aperture, including the CCD sampling effect. The cutoff frequencies are 1.36, 0.815 and 1.02 10-3 km-1, respectively for the CaII K (80 mm aperture) and the two H channels (80 mm and 100 mm aperture). The Point Spread Functions (PSF) in the image plane are reported. The CaII K and H telescopes exhibit Strehl ratios of 88% and 93% respectively, and the ensquared energy of a point source is 70% in a box of only 2 2 pixels for all instruments. There is almost no optical distortion. The RMS radius of spot diagrams varies from 32% to 65% of the Airy spot radius from the FOV centre to the border, in the case of H telescopes.
The optical design and filter tests are detailed in sections 3 and 4, respectively for CaII K and H telescopes. However, Figure 5 summarizes briefly the overall capabilities of MTSP devices. We have two H Fabry-Pérot filters, in pupil plane, with respectively 0.46 Å FWHM (for line wings, filter 1) and 0.34 Å FWHM (for line centre, filter 2). We also have two interference CaII K filters, in image plane, with respectively 1.5 and 1.4 Å FWHM (the second one is a spare). The instruments are enclosed inside a temperature regulated box at 301∘C by active heating and passive cooling, but Fabry-Pérot filters have their own and high precision heating oven (typical operating values of 65 and 40∘C respectively for filters 1 and 2). CCDs are isolated with their own Peltier and air cooling systems; according to the readout noise at 8 MHz pixel rate, their dynamic range is about 2700 (12 bits) for a typical signal to noise ratio of 100. Exposure times are a few ms only.
The H telescopes, dedicated to fast solar events, can observe the chromosphere (8000 K) at high cadence (10-15 s), this is 4 times faster than GONG observations or previous Meudon routines, and 3 times faster than SDO/AIA in EUV emission lines of the hot corona. The pixel size is about 1 arcsec (2 times better than the previous routines at Meudon); it is difficult to achieve a better resolution with small ground based instruments observing the Sun.
3 The CaII K channel
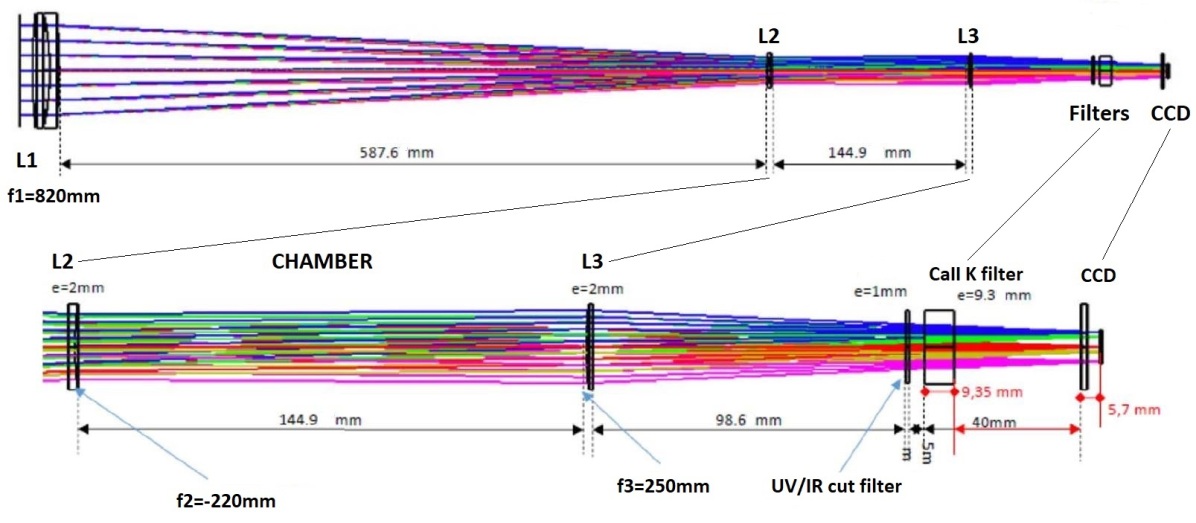
The CaII K telescope (Figure 6) has an aperture of 80 mm. It is composed of a Takahashi FS102 objective (820 mm focal length) followed by a magnifying chamber ( 1.2), a Barr Associates 1.5 Å FWHM filter (in image plane) and an interline cooled CCD camera (QSI 690, pixel size = 3.69 m = 0.78 arcsec). The system is protected by an UV/IR cutoff filter. The Airy spot size is 5.9 m or 1.24 arcsec resolution.
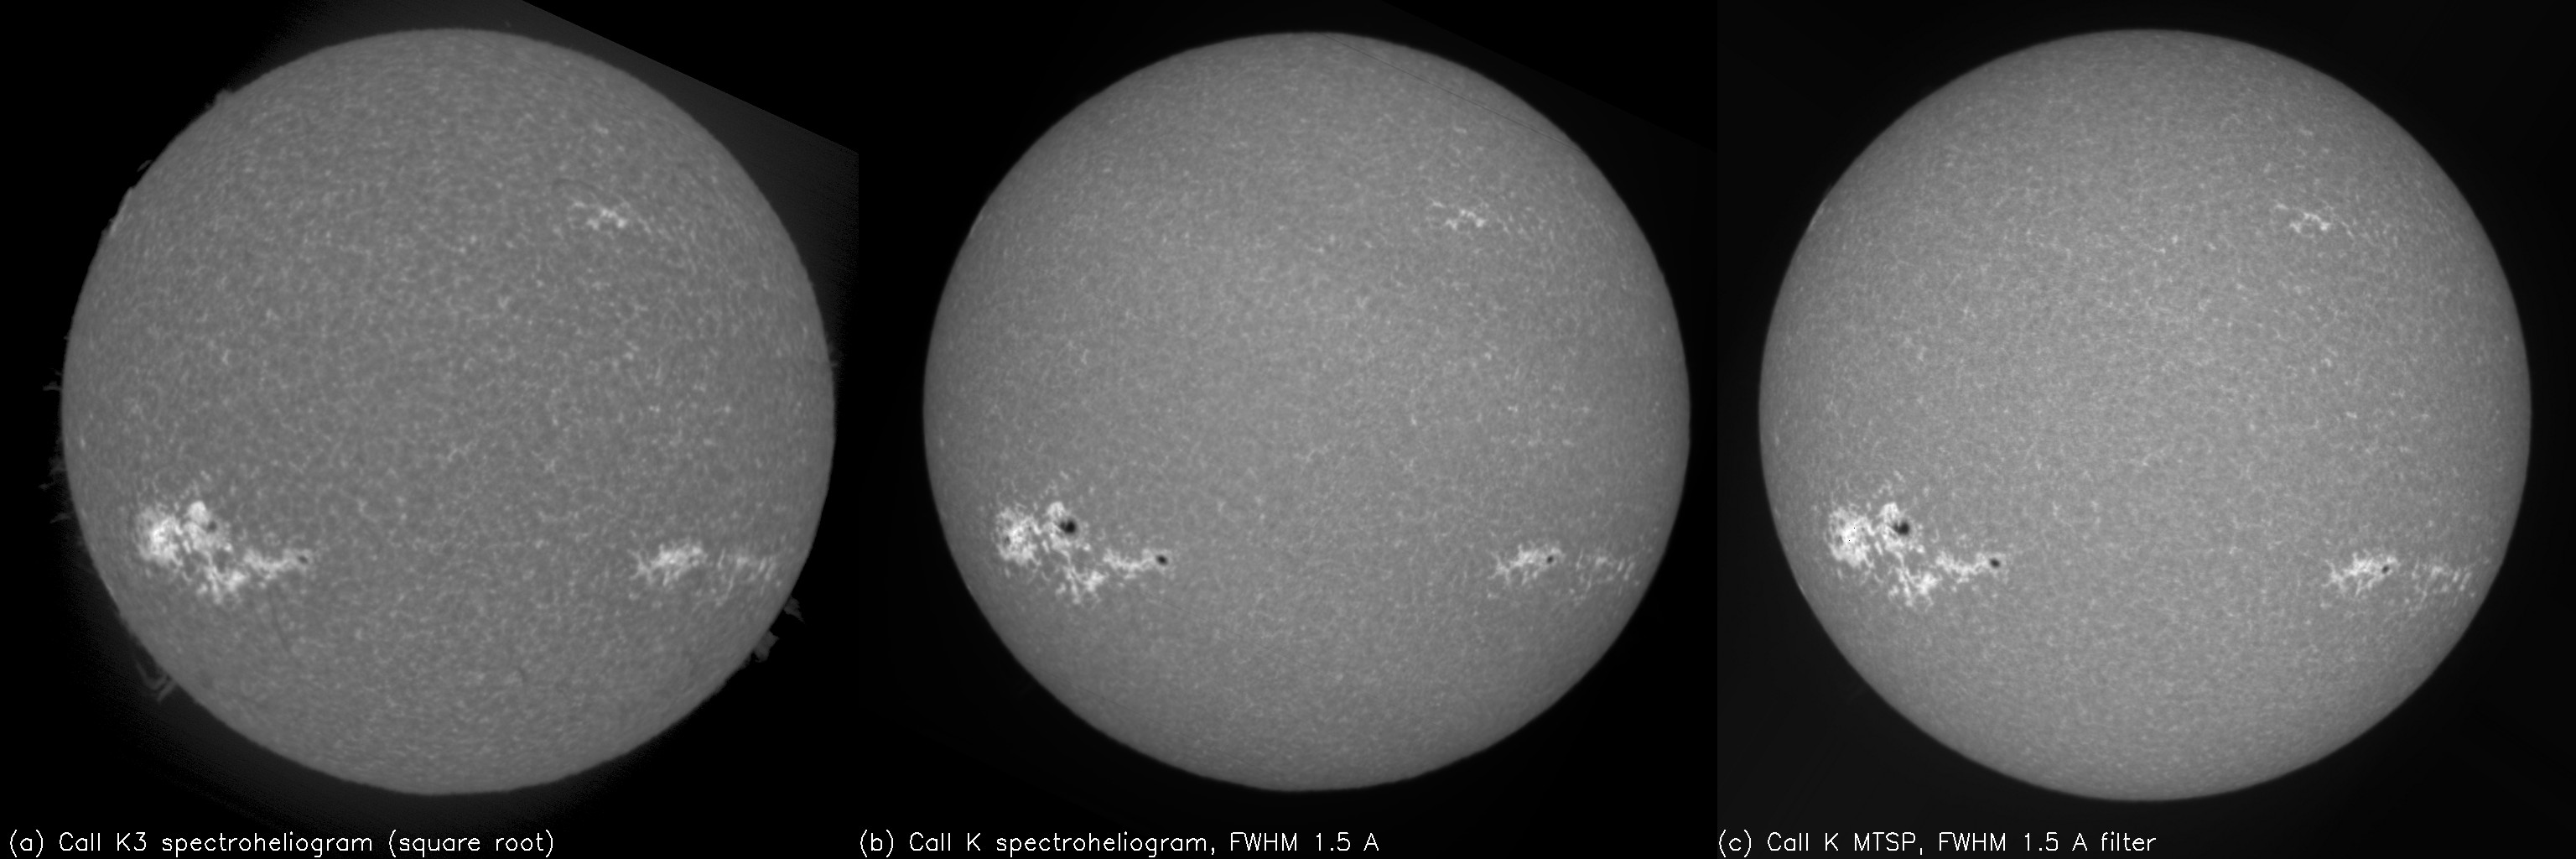
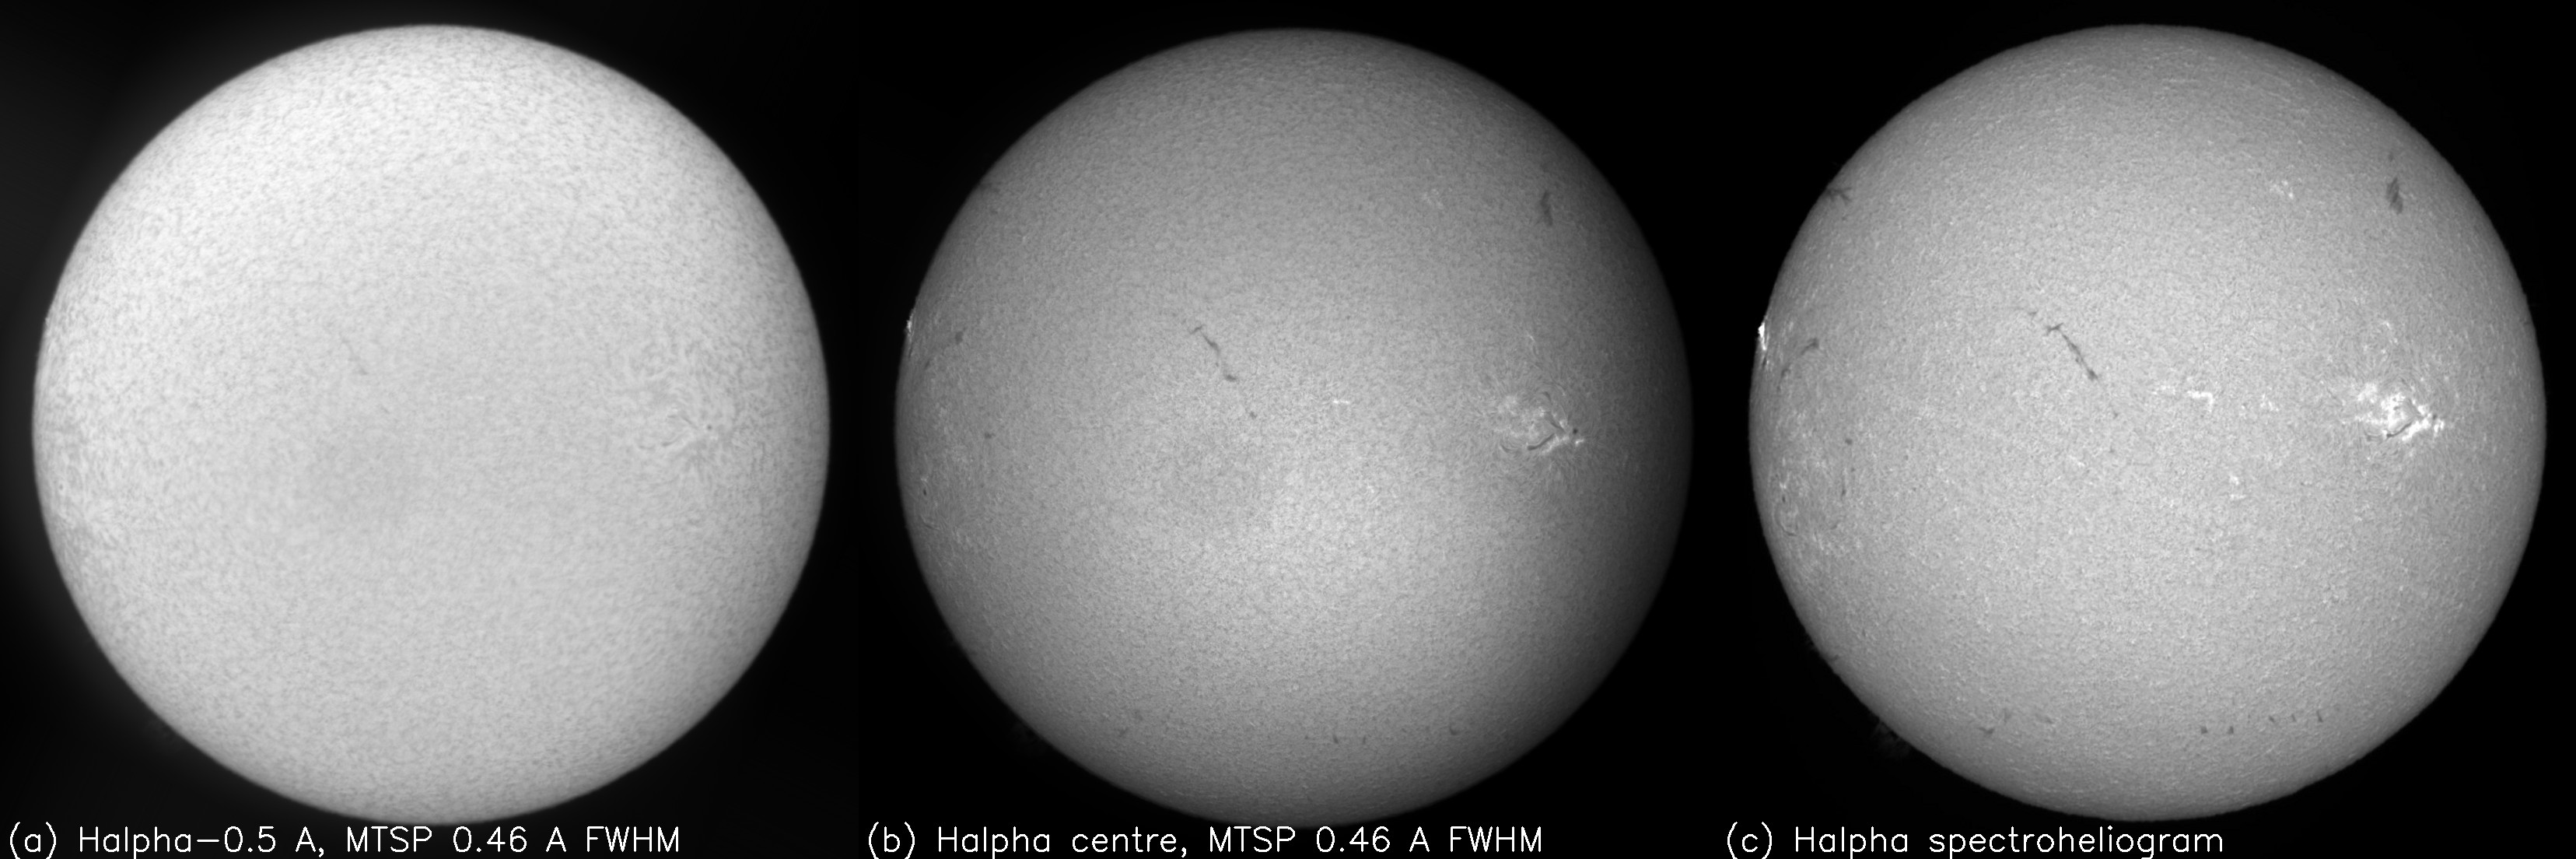
The interference filters were tested with the powerful 14 m spectrograph of Meudon Solar Tower at F/75 (R = 300000, 6 mÅ spectral line sampling in order 15). We found that the central wavelength (CWL) is temperature (T) dependant, according to the law = C T, where C = 0.07 Å/∘C is the measured temperature coefficient. It is also function of the incidence angle , and follows the law = K with K = -0.15 Å/degree2. As the theory gives K = - ( in radians), where n is the effective index of refraction and the line wavelength, we derived from the measurements n 2.0. With an aperture of F/12.3 (half cone of 2.3∘), the numeric integration over the light cone shows that the CWL is blue-shifted (-0.41 Å), but this is almost compensated (+0.49 Å) by the operating temperature (+7∘C above the specification of the manufacturer), so that the resulting CWL shift is small in comparison to the FWHM (the transmittance of the filter centre is displayed in Figure 5, right). This figure also reveals that the surface filter is not uniform. We found that that the CWL varies from the centre to the border according to the law = x2, where x is the distance to the filter centre. We measured = -0.006 Å/mm2 and +0.003 Å/mm2 respectively for filters 1 and 2 (the spare filter). It means that the CWL varies between the centre of the solar disk and the limb (0 x 4.6 mm), numerically = -0.13 Å or +0.07 Å , respectively for filters 1 and 2. This is less than 10% of the FWHM, so that the effect does not appear obviously in solar images. Figure 7 shows a comparison between the CaII K3 Meudon spectroheliograms (line centre) and MTSP test images (formed at lower altitude due to the larger bandwidth): filaments and prominences are no more visible, but sunspots appear more contrasted; bright faculae look similar, so that the CaII K MTSP channel produces a good magnetic proxy. It is close to the wavelength integration of the spectroheliograph data-cube (x, y, with 0.093 Å resolution) over the MTSP transmittance.
4 The two H channels
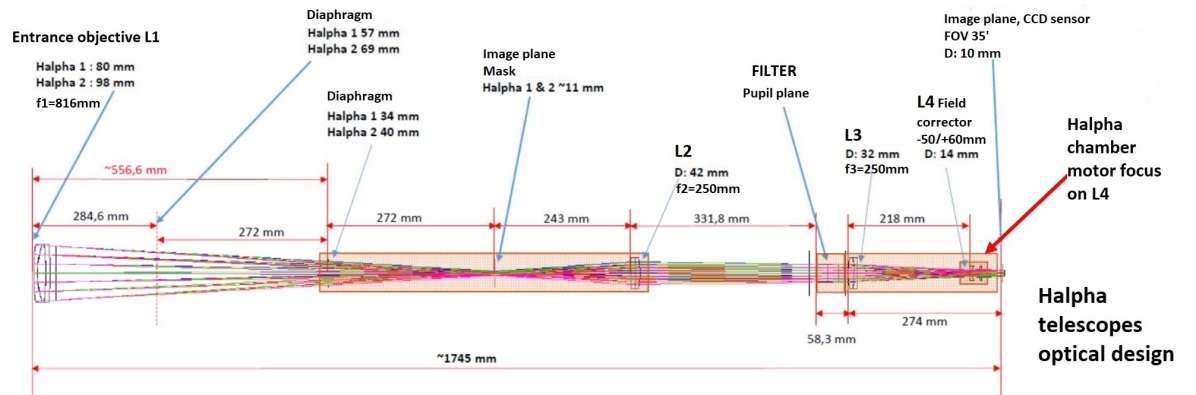
The two H telescopes (Figure 8) have an aperture of 80 mm and 100 mm, respectively for filters 1 and 2. They are composed of a Takahashi TSA102 objective (816 mm focal length) followed by an afocal chamber (magnification 1.2), including a DayStar Quantum Pro Fabry-Pérot filter in the pupil plane. This system introduces field curvature, so that a field corrector (two lenses) forms the final image on an interline cooled CCD camera (QSI 660, pixel size = 4.54 m = 0.96 arcsec). The Airy spot size is 9.8 and 7.9 m, corresponding to 2.06 and 1.65 arcsec resolution, respectively for telescopes 1 and 2. The system is protected by an UV/IR cutoff filter in full aperture (not drawn). A motor focus is integrated to the chambers.
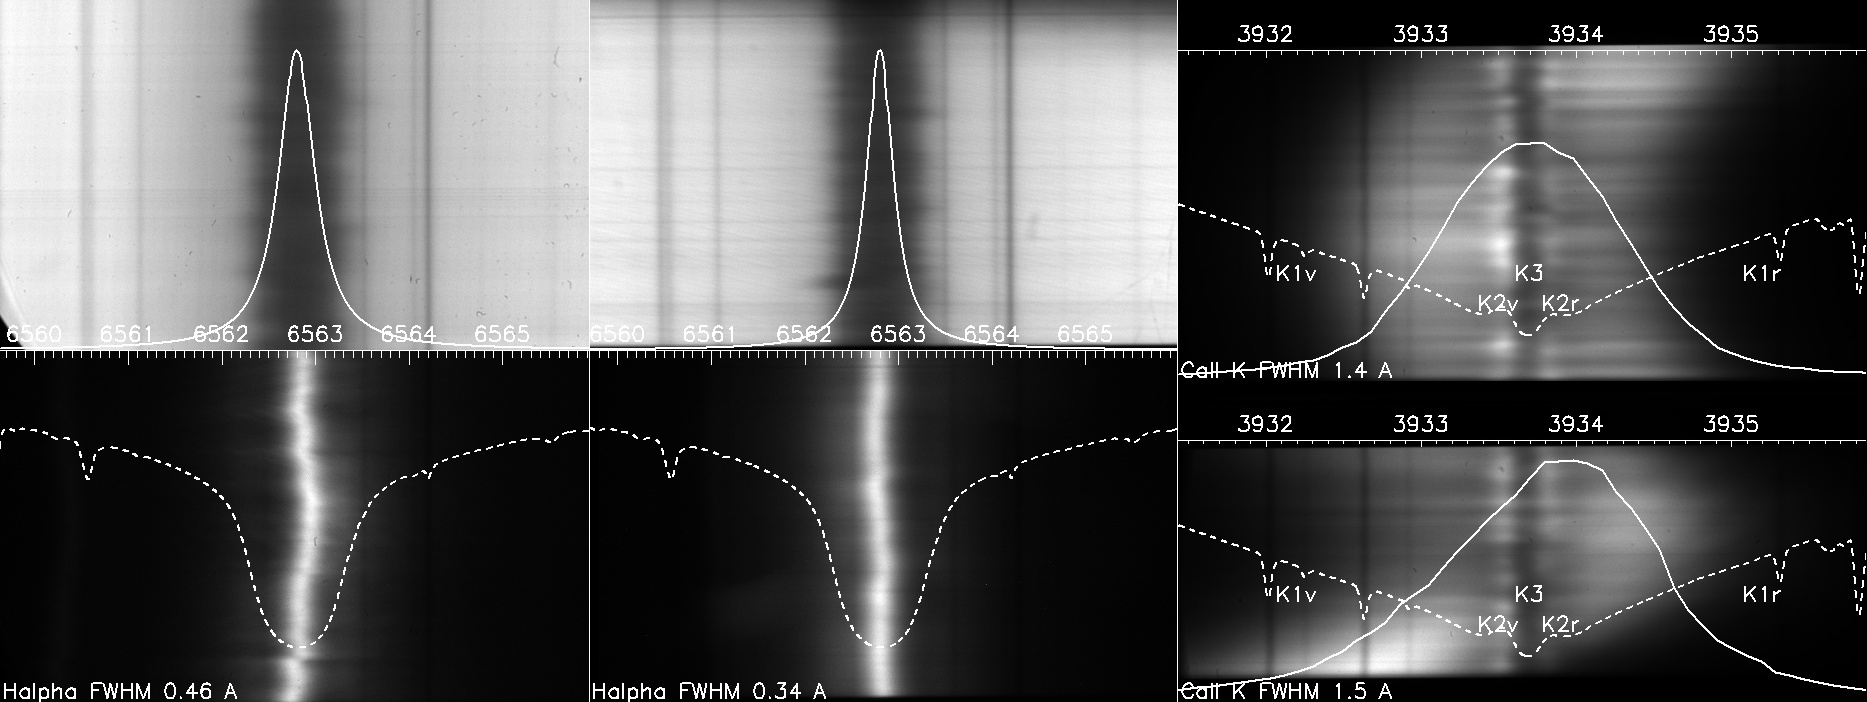
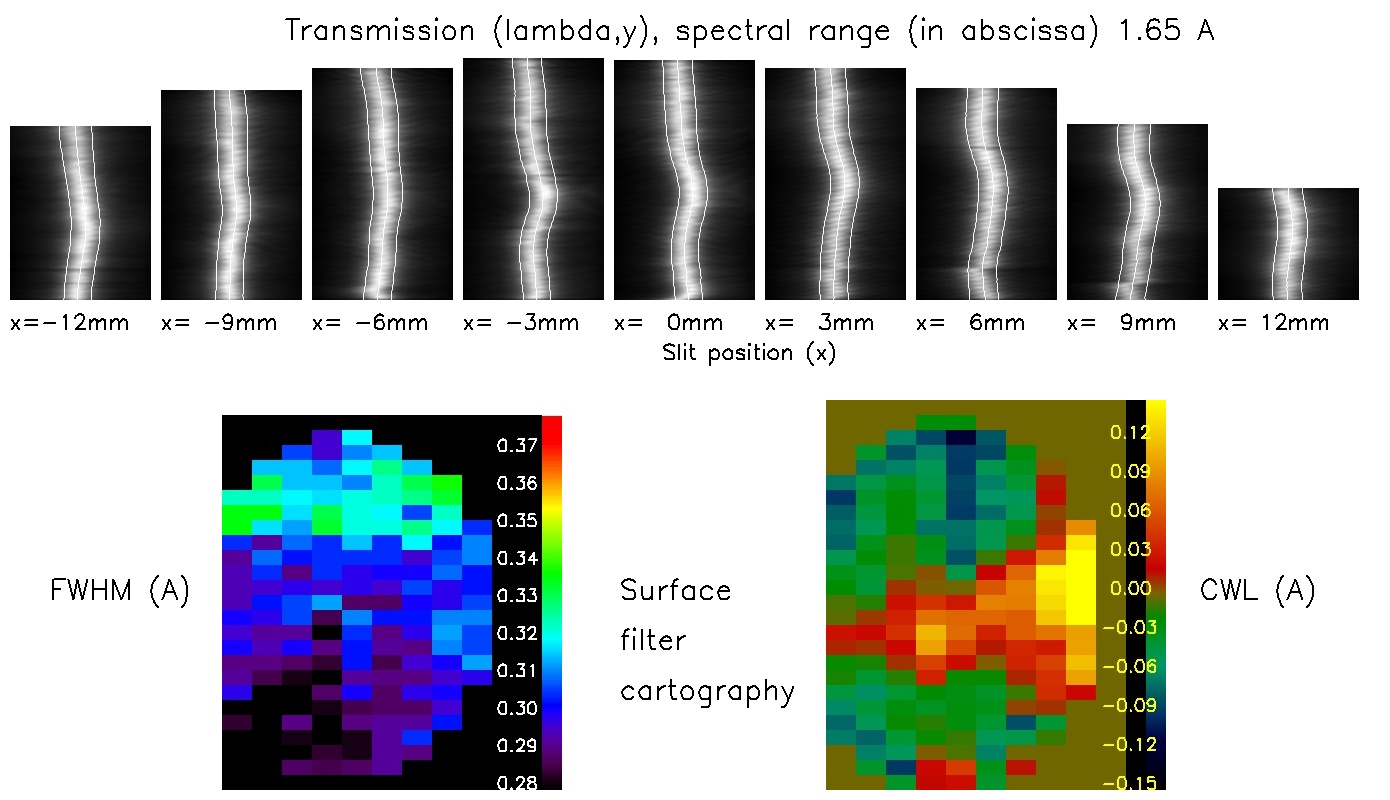
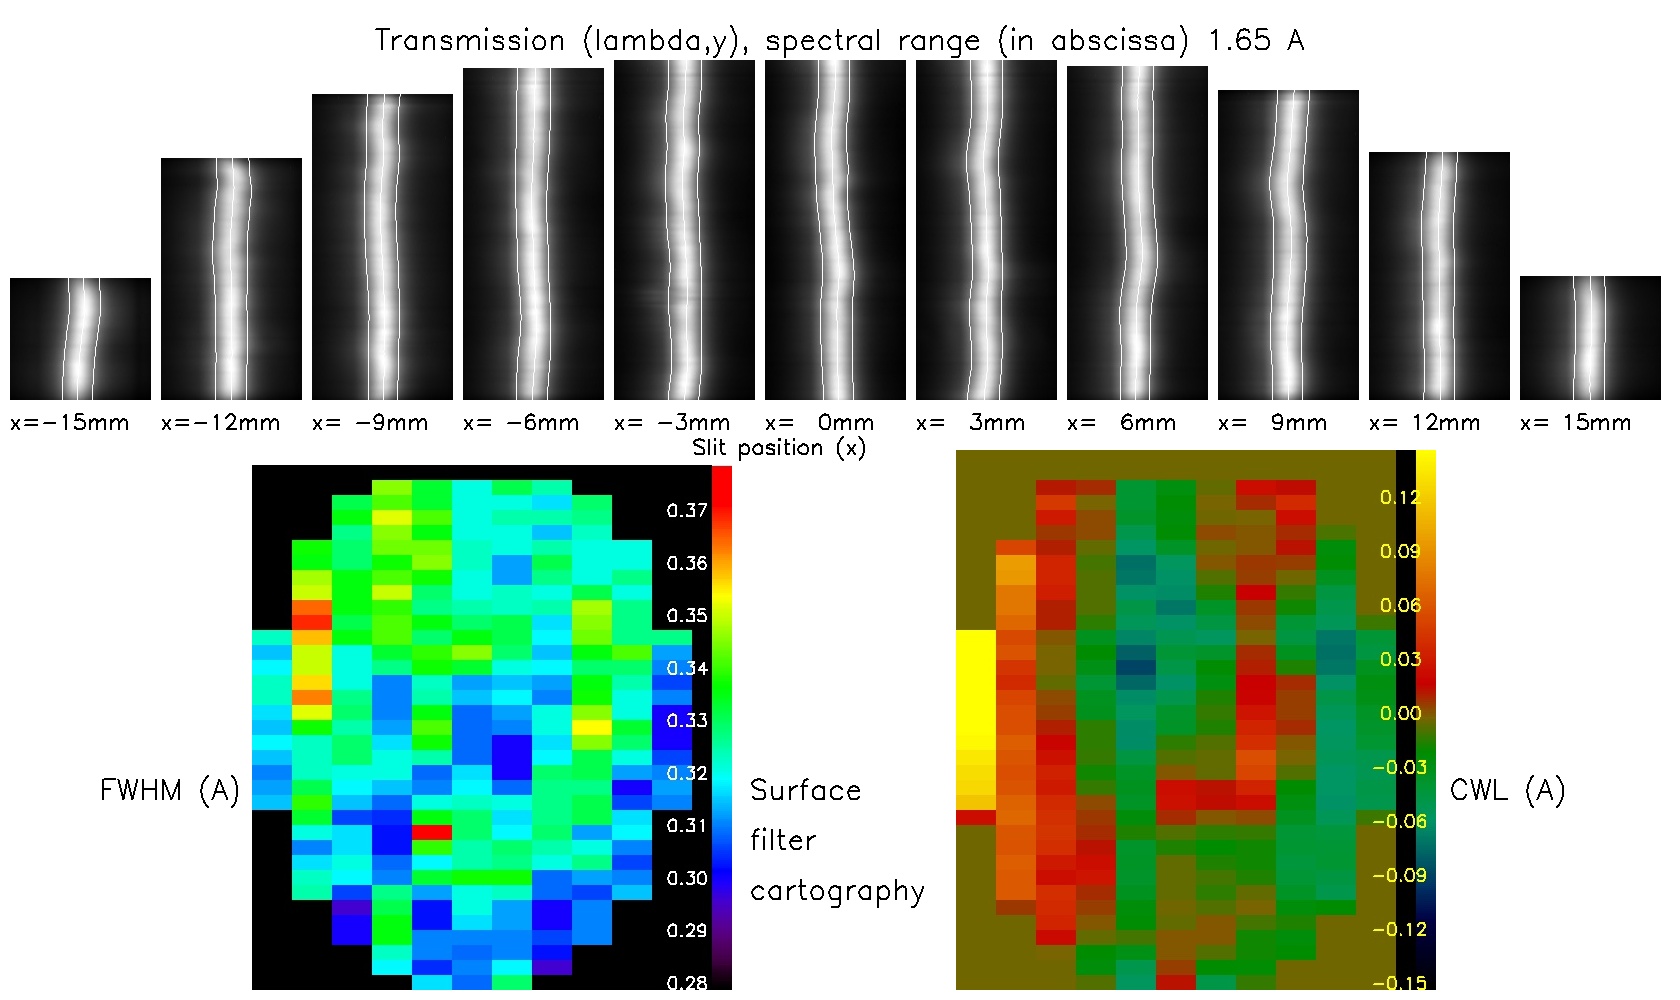
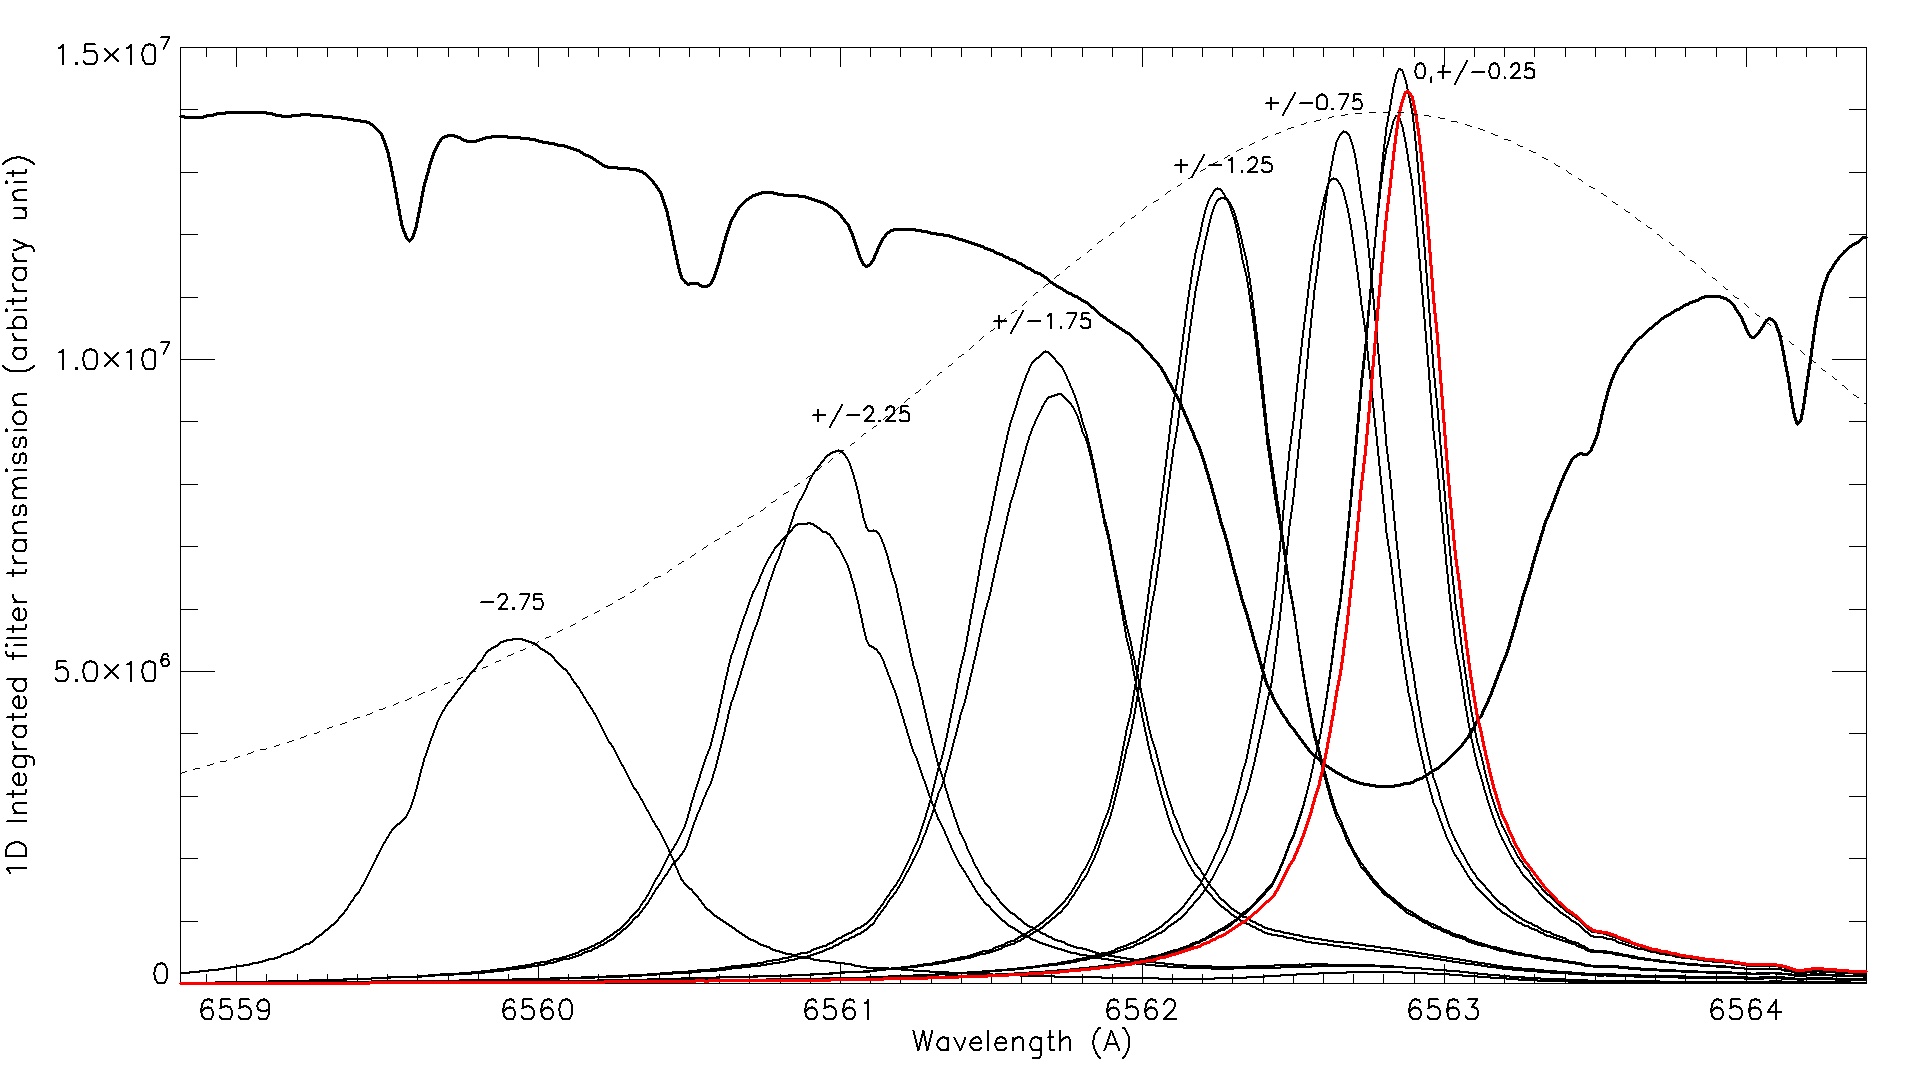
The calibration of Fabry-Pérot filters has been done with the spectrograph of Meudon Solar Tower, at F/75 (much better than the F/30 filter specification), in order 9 (10 mÅ/pixel). Several tests have been performed for both filters. First of all, we made a scan of the surface in order to produce a pupil cartography of the CWL and FWHM (Figures 9 and 10). For that purpose, the filters (31 mm diameter) were translated (-15 mm x 15 mm) in front of the spectrograph slit by x = 3 mm steps. (, y) spectral images, with and without filters, were recorded, for various x-positions (top of figures). The wavelength transmittance was derived at several (x, y) locations. The results show that the FWHM of both filters is locally in the range 0.30-0.35 Å, but also that filter 2 is better than filter 1 in terms of CWL uniformity. By integration on the surface, we computed the resulting bandpass for pupil plane application in afocal systems, leading to 0.46 and 0.34 Å, respectively for filters 1 and 2. The pupil transmittance is Lorentzian shaped in wavelength and drawn in Figure 5 for both filters.
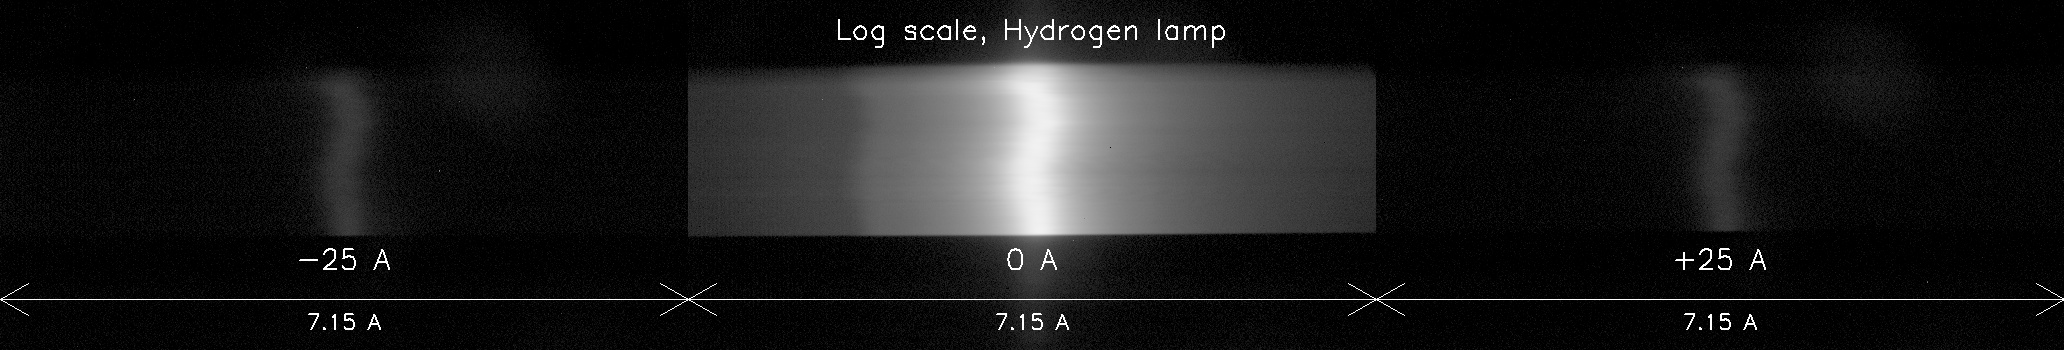
Fabry-Pérot filters have secondary lobes, cut by a blocking filter. We found, for filter 2, that they appear at 25 Å from the main lobe with an intensity of only 0.3% (Figure 11). For that filter (0.34 Å FWHM), the measurements provide the value of the finesse (75), the reflection coefficient of the cavity (0.96) and the interference order for H line (k = 260).
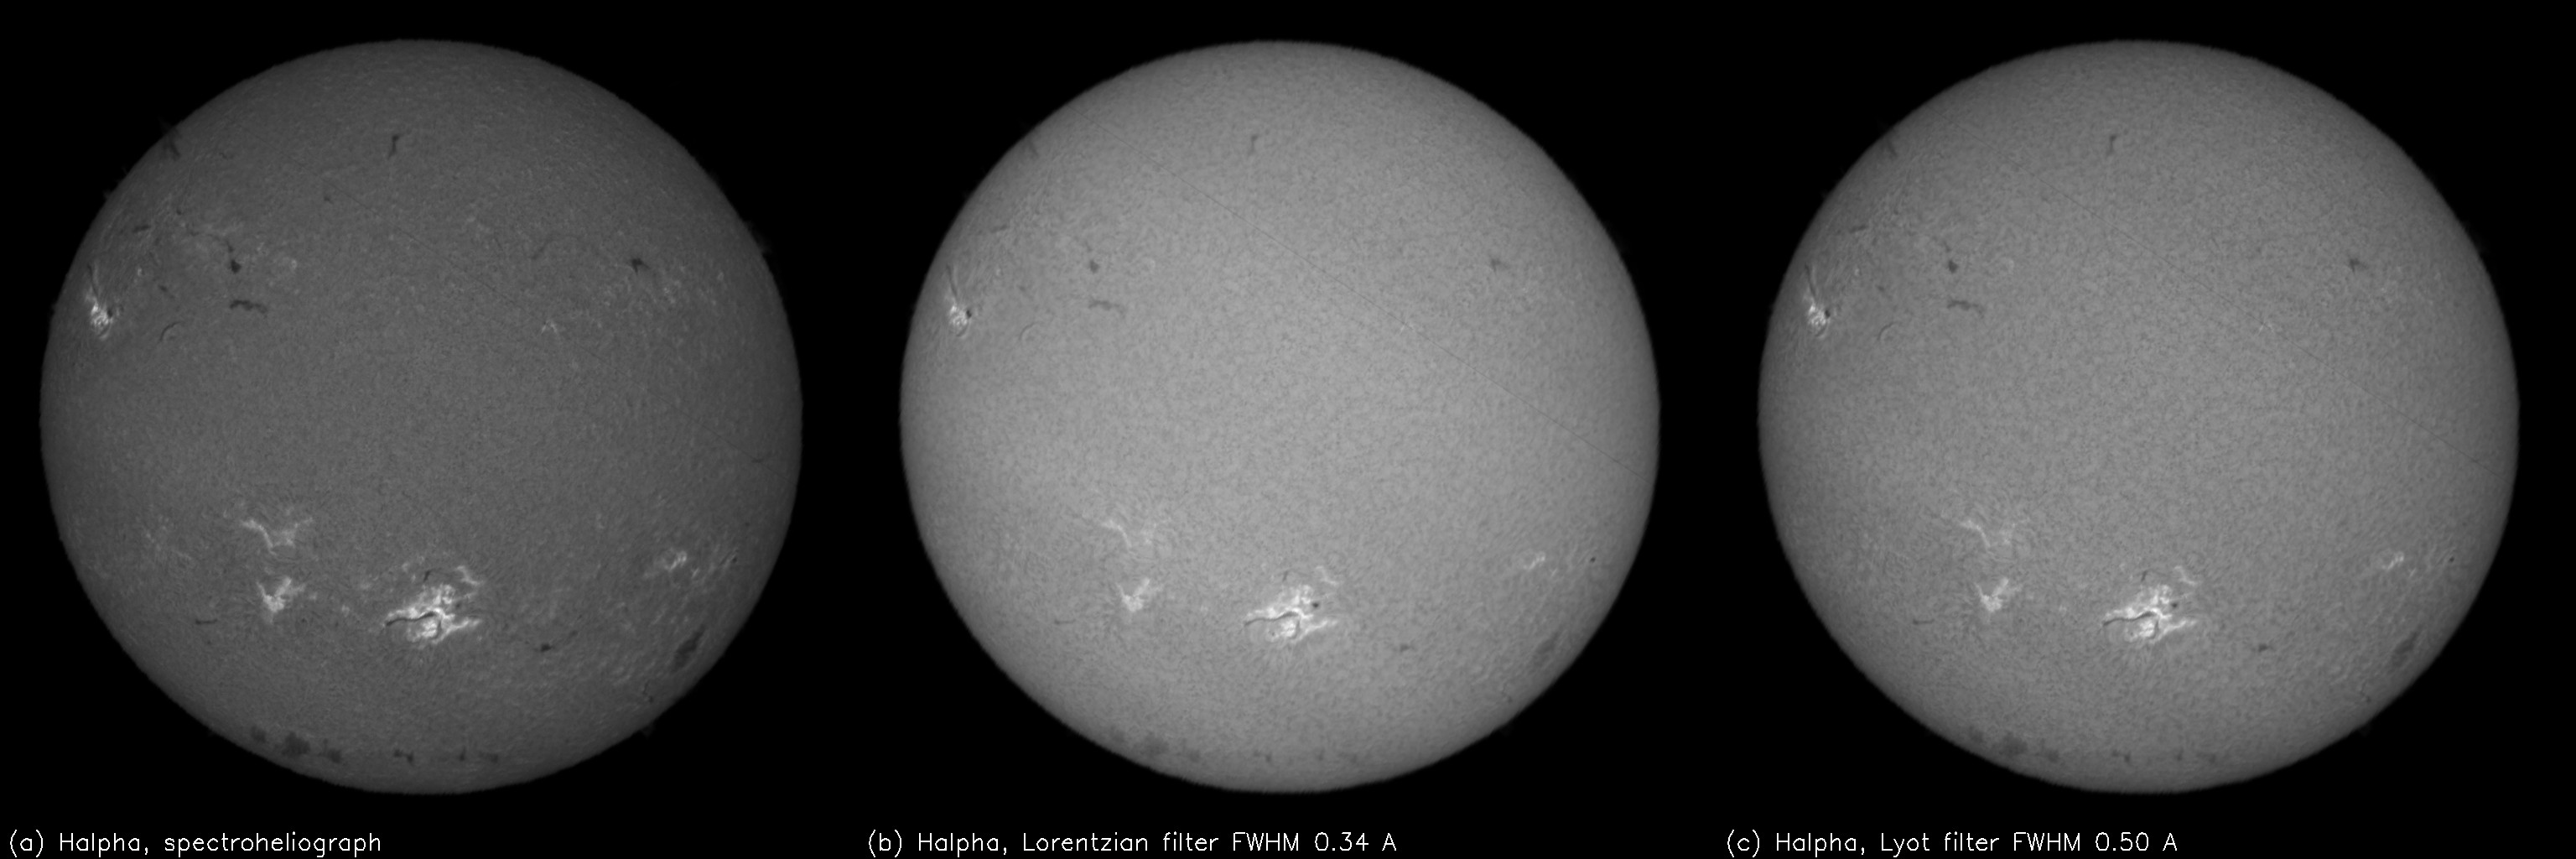
Meudon spectroheliograph data, which are made of 3D (x, y, ) data-cubes (0.155 Å wavelength resolution) allow to simulate images using various transmittances. Figure 12 displays H images with different filter characteristics, such as a Lorentzian transmittance (0.34 Å FWHM) or a 0.50 Å FWHM five stage Lyot transmittance. It clearly shows that a smaller bandwidth is needed for the Fabry-Pérot to produce contrasts similar to the ones provided by Lyot filters. Indeed, the wavelength curve of Lyot filters drastically cuts the line wings, contrarily to Lorentzian filters which have extended wings. Hence, the photospheric light passes in excess and contaminates the contrast of the chromosphere. When 0.50 Å Lyot filters are sufficient to select the chromosphere, narrower (0.30 Å) Fabry-Pérot devices (such as MTSP filter 2) are required for the same result.
The Solar Tower spectrograph allowed us to explore the angular dependance of MTSP filters and precise the tilt sensitivity () in terms of CWL and FWHM fluctuations. This experience also provided an estimate of the effective index of refraction. For that purpose, the filter was tilted in the range -3∘ +3∘ (Figure 13). The mean CWL variations are fitted by the law = K with K = -0.38 or -0.37 Å/degree2, respectively for filters 1 and 2. For the tilt dependance of the mean bandpass, we found FWHM = 0.33 + 0.064 and 0.35 + 0.052 (Å), respectively for filters 1 and 2. This means that, for a 1∘ tilt, the bandpass is locally enlarged to 0.40 Å and blue-shifted of about -0.40 Å. But in the afocal system, at F/30 (half cone angle of 1∘), we have to integrate the above formulae over angles, which generates a blue-shift of -0.19 Å (this value was confirmed by the wavelength line scan made with the filter in imagery mode, which produced results of Figure 15). However, the F/30 cone angle is not the only one to consider. The solar diameter is 0.53∘, which means that the cone incidence varies in the range -0.26∘ +0.26∘. The corresponding blue-shift is, at maximum, -0.024 Å, which can be neglected, so that the CWL should be almost uniform over the solar image.
According to the Fabry-Pérot theory, we have K = - (where is the line wavelength). It allows to derive the effective index of refraction n of the overall filter. We found n 1.62. The distance of secondary lobes is = 25 Å, where k is the interference order (260) and e the thickness of the cavity. Hence, we conclude that e 7.2 mm.
The envelope of transmittance curves of Figure 13 corresponds to the blocking filter. The estimated FWHM is about 4.5 Å; this value, considering a Lorentzian shape, is consistent with the intensity (0.3%) of the secondary peaks of Figure 11.
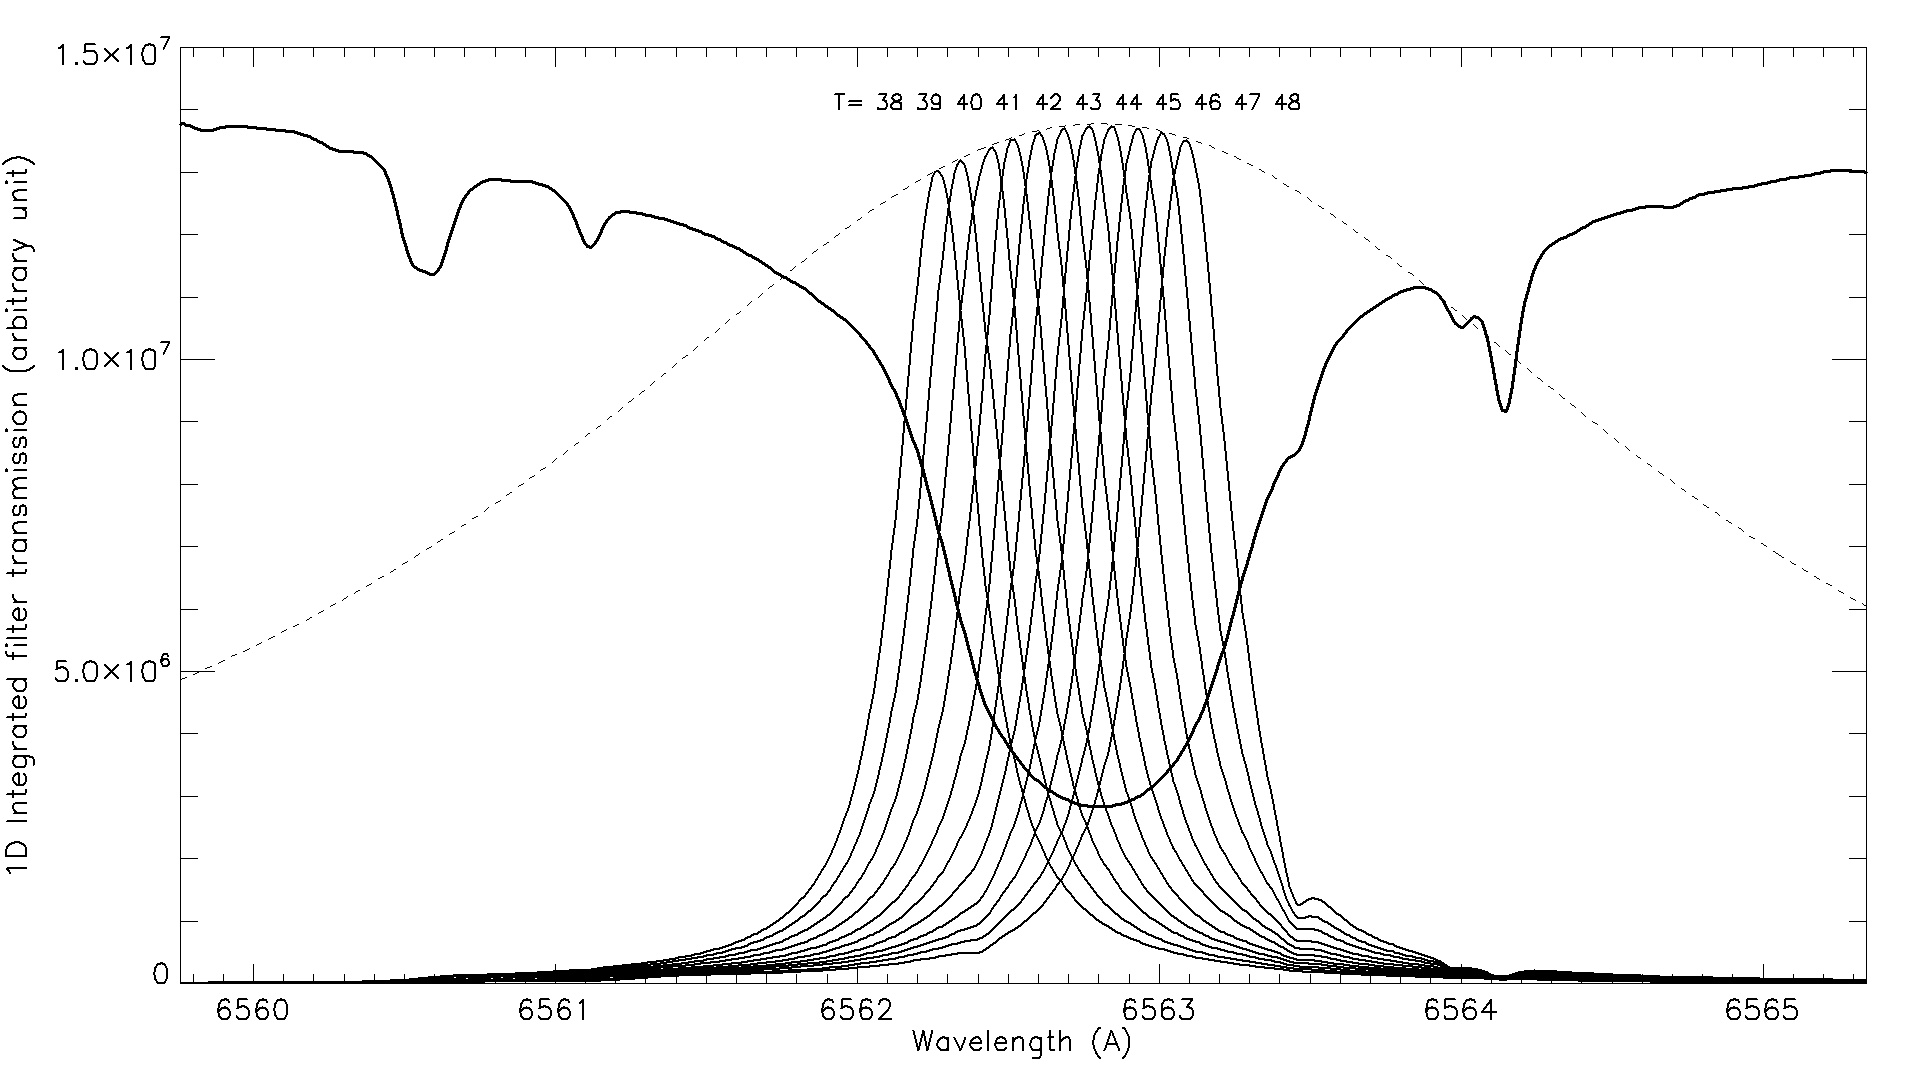
The CWL depends on the temperature T. We investigated, by the spectroscopic means of the Solar Tower, the effect of temperature changes upon filter 2. The transmittance for temperatures varying from 38 to 48∘C is reported in Figure 14. The response is a red-shift corresponding to the linear law = T - 3.84 Å, where T is expressed in ∘C and is the temperature coefficient equal to 0.0874 Å/∘C. Hence, it is possible to explore the 1.0 Å spectral domain centred on the line, but in practice it is a very slow process. We did not notice any FWHM variation with the temperature.
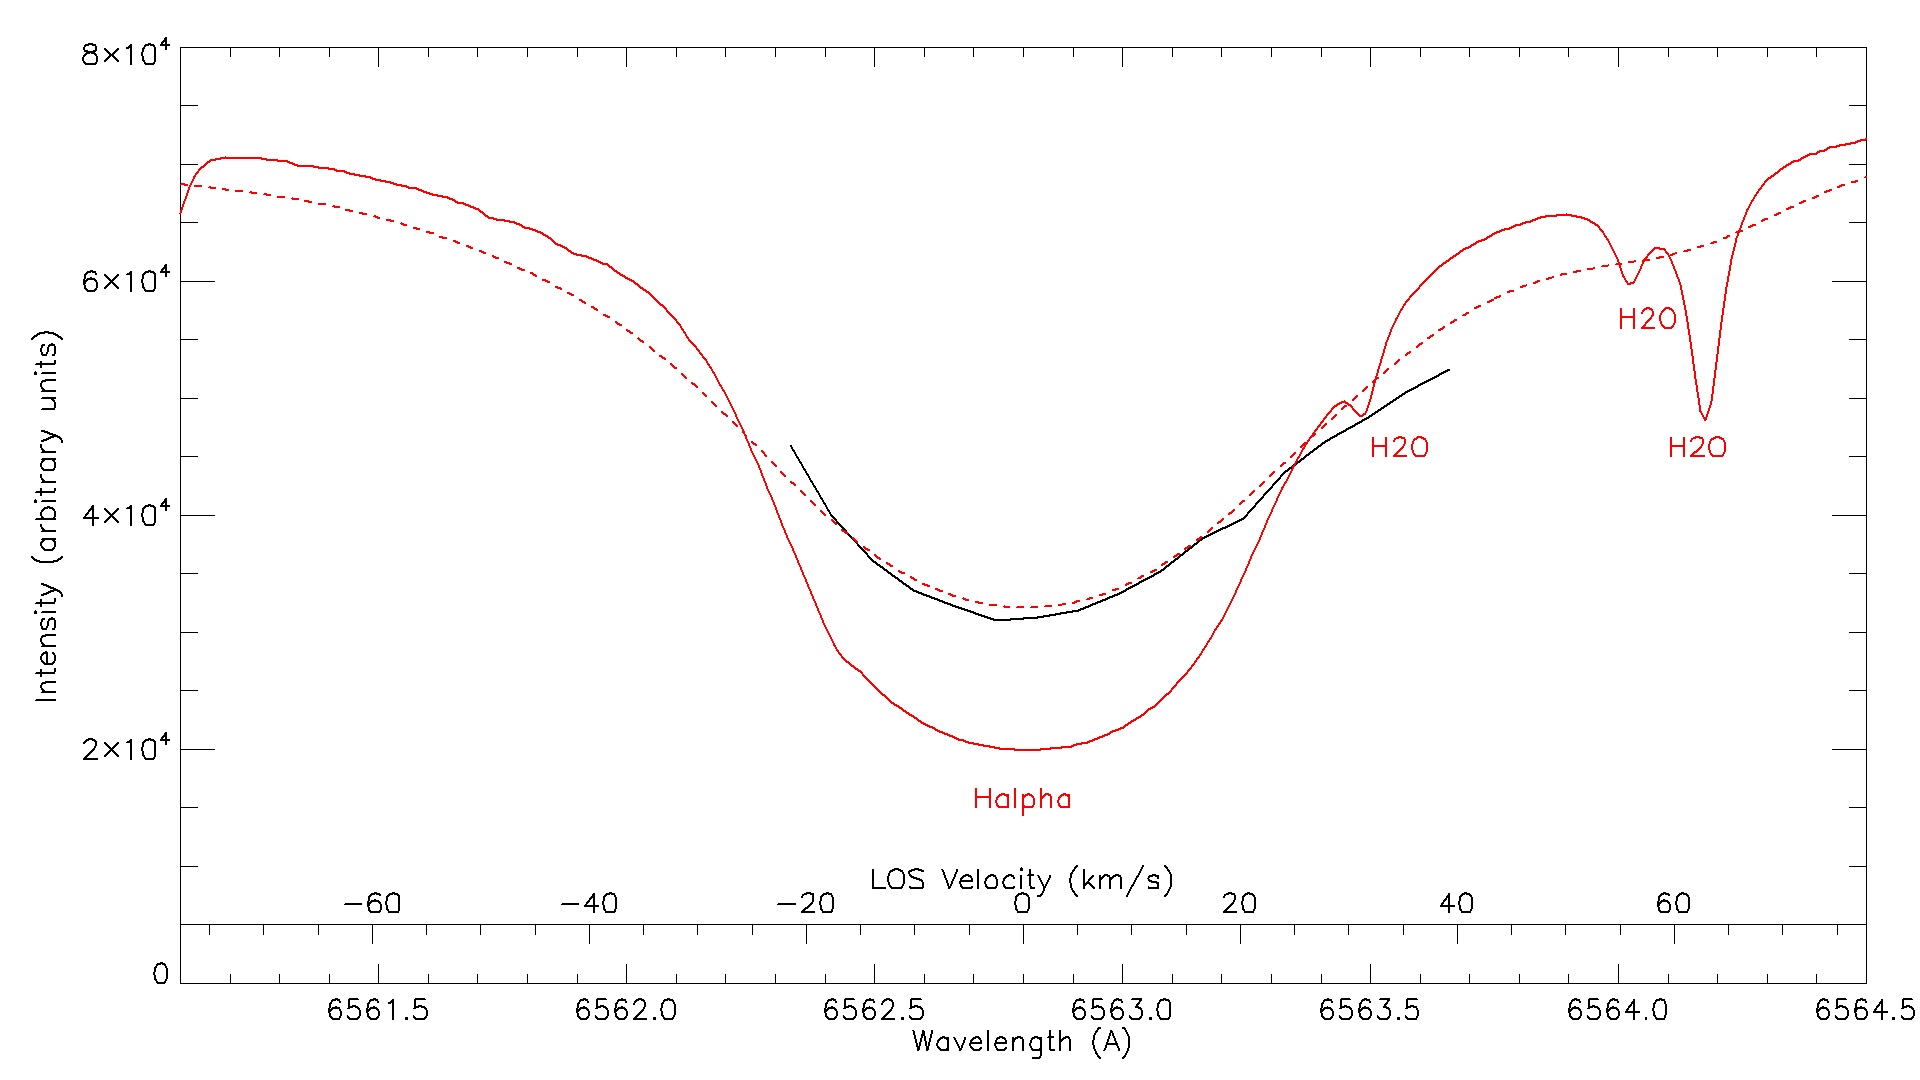
The last qualification test was performed with the filter alone, in image mode, without any spectrograph. Filter 1 was mounted in the MTSP afocal system, and we explored the wavelength range 6562.0-6563.6 Å by temperature variation. It took a long time, because the filter needs 10 minutes to stabilize at each wavelength increment. We recorded also the fluctuations of the solar flux using a scintillometer, in order to correct intensities measured by the filter due to atmospheric variations. Then, we derived the H line profile at the disk centre (Figure 15). We also plotted the line profile got by spectroscopic means, and convolved by the Lorentzian transmittance of the filter, and found both results in good agreement, after correction of the -0.2 Å shift resulting from the F/30 light cone angle.
Finally, Figure 16 presents the typical H observations that are scheduled with the above filters. MTSP will provide almost simultaneously two images, the first one in the line wing (filter 1, either the blue or the red wing, but not both), and the second one in the line core (filter 2). We discuss in the next section the application to the detection of fast evolving Doppler-shifted events, such as Moreton waves, which require at least two H channels and the high observing cadence of 10-15 s.
5 Moreton waves detection
MTSP is particularly well adapted to the detection of highly dynamic events, such as Moreton waves originating in energetic flares. As the filter performances are comparable to those of the previous Meudon routine (1985-2004), we have chosen two events observed with this instrument in order to anticipate MTSP capabilities. Moreton waves appear in H as fronts propagating at typically 500 km s-1. Such velocities in the chromosphere (8000 K) are so highly supersonic (Cs 10 km s-1) and superalvénic (Ca 10 km s-1 for a 10 G magnetic field) that they are unlikely of chromospheric nature. Such phenomena last only a few minutes and are suspected to be the chromospheric counterpart of coronal waves propagating in the 200 times hotter (1.5 MK) and more tenuous corona under the form of fast magnetosonic shocks (Cs 150 km-1, Ca 200 km s-1 for a 10 G field). The downward compression of the chromosphere below the front could be the signature of the coronal shock in H. Moreton waves occur mainly in X-class flares which are rare events (about one event/year above X5, six events above X10 since year 2000). We have chosen the famous X17.2 flare of 28 October 2003 (Figure 17), after the solar maximum of cycle 23, and the X1.8 event of 14 October 1999, just before the maximum (Figure 18). Largest flares often occur during the descending phase of the solar cycle. In Figure 17 (b,c,d respectively for H centre and 0.5 Å), we have subtracted the reference frame just before the event at the same wavelength. Blue/red colours indicate the sign of the resulting image (blue, or positive, means brighter; red, or negative, means darker). The wave (yellow box) appears as a brightening in H core (b). In the red wing subtraction (c), the compression front (R) is negative (or darker) and corresponds to a red-shift. It is followed by the relaxation of the chromosphere (B) appearing positive (or brighter), because blue-shifted. In the blue wing subtraction (d), this is the contrary: R is positive (or brighter), because red-shifted, while B is negative (or darker) with the opposite shift. Figure 15 shows that the order of magnitude of LOS velocities for 0.5 Å shifts is qualitatively 20 km s-1. This example shows that Moreton waves can be detected either by the red or the blue wing. For that reason, MTSP offers only one wing.
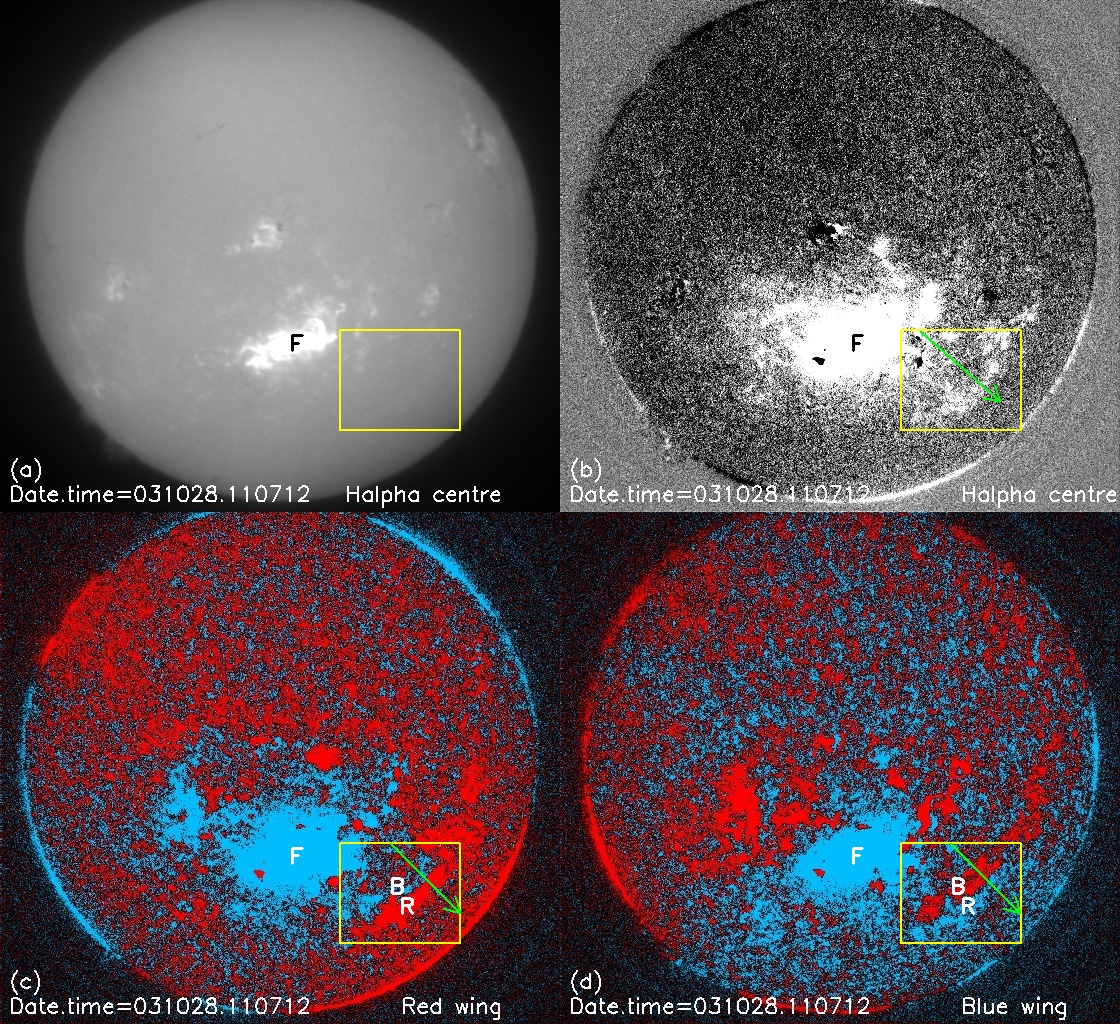
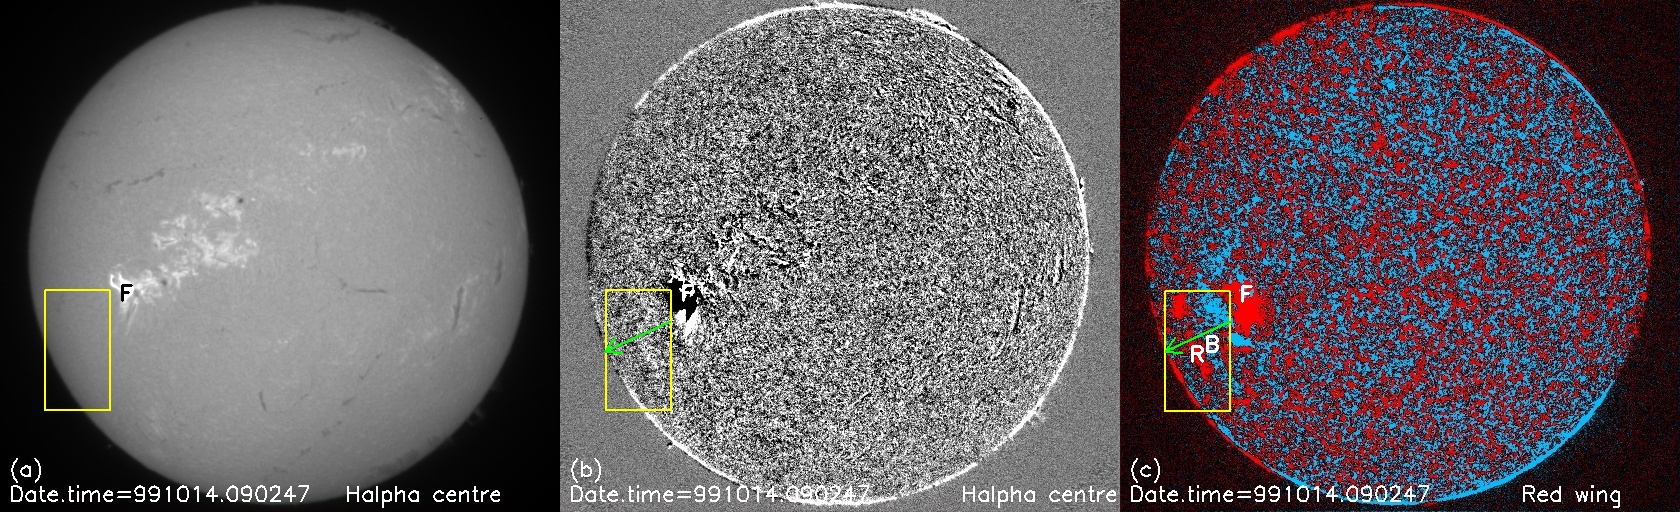
Figure 18 presents the X1.8 flare of 14 October 1999, almost 10 times less energetic than the previous one, so that the Moreton event is less contrasted. It shows exactly what will provide MTSP concerning wave detection with one wing. Most events are waited between 2024 and 2028 around the solar maximum (2025) of cycle 25 (but isolated events, as the X1.0 of 28 October 2021, are possible). The H centre (a) will be provided by telescope 2, from which a reference frame (just before the event) has been subtracted in (b), showing the brightening front. The Moreton event appears clearly in the red wing with the red-shifted compression front (R) followed by the blue-shifted relaxation front (B). The blue wing could either be chosen. The big difference with the 1985-2004 Meudon routine is the observing cadence (4 times faster) and the spatial resolution (2 times better). Hence, MTSP will provide much more detailed informations to investigate the physics of rare phenomena at the Sun.
6 A possible extension for MTSP
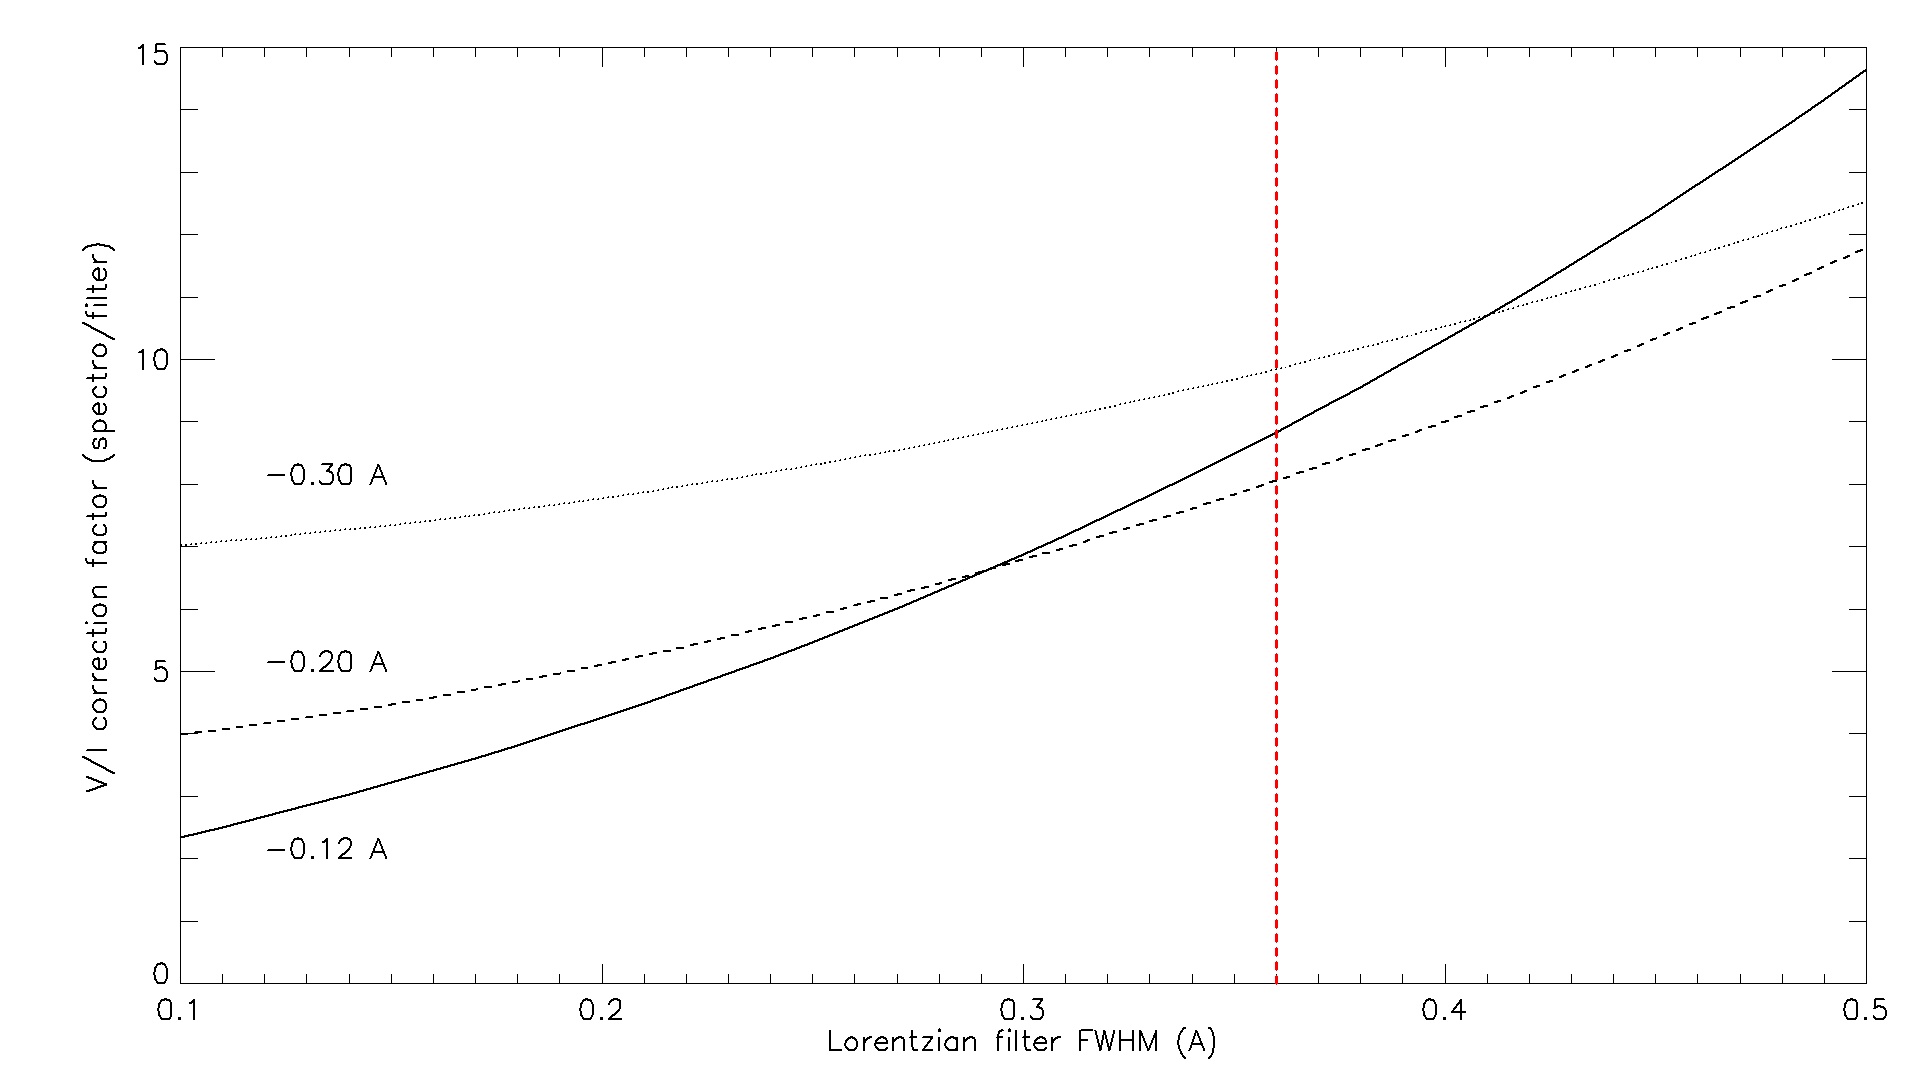
We own a NaD1 5896 Å Fabry-Pérot filter manufactured by DayStar (0.36 Å FWHM), for mounting in an afocal design at F/30 similar to the one of the H telescopes described above. Magnetograms of the Sun have been successfully produced in this line (Landé factor 1.33) by Mount Wilson (full disk) or by the Narrow-band Filter Imager (NFI) onboard HINODE for small regions. NaD1 is a Fraunhofer line formed in the low chromosphere above the FeI 6173 Å line observed in the photosphere by the Helioseismic and Magnetic Imager (HMI) onboard SDO. As DayStar filters are linearly polarizing (made of a birefringent material), the incorporation of a Liquid Crystal Variable Retarder (LCVR) at the primary focus, providing fast modulation (Malherbe et al., 2007) suffice to produce alternatively I+V and I-V images (I, V for Stokes parameters). From the circular polarization rate and the weak field theory (see Stenflo (1994)), it is possible to estimate the LOS magnetic field (BLOS) together with the field polarity. Indeed, is proportional to BLOS and . This quantity depends on the wavelength and is maximum when measured at the inflexion points of the line. Figure 19 displays spectroscopic observations obtained with this method at the 8 m spectrograph of the Pic du Midi Turret Dome. We have numerically at the inflexion points , where BLOS is expressed in Gauss. As the slope of NaD1 wings is steep, Stokes V profiles are sharp. We observed polarization rates up to 0.20 (BLOS 1000 G) in some sunspots. In order to estimate the measurement capabilities in imagery, we have integrated the line profiles over the wavelength transmission of the NaD1 filter. The signal becomes much smaller, because the filter FWHM () is much larger than the half width () of the line derivative , which concentrates the polarimetric signal in a very narrow wave-band (Figure 19). Hence, the corrective factor to apply to the polarization rate is roughly equal to the ratio and plotted in Figure 20 for various CWL and values. Despite of the signal loss due to wavelength integration, it is of interest to consider polarimetric measurements in imagery. For that purpose, a NaD1 telescope will be tested at Meudon in the coming year in the context of a possible extension for MTSP. As the polarization rate to measure with the filter has the same order of magnitude than the photon noise of a single exposure (1% or 400 G), it is necessary to acquire many frames in order to select best images and reduce the noise, as done by Roudier et al. (2006). For example, 100 couples (I+V, I-V) will decrease the noise to 40 G. 20 G should be achieved with either 2 2 binning or with 400 couples. It must be noticed that a fast observing cadence is not required for LOS magnetograms, because the magnetic field evolves on longer time scales. The method is also, in principle, valid for the H telescopes, but in practice, H is a broad line and the sensitivity to the magnetic field is reduced by the factor 6 in comparison to NaD1.

7 Conclusion
The MTSP project is dedicated to the survey of fast evolving events in the chromosphere at the source of solar activity, such as flares and coronal mass ejections. Large flares often occur after the solar maximum (2025 for the present cycle) during a few years. MTSP, with an outstanding cadence of 10-15 s, has also the major goal to investigate Moreton waves, which are extremely fast and rare phenomena associated with largest flares. Such events are difficult to detect in the chromosphere, so that only a few cases have been studied. With systematic, fast and multi-channel observations (two H and one CaII K telescopes), MTSP will increase the chances to catch such phenomena. Data could be combined to SDO/AIA observations of the low corona at slower cadence (45 s) in several EUV channels. MTSP will operate automatically at Calern observatory (1270 m) under good seeing and climatic conditions. High cadence observations will be freely delivered, without any delay, to the international community through a dedicated database located at Nice computer centre. MTSP will cover cycle 25, from 2023 to, at least, the end of the present decade, where new generation solar synoptic networks could start, such as the Next Generation GONG project (Hill et al., 2019) or the Solar Physics Research Integrated Network Group (SPRING, Gosain et al. (2018)). MSTP will support Solar Orbiter (ESA) and Parker Solar Probe (NASA) operations in the coming years.
8 Disclosure of potential conflicts of interest
The authors declare that they have no conflicts of interest.
9 Data availability statement
The authors declare that the datasets analysed during the current study are publicly available from the corresponding author upon request.
Acknowledgements.
We thank the anonymous referee for useful suggestions and comments. We are indebted to Y. Bresson, C. Renaud (OCA), J.-M. Rees, C. Blanchard (OP) and the technical teams of OP and OCA for their assistance. We are also grateful for financial support to Paris and Nice observatories, the Direction Générale de l’Armement, the IDEX PlasPar, the Programme National Soleil Terre (PNST/INSU/CNRS), the DIM ACAV (Ile de France Region) and the IDEX UCA/JEDI.References
- Admiranto et al. (2015) Admiranto AG, Priyatikanto R, Yus’an U, Puspitaningrum E (2015) Moreton waves and EIT waves related to the flare events of June 3, 2012 and July 6, 2012. In: The 5th International Conference on Mathematics and Natural Sciences, American Institute of Physics Conference Series, vol 1677, p 050014, DOI 10.1063/1.4930675, 1502.04039
- Asai et al. (2012) Asai A, Ishii TT, Isobe H, Kitai R, Ichimoto K, UeNo S, Nagata S, Morita S, Nishida K, Shiota D, Oi A, Akioka M, Shibata K (2012) First Simultaneous Observation of an H Moreton Wave, EUV Wave, and Filament/Prominence Oscillations. Astrophys. J. Lett.745(2):L18, DOI 10.1088/2041-8205/745/2/L18, 1112.5915
- Balasubramaniam et al. (2007) Balasubramaniam KS, Pevtsov AA, Neidig DF (2007) Are Moreton Waves Coronal Phenomena? Astrophys. J.658(2):1372–1379, DOI 10.1086/512001
- Cabezas et al. (2019) Cabezas DP, Asai A, Ichimoto K, Sakaue T, UeNo S, Ishitsuka JK, Shibata K (2019) Dynamic Processes of the Moreton Wave on 2014 March 29. Astrophys. J.883(1):32, DOI 10.3847/1538-4357/ab3a35, 1908.03534
- Chen (2011) Chen PF (2011) Coronal Mass Ejections: Models and Their Observational Basis. Living Reviews in Solar Physics 8(1):1, DOI 10.12942/lrsp-2011-1
- Gosain et al. (2018) Gosain S, Roth M, Hill F, Pevtsov A, Martinez Pillet V, Thompson MJ (2018) Design of a next generation synoptic solar observing network: solar physics research integrated network group (SPRING). In: Evans CJ, Simard L, Takami H (eds) Ground-based and Airborne Instrumentation for Astronomy VII, Society of Photo-Optical Instrumentation Engineers (SPIE) Conference Series, vol 10702, p 107024H, DOI 10.1117/12.2306555
- Grenat and Laborde (1954) Grenat H, Laborde G (1954) Héliographe Monochromatique de Lyot. Annales d’Astrophysique 17:541
- Harvey et al. (2011) Harvey JW, Bolding J, Clark R, Hauth D, Hill F, Kroll R, Luis G, Mills N, Purdy T, Henney C, Holland D, Winter J (2011) Full-disk Solar H-alpha Images From GONG. In: AAS/Solar Physics Division Abstracts #42, AAS/Solar Physics Division Meeting, vol 42, p 17.45
- Hill et al. (2019) Hill F, Hammel H, Martinez-Pillet V, de Wijn A, Gosain S, Burkepile J, Henney CJ, McAteer J, Bain HM, Manchester W, Lin H, Roth M, Ichimoto K, Suematsu Y (2019) ngGONG: The Next Generation GONG - A New Solar Synoptic Observational Network. In: Bulletin of the American Astronomical Society, vol 51, p 74
- Krause et al. (2015) Krause G, Cécere M, Francile C, Costa A, Elaskar S, Schneiter M (2015) Two step mechanism for Moreton wave excitations in a blast-wave scenario: the 2006 December 06 case study. Mon. Not. Roy. Astron. Soc.453(3):2799–2807, DOI 10.1093/mnras/stv1827, 1505.02723
- Krause et al. (2018) Krause G, Cécere M, Zurbriggen E, Costa A, Francile C, Elaskar S (2018) Are CMEs capable of producing Moreton waves? A case study: the 2006 December 6 event. Mon. Not. Roy. Astron. Soc.474(1):770–778, DOI 10.1093/mnras/stx2817
- Lyot (1944) Lyot B (1944) Le Filtre Monochromatique Polarisant et ses Applications en Physique Solaire. Annales d’Astrophysique 7:31
- Malherbe and Dalmasse (2019) Malherbe JM, Dalmasse K (2019) The New 2018 Version of the Meudon Spectroheliograph. Solar Phys.294(5):52, DOI 10.1007/s11207-019-1441-7
- Malherbe et al. (2007) Malherbe JM, Roudier T, Moity J, Mein P, Arnaud J, Muller R (2007) Spectro polarimetry with liquid crystals . Mem. Societa Astronomica Italiana.78:203
- Malherbe et al. (2019) Malherbe JM, Corbard T, Dalmasse K, Meteospace Team (2019) Meteospace, a New Instrument for Solar Survey at the Calern Observatory. Solar Phys.294(12):177, DOI 10.1007/s11207-019-1569-5
- Michard (1965) Michard R (1965) Nouvel Héliographe à l’Observatoire de Meudon. L’Astronomie 79:131
- Moreton (1960) Moreton GE (1960) H Observations of Flare-Initiated Disturbances with Velocities ~1000 km/sec. Astron. J.65:494, DOI 10.1086/108346
- Narukage et al. (2004) Narukage N, Eto S, Kadota M, Kitai R, Kurokawa H, Shibata K (2004) Moreton waves observed at Hida Observatory. In: Stepanov AV, Benevolenskaya EE, Kosovichev AG (eds) Multi-Wavelength Investigations of Solar Activity, vol 223, pp 367–370, DOI 10.1017/S1743921304006143
- Oloketuyi et al. (2019) Oloketuyi J, Liu Y, Zhao M (2019) The Periodic and Temporal Behaviors of Solar X-Ray Flares in Solar Cycles 23 and 24. Astrophys. J.874(1):20, DOI 10.3847/1538-4357/ab064c
- Pulkkinen (2007) Pulkkinen T (2007) Space Weather: Terrestrial Perspective. Living Reviews in Solar Physics 4(1):1, DOI 10.12942/lrsp-2007-1
- Reale (2010) Reale F (2010) Coronal Loops: Observations and Modeling of Confined Plasma. Living Reviews in Solar Physics 7(1):5, DOI 10.12942/lrsp-2010-5, 1010.5927
- Roudier et al. (2006) Roudier T, Malherbe JM, Moity J, Rondi S, Mein P, Coutard C (2006) Sub arcsec evolution of solar magnetic fields. Astron. Astrophys.455(3):1091–1098, DOI 10.1051/0004-6361:20064963
- Schwenn (2006) Schwenn R (2006) Space Weather: The Solar Perspective. Living Reviews in Solar Physics 3(1):2, DOI 10.12942/lrsp-2006-2
- Steinegger et al. (2000) Steinegger M, Hanslmeier A, Otruba W, Freislich H, Denker C, Goode PR, Marquette WM, Varied J, Wang H, Luo G, Chen D, Zhang Q (2000) An Overview of the New Global High-Resolution H-alpha Network. Hvar Observatory Bulletin 24(1):179
- Stenflo (1994) Stenflo J (1994) Solar Magnetic Fields: Polarized Radiation Diagnostics, vol 189. DOI 10.1007/978-94-015-8246-9
- Temmer (2021) Temmer M (2021) Space weather: the solar perspective. Living Reviews in Solar Physics 18(1):4, DOI 10.1007/s41116-021-00030-3, 2104.04261
- Ueno et al. (2010) Ueno S, Shibata K, Ichimoto K, Kitai R, Nagata S, Kimura G, Nakatani Y (2010) Continuous H-alpha Imaging Network Project (CHAIN) with Ground- based Solar Telescopes for Space Weather Research. African Skies 14:17
- Warmuth (2015) Warmuth A (2015) Large-scale Globally Propagating Coronal Waves. Living Reviews in Solar Physics 12(1):3, DOI 10.1007/lrsp-2015-3
- Zhang (2001) Zhang H (2001) Moreton wave and its source of disturbances in the X12/3B WLF of AR6659 in 1991 June 4. Astron. Astrophys.372:676–685, DOI 10.1051/0004-6361:20010379
- Zhang et al. (2011) Zhang Y, Kitai R, Narukage N, Matsumoto T, Ueno S, Shibata K, Wang J (2011) Propagation of Moreton Waves. Pub. Astron. Soc. Japan63:685, DOI 10.1093/pasj/63.3.685