VLBI astrometry on the white dwarf pulsar AR Scorpii
Abstract
AR Scorpii (AR Sco), the only-known radio-pulsing white dwarf binary, shows unusual pulsating emission at the radio, infrared, optical and ultraviolet bands. To determine its astrometric parameters at the radio band independently, we conducted multi-epoch Very Long Baseline Interferometry (VLBI) phase-referencing observations with the European VLBI Network (EVN) at 5 GHz and the Chinese VLBI Network (CVN) plus the Warkworth 30-metre telescope (New Zealand) at 8.6 GHz. By using the differential VLBI astrometry, we provide high-precision astrometric measurements on the parallax ( mas), and proper motion ( mas yr-1, mas yr-1). The new VLBI results agree with the optical Gaia astrometry. Our kinematic analysis reveals that the Galactic space velocities of AR Sco are quite consistent with that of both intermediate polars (IPs) and polars. Combined with the previous tightest VLBI constraint on the size, our parallax distance suggests that the radio emission of AR Sco should be located within the light cylinder of its white dwarf.
keywords:
white dwarfs – pulsars: individual: AR Sco – parallaxes – techniques: high angular resolution – radio continuum: stars1 Introduction
AR Scorpii (AR Sco) is a white dwarf (WD)/M-type star binary with an orbital period of h and a WD spin period of min (Marsh et al., 2016). Unusual pulsations in short timescales of a period of min are detected at multiple bands (ultraviolet, optical, infrared and radio). Its non-synchronous spin and orbital periods imply a connection with a class of stars known as intermediate polars (IPs, e.g. Patterson, 1994), whereas its weak X-ray radiation distinguishes itself from usual IPs (Takata et al., 2018). The strong radio emission and broadband spectral energy distribution of AR Sco are similar to those of a special IP system AE Aquarii (Bookbinder & Lamb, 1987; Oruru & Meintjes, 2012). However, the radio pulsation properties of AR Sco were unique among WD systems.
The exact emission mechanism of AR Sco is still unclear and a large number of models have been proposed to interpret its unique observed behaviour. Marsh et al. (2016) proposed scenarios where the pulsed emission came from collimated fast particle outflows or the direct interaction of the magnetosphere of the WD with the M companion. Geng et al. (2016) suggested that the WD’s rotational axis was nearly perpendicular to its magnetic axis, and the magnetic interaction occurred when the WD’s open field line beams swept the secondary’s wind. Katz (2017) also proposed a misaligned-spin model and supposed a precessing spin axis to explain the displacement of the optical maximum from conjunction of this system, but suggested that the magnetic interaction occurs within the MD’s atmosphere. Garnavich et al. (2019) investigated the possible existence of magnetic loops or prominence of the M star, the magnetic interaction with these may contribute to the system’s emission. The energy that comes from AR Sco may be generated through magneto-hydrodynamic interactions (Buckley et al., 2017) or fast magnetic reconnection events (Garnavich et al., 2019), and Bednarek (2018) discussed a hadronic model.
Accurate astrometry on AR Sco will allow us to constrain its physical properties (e.g. velocity, luminosity, emission region size). It helps to validate the theoretical models, to trail the evolutionary history, and to explore the possibility of this system being a future source of detectable gravitational wave emission (Franzon & Schramm, 2017). For AR Sco, Marsh et al. (2016) gave a rough estimate of the distance of pc, based on the spectra and photometry of the M star in optical and infrared. By combining with the first Gaia Data Release (Gaia Collaboration et al., 2016), the fifth US Naval Observatory CCD Astrograph Catalog (Zacharias et al., 2017) obtained a proper motion estimate of mas yr-1, mas yr-1 in optical. Based on optical astrometric measurements, the Gaia Early Data Release 3 (Gaia EDR3, Gaia Collaboration et al., 2021) provided a parallax estimate of mas and proper motion estimates of mas yr-1, mas yr-1 for AR Sco. Our goal was to determine the astrometric parameters of AR Sco with the technique of Very Long Baseline Interferometry (VLBI) at the radio band. As the only technique that can derive high precision positions of target sources comparable to Gaia, VLBI could provide new and independent astrometric results to validate the Gaia results.
In this paper, we present new astrometric measurements for AR Sco from the European VLBI Network (EVN) and the Chinese VLBI Network (CVN) plus Warkworth 30-m radio telescope observations over a period of years. We describe the observations and data reduction in Section 2. The high precision astrometric results are presented in Section 3. We compare our VLBI results with those from Gaia’s, and analyse the kinematics and physical parameters of AR Sco in Section 4. Finally, we summarise the study in Section 5.
2 Observations and data reduction
2.1 EVN observations and data reduction
Our EVN observations of AR Sco at 5 GHz were conducted in e-VLBI mode (Szomoru, 2008) at five epochs between 2017 February and 2018 January. Table 1 lists the observing dates, the participating stations and the time durations. The raw data were at a data rate of 2048 Mbps (dual polarisation, 832 MHz bandwidth per polarisation, two-bit quantisation) and correlated in real-time (e-EVN mode) by the SFXC software correlator (Keimpema et al., 2015) at JIVE (Joint Institute for VLBI ERIC, the Netherlands).
| Project | Date | Freq. | Participating Stationsa | Duration | Detection |
|---|---|---|---|---|---|
| Code | (GHz) | (h) | |||
| EL058A | 2017 Feb 15 | 5.0 | Ef, Jb, Mc, Nt, O8, Tr, Ys, Wb, Hh | 4.4 | No |
| EL058B | 2017 Apr 12 | 5.0 | Jb, Mc, Nt, O8, Tr, Ys, Wb, Hh, Ib | 4.0 | Yes |
| EL058C | 2017 Jun 20 | 5.0 | Ef, Jb, Mc, Nt, Tr, Ys, Wb, Hh, Ir | 4.0 | Yes |
| EL058D | 2017 Sep 19 | 5.0 | Ef, Jb, Nt, O8, Tr, Ys, Wb, Hh, Ir | 3.8 | Yes |
| EL058E | 2018 Jan 17 | 5.0 | Ef, Jb, Mc, Nt, O8, Tr, Hh, Ir | 3.9 | No |
| CC001A | 2017 Sep 25 | 8.6 | Sh, T6, Km, Ur, Wa | 6.5 | No |
| CC001B | 2017 Dec 19 | 8.6 | Sh, T6, Km, Ur, Wa | 6.2 | Yes |
| CC001C | 2018 May 11 | 8.6 | Sh, T6, Km, Ur, Wa | 6.8 | Yes |
| CC001D | 2018 Jul 30 | 8.6 | Sh, Km, Ur, Wa | 6.9 | No |
| CC001E | 2018 Sep 13 | 8.6 | T6, Km, Ur | 6.9 | Yes |
a Ef: Effelsberg (100 m), Jb: Jodrell Bank MKII (3825 m), Mc: Medicina (32 m), Nt: Noto (32 m), O8: Onsala-85 (25 m), Tr: Torun (32 m), Ys: Yebes (40 m), Wb: Westerbork (25 m), Hh: Hartebeesthoek (26 m), Ir: Irbene (32 m), Ib: Irbene (16 m), Sh: Shanghai (25 m), T6: Tianma (65 m), Km: Kunming (40 m), Ur: Urumqi (26 m), Wa: Warkworth (30 m).
The observations of AR Sco were performed with the two phase-referencing calibrators: PKS J16252527 (J16252527, e.g. Fey et al., 1996) and PMN J16212241 (J1621-2241, Griffith et al., 1994). The primary calibrator J16252527 located 27 away from AR Sco was selected from Astrogeo Centre111http://astrogeo.org/calib/search.html. The secondary calibrator J16212241 was selected based on our pilot short VLBI observation (project code: RSC03) at 5 GHz. It is 12 arcmin away from AR Sco, and shows a point-like structure with a peak brightness of mJy beam-1. The cycle time was about 6 minutes: min for the primary calibrator, min for the target, and min for the gap. The secondary calibrator was observed for one min scan per three cycles. This additional faint calibrator allows us to run a further iteration of the phase-referencing calibration to significantly improve the astrometric precision (e.g. Doi et al., 2006; Paragi et al., 2013). Table 2 lists the correlation phase centres for these three sources.
| Source | (J2000) | (J2000) | |
|---|---|---|---|
| AR Scoa | … | ||
| J16252527b | 27 | ||
| J16212241 | 02 |
a The correlation phase centre is only for EL058B. b The position was taken from http://astrogeo.org/vlbi/solutions/rfc_2015a/.
The data reduction was performed with the NRAO Astronomical Image Processing System (aips, Greisen, 2003). The baselines when one or both antennas were pointing below 10 degree elevation or the data were severely corrupted by radio frequency interference, weather, recording or instrumental problems were initially flagged. No correction was made to update the Earth Orientation Parameters or digital sampling bias corrections applied at correlation time by the SFXC correlator. The ionospheric delay was corrected using Jet Propulsion Laboratory Global Ionospheric Maps with the aips task TECOR. We conducted a priori amplitude calibration via standard gain curves and system temperature measurements of participating stations. In case of no available system temperature data, the priori amplitude calibration was conducted using the nominal system equivalent flux densities with the aips task CLCOR. The parallactic angle correction was applied by the task CLCOR. The instrumental phase errors across intermediate frequencies were removed through a manual phase calibration with the primary calibrator J16252527. Global fringe fitting and bandpass calibration were also applied with J16252527. The aips task CALIB was used to compute both amplitude and phase self-calibration corrections for J16252527, and the solutions were transferred to the secondary calibrator J16212241 and the target AR Sco. After these calibrations, the phases of both J16212241 and AR Sco were phase referenced to J16252527. Imaging and self-calibration for J16212241 data were performed in difmap (Shepherd et al., 1994). The clean maps for J16212241 without self-calibration were then loaded into aips, and the position and position uncertainties were derived with the task JMFIT. In our experiments, the secondary calibrator J16212241 was regarded as a stationary reference source. We set J16212241 at its correlation phase centre with a point model and used the aips task CALIB to derive phase corrections, and the corresponding solutions were applied to J16212241 and AR Sco. This step could improve the final image fidelity of AR Sco. And AR Sco was phase referenced to J16212241. Finally, we imaged AR Sco in aips.
2.2 CVN plus Wa observations and data reduction
In order to expand the time span of the observations and improve astrometric accuracy, we also conducted VLBI observations of AR Sco at 8.6 GHz with the CVN plus the Warkworth 30-m radio telescope (Wa, Woodburn et al., 2015), located in New Zealand, under the program CC001 at five epochs between 2017 September and 2018 September. Adding Wa to the network allowed us to significantly boost the resolution in the north-south direction. The observing setup is also summarised in Table 1. The data were recorded in the disks at a data rate of 2048 Mbps (16 subbands, 32 MHz filters, right-hand circular polarisation, two-bit quantisation). The correlation was executed with the DiFX software correlator (Deller et al., 2011) at Shanghai Astronomical Observatory.
These CVN plus Wa observations at 8.6 GHz followed the above EVN observing strategy. The data were also reduced and imaged in a very similar way. Moreover, the EOPs and digital sampler bias corrections were performed with the aips task CLCOR and ACCOR, respectively.
3 Results
3.1 VLBI imaging results
The EVN image of the secondary calibrator J16212241 observed on 2017 April 12 is shown in Fig. 1. This image was made with natural weighting and has a noise level of 0.3 mJy beam-1. It shows a point-like source with a peak flux density of 36.4 mJy beam-1. Fitting a circular Gaussian model to the visibility data gave a flux density of mJy and a size of mas. For CVN plus WA observations at 8.6 GHz, the calibrator also shows a point-like source with a mean total flux density of mJy and a mean size of mas.
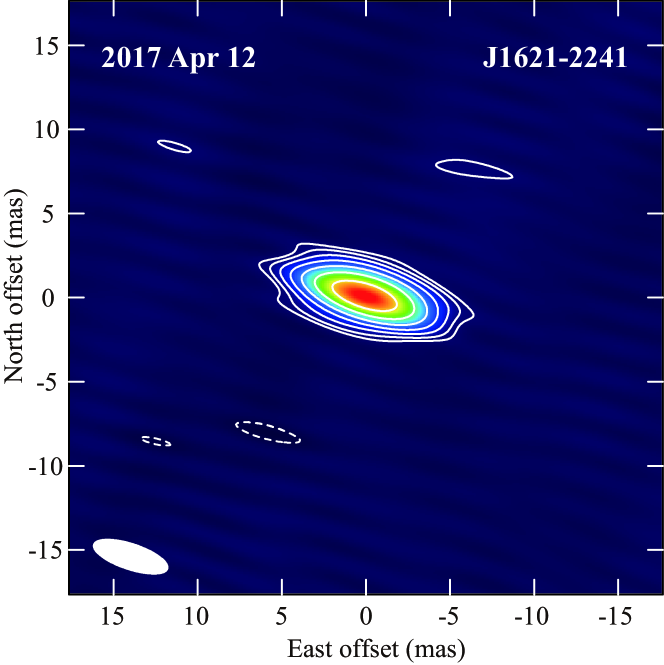
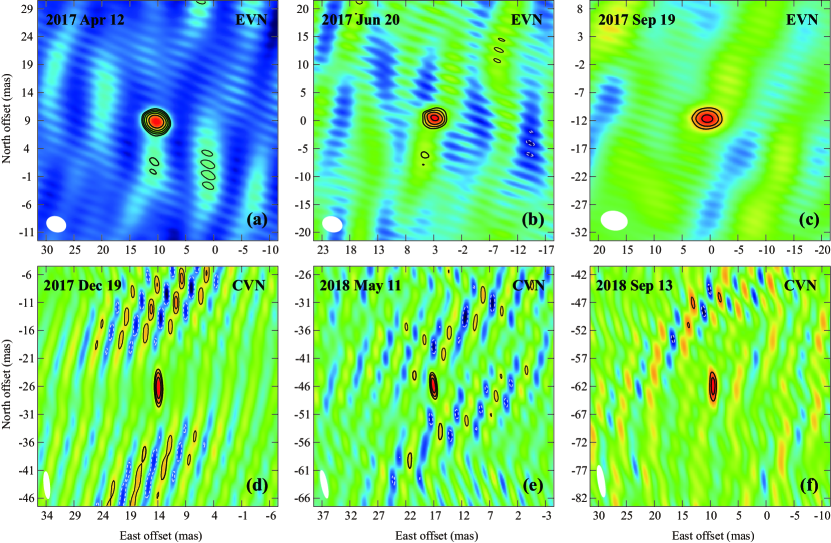
Fig. 2 shows the clean maps of the white dwarf pulsar AR Sco at 5 GHz in the top panels and at 8.6 GHz in the bottom panels. All the images were produced with natural weighting. AR Sco displays an unresolved structure at all epochs. Fitting a circular Gaussian model to the visibility data from the highest SNR epoch EL058B gave a size of mas for AR Sco. The related information is listed in Table 3. The images have relatively higher noise levels than the estimated thermal noise, especially for (c) and (f) listed in Table 3, probably due to a significant sensitivity loss of the 32 MHz digital filters of the digital base band converter 2 system (DBBC2), which was also reported in other EVN observations at similar period (e.g. Yang et al., 2020). To get more reasonable flux density estimates, we scaled the amplitudes by a factor of 1.7 and took a large fraction, 15 per cent, of the flux density as the uncertainty in Table 3. The factor was derived by comparing our flux densities obtained from CVN observations at 8.6 GHz with that obtained from the Australian Long Baseline Array (LBA) observation at 8.4 GHz (Marcote et al., 2017).
The target AR Sco were successfully detected in six epochs. In the other four epochs (EL058A, EL058E, CC001A, CC001D), there were no useful astrometric results because of various issues (antenna failures, weak/no fringes for the calibrators, low observing elevations and incorrect coordinate).
| Panel | MJD | FWHM | PA | SNR | ||||
|---|---|---|---|---|---|---|---|---|
| (day) | (mas) | () | (mJy beam-1) | (mJy beam-1) | (mas) | (mas) | ||
| (a) | 57855.105 | 3.5 2.7 | 70.1 | 7.0 1.1 | … | 18.9 | ||
| (b) | 57924.915 | 3.6 2.7 | 72.8 | 3.2 0.6 | … | 8.9 | ||
| (c) | 58015.664 | 4.7 3.4 | 81.0 | 3.2 0.7 | … | 6.4 | ||
| (d) | 58107.134 | 4.8 1.0 | 5.4 | … | 4.1 0.8 | 8.6 | ||
| (e) | 58249.725 | 5.0 1.0 | 11.6 | … | 6.5 1.2 | 8.8 | ||
| (f) | 58374.439 | 5.7 1.2 | 9.1 | … | 9.4 2.0 | 6.5 |
a Col. 1 - Panel code in Fig. 2, Col. 2 - Modified Julian Day (MJD), Col. 3 - size of the synthesized beam, Col. 4 - position angle, Col. 5 & 6 - peak brightness at 5 GHz or 8.6 GHz, Col. 7 - signal to noise ratio (SNR) of images, and Col. 8 & 9 - relative position offset.
3.2 Astrometry
The position of the extra-galactic reference source J16212241 was obtained from both the EVN observations and the CVN plus Wa observations, with respect to the primary calibrator J16252527. We found that the position dispersion in the EVN observations ( mas, mas) was larger than that in the CVN plus Wa observations ( mas, mas). For the EVN observations, the relatively high latitude of the array caused the difficulty of observing such low declination source, the majority of antennas were pointing at relatively low elevation ( 15°) during observations. The large angular distance between the primary calibrator and the secondary could lead to lobe ambiguities for these low elevation observations. The limited on-source time ( 20 min) for the secondary calibrator could aggravate this condition. These terms cause the large position dispersion for J16212241 in the EVN observations. For the CVN plus Wa observation, the relative lower latitude array and longer on-source time ( 1 h) for J16212241 alleviate this problem. Moreover, the lobe ambiguities will be eliminated for the target when referencing the target to the secondary calibrator, as the secondary calibrator is only 12 arcmin away from the target.
A weighted average method was used to derive the position of J16212241 with the combination of EVN observations and CVN plus Wa observations. First, the arithmetic mean position was calculated from each of the two observational arrays separately. Next, we derived the weighted mean position from the two arithmetic mean positions. The weights of the mean positions from two arrays were set as inversely proportional to the square of their dispersion. As the used calibrator J16252527 is an International Celestial Reference Frame (ICRF) defining source, its position was corrected by its ICRF3222https://hpiers.obspm.fr/icrs-pc/newwww/index.php (Charlot et al., 2020) S/X-band coordinate of mas, mas. Finally, we provided the position of J16212241 of mas, mas, with the uncertainty given by the combination of the uncertainty in the weighted mean position of J16212241 and the uncertainty in the ICRF3 position of J16252527.
With respect to J16212241, we measured the astrometric parameters at the epoch J2018 for AR Sco. The aips task JMFIT was used to derive the radio centroid of AR Sco at each epoch. The final position offsets and the formal position uncertainties are listed in Table 3. These formal position uncertainties are the combinations of the statistical error extracted in the image by the aips task JMFIT and the astrometric error caused by the phase-referencing technology. For the latter, we derived an estimate of 0.07 mas from Pradel et al. (2006) based on the position offset between the target and the secondary calibrator. For the astrometric fit, the effect caused by the potential core shift in the secondary calibrator was considered. No obvious jet structure was detected for the secondary calibrator in our observations. The typical frequency-dependent core shift of 0.11 mas in each direction between 5 GHz and 8.6 GHz (Sokolovsky et al., 2011) was added as a term of systemic error to the position uncertainties which were derived from EVN observations for AR Sco.
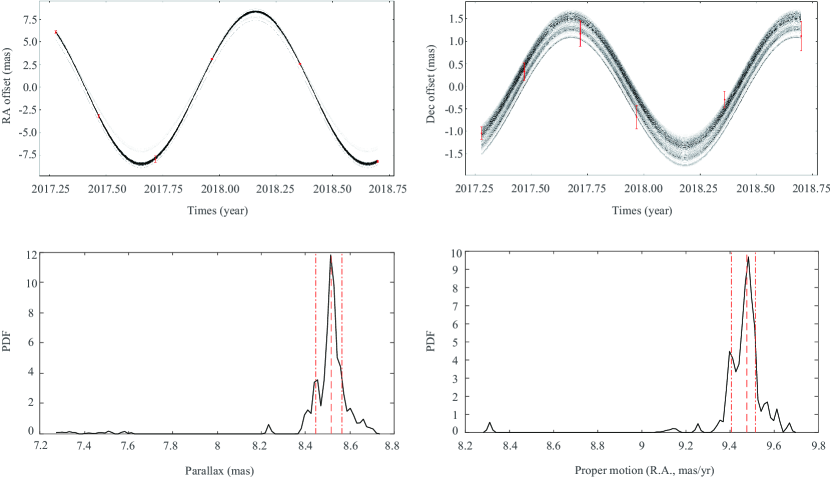
A bootstrap approach (e.g. Efron & Tibshirani, 1991; Deller et al., 2019) for astrometric fit was performed on the position offsets and their uncertainties for AR Sco. We conducted 10 000 times random sampling with replacement from the available six data points. A least-squares fit was performed for each sampled data set. At last, a statistical distribution was obtained for each parameter. Fig. 3 shows the bootstrap astrometric fit and bootstrap histograms for AR Sco. According to the median value and the statistical 68 per cent confidence interval, we derived a parallax of mas. The other astrometric parameters were also derived in the same way and the results are listed in Table 4. Note that we used both the Gaia EDR3 position and our VLBI position of J16212241 to calculate the position of AR Sco, so each result is with respect to the celestial reference frame of Gaia (Gaia-CRF, Gaia Collaboration et al., 2022) and ICRF3, respectively. The position uncertainties of J16212241 were taken into account for estimating the position uncertainties of AR Sco. For the Gaia EDR3 position of J16212241, a median radio–optical positional offset of 0.5 mas from Gaia Collaboration et al. (2022) was added to the position uncertainties.
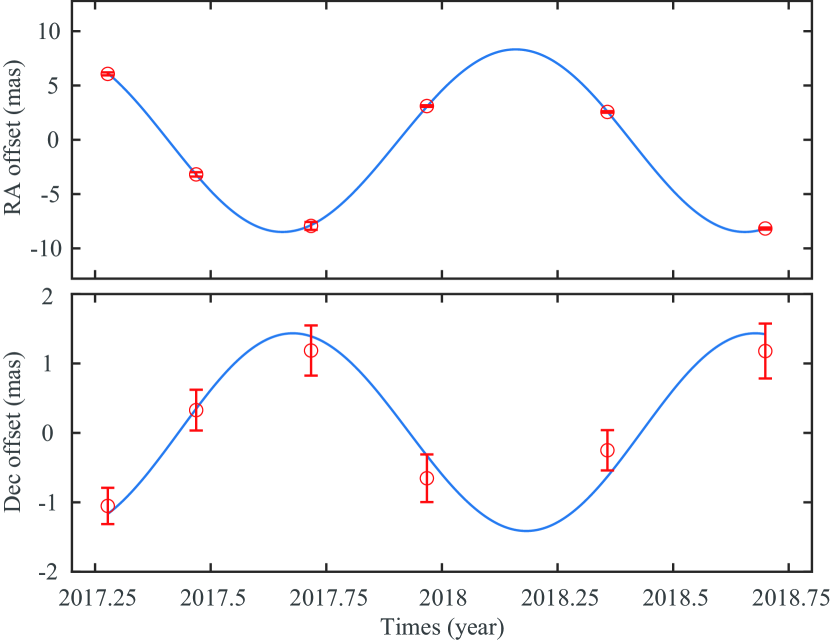
The reduced chi-squared of the least-squares fit was performed to verify the bootstrap astrometric fit. The illustration of the final astrometric fit is shown in Fig. 4. We obtained a parallax estimate of mas and proper motion estimates of mas yr-1, mas yr-1 for AR Sco. All astrometric parameters derived by the reduced chi-squared method are well consistent with those extracted from the bootstrap approach. Therefore, the reduced chi-squared astrometric fit validates the bootstrap results. And we report the bootstrap results as our final results.
| Parameter | This work | This work | Gaia Collaboration |
|---|---|---|---|
| (w.r.t ICRF3) | (w.r.t Gaia-CRF) | et al. 2021 | |
| (h m s) | |||
| () | |||
| (mas yr-1) | |||
| (mas yr-1) | |||
| (mas)a |
a A zero-point correction has been applied to the Gaia parallax.
4 Discussion
4.1 Comparison with results of Gaia EDR3
We obtained independent astrometric measurements for AR Sco at the radio band in Section 3. In optical, Gaia EDR3 provided astrometric results for AR Sco as listed in Table 4. The Gaia position was calculated to epoch J2018 and a direct comparison with our VLBI results can be performed. The position parameters for the VLBI results were derived in both ICRF3 and Gaia-CRF. The differences between the VLBI positions and the Gaia’s are smaller than or close to 1- uncertainties in Gaia-CRF. In ICRF3, the difference in position in R.A. is smaller than 1- uncertainty and the difference in position in decl. is quite close to 2- uncertainty. We note that the uncertainties in the position of AR Sco are dominated by those of its reference source J16212241. Future astrometric VLBI observations for J16212241 will give improved estimates in the position of AR Sco. At present, there is no obvious offset between the optical and radio positions of AR Sco.
For the Gaia parallax, a zero-point correction of mas from Lindegren et al. (2021) and an inflated error bar of 0.040 mas from El-Badry et al. (2021) has been applied to the raw Gaia parallax mas. We found that the VLBI parallax was consistent with the raw Gaia parallax within 1-. But the difference between the VLBI parallax and the zero-point corrected Gaia parallax slightly exceeds 1-. The global parallax bias for Gaia EDR3 measured from a large number of quasars is 17 as (Lindegren et al., 2021). Compared with the global parallax bias, the value of the zero-point correction of mas for AR Sco is relatively large. AR Sco is situated at small Galactic latitude () could explain it, in which a small number of quasars identified and a possible contamination of the quasars sample caused by Galactic stars leads to the difficulty of estimates of zero-point corrections. In addition, the zero-point estimates are well populated by the quasars at magnitude G16. Beyond that region, the uncertainties of the zero-point corrections will be greater (Lindegren et al., 2021). The apparent magnitude of AR Sco in the Gaia G band is 14.99, beyond that region. VLBI astrometric observations of radio stars can validate the quality of Gaia-CRF and help to determine the parallax zero-point of Gaia catalogue (e.g. Bobylev, 2019; Xu et al., 2019; Lindegren, 2020). Our high-precision VLBI results for AR Sco can be used as independent measurements for the aims.
In a word, the VLBI results are consistent with the Gaia result with no obvious offset. Here we derived astrometric parameters for AR Sco with the combination of VLBI and Gaia result. The weighted average method was used to derive new astrometric parameter. The weights of astrometric parameters were set to be inversely proportional to the square of their uncertainties during the calculation. We obtain the parallax ( mas), and proper motion ( mas yr-1, mas yr-1), for AR Sco.
4.2 Kinematics
We computed the Galactic space velocities , and for AR Sco in a right-handed system following Johnson & Soderblom (1987) where , and were measured positive in the directions of the Galactic centre, the Galactic rotation, and the North Galactic Pole, respectively. An assumption of zero radial velocity for the target AR Sco was adopted to calculate the Galactic space velocities (e.g. Sion et al., 2014). A motion of the Sun of (, , ) = (10.1, 13.6, 7.0) km s-1 (Bobylev et al., 2021) relative to the local standard of rest was adopted for the solar motion correction. By using the astrometric results obtained in 4.1, we derived Galactic space velocities of (, , ) = (15.4, 4.8, 14.7) km s-1, corresponding to a total velocity of = 21.8 km s-1, for AR Sco.
For AR Sco, its non-synchronous spin and orbital periods imply a connection with IPs. Takata et al. (2018) categorised AR Sco as an unusual IP directly. However, the lack of Doppler-broadened line emission is indicative of the absence of accretion disks, and the weak X-ray radiation implies that the majority of its luminosity is not attributable to accretion. In contrast, accretion is the main power source for most IPs (e.g. Buckley, 2000). A more reliable hypothesis is that AR Sco represents an evolutionary stage of IPs (Marsh et al., 2016). In this sense, AR Sco could be a progenitor star of IPs (Meintjes, 2017) or a transitional star lying between IPs and traditional polars (Katz, 2017). Moreover, Schreiber et al. (2021) presented evolutionary models for the magnetic WDs in close binary stars and suggested that AR Sco is a progenitor star of polars. AR Sco represents a short spin down phase for strongly magnetic WDs in binaries in their evolutionary sequence. The stage occurs at the beginning of synchronization of the spin and orbital period for strongly magnetic WD binaries and finally polars will be formed.
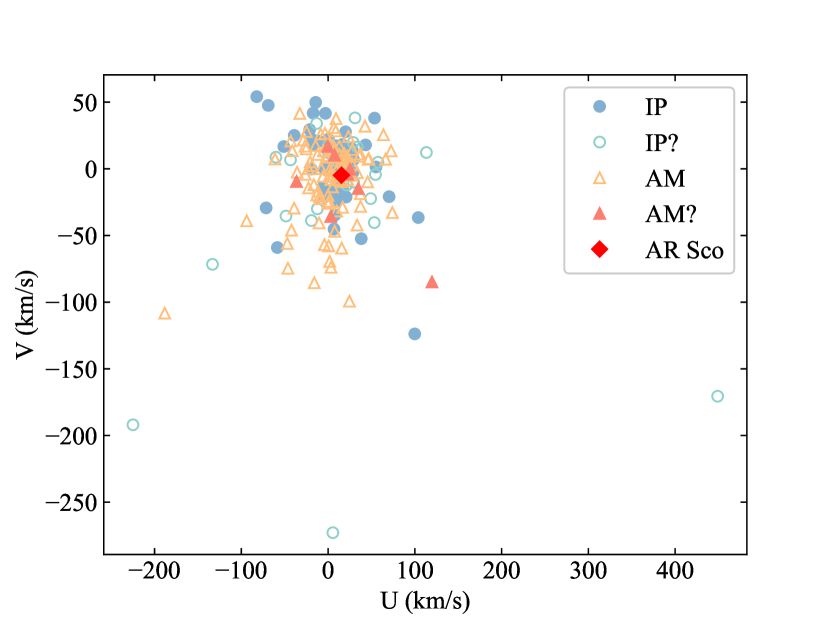
Here we investigate the kinematics of AR Sco relative to a sample of 82 IPs and 107 polars. The kinematics and statistics of IPs and polars can be seen in appendix A. Statistics show that IPs have significantly lower velocity dispersion than IP candidates. Polars have slightly lower velocity dispersion than polar candidates. The kinematic properties of IPs and polars are highly similar to each other, as both IPs and polars are sub-type stars of magnetic cataclysmic variables. In Fig. 5, we plotted space velocity diagram for the sample and AR Sco. Being an unique source, AR Sco, however, is not an outlier with respect to both IPs and polars as shown in Fig. 5. Its Galactic space velocities are quite consistent with that of both IPs and polars. This is reasonable under the assumptions that AR Sco now goes through a short-lived spin-down evolutionary stage of IPs or polars.
4.3 Radio emitting region
The parallax derived from the combinations of VLBI and Gaia results sets AR Sco at a distance of pc. With a source size of 0.17 mas of AR Sco obtained with the LBA at 8.4 GHz reported by Marcote et al. (2017), the distance establishes that the radio emitting region size is cm. The size is only about half the light cylinder radius ( cm) of the WD. This implies that the main radio emission region is situated inside the light cylinder of the WD. The finding is in agreement with what Singh et al. (2020) derived from -ray data and favours the models in which the main radio emission comes from a region near the WD, or the M star as this companion is situated well inside the magnetosphere of the WD (e.g. Geng et al., 2016; Katz, 2017).
4.4 Orbital reflex motion
For AR Sco, the mass of the WD and M star were derived as , , respectively (Marsh et al., 2016). With the measured orbital period d and circular orbit, the orbital radius of the WD is cm, and the orbital radius of the secondary star is cm. Based on the distance of AR Sco, an amplitude of possible reflex motion of as could be expected under the assumption that the non-thermal emission originates from the MD’s atmosphere (e.g. Katz, 2017). For those scenarios in which the radio emission region close to the MD surface (e.g. du Plessis et al., 2022), a smaller amplitude of as may occur. In any case, the amplitude is below the measurement accuracy for our observations. The effect caused by the orbital motion is negligible based on the positions of AR Sco were derived with integral time close to or longer than the orbital period in our measurements. Additionally, the calculations imply that the possible detection of the orbital reflex motion for the non-thermal emission could help to constrain the emitting region location for AR Sco. The microarcsecond VLBI astrometry with high sensitivity will make an effort in the future. For instance, the as goal of astrometry using VLBI with the Square Kilometer Array was suggested to be feasible by using the MultiView technique (Rioja et al., 2017).
4.5 Revisiting other physical parameters
Based on the M star’s spectra and brightness, Marsh et al. (2016) derived a distance estimate pc for AR Sco, assuming that the M star was close to its Roche lobe and its mass . Adopting the distance of 116 pc to the spectral energy distribution of this system, they obtained a maximum luminosity of W. They also measured the orbital period d and the radial velocity amplitude of the M star km s-1, and defined the mass function
| (1) |
where is the orbital inclination.
Our measurements obtained a more accurate distance for AR Sco. A mass of for the M star was derived from the distance-mass relation with our distance. Following the assumption suggested by du Plessis et al. (2019) that the orbital inclination is approximately equal to the observer angle , we solve the mass function (1) with , and derived for the WD. However, the observer angle provided by du Plessis et al. (2019) was derived from polarization position angle data which were averaged over a large range of orbital phase. An updated work performed by du Plessis et al. (2022) shows a variation of in over the orbital period, the is approximately in range from to . Based on these results, we provide a more conservative estimate of for the WD. Our distance also resets the maximum luminosity of W for AR Sco.
Our parallax supports the distance estimated by Marsh et al. (2016), and the recalculation shows that no substantial correction is needed to these physical parameters of AR Sco.
5 Summary
With the EVN observations at 5 GHz and the CVN plus Wa observations at 8.6 GHz, we clearly detected the compact radio emission of the only-known white dwarf pulsar AR Sco in the epochs between 2017 February and 2018 September. Using a nearby calibrator, 12 arcmin apart from AR Sco, we provide high-precision measurements on the parallax ( mas), and proper motion ( mas yr-1, mas yr-1), for AR Sco. The independent measurements are consistent with the Gaia EDR3 reports. Kinematic analysis shows that the Galactic space velocities of AR Sco are quite consistent with that of intermediate polars and polars. Together with the early tightest VLBI constraint on the size, our parallax distance suggests that the radio emission of AR Sco would be located within the light cylinder of its white dwarf. Furthermore, we revisit the mass and luminosity of AR Sco with the parallax distance and confirm the previous estimates reported by Marsh et al. (2016).
Acknowledgements
We thank Sandor Frey, Kazuhiro Hada and the anonymous referee for helpful discussions and constructive suggestions, which resulted in an overall improvement of the paper. This work is supported by the CAS ‘Light of West China’ Program (grant No. 2021-XBQNXZ-005) and the National Natural Science Foundation of China (grant No. U2031212, 11673051 and U1831136). L. C. is also thankful for the support of the Youth Innovation Promotion Association of the CAS (No. 2017084). The European VLBI Network is a joint facility of independent European, African, Asian, and North American radio astronomy institutes. Scientific results from data presented in this publication are derived from the following EVN project codes: RSC03 and EL058. e-VLBI research infrastructure in Europe is supported by the European Union’s Seventh Framework Programme (FP7/2007-2013) under grant agreement number RI-261525 NEXPReS. We are thankful for the observation time of the Chinese VLBI Network and the Warkworth 30m radio telescope operated by the Institute for Radio Astronomy and Space Research, Auckland University of Technology. The computing cluster of Shanghai VLBI correlator supported by the Special Fund for Astronomy from the Ministry of Finance in China is acknowledged. This work has made use of data from the European Space Agency (ESA) mission Gaia (https://www.cosmos.esa.int/gaia), processed by the Gaia Data Processing and Analysis Consortium (DPAC, https://www.cosmos.esa.int/web/gaia/dpac/consortium). Funding for the DPAC has been provided by national institutions, in particular the institutions participating in the Gaia Multilateral Agreement. This research has made use of the SIMBAD database, operated at CDS, Strasbourg, France.
Data Availability
The correlated data of the experiments RSC03 and EL058 are available in the EVN data archive (http://archive.jive.nl/scripts/portal.php). The correlated data of the experiments CC001 can be requested from the corresponding author. The Gaia EDR3 data underlying this article are available in the Gaia Archive (https://gea.esac.esa.int/archive/). The ICRF3 catalogue is available at the website of the International Earth Rotation and Reference Systems Service (https://hpiers.obspm.fr/icrs-pc/newwww/index.php).
References
- Bednarek (2018) Bednarek W., 2018, MNRAS, 476, L10
- Bobylev (2019) Bobylev V. V., 2019, Astronomy Letters, 45, 10
- Bobylev et al. (2021) Bobylev V. V., Bajkova A. T., Rastorguev A. S., Zabolotskikh M. V., 2021, MNRAS, 502, 4377
- Bookbinder & Lamb (1987) Bookbinder J. A., Lamb D. Q., 1987, ApJ, 323, L131
- Buckley (2000) Buckley D. A. H., 2000, New Astron. Rev., 44, 63
- Buckley et al. (2017) Buckley D. A. H., Meintjes P. J., Potter S. B., Marsh T. R., Gänsicke B. T., 2017, Nature Astronomy, 1, 0029
- Charlot et al. (2020) Charlot P., et al., 2020, A&A, 644, A159
- Deller et al. (2011) Deller A. T., et al., 2011, PASP, 123, 275
- Deller et al. (2019) Deller A. T., et al., 2019, ApJ, 875, 100
- Doi et al. (2006) Doi A., et al., 2006, PASJ, 58, 777
- Efron & Tibshirani (1991) Efron B., Tibshirani R., 1991, Science, 253, 390
- El-Badry et al. (2021) El-Badry K., Rix H.-W., Heintz T. M., 2021, MNRAS, 506, 2269
- Fey et al. (1996) Fey A. L., Clegg A. W., Fomalont E. B., 1996, ApJS, 105, 299
- Franzon & Schramm (2017) Franzon B., Schramm S., 2017, MNRAS, 467, 4484
- Gaia Collaboration et al. (2016) Gaia Collaboration et al., 2016, A&A, 595, A2
- Gaia Collaboration et al. (2021) Gaia Collaboration et al., 2021, A&A, 649, A1
- Gaia Collaboration et al. (2022) Gaia Collaboration et al., 2022, A&A, 667, A148
- Garnavich et al. (2019) Garnavich P., Littlefield C., Kafka S., Kennedy M., Callanan P., Balsara D. S., Lyutikov M., 2019, ApJ, 872, 67
- Geng et al. (2016) Geng J.-J., Zhang B., Huang Y.-F., 2016, ApJ, 831, L10
- Greisen (2003) Greisen E. W., 2003, in Heck A., ed., Astrophysics and Space Science Library Vol. 285, Information Handling in Astronomy - Historical Vistas. p. 109, doi:10.1007/0-306-48080-8_7
- Griffith et al. (1994) Griffith M. R., Wright A. E., Burke B. F., Ekers R. D., 1994, ApJS, 90, 179
- Halpern & Thorstensen (2022) Halpern J. P., Thorstensen J. R., 2022, ApJ, 924, 67
- Hilton et al. (2009) Hilton E. J., Szkody P., Mukadam A., Henden A., Dillon W., Schmidt G. D., 2009, AJ, 137, 3606
- Johnson & Soderblom (1987) Johnson D. R. H., Soderblom D. R., 1987, AJ, 93, 864
- Katz (2017) Katz J. I., 2017, ApJ, 835, 150
- Keimpema et al. (2015) Keimpema A., et al., 2015, Experimental Astronomy, 39, 259
- Kubiak & Krzeminski (1994) Kubiak M., Krzeminski W., 1994, Acta Astron., 44, 81
- Lindegren (2020) Lindegren L., 2020, A&A, 633, A1
- Lindegren et al. (2021) Lindegren L., et al., 2021, A&A, 649, A4
- Marcote et al. (2017) Marcote B., Marsh T. R., Stanway E. R., Paragi Z., Blanchard J. M., 2017, A&A, 601, L7
- Marsh et al. (2016) Marsh T. R., et al., 2016, Nature, 537, 374
- Meintjes (2017) Meintjes P., 2017, in XII Multifrequency Behaviour of High Energy Cosmic Sources Workshop (MULTIF2017). p. 44
- Oruru & Meintjes (2012) Oruru B., Meintjes P. J., 2012, MNRAS, 421, 1557
- Papadaki et al. (2006) Papadaki C., Boffin H. M. J., Sterken C., Stanishev V., Cuypers J., Boumis P., Akras S., Alikakos J., 2006, A&A, 456, 599
- Paragi et al. (2013) Paragi Z., et al., 2013, MNRAS, 432, 1319
- Patterson (1994) Patterson J., 1994, PASP, 106, 209
- Pradel et al. (2006) Pradel N., Charlot P., Lestrade J. F., 2006, A&A, 452, 1099
- Rioja et al. (2017) Rioja M. J., Dodson R., Orosz G., Imai H., Frey S., 2017, AJ, 153, 105
- Ritter & Kolb (2003) Ritter H., Kolb U., 2003, A&A, 404, 301
- Rosen et al. (1995) Rosen S. R., Watson T. K., Robinson E. L., Prinja R. K., Misselt K., Shafter A. W., 1995, A&A, 300, 392
- Sambruna et al. (1992) Sambruna R. M., et al., 1992, ApJ, 391, 750
- Schreiber et al. (2021) Schreiber M. R., Belloni D., Gänsicke B. T., Parsons S. G., Zorotovic M., 2021, Nature Astronomy, 5, 648
- Shepherd et al. (1994) Shepherd M. C., Pearson T. J., Taylor G. B., 1994, in Bulletin of the American Astronomical Society. pp 987–989
- Singh et al. (2020) Singh K. K., Meintjes P. J., Kaplan Q., Ramamonjisoa F. A., Sahayanathan S., 2020, Astroparticle Physics, 123, 102488
- Sion et al. (2014) Sion E. M., Holberg J. B., Oswalt T. D., McCook G. P., Wasatonic R., Myszka J., 2014, AJ, 147, 129
- Sokolovsky et al. (2011) Sokolovsky K. V., Kovalev Y. Y., Pushkarev A. B., Lobanov A. P., 2011, A&A, 532, A38
- Szomoru (2008) Szomoru A., 2008, in The role of VLBI in the Golden Age for Radio Astronomy. p. 40
- Takata et al. (2018) Takata J., Hu C. P., Lin L. C. C., Tam P. H. T., Pal P. S., Hui C. Y., Kong A. K. H., Cheng K. S., 2018, ApJ, 853, 106
- Wenger et al. (2000) Wenger M., et al., 2000, A&AS, 143, 9
- Woodburn et al. (2015) Woodburn L., Natusch T., Weston S., Thomasson P., Godwin M., Granet C., Gulyaev S., 2015, Publ. Astron. Soc. Australia, 32, e017
- Worpel et al. (2020) Worpel H., Schwope A. D., Traulsen I., Mukai K., Ok S., 2020, A&A, 639, A17
- Xu et al. (2019) Xu S., Zhang B., Reid M. J., Zheng X., Wang G., 2019, ApJ, 875, 114
- Yakin et al. (2013) Yakin D. G., Suleimanov V. F., Vlasyuk V. V., Spiridonova O. I., 2013, Astronomy Letters, 39, 38
- Yang et al. (2020) Yang J., Gurvits L. I., Paragi Z., Frey S., Conway J. E., Liu X., Cui L., 2020, MNRAS, 495, L71
- Zacharias et al. (2017) Zacharias N., Finch C., Frouard J., 2017, AJ, 153, 166
- Zemko et al. (2018) Zemko P., et al., 2018, MNRAS, 480, 4489
- du Plessis et al. (2019) du Plessis L., Wadiasingh Z., Venter C., Harding A. K., 2019, ApJ, 887, 44
- du Plessis et al. (2022) du Plessis L., Venter C., Wadiasingh Z., Harding A. K., Buckley D. A. H., Potter S. B., Meintjes P. J., 2022, MNRAS, 510, 2998
Appendix A Kinematics and statistics of IPs and Polars
Table LABEL:tab:tabA1 presents a sample of IPs and polars with Galactic space motion results. We assembled this sample by starting with a traversal search on the Catalogue of Cataclysmic Binaries, Low-Mass X-Ray Binaries and Related Objects (Edition 7.24, Ritter & Kolb, 2003). We obtained a sample of 280 stars for IPs and polars and found that 189 stars already had Gaia EDR3 results (the position, the parallax and the proper motion) be identified in the SIMBAD astronomical database (Wenger et al., 2000). The sample of 189 stars consists of 82 IPs and 107 polars. The Galactic space velocity calculations for this sample followed the same method described in Subsection 4.2. The resultant space motion parameters are listed in Table LABEL:tab:tabA1 and the corresponding statistical information is listed in Table 6.
| Name | Typea | Name | Typea | |||||||||
|---|---|---|---|---|---|---|---|---|---|---|---|---|
| GK Per | IP | 11.4 | 2.4 | -29.7 | 31.9 | J17402847 | IP | 10.0 | -0.4 | 4.6 | 11.0 | |
| V2731 Oph | IP | -3.0 | 41.6 | 21.5 | 46.9 | EX Hya | IP | -19.4 | -0.2 | 13.9 | 23.9 | |
| V1062 Tau | IP | 13.8 | 11.6 | -13.6 | 22.5 | DW Cnc | IP | -2.0 | 18.7 | -14.5 | 23.8 | |
| NY Lup | IP | -4.2 | -21.1 | -20.1 | 29.4 | HT Cam | IP | 8.1 | 9.6 | 7.0 | 14.3 | |
| V902 Mon | IP | 19.8 | -1.3 | -10.3 | 22.3 | FS Aur | IP | 10.6 | -23.7 | 34.1 | 42.8 | |
| J08384831 | IP | -51.0 | 16.7 | 14.3 | 55.6 | V1025 Cen | IP | -71.4 | -29.3 | 15.5 | 78.8 | |
| V2069 Cyg | IP | 26.8 | 12.7 | 6.6 | 30.4 | CC Scl | IP | 70.3 | -20.9 | 25.4 | 77.6 | |
| J0457+4527 | IP | 11.0 | 17.1 | -4.9 | 20.9 | J05032823 | IP | -69.0 | 47.6 | 42.6 | 94.0 | |
| J2133+5107 | IP | 27.5 | 15.0 | 10.3 | 33.0 | J0525+2413 | IP | 10.4 | -1.2 | 7.9 | 13.1 | |
| EI UMa | IP | -1.5 | -0.5 | -5.1 | 5.3 | J0614+1704 | IP | 17.1 | -15.2 | 1.4 | 22.9 | |
| J15096649 | IP | -4.2 | 0.1 | 0.0 | 4.2 | J2015+3711 | IP | 55.1 | 1.4 | 9.2 | 55.9 | |
| V3037 Oph | IP | 9.8 | -10.9 | 8.0 | 16.7 | AE Aqr | IP | -11.1 | 20.7 | -14.7 | 27.7 | |
| WX Pyx | IP | -19.7 | 22.7 | -16.9 | 34.5 | DQ Her | IP | -17.8 | 18.1 | 14.6 | 29.3 | |
| TV Col | IP | -39.0 | 25.0 | 36.3 | 58.9 | V349 Aqr | 1IP | 99.9 | -123.8 | -81.7 | 178.8 | |
| V709 Cas | IP | 9.4 | 12.5 | -2.8 | 15.9 | V598 Peg | 2IP | 43.2 | 17.9 | 7.5 | 47.4 | |
| PQ Gem | IP | -14.3 | 49.8 | -9.7 | 52.7 | J18320840 | 3IP | 38.2 | -52.4 | -1.6 | 64.9 | |
| HZ Pup | IP | -82.3 | 54.1 | -3.3 | 98.5 | QR And | IP? | -224.9 | -192.0 | -105.9 | 314.1 | |
| FO Aqr | IP | 0.3 | 22.2 | 7.8 | 23.5 | J09393226 | IP? | -60.2 | 8.7 | -45.3 | 75.8 | |
| MU Cam | IP | 16.0 | 18.2 | 10.8 | 26.5 | V2275 Cyg | IP? | 113.3 | 12.2 | 13.2 | 114.7 | |
| HY Leo | IP | 20.8 | -21.2 | -7.4 | 30.6 | V426 Oph | IP? | 29.4 | -10.0 | -7.6 | 31.9 | |
| V1323 Her | IP | 103.9 | -36.6 | 26.1 | 113.2 | V1039 Cen | IP? | -48.5 | -35.4 | 9.3 | 60.8 | |
| V418 Gem | IP | 6.2 | 11.3 | -9.8 | 16.2 | AH Eri | IP? | 53.2 | -40.3 | -8.3 | 67.3 | |
| V2306 Cyg | IP | 29.3 | 6.9 | -13.3 | 32.9 | AP Cru | IP? | -133.3 | -71.6 | 3.7 | 151.3 | |
| LS Peg | IP | 1.0 | -1.1 | -22.3 | 22.4 | J16164958 | IP? | 6.5 | 6.5 | 4.3 | 10.2 | |
| V405 Aur | IP | -6.1 | -14.0 | -14.0 | 20.7 | V4745 Sgr | IP? | 5.5 | -272.9 | -48.0 | 277.1 | |
| V1033 Cas | IP | 53.5 | 38.0 | -4.7 | 65.8 | GI Mon | IP? | -13.3 | 34.0 | -31.5 | 48.3 | |
| J17194100 | IP | 7.0 | -1.1 | 13.8 | 15.5 | CW Mon | IP? | 17.8 | -0.7 | 21.0 | 27.5 | |
| DO Dra | IP | 20.1 | 27.7 | 2.6 | 34.3 | J1446+0253 | IP? | 49.1 | -22.4 | -23.6 | 58.8 | |
| J0153+7446 | IP | 10.5 | 12.5 | 12.2 | 20.4 | V2467 Cyg | IP? | 57.5 | 4.9 | 18.2 | 60.5 | |
| V842 Cen | IP | -58.5 | -59.0 | 4.9 | 83.3 | LS Cam | IP? | 31.0 | 38.2 | 9.0 | 50.0 | |
| J16541916 | IP | 7.7 | -34.8 | 20.8 | 41.2 | V592 Cas | IP? | 28.9 | 19.8 | -22.7 | 41.7 | |
| J16493307 | IP | 4.7 | -18.3 | 3.7 | 19.3 | GZ Cnc | IP? | -12.4 | -30.0 | -55.9 | 64.6 | |
| AO Psc | IP | 10.4 | -23.1 | -18.3 | 31.2 | VZ Pyx | IP? | 0.6 | 12.0 | -12.1 | 17.1 | |
| V647 Aur | IP | 13.6 | -1.2 | 23.5 | 27.1 | BZ UMa | IP? | 19.6 | 1.4 | 23.4 | 30.6 | |
| UU Col | IP | -21.3 | 29.4 | 13.9 | 38.8 | YY Sex | IP? | 21.3 | -12.2 | -14.7 | 28.6 | |
| J1926+1322 | IP | 28.5 | -2.8 | -1.9 | 28.7 | QZ Vir | IP? | -19.3 | -38.8 | -24.3 | 49.7 | |
| J2014+1529 | IP | 21.8 | 6.2 | 8.6 | 24.3 | V533 Her | IP? | 0.6 | 17.7 | 6.0 | 18.7 | |
| V2400 Oph | IP | 8.6 | 17.3 | 16.8 | 25.6 | KO Vel | 4,5IP? | -43.4 | 6.7 | 10.8 | 45.2 | |
| V1223 Sgr | IP | 6.8 | -45.2 | -25.7 | 52.5 | J2216+4646 | 6IP? | 33.6 | 16.4 | 5.3 | 37.7 | |
| BG CMi | IP | -17.2 | 41.8 | -37.5 | 58.7 | V795 Her | 7,8IP? | 54.6 | -4.3 | -7.0 | 55.2 | |
| V515 And | IP | 16.7 | 11.1 | -12.2 | 23.5 | V2491 Cyg | 9IP? | 449.0 | -170.5 | 5.9 | 480.3 | |
| V479 And | AM | 63.7 | 25.5 | -16.6 | 70.6 | EK UMa | AM | -46.3 | -74.6 | -1.2 | 87.8 | |
| V1309 Ori | AM | 16.6 | -9.6 | 12.3 | 22.8 | ST LMi | AM | 17.7 | -4.1 | 5.7 | 19.0 | |
| AI Tri | AM | 22.7 | -8.1 | -33.1 | 40.9 | BL Hyi | AM | -18.6 | 2.4 | 4.8 | 19.4 | |
| J0649-0737 | AM | 20.4 | 1.3 | 5.5 | 21.1 | MR Ser | AM | -28.6 | 21.6 | 33.1 | 48.8 | |
| MQ Dra | AM | 1.8 | -5.8 | 25.6 | 26.3 | FR Lyn | AM | 1.8 | -69.5 | -8.5 | 70.1 | |
| J2048+0050 | AM | 5.8 | 17.6 | 7.3 | 19.9 | V884 Her | AM | -8.5 | 26.0 | 20.9 | 34.4 | |
| V1043 Cen | AM | 3.1 | -8.1 | -15.3 | 17.6 | V2301 Oph | AM | -3.6 | 26.6 | 21.7 | 34.5 | |
| 0922+1333 | AM | 14.1 | -2.0 | -0.7 | 14.2 | CD Ind | AM | -16.4 | -12.0 | -9.4 | 22.4 | |
| VY For | AM | 0.0 | -19.9 | 28.2 | 34.5 | J10021925 | AM | -25.3 | 14.9 | -5.6 | 29.9 | |
| J0227+1306 | AM | 36.2 | 9.4 | -20.0 | 42.4 | EP Dra | AM | -61.2 | 7.3 | -7.3 | 62.0 | |
| QQ Vul | AM | 27.8 | 3.3 | -0.3 | 28.0 | J0953+1458 | AM | 42.5 | 31.9 | 41.3 | 67.3 | |
| J0749-0549 | AM | 20.7 | -3.3 | -17.9 | 27.5 | J0706+0324 | AM | 37.4 | -28.2 | 22.3 | 51.9 | |
| V358 Aqr | AM | 5.1 | -13.6 | -9.7 | 17.4 | V834 Cen | AM | -22.5 | -14.3 | 24.3 | 36.0 | |
| J1007-2017 | AM | -12.1 | 10.7 | -6.4 | 17.4 | VV Pup | AM | 45.6 | -9.8 | -7.8 | 47.3 | |
| V388 Peg | AM | 37.2 | -18.7 | -21.1 | 46.6 | EG Lyn | AM | 0.7 | -57.8 | 12.2 | 59.1 | |
| J1422-0221 | AM | 19.5 | 8.6 | -0.8 | 21.3 | J1344+2044 | AM | 24.6 | -99.2 | 7.4 | 102.5 | |
| V1432 Aql | AM | 16.9 | 10.2 | 22.7 | 30.1 | V393 Pav | AM | -9.9 | -20.6 | -4.5 | 23.3 | |
| BY Cam | AM | 9.1 | 37.6 | -36.5 | 53.2 | HS Cam | AM | 2.3 | -3.9 | 10.9 | 11.8 | |
| V1500 Cyg | AM | 72.6 | 13.4 | 13.5 | 75.1 | LW Cam | AM | 18.5 | 11.5 | 24.9 | 33.1 | |
| J0733+2619 | AM | 11.6 | 1.4 | 3.5 | 12.2 | BS Tri | AM | 11.0 | -8.1 | -15.6 | 20.7 | |
| J0837+3830 | AM | -13.1 | -19.6 | -27.0 | 35.9 | EQ Cet | AM | -4.2 | -56.9 | 11.7 | 58.2 | |
| V519 Ser | AM | 22.1 | 9.3 | -6.7 | 24.9 | J19444202 | AM | 6.6 | 31.0 | -1.3 | 31.7 | |
| J1453-5521 | AM | -47.0 | -56.0 | -15.8 | 74.8 | J1312+1736 | AM | 23.4 | 24.2 | 5.8 | 34.2 | |
| CW Hyi | AM | -39.2 | -29.5 | 29.7 | 57.3 | J1321+5609 | AM | 46.9 | 7.6 | 18.7 | 51.1 | |
| J2319+2615 | AM | 14.7 | 5.2 | -7.3 | 17.2 | EU UMa | AM | -5.7 | -5.6 | 1.7 | 8.2 | |
| HY Eri | AM | 33.4 | -42.2 | 8.7 | 54.5 | V347 Pav | AM | 2.9 | 18.2 | -10.6 | 21.2 | |
| WX LMi | AM | 20.5 | -3.3 | 13.1 | 24.5 | J0257+3337 | AM | 7.8 | 2.0 | -1.7 | 8.2 | |
| EU Lyn | AM | 6.0 | 13.3 | -1.0 | 14.6 | J0502+1624 | AM | 9.8 | -31.7 | 22.9 | 40.3 | |
| V349 Pav | AM | 8.8 | 28.4 | -6.2 | 30.4 | DP Leo | AM | -26.4 | -4.2 | -9.0 | 28.2 | |
| PZ Vir | AM | -35.7 | -2.5 | 19.4 | 40.7 | CP Tuc | AM | 0.8 | -24.3 | 17.9 | 30.2 | |
| J0524+4244 | AM | -0.5 | -25.8 | -4.2 | 26.2 | J1514+0744 | AM | 3.3 | -73.8 | 24.5 | 77.8 | |
| AP CrB | AM | -14.4 | 17.4 | 19.7 | 30.0 | V379 Vir | AM | 16.7 | -28.9 | -15.1 | 36.6 | |
| V654 Aur | AM | 13.1 | 10.5 | 13.8 | 21.7 | IW Eri | AM | 66.2 | 7.2 | -41.2 | 78.4 | |
| J0859+0536 | AM | 33.6 | -2.9 | 16.8 | 37.7 | J1250+1549 | AM | -10.4 | -40.6 | 0.0 | 41.9 | |
| QS Tel | AM | -7.9 | 0.1 | -24.5 | 25.8 | J04255714 | AM | -41.2 | 13.5 | 10.0 | 44.5 | |
| V516 Pup | AM | -43.1 | 20.8 | 4.4 | 48.0 | GQ Mus | AM | -93.8 | -39.0 | -1.2 | 101.6 | |
| V381 Vel | AM | 37.1 | 11.1 | -11.9 | 40.6 | J0921+2038 | AM | -24.9 | 27.9 | -19.5 | 42.2 | |
| V1189 Her | AM | -8.5 | -22.4 | 50.4 | 55.8 | BM CrB | AM | 18.6 | 3.8 | 9.8 | 21.3 | |
| UW Pic | AM | -5.5 | 13.5 | 14.5 | 20.5 | IL Leo | AM | 15.7 | -59.5 | -18.3 | 64.2 | |
| J1333+1437 | AM | -188.3 | -108.3 | 50.6 | 223.0 | EF Eri | AM | -15.9 | -85.4 | 55.4 | 103.1 | |
| HU Leo | AM | -32.6 | 41.5 | -7.4 | 53.3 | J01545947 | AM | 28.0 | 14.6 | 10.4 | 33.2 | |
| J2218+1925 | AM | 28.1 | 3.3 | -5.0 | 28.8 | J0528+2838 | AM | 7.6 | -46.9 | 17.8 | 50.7 | |
| MT Dra | AM | -26.7 | 16.9 | 6.5 | 32.3 | GG Leo | AM | -20.6 | 5.2 | -15.2 | 26.2 | |
| UZ For | AM | 1.6 | -0.7 | 18.7 | 18.8 | EV UMa | AM | -11.5 | -16.9 | 15.7 | 25.8 | |
| J2218+1925 | AM | 5.6 | -5.5 | 14.5 | 16.5 | V4738 Sgr | AM | 12.9 | 16.9 | 11.2 | 24.0 | |
| EU Cnc | AM | -2.3 | 8.6 | -13.8 | 16.4 | J2340+7642 | AM? | -36.4 | -9.5 | -1.2 | 37.6 | |
| HU Aqr | AM | 74.1 | -32.8 | 26.9 | 85.4 | J0759+1914 | AM? | 25.3 | -0.4 | 27.2 | 37.1 | |
| J17430429 | AM | 19.6 | 7.5 | -22.3 | 30.7 | J0935+1619 | AM? | 3.1 | -35.8 | -29.4 | 46.5 | |
| J0328+0522 | AM | 27.0 | -4.8 | -13.8 | 30.7 | CP Pup | AM? | -0.4 | 16.8 | 6.7 | 18.1 | |
| V2951 Oph | AM | 24.9 | -1.0 | -11.7 | 27.6 | J03113152 | AM? | 34.8 | -14.8 | 10.6 | 39.2 | |
| V808 Aur | AM | 0.3 | 10.0 | -16.2 | 19.0 | J1955+0045 | AM? | 22.6 | -4.1 | -1.9 | 23.1 | |
| V1237 Her | AM | 46.1 | 7.2 | -5.9 | 47.1 | PT Per | AM? | 7.4 | 10.2 | 0.8 | 12.7 | |
| AR UMa | AM | -22.9 | 0.2 | -6.7 | 23.8 | J03541652 | AM? | 119.8 | -84.9 | -38.3 | 151.7 | |
| AN UMa | AM | -42.2 | -46.0 | -12.1 | 63.6 | |||||||
| a IP - intermediate polar, IP? - intermediate polar candidate. AM - polar, AM? - polar candidate. The types of sources were obtained | ||||||||||||
| from Ritter & Kolb (2003) if there are no additional references. (1)Worpel et al. (2020), (2) Hilton et al. (2009), | ||||||||||||
| (3) Halpern & Thorstensen (2022), (4) Sambruna et al. (1992), (5) Kubiak & Krzeminski (1994), (6) Yakin et al. (2013), | ||||||||||||
| (7) Rosen et al. (1995), (8) Papadaki et al. (2006), (9) Zemko et al. (2018). | ||||||||||||
| Type | Number | Component | Average | Dispersion |
|---|---|---|---|---|
| IP | 57 | 6.4 | 34.4 | |
| 1.7 | 29.9 | |||
| 0.9 | 19.9 | |||
| 39.7 | 30.3 | |||
| IP? | 25 | 16.7 | 112.0 | |
| -28.9 | 74.9 | |||
| -11.1 | 29.4 | |||
| 88.7 | 110.0 | |||
| IP+IP? | 82 | 9.5 | 67.5 | |
| -7.6 | 49.8 | |||
| -2.8 | 23.7 | |||
| 54.6 | 68.8 | |||
| AM | 99 | 2.6 | 34.2 | |
| -7.4 | 29.5 | |||
| 3.0 | 18.5 | |||
| 40.4 | 28.4 | |||
| AM? | 8 | 22.0 | 45.1 | |
| -15.3 | 32.4 | |||
| -3.2 | 21.2 | |||
| 45.8 | 44.4 | |||
| AM+AM? | 107 | 4.0 | 35.2 | |
| -8.0 | 29.7 | |||
| 2.5 | 18.7 | |||
| 40.8 | 29.6 |