Complete identification of spin-wave eigenmodes excited by parametric pumping in YIG microdisks
Abstract
We present the parametric excitation of spin-wave modes in YIG microdisks via parallel pumping. Their spectroscopy is performed using magnetic resonance force microscopy (MRFM), while their spatial profiles are determined by micro-focus Brillouin light scattering (BLS). We observe that almost all the fundamental eigenmodes of an in-plane magnetized YIG microdisk, calculated using a micromagnetic eigenmode solver, can be excited using the parallel pumping scheme, as opposed to the transverse one. The comparison between the MRFM and BLS data on one side, and the simulations on the other side, provides the complete spectroscopic labeling of over 40 parametrically excited modes. Our findings could be promising for spin-wave-based computation schemes, in which the amplitudes of a large number of spin-wave modes have to be controlled.
I Introduction
Novel proposals for spin-wave-based computing schemes necessitate the generation and control of multiple spin-wave (SW) modes Brächer and Pirro (2018); Nakane et al. (2018); Hughes et al. (2019); Papp et al. (2021); Körber et al. (2022). The most standard way to excite SW modes in a magnetic microstructure is by direct inductive coupling. There, the quasi-uniform microwave field, produced on the magnetic volume by an rf antenna, couples to the transverse dynamical component of the magnetization associated with the SW mode, with a maximal efficiency when the applied rf frequency coincides with the eigenfrequency of the mode. However, this method is not adapted to excite modes with anti-symmetric spatial profiles, as their overlap integral with the excitation field is zero Naletov et al. (2011), nor short-wavelength modes, as their excitation efficiency quickly decreases with their wavevector. Yet, these two categories of modes make up a significant part of the SW k-space. In order to excite a large number of modes irrespective of their spatial profiles, parametric parallel pumping, which does not suffer from these limitations, becomes the ideal choice Gurevich and Melkov (1996). In this case, the microwave magnetic field created by the rf antenna is aligned parallel to the static field. As a result, it does not couple to the SW modes directly. Instead, it interacts with the dynamic component of magnetization oscillating at 2 in the static field direction, which arises due to the elliptical trajectory of magnetization precession at . An rf field at 2 can therefore excite SW modes at . A quantum mechanical picture of this process is a photon generating two magnons of opposite momenta at half its frequency White and Sparks (1963). Since this is a nonlinear process, SWs are excited only if the amplitude of the excitation field exceeds a parametric threshold, which depends on the mode relaxation, and on the mode ellipticity. The threshold power is lower for lower relaxation rates and higher ellipticities.
Parallel pumping has been employed to generate SW modes in extended films Kurebayashi et al. (2011); Sandweg et al. (2011); Serga et al. (2012); Hahn et al. (2013); Lauer et al. (2016) and micro- and nano-waveguides Mohseni et al. (2020); Heinz et al. (2022) of yttrium iron garnet (YIG), as well as in magnetic nanocontacts Urazhdin et al. (2010), magnetic tunnel junctions Chen et al. (2017), and micro- and nano-dots of Permalloy Ulrichs et al. (2011); Edwards et al. (2012); Guo et al. (2014). It has also been used for SW amplification Brächer et al. (2017). All these studies have been limited to a handful number of modes. The excitation and identification of many modes in an adequate system would pave the way towards simultaneous control and manipulation of a large number of SW modes for different applications in magnonics.
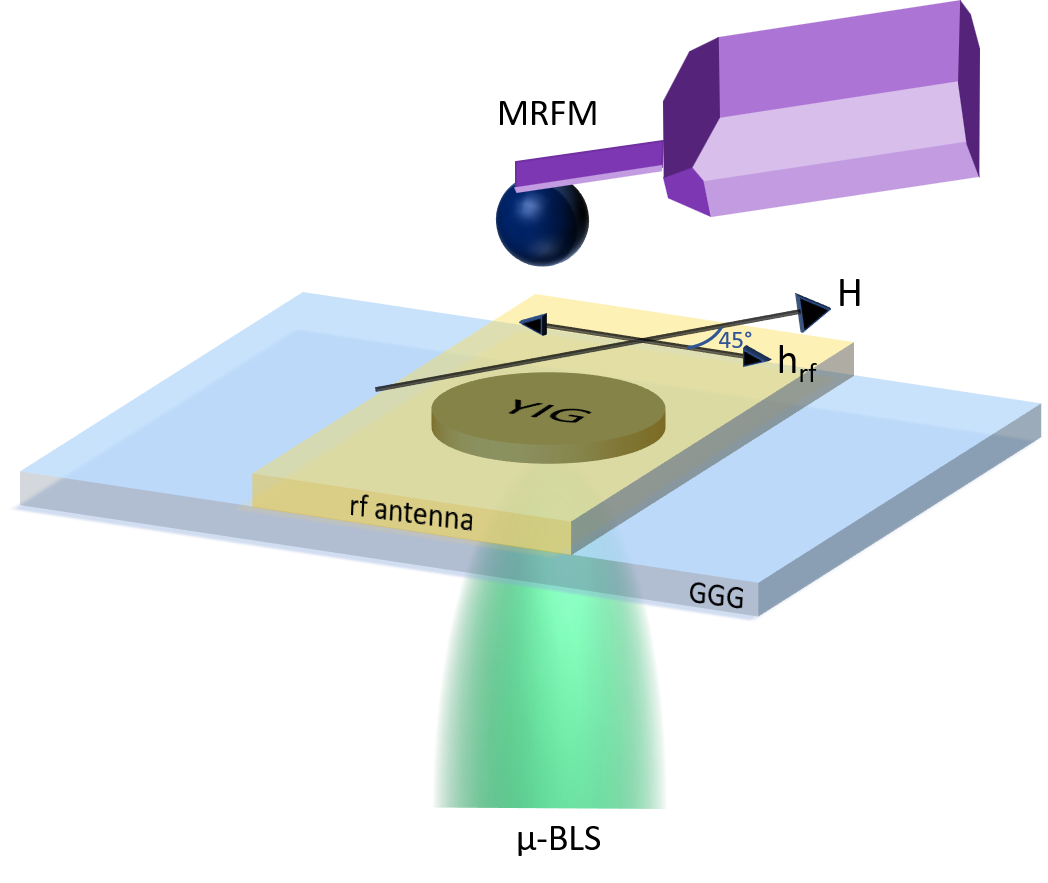
In this study, we present the excitation and identification of multiple SW modes in YIG microdisks via parametric pumping. The scheme of the experiments is shown in Fig. 1. The SW modes are excited in YIG disks of diameters 1 µm, 3 µm and 5 µm through an integrated rf antenna and detected using a magnetic resonance force microscope (MRFM). Their spatial profiles can also be recorded using micro-focus Brillouin light scattering spectroscopy (µ-BLS). We observe that almost all the SW eigenmodes are accessible by parametric pumping. As expected, these eigenmodes become fewer in number as the size of the disk decreases. For the 3 µm disk, we label over 40 eigenmodes by comparing its MRFM parametric spectroscopy to micromagnetic simulations, and confirm the identification of as many as 10 of them through their profiles thanks to µ-BLS. Our results could be instrumental in designing basic units for unconventional computing schemes like neuromorphic computing using hyperconnected populations of a large number of eigen-excitations in a single microstructure.
II Results
II.1 Sample
We use 50 nm thick YIG grown on 0.5 mm thick GGG substrate by liquid phase epitaxy Beaulieu et al. (2018). The characteristics of the extended film are measured by standard magnetometry and broadband FMR techniques. These yield a saturation magnetization kA/m, a gyromagnetic ratio GHz/T, a Gilbert damping parameter , and a weak inhomogeneous broadening of the FMR linewidth, found to be 0.1 mT. These parameters are typical of the YIG material; the exchange constant, which has not been specifically determined on this film, is assumed to be pJ/m, a standard value from literature Klingler et al. (2015). The YIG layer was patterned into disks of diameters 1 µm, 3 µm and 5 µm using e-beam lithography. A 220 nm thick Ti/Au antenna, of width equal to 8 µm, was then deposited on top of the disks. Injecting an rf current in the antenna generates an rf in-plane magnetic field that is orthogonal to the long axis of the antenna.
II.2 Parallel pumping spectroscopy
The SW mode spectroscopy is done using MRFM. It employs a very soft cantilever, at the end of which a submicronic magnetic spherical probe made of cobalt is attached Sangiao et al. (2017), to mechanically detect the magnetization dynamics in the sample placed underneath Klein et al. (2008). When SWs are excited in the sample by the microwave field, the (static) longitudinal component of magnetization is reduced and so is the dipolar force on the MRFM probe, resulting in a displacement of the cantilever beam, which is detected optically. The rf excitation applied to the sample via the antenna is modulated at the mechanical resonance frequency of the cantilever to improve the quality factor and the signal-to-noise ratio.
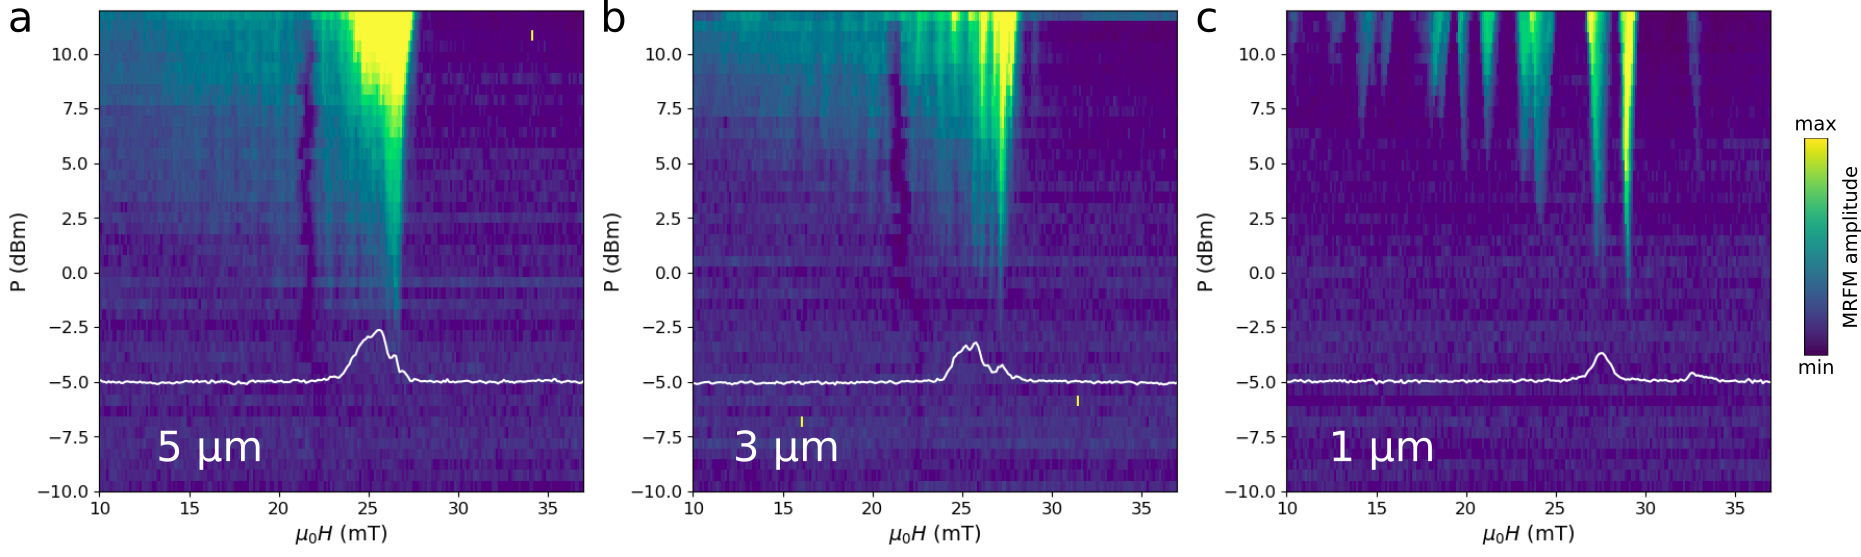
In these measurements, the dc magnetic field is applied in-plane at an angle of 45° with respect to the direction of the rf magnetic field, as displayed in Fig. 1. Therefore the rf field excitation has both a transverse and a parallel component relative to the magnetization direction. The parallel pumped SW spectrum is studied for different-sized disks as a function of the applied microwave power. Figure 2 shows the results of the MRFM parametric spectroscopy performed at a constant microwave frequency of 4 GHz for the three disks (color-coded intensity maps), together with the corresponding transverse excitation spectra measured at fixed frequency of 2 GHz and power of dBm (continuous white curves). Only a few SW modes are detected in the latter regime. In contrast, we observe that a large number of modes can be excited by parallel pumping at 4 GHz for all the disks, in the range of applied dc field corresponding to the direct excitation of modes at 2 GHz, because parametrically excited modes are generated at half the pumping frequency. As expected, this occurs only above a minimum power level, that ranges from about dBm for the 5 µm disk to dBm for the 1 µm disk. The fact that the parametric threshold increases and that the density of the excited modes decreases as the lateral size decreases can be explained by geometrical confinement effects, as reported earlierGuo et al. (2014).
In the following, we will mainly focus on the 3 µm disk where the SW modes are quite abundant but at the same time discernible (not too closely spaced). We perform similar measurements on this disk, this time fixing the value of the dc field to 27 mT, and scanning the parallel pumping frequency as a function of the microwave power. Fig. 3b shows the intensity map of the parametrically excited modes in these conditions, as a function of half the pumping frequency and the rf power , varied along the horizontal and vertical axes, respectively. We note that the threshold power increases with the frequency in a non-monotonic way, which can be explained as follows. The threshold excitation field of each mode can indeed be computed as the ratio between the relaxation rate to a coupling coefficient , that is related to the mode ellipticity Gurevich and Melkov (1996): the more elliptical a mode is, the larger its and the lower will its threshold be. Both the terms depend non-monotonously on the wavevector and on the mode frequency. However, on a wide range, when increases, so does the mode frequency and its relaxation rate, while its ellipticity and its coupling tends to decrease Gurevich and Melkov (1996); Brächer et al. (2017). This leads to the clear but not monotonous increase of the experimental threshold power with frequency seen in Fig. 3b.
II.3 Simulations
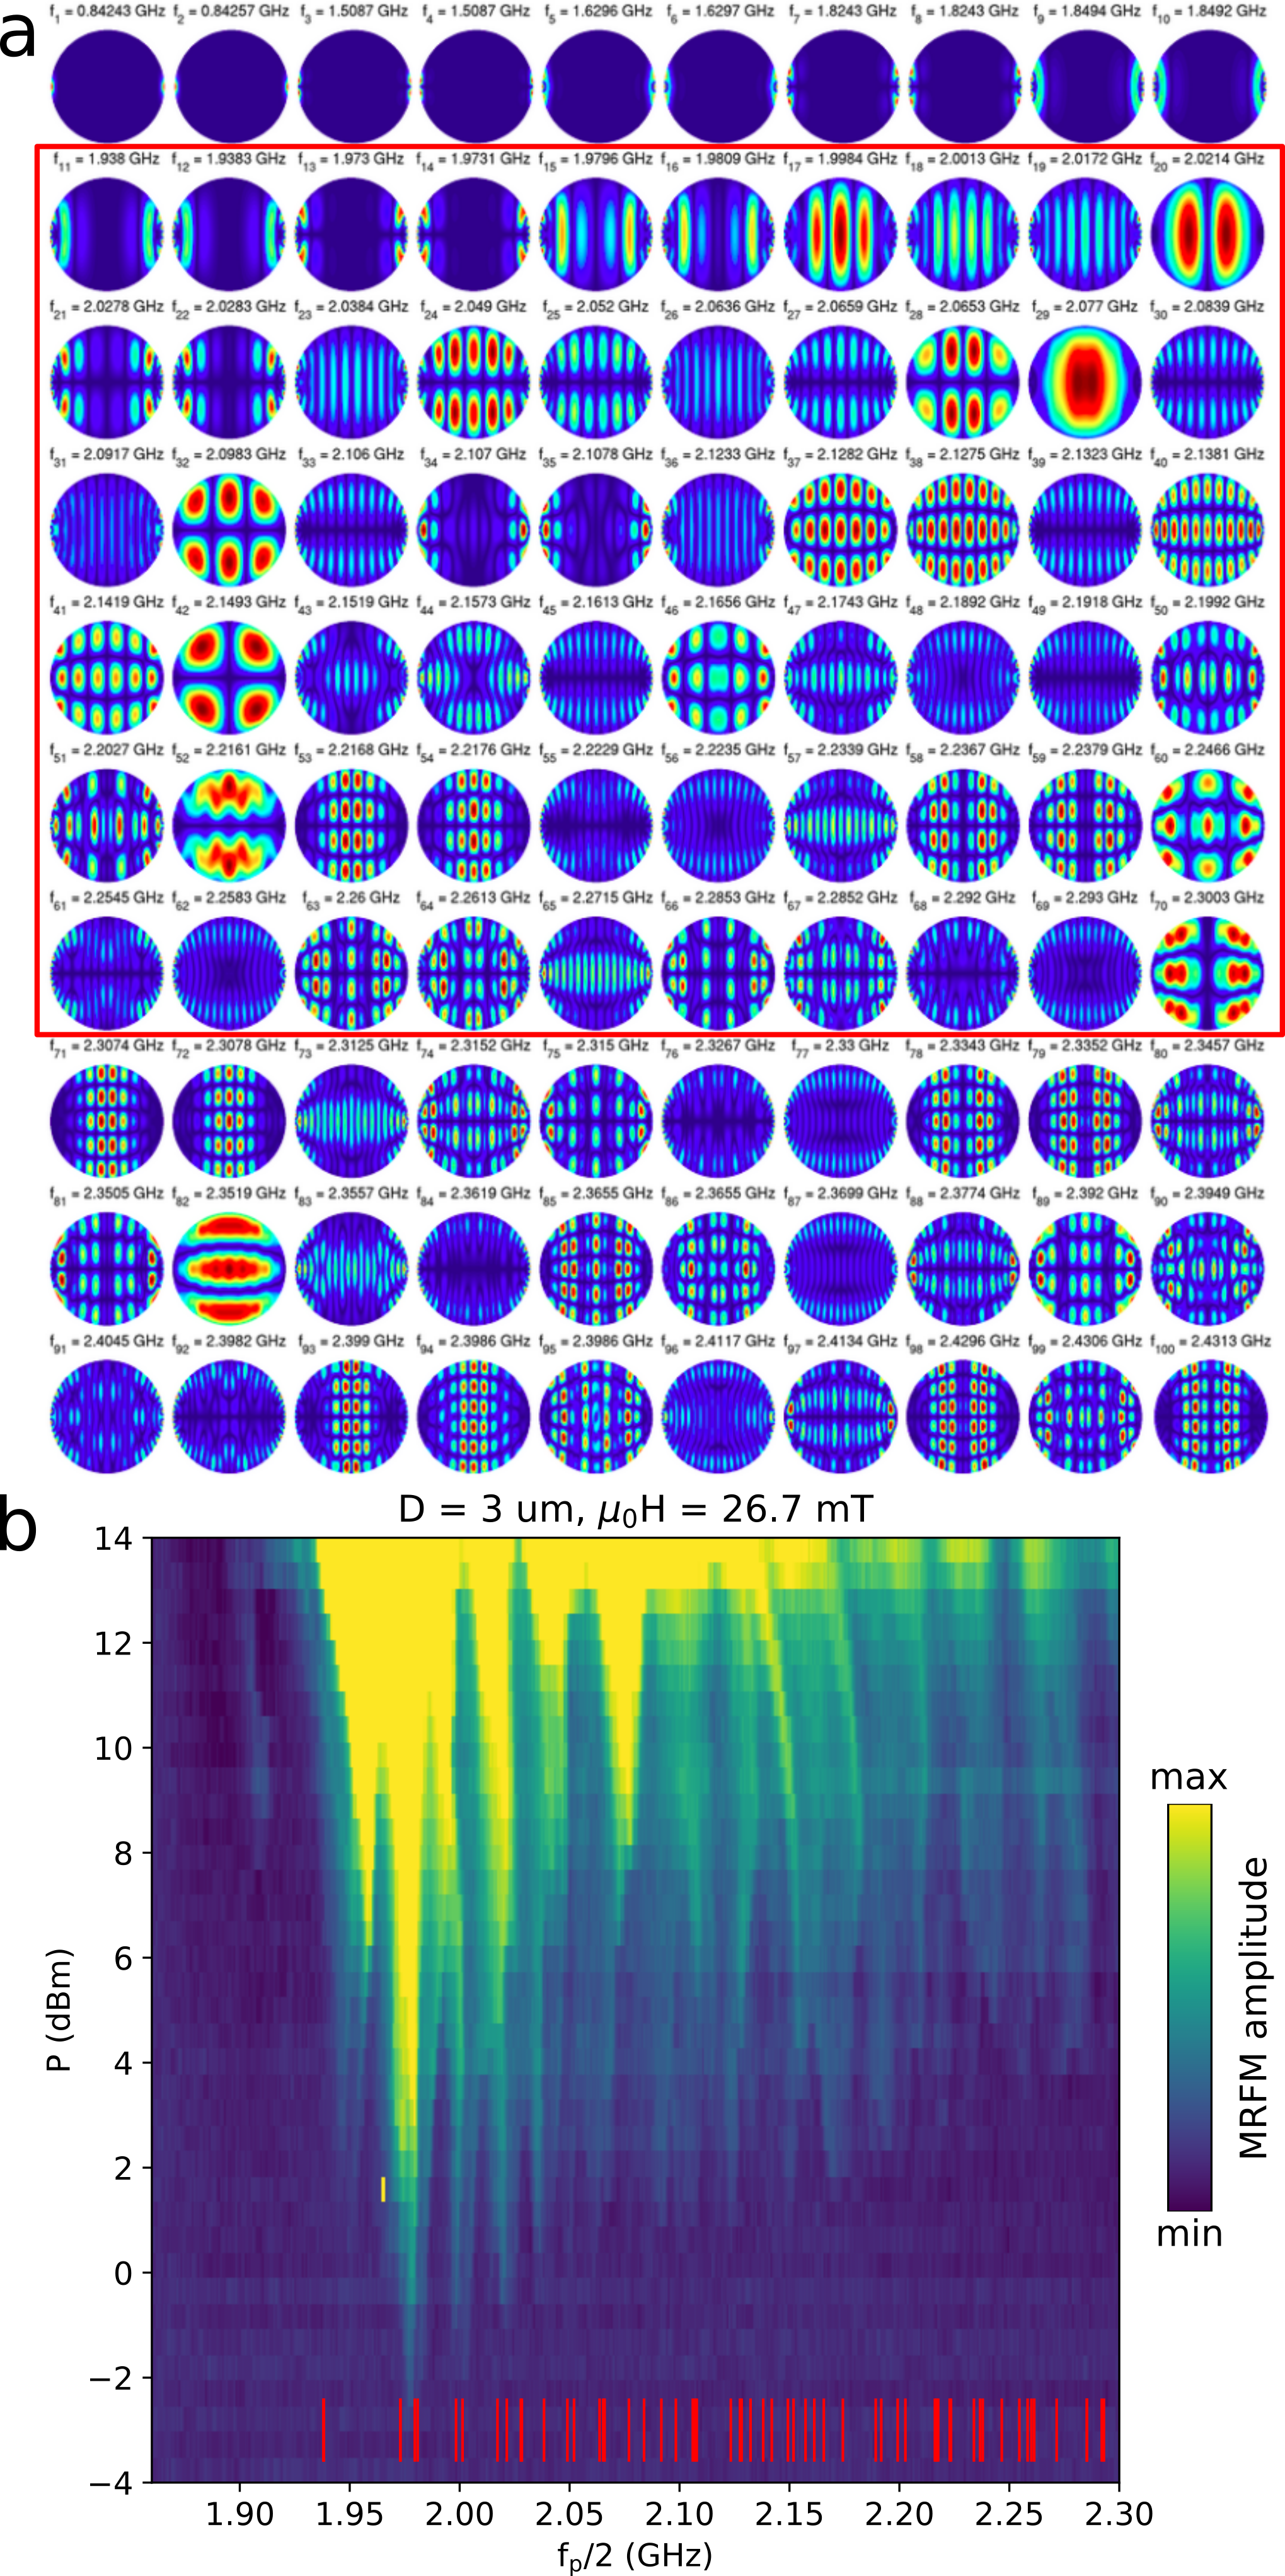
In order to identify these parametrically excited modes, micromagnetic simulations using the eigenmode solver implemented in the micromagnetic code MaGICo mag have been performed to calculate the SW spectrum. The magnetic ground state is first computed for the specific geometry and applied magnetic field. Once the magnetic ground state is known, the equation describing magnetization dynamics, the Landau-Lifshitz-Gilbert equation, is linearized around the ground state and small-amplitude spatial profiles of the modes are computed. This problem can be formulated as a generalized eigenvalue problem as described in ref.d’Aquino et al. (2009). The solution of the eigenvalue problem allows to the determination of the SW spectrum of the magnetic sample under investigation. Here, the geometry of the body, a 50 nm thick disk of 3 µm in diameter, was discretized using cubic cells (mesh size of nm3), and the values of the magnetic parameters used in the simulation were those determined experimentally. As in the experimental case, the applied field lies in the plane of the disk and is set to 27 mT. The implementation of suitable matrix-free large-scale methods described in ref.d’Aquino and Hertel (2023) allowed the calculation of hundreds of eigenmodes for such an extended structure (353440 computational cells, eigenvalue problem size ) in a few hours.
Figure 3a displays the computed spatial profiles of the first 100 eigenmodes. The 10 lowest frequency modes (first row) correspond to edge modes, where the precession of the magnetization is strongly confined at the boundaries of the disk, in the (horizontal) direction of the applied dc field due to the demagnetizing field Jersch et al. (2010); Guo et al. (2013). The following modes correspond to standing SW modes, which can be labelled by the number of precession lobes in the horizontal () and vertical () directions. For instance, mode 20 (second row, last column) can be labelled by and , i.e., it is the (2,1) mode. Mode 40 (fourth row, last column) is the (11,3) mode. The most uniform mode, usually referred as the FMR mode, is mode 29, or mode (1,1).
Figure 3b presents the comparison between the experimental spectroscopy and the computed eigenfrequencies of modes 11 to 70, shown as red ticks on top of the intensity map of the parametrically excited modes. We observe a good agreement between the computed mode frequencies and the experimental mode frequencies (at half-pumping frequencies ) observed at the bottom of the parametric instability regions (elongated yellow-green triangles extending downwards on the intensity map). From this comparison, it is possible to state that almost all, if not all SW eigenmodes, can be parametrically excited, irrespective of their spatial profile. Due to the high density of modes in the investigated frequency range, we will only focus on a few modes, to emphasize the good agreement noted above. The lowest-lying computed modes in Fig. 3b are the pair of modes 11 and 12 with respective frequencies 1.938 and 1.9383 GHz, which correspond rather well to the measured parametric instability region with a threshold power of 2 dBm at around 1.95 GHz. The small disagreement of 10 MHz between the computed and measured frequencies is not unexpected, since these modes belong to the category of edge modes, whose characteristics are very sensitive to imperfections at the periphery of the disk Nembach et al. (2011); Guo et al. (2013), which are not taken into account in the simulations. If we move to the next parametrically excited modes, which have the lowest power threshold and have frequencies around 1.975 GHz, the comparison with computed frequencies shows that they correspond to two pairs of modes: modes 13 and 14 with respective frequencies 1.973 and 1.9731 GHz, and modes 15 and 16, at 1.9796 and 1.9809 GHz. The next excited modes in the experimental spectroscopy map are at around 2 GHz, and they correspond to mode 17 at 1.998 GHz and mode 18 at 2.001 GHz. As a matter of fact, a detailed inspection of the data shows that indeed, the parametric instability region has two nearby minima with frequencies equally spaced around 2 GHz. This good agreement between experimental and computed mode frequencies continues over the full range of investigated frequencies. We note that among the 60 modes whose frequencies have been plotted in ig. 3b, only 44 modes have discernible frequencies and spatial profiles, a few of them being pairs of modes with very similar characteristics (e.g., pairs of modes 11 and 12, 13 and 14, 15 and 16, 21 and 22, etc.).
II.4 Spatial profiles with µ-BLS
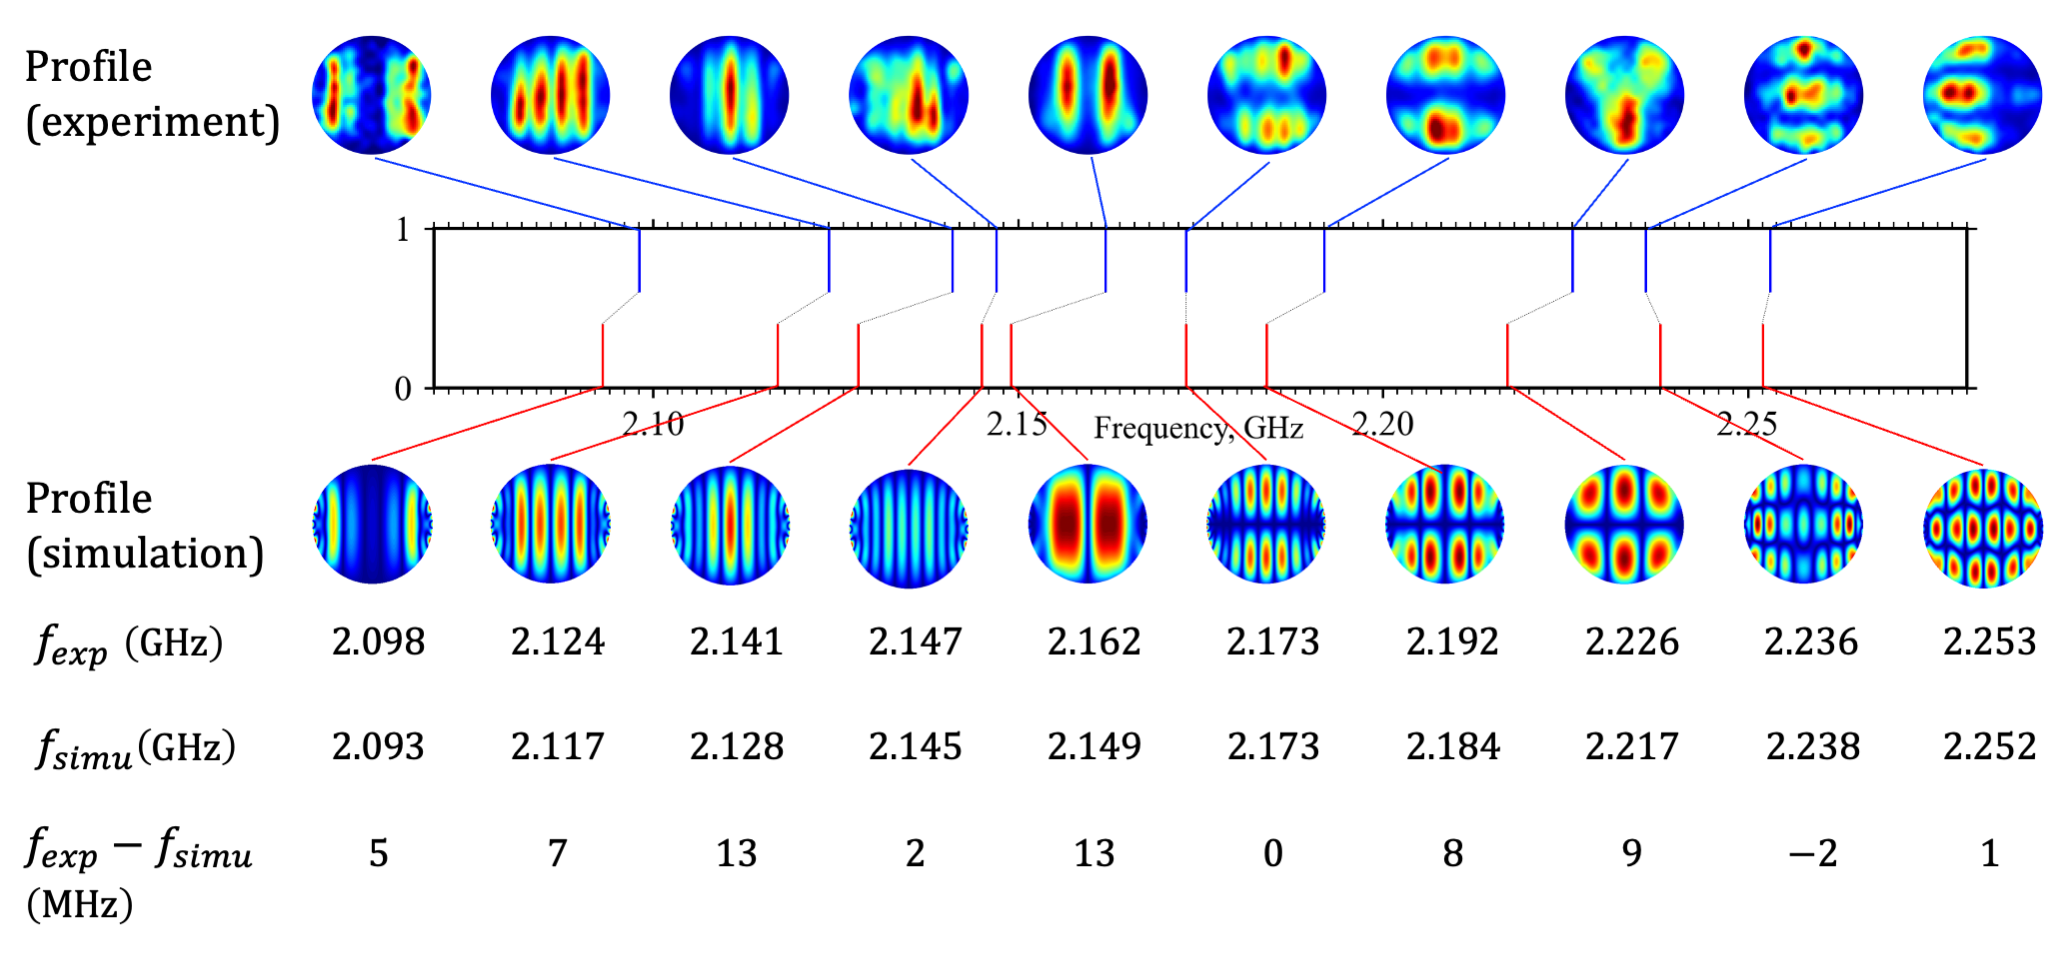
To push further the comparison between computed SW modes and experiments, it is possible to take advantage of µ-BLS, to map the spatial profiles of dynamic magnetization in micro-structures Demidov and Demokritov (2015). A probing laser light ( nm and mW) is focused into a diffraction-limited spot on the surface of a similar 3 µm YIG disk (Fig. 1) and the modulation of this probing light by the magnetization oscillations is analysed using a high-contrast optical spectrometer. The obtained signal – the BLS intensity – is proportional to the intensity of the magnetic oscillations at a given frequency. In this BLS measurement, the in-plane bias field is set at 30 mT. To compare the experimental mode profiles with the computed mode profiles, the micromagnetic simulations have therefore been repeated at 30 mT as well. To avoid nonlinear distortions of the mode profiles, known to occur when the mode amplitude increases too much, the BLS mapping of the mode profiles is performed at microwave power only slightly above threshold. By sweeping the laser spot position across the disk, a dozen of different modes are imaged, Fig. 4 presents the comparison between the experimental and computed profiles of 10 modes. Overall, the measured profiles are in good agreement with the computed ones, taking into account the experimental spatial resolution ( nm) and the long duration of these measurements, which are subjected to experimental drifts. Similarly to the analysis performed in Fig. 3b, we observe that the mode frequencies obtained by BLS correspond very well to the computed mode frequencies, with a mismatch that remains under 13 MHz for all modes. In particular, we observe well defined modes up to and , which validates the agreement between experiment and simulations for a large number of modes.
III Conclusion
Thanks to the comparison between parametric spectroscopy and mode imaging respectively performed by MRFM and BLS on one side, and micromagnetic simulations on the other side, we have successfully excited, detected and identified a large number ( 40) of SW eigenmodes in a 3 µm YIG disk, where the mode density is large due to the large lateral dimensions. The computed spatial profiles provide a direct way to label those modes, using the numbers of precession nodes in the directions parallel () and transverse () to the applied magnetic field. This study opens up the possibility to perform experiments where many parametric modes are simultaneously excited while using the normal mode approach Perna et al. (2022a, b) to understand and harness the complex dynamics in the modal space of confined magnetic structures.
Acknowledgements
This work was supported by the Horizon2020 Research Framework Programme of the European Commission under grant no. 899646 (k-NET). It is also supported by a public grant overseen by the Agence Nationale de la Recherche as part of the “Investissements d’Avenir” program (Labex NanoSaclay, reference: ANR-10-LABX-0035). I.N.Y. acknowledges support from the ANR grant no. ANR-18-CE24-0021 (Maestro).
References
- Brächer and Pirro (2018) T. Brächer and P. Pirro, “An analog magnon adder for all-magnonic neurons,” J. Appl. Phys. 124, 152119 (2018).
- Nakane et al. (2018) R. Nakane, G. Tanaka, and A. Hirose, “Reservoir computing with spin waves excited in a garnet film,” IEEE Access 6, 4462–4469 (2018).
- Hughes et al. (2019) Tyler W. Hughes, Ian A. D. Williamson, Momchil Minkov, and Shanhui Fan, “Wave physics as an analog recurrent neural network,” Science Advances 5 (2019), 10.1126/sciadv.aay6946.
- Papp et al. (2021) Ádám Papp, Wolfgang Porod, and Gyorgy Csaba, “Nanoscale neural network using non-linear spin-wave interference,” Nature Commun. 12, 1–8 (2021).
- Körber et al. (2022) Lukas Körber, Christopher Heins, Tobias Hula, Joo-Von Kim, Helmut Schultheiss, Jürgen Fassbender, and Katrin Schultheiss, “Pattern recognition with a magnon-scattering reservoir,” arXiv preprint arXiv:2211.02328 (2022), 10.48550/arXiv.2211.02328.
- Naletov et al. (2011) V. V. Naletov, G. de Loubens, G. Albuquerque, S. Borlenghi, V. Cros, G. Faini, J. Grollier, H. Hurdequint, N. Locatelli, B. Pigeau, A. N. Slavin, V. S. Tiberkevich, C. Ulysse, T. Valet, and O. Klein, “Identification and selection rules of the spin-wave eigenmodes in a normally magnetized nanopillar,” Phys. Rev. B 84, 224423 (2011).
- Gurevich and Melkov (1996) A. G. Gurevich and G. A. Melkov, Magnetization Oscillations and Waves (CRC Press, 1996).
- White and Sparks (1963) R. M. White and M. Sparks, “Ferromagnetic Relaxation. III. Theory of instabilities,” Phys. Rev. 130, 632 (1963).
- Kurebayashi et al. (2011) H. Kurebayashi, O. Dzyapko, V. E. Demidov, D. Fang, A. J. Ferguson, and S. O. Demokritov, “Spin pumping by parametrically excited short-wavelength spin waves,” Appl. Phys. Lett. 99, 162502 (2011).
- Sandweg et al. (2011) C. W. Sandweg, Y. Kajiwara, A. V. Chumak, A. A. Serga, V. I. Vasyuchka, M. B. Jungfleisch, E. Saitoh, and B. Hillebrands, “Spin pumping by parametrically excited exchange magnons,” Phys. Rev. Lett. 106, 216601 (2011).
- Serga et al. (2012) A. A. Serga, C. W. Sandweg, V. I. Vasyuchka, M. B. Jungfleisch, B. Hillebrands, A. Kreisel, P. Kopietz, and M. P. Kostylev, “Brillouin light scattering spectroscopy of parametrically excited dipole-exchange magnons,” Phys. Rev. B 86, 134403 (2012).
- Hahn et al. (2013) C. Hahn, G. de Loubens, M. Viret, O. Klein, V. V. Naletov, and J. Ben Youssef, “Detection of microwave spin pumping using the inverse spin hall effect,” Phys. Rev. Lett. 111, 217204 (2013).
- Lauer et al. (2016) V. Lauer, D. A. Bozhko, T. Brächer, P. Pirro, V. I. Vasyuchka, A. A. Serga, M. B. Jungfleisch, M. Agrawal, Yu. V. Kobljanskyj, G. A. Melkov, C. Dubs, B. Hillebrands, and A. V. Chumak, “Spin-transfer torque based damping control of parametrically excited spin waves in a magnetic insulator,” Appl. Phys. Lett. 108, 012402 (2016).
- Mohseni et al. (2020) Morteza Mohseni, Martin Kewenig, Roman Verba, Qi Wang, Michael Schneider, Björn Heinz, Felix Kohl, Carsten Dubs, Bert Lägel, Alexander A. Serga, Burkard Hillebrands, Andrii V. Chumak, and Philipp Pirro, “Parametric generation of propagating spin waves in ultrathin yttrium iron garnet waveguides,” Phys. Status Solidi RRL 14, 2000011 (2020).
- Heinz et al. (2022) Björn Heinz, Morteza Mohseni, Akira Lentfert, Roman Verba, Michael Schneider, Bert Lägel, Khrystyna Levchenko, Thomas Brächer, Carsten Dubs, Andrii V. Chumak, and Philipp Pirro, “Parametric generation of spin waves in nanoscaled magnonic conduits,” Phys. Rev. B 105, 144424 (2022).
- Urazhdin et al. (2010) Sergei Urazhdin, Vasil Tiberkevich, and Andrei Slavin, “Parametric excitation of a magnetic nanocontact by a microwave field,” Phys. Rev. Lett. 105, 237204 (2010).
- Chen et al. (2017) Yu-Jin Chen, Han Kyu Lee, Roman Verba, Jordan A. Katine, Igor Barsukov, Vasil Tiberkevich, John Q. Xiao, Andrei N. Slavin, and Ilya N. Krivorotov, “Parametric resonance of magnetization excited by electric field,” Nano Letters 17, 572–577 (2017).
- Ulrichs et al. (2011) Henning Ulrichs, Vladislav E. Demidov, Sergej O. Demokritov, and Sergei Urazhdin, “Parametric excitation of eigenmodes in microscopic magnetic dots,” Phys. Rev. B 84, 094401 (2011).
- Edwards et al. (2012) E. R. J. Edwards, H. Ulrichs, V. E. Demidov, S. O. Demokritov, and S. Urazhdin, “Parametric excitation of magnetization oscillations controlled by pure spin current,” Phys. Rev. B 86, 134420 (2012).
- Guo et al. (2014) Feng Guo, L. M. Belova, and R. D. McMichael, “Parametric pumping of precession modes in ferromagnetic nanodisks,” Phys. Rev. B 89, 104422 (2014).
- Brächer et al. (2017) T. Brächer, P. Pirro, and B. Hillebrands, “Parallel pumping for magnon spintronics: Amplification and manipulation of magnon spin currents on the micron-scale,” Physics Reports 699, 1–34 (2017).
- Beaulieu et al. (2018) N. Beaulieu, N. Kervarec, N. Thiery, O. Klein, V. Naletov, H. Hurdequint, G. de Loubens, J. Ben Youssef, and N. Vukadinovic, “Temperature dependence of magnetic properties of a ultrathin yttrium-iron garnet film grown by liquid phase epitaxy: Effect of a pt overlayer,” IEEE Magnetics Letters 9, 1–5 (2018).
- Klingler et al. (2015) Stefan Klingler, A V Chumak, Tim Mewes, Behrouz Khodadadi, Claudia Mewes, Carsten Dubs, Oleksii Surzhenko, Burkard Hillebrands, and Andrés Conca, “Measurements of the exchange stiffness of yig films using broadband ferromagnetic resonance techniques,” J. Phys. D: Appl. Phys. 48, 015001 (2015).
- Sangiao et al. (2017) Soraya Sangiao, César Magén, Darius Mofakhami, Grégoire de Loubens, and José Maria De Teresa, “Magnetic properties of optimized cobalt nanospheres grown by focused electron beam induced deposition (febid) on cantilever tips,” Beilstein J. Nanotechnol. 8, 2106–2115 (2017).
- Klein et al. (2008) O. Klein, G. de Loubens, V. V. Naletov, F. Boust, T. Guillet, H. Hurdequint, A. Leksikov, A. N. Slavin, V. S. Tiberkevich, and N. Vukadinovic, “Ferromagnetic resonance force spectroscopy of individual submicron-size samples,” Phys. Rev. B 78, 144410 (2008).
- (26) http://wpage.unina.it/mdaquino/index_file/MaGICo.html.
- d’Aquino et al. (2009) Massimiliano d’Aquino, Claudio Serpico, Giovanni Miano, and Carlo Forestiere, “A novel formulation for the numerical computation of magnetization modes in complex micromagnetic systems,” J. Comput. Phys. 228, 6130–6149 (2009).
- d’Aquino and Hertel (2023) Massimiliano d’Aquino and Riccardo Hertel, “Micromagnetic frequency-domain simulation methods for magnonic systems,” J. Appl. Phys. 133, 033902 (2023).
- Jersch et al. (2010) J. Jersch, V. E. Demidov, H. Fuchs, K. Rott, P. Krzysteczko, J. Münchenberger, G. Reiss, and S. O. Demokritov, “Mapping of localized spin-wave excitations by near-field brillouin light scattering,” Appl. Phys. Lett. 97, 152502 (2010).
- Guo et al. (2013) Feng Guo, L. M. Belova, and R. D. McMichael, “Spectroscopy and imaging of edge modes in permalloy nanodisks,” Phys. Rev. Lett. 110, 017601 (2013).
- Nembach et al. (2011) H. T. Nembach, Justin M. Shaw, T. J. Silva, W. L. Johnson, S. A. Kim, R. D. McMichael, and P. Kabos, “Effects of shape distortions and imperfections on mode frequencies and collective linewidths in nanomagnets,” Phys. Rev. B 83, 094427 (2011).
- Demidov and Demokritov (2015) Vladislav E. Demidov and Sergej O. Demokritov, “Magnonic waveguides studied by microfocus brillouin light scattering,” IEEE Trans. Magn. 51, 1–15 (2015).
- Perna et al. (2022a) S. Perna, F. Bruckner, C. Serpico, D. Suess, and M. d’Aquino, “Computational micromagnetics based on normal modes: Bridging the gap between macrospin and full spatial discretization,” J. Magn. Magn. Mater. 546, 168683 (2022a).
- Perna et al. (2022b) S. Perna, F. Bruckner, C. Serpico, D. Suess, and M. d’Aquino, “Normal modes description of nonlinear ferromagnetic resonance for magnetic nanodots,” AIP Adv. 12, 035244 (2022b).