DESI and DECaLS (D&D): galaxy-galaxy lensing measurements with 1% survey and its forecast
Abstract
The shear measurement from DECaLS (Dark Energy Camera Legacy Survey) provides an excellent opportunity for galaxy-galaxy lensing study with DESI (Dark Energy Spectroscopic Instrument) galaxies, given the large ( deg2) sky overlap. We explore this potential by combining the DESI 1% survey and DECaLS DR8. With deg2 sky overlap, we achieve significant detection of galaxy-galaxy lensing for BGS and LRG as lenses. Scaled to the full BGS sample, we expect the statistical errors to improve from to a promising level of at . This brings stronger requirements for future systematics control. To fully realize such potential, we need to control the residual multiplicative shear bias and the bias in the mean redshift . We also expect significant detection of galaxy-galaxy lensing with DESI LRG/ELG full samples as lenses, and cosmic magnification of ELG through cross-correlation with low-redshift DECaLS shear. If such systematical error control can be achieved, we find the advantages of DECaLS, comparing with KiDS (Kilo Degree Survey) and HSC (Hyper-Suprime Cam), are at low redshift, large-scale, and in measuring the shear-ratio (to ) and cosmic magnification.
keywords:
weak lensing – cosmology – galaxy-galaxy lensing1 Introduction
Weak gravitational lensing is one of the most promising cosmological probes in studying the nature of dark matter, dark energy, and gravity (Refregier, 2003; Mandelbaum, 2018). The combination between different probes can be even more powerful, due to more constraining power and breaking the degeneracy between the parameters (Planck Collaboration et al., 2020; DES Collaboration et al., 2021). However, possibly due to residual systematics or new physics beyond the standard CDM model, the tension between CMB (cosmic microwave background) at redshift and the late-time galaxy surveys at troubles us when using their synergy (Hildebrandt et al., 2017; Hamana et al., 2020; Hikage et al., 2019; Asgari et al., 2021; Heymans et al., 2021; DES Collaboration et al., 2021; Secco et al., 2022; Amon et al., 2021; Planck Collaboration et al., 2020). Many attempts have been made to examine this tension, in terms of different systematics (Yamamoto et al., 2022; Wright et al., 2020; Yao et al., 2020; Yao et al., 2017; Kannawadi et al., 2019; Pujol et al., 2020; Mead et al., 2021; Secco et al., 2022; Amon et al., 2022; Fong et al., 2019), different statistics (Asgari et al., 2021; Joachimi et al., 2021; Lin & Ishak, 2017; Harnois-Déraps et al., 2021; Shan et al., 2018; Sánchez et al., 2021; Leauthaud et al., 2022; Chang et al., 2019), and possible new physics (Jedamzik et al., 2021). We also refer to recent reviews for the readers’ references (Perivolaropoulos & Skara, 2021; Mandelbaum, 2018).
To fully understand the physics behind this so-called “” tension, different cosmological probes are required, as their sensitivities to the systematics are different. Many new observations are also needed, to explore different redshift ranges, sky patches, and even equipment properties. Among the many proposed stage IV galaxy surveys like Dark Energy Spectroscopic Instrument (DESI DESI Collaboration et al. (2016a, b)), Vera C. Rubin Observatory’s Legacy Survey of Space and Time (LSST, LSST Science Collaboration et al. 2009), Euclid (Laureijs et al., 2011), Roman Space Telescope (or WFIRST, Spergel et al. 2015) and China Space Station Telescope (CSST, Gong et al. 2019), DESI is the only one currently operating and has measured more than 7.5 million redshifts so far.
DESI itself will provide tremendous constraining power in studying the expansion history of the Universe as well as the large-scale structure (DESI Collaboration et al., 2016a). Its cross-correlations with other lensing surveys (referred to as galaxy-galaxy lensing or g-g lensing) will provide not only more, but also independent cosmological information (Prat et al., 2021; Joudaki et al., 2018; Sánchez et al., 2021), while it can be used to study the galaxy-matter relation (Leauthaud et al., 2022, 2017), test gravity (Zhang et al., 2007; Jullo et al., 2019; Blake et al., 2020), and study the systematics (Yao et al., 2020; Yao et al., 2017; Zhang, 2010; Zhang et al., 2010; Giblin et al., 2021). However, stage III surveys like DES (Dark Energy Survey, DES Collaboration et al. 2021), KiDS (Kilo-Degree Survey, Heymans et al. 2021), and HSC (Hyper-Suprime Cam, Hikage et al. 2019) do not offer extremely large overlap with DESI, while the stage IV surveys mentioned previously will require many years of observations before reaching their full overlap with DESI. In short, the sky overlap will limit the cross-correlation studies with DESI in the near future.
In this work, we study the cross-correlations between galaxy shear measured from DECaLS (Dark Energy Camera Legacy Survey) DR8 and galaxies from the DESI (SV3) survey, and compare those with the overlapped data from KiDS and HSC. We measure the g-g lensing signals of the different weak lensing surveys with DESI 1% survey and estimate their S/N (signal-to-noise ratio) that can be achieved with full DESI in the future. We explore the advantages of DECaLS, and exhibit the measurements of shear-ratio and cosmic magnification as two promising tools in using the great constraining power of DECaLS DESI. Additionally, to achieve the expected precision, we propose requirements on the DECaLS data, in terms of the shear calibration and the redshift distribution calibration.
This work is organized as follows. In Section 2 we briefly introduce the observables and their theoretical predictions. In Section 3 we describe the DESI, DECaLS, KiDS, and HSC data we use. In Section 4 we show the g-g lensing measurements for different DESI density tracers and different lensing surveys, and the measurements of shear-ratio and cosmic magnification. We summarize our findings from DESIDECaLS for the 1% survey in Section. 5.
2 Theory
In this section, we briefly review the theory of the g-g lensing observables. We assume spacial curvature so that the comoving radial distance equals the comoving angular diameter distance.
2.1 Galaxy-galaxy lensing
Since the foreground gravitational field can distort the shape of the background galaxy, there will be a correlation between the background galaxies’ gravitational shear and the foreground galaxies’ number density . The correlation of (or ) will probe the clustering of the underlying matter field (or the matter power spectrum ), the galaxy bias , and the redshift-distance relation, which are sensitive to the cosmological model and gravitational theory. We recall the g-g lensing angular power spectrum (Prat et al., 2021):
| (1) |
which is a weighted projection from the 3D non-linear matter power spectrum to the 2D galaxy-lensing convergence angular power spectrum . It will also depend on the galaxy bias , the comoving distance , the redshift distribution of the lens galaxies , and the lensing efficiency as a function of the lens position (given the distribution of the source galaxies) , which is written as
| (2) |
where denotes the distribution of the source galaxies as a function of comoving distance, while and denote the comoving distance to the source and the lens, respectively.
The real-space galaxy-shear correlation function can be obtained through the Hankel transformation
| (3) |
where is the Bessel function of the first kind with order 2. The “G” represents the gravitational lensing shear , which is conventionally used to separate from the intrinsic alignment , whose contribution is ignored in this work due to the photo- separation shown later.
Therefore, by observing the correlation of , we can derive the constraints on the cosmological parameters through Eq. (1), and . In order to get the precise cosmology, many systematics need to be considered, for example, the shear calibration error that can shift the measurement of , the inaccurate estimation of redshift distribution for the source which can bias the theoretical estimation of Eq. (1), the massive neutrino effects and the baryonic effects that can bias the matter power spectrum , and the non-linear galaxy bias 111In this work we use the mathematical classification of linear/non-linear bias as a matched filter, however, for more physical modeling, this is normally expressed as 1-halo/2-halo terms and HOD (halo occupation distribution) descriptions such as central/satellite fractions (Leauthaud et al., 2017). In this work, we mainly focus on the statistical significance for DESIDECaLS, rather than the systematics. The current statistical error for the survey is expected to be more dominant, but for cautious reasons, we will not give final estimations on the cosmological parameters.
2.2 Shear-ratio
The g-g lensing two-point statistics normally contain stronger detection significance at the small-scale than at the large-scale, due to a stronger tidal gravitational field and more galaxy pairs (throughout the whole sky, not around a particular galaxy). However, due to the inaccurate modeling of small-scale effects, such as the non-linear galaxy bias , suppression in the matter power spectrum due to massive neutrino and baryonic effects, etc., the small-scale information is conventionally abandoned (Heymans et al., 2021; DES Collaboration et al., 2021; Lee et al., 2022). However, by choosing the same lens galaxies with source galaxies at different redshifts, i.e. with the same redshift distribution for the lens while different redshift distribution and for the sources, the ratio between the angular power spectra and (or the correlation functions and ) will mainly base on the two lensing efficiency functions as in Eq. (2) for the -th and -th source bins. This ratio does not suffer strongly from the modeling of the galaxy bias or the matter power spectrum , as they share the same lens sample according to Eq. (1). The shear-ratio (or lensing-ratio) has been used to improve cosmological constraints (Sánchez et al., 2021), as it is sensitive to the relation in Eq. (2) and the nuisance parameters for the systematics, or to study the shear bias (Giblin et al., 2021). In this work, we will show the great potential of measuring shear-ratio with DESIDECaLS.
To account for the full covariance in measuring shear-ratio , and to prevent possible singular values when taking the ratio (when ), we construct the following data vector
| (4) |
which is designed to be when is correctly predicted from the two data sets and that we want to take the ratio. The resulting covariance for the data vector is
| (5) |
where is the covariance between and . The likelihood of will give the posterior of the shear-ratio . To account for the covariance is -dependent, normalization is done thereafter so that its PDF satisfies . An alternative way is to marginalize over the theoretical predictions , similar to Sun et al. (2022); Dong et al. (2022), which we leave for future studies.
2.3 Cosmic magnification
The observed galaxy number density is affected by its foreground lensing signals, leading to an extra fluctuation besides the intrinsic clustering of galaxies, namely,
| (6) |
where denotes the observed lensed galaxy overdensity, denotes the intrinsic overdensity of galaxies due to gravitational clustering, is the lensing convergence affecting the flux and the positions of the foreground galaxy sample, and due to the foreground inhomogeneities. For a complete and flux-limited sample, the magnification amplitude . In that case, the magnification amplitude is sensitive to the galaxy flux function , denoting the number of galaxies brighter than flux limit , with .
According to Eq. (6), for a given galaxy sample at , it not only contains clustering information of , but also has lensing information of from the matter at , which is normally treated as a contamination to the clustering signals (von Wietersheim-Kramsta et al., 2021; Deshpande & Kitching, 2020; Kitanidis & White, 2021). Meanwhile, attempts have been made to directly measure the cosmic magnification as a source of cosmological information (Liu et al., 2021; Gonzalez-Nuevo et al., 2020; Yang et al., 2017).
We follow the method of Liu et al. (2021) and correlate the shear galaxies at lower redshift (bin ) and the number density galaxies at higher redshift (bin ),
| (7) |
which requires the redshift distribution of being significantly separated from , so that the intrinsic clustering lensing shear signal vanishes. The corresponding correlation function from the Hankel transformation is similar to Eq. (3).
2.4 Signal-to-noise definition
The S/N definition in this work uses amplitude fitting. For a given measurement and an assumed theoretical model , we fit an amplitude to the likelihood:
| (8) |
so that a posterior of can be obtained, where is the Gaussian standard deviation. Then the corresponding S/N is .
We note that, if is a single value rather than a data vector, this S/N defined by amplitude fitting is identical to the S/N of the data itself, namely . This is the case for most of the S/N calculated in this work, when there is one single measurement at small-scale and one at large-scale, and the small-scale and large-scale data correspond to different (nonlinear/linear) galaxy biases so they should be treated separately.
3 Data
In this section, we introduce the DESI spectroscopic data and the shear catalogs from DECaLS/KiDS/HSC. We note even though the DES-Y3 catalog can have an overlap with full DESI for deg2, its overlap with DESI SV3 catalog is . We, therefore, do not present any analysis for DES.
3.1 DESI
DESI is the only operating Stage IV galaxy survey. It is designed to cover 14,000 deg2 of the sky, with 5,000 fibers collecting spectra simultaneously (DESI Collaboration et al., 2016b; Silber et al., 2022; Miller et al., 2022). DESI aims to observe density tracers such as BGS (Bright Galaxy Survey, Ruiz-Macias et al. 2020), LRG (luminous red galaxies, Zhou et al. 2020), ELG (emission line galaxies, Raichoor et al. 2020), and QSO (quasi-stellar objects, Yèche et al. 2020), with generally increasing redshift. Other supporting papers on target selections and validations can be find in Allende Prieto et al. (2020); Alexander et al. (2022); Lan et al. (2022); Cooper et al. (2022); Hahn et al. (2022); Zhou et al. (2022); Chaussidon et al. (2022). DESI plans to use these tracers to study cosmology, especially in BAO (baryonic acoustic oscillations) and RSD (redshift-space distortions) (DESI Collaboration et al., 2016a; Levi et al., 2013). It is located on the 4-meter Mayall telescope in Kitt Peak, Arizona (DESI Collaboration et al., 2022). From 2021 till now, DESI has finished its “SV3” (DESI collaboration et al., 2022) and “DA0.2” catalogs, which will be included in the coming Early Data Release (EDR, DESI collaboration et al. 2023). The Siena Galaxy Atlas (Moustakas et al., 2022) is also expected soon.
The DESI experiment is based on the DESI Legacy Imaing Surveys (Zou et al., 2017; Dey et al., 2019; Schlegel et al., 2022), with multiple supporting pipelines in spectroscopic reduction (Guy et al., 2022), derivation of classifications and redshifts (Bailey et al., 2022), fiber assigement (Raichoor et al., 2022), survey optimization (Schlafly et al., 2022), spectroscopic target selection (Myers et al., 2022)
In this work, we use the DESI SV3 catalog, which is also known as the survey (with a sky coverage of deg2), for the g-g lensing study. We consider the DESI BGS, LRGs, and ELGs, while ignoring the QSOs as the available number is relatively low. In SV3, each galaxy is assigned a weight to account for the survey completeness and redshift failure. Since the purpose of this paper is not a precise measurement of cosmology, we assume the linear galaxy biases follow , , and , where is the linear growth factor normalized to (DESI Collaboration et al., 2016a). The number of galaxies used will be informed later in the paper, as the overlap between the DESI survey and the lensing surveys are different.
3.2 DECaLS
We use lensing shear measurement from DECaLS DR8, which contains galaxy images in , , and bands (Dey et al., 2019). DECaLS DR8 galaxies are processed by Tractor (Meisner et al., 2017; Lang et al., 2014) and divided into five types according to their morphologies: PSF, SIMP, DEV, EXP, and COMP (Phriksee et al., 2020; Yao et al., 2020; Zu et al., 2021; Xu et al., 2021). The galaxy ellipticities are measured —- except for the PSF type —- with a joint fit on the , , and bands. A conventional shear calibration (Heymans et al., 2012; Miller et al., 2013; Hildebrandt et al., 2017) is applied as in
| (9) |
with a multiplicative bias and additive bias , to account for possible residual bias from PSF modeling, measurement method, blending and crowding (Mandelbaum et al., 2015; Euclid Collaboration et al., 2019). This calibration is obtained by comparing with Canada–France–Hawaii Telescope (CFHT) Stripe 82 observed galaxies and Obiwan simulated galaxies (Phriksee et al., 2020; Kong et al., 2020).
Several versions of the photometric redshift for the DECaLS galaxies have been estimated (Zou et al., 2019; Zhou et al., 2021; Duncan, 2022). We apply the most widely used one (Zhou et al., 2021), which uses the , , and optical bands from DECaLS while borrowing and infrared bands from WISE (Wide-field Infrared Survey Explorer, Wright et al. 2010). The photo- algorithm is trained based on a decision tree, with training samples constructed from a wide selection of spectroscopic redshift surveys and deep photo- surveys. We additionally require to select galaxies with better photo-. We use the photo-z distribution to represent the true-z distribution , while allowing a systematic bias of in the form , to pass its effect to Eq. (2) then Eq. (1). This is appropriate as weak lensing is mainly biased due to the mean redshift but slightly affected by the redshift scatter.
Overall, the DR8 shear catalog has deg2 sky coverage —- which will be the final overlap with full DESI —- with an average galaxy number density of gal/arcmin2. The overlapped area with DESI survey is deg2, which is significantly larger than the other stage III lensing surveys.
We note that the current DECaLS DR8 shear catalog can have some residual multiplicative bias (Yao et al., 2020; Phriksee et al., 2020), possibly due to the selections in observational data while making the comparison (Li et al., 2020; Jarvis et al., 2016). This will prevent us from getting reliable cosmology for measurements with . Also, there exists a possible bias in the redshift distribution , which will require a galaxy color-based algorithm (Hildebrandt et al., 2017; Buchs et al., 2019; Wright et al., 2020) or a galaxy clustering-based algorithm (Peng et al., 2022; Zhang et al., 2010; van den Busch et al., 2020) to get the correction. For these two reasons, we choose not to extend this study to the precision cosmology level. A future version of the DECaLS DR9 shear catalog is under development, with improved data reduction and survey procedures222https://www.legacysurvey.org/dr9/description/, with more advanced shear calibration for a pure Obiwan image simulation-based algorithm (Yao et al. in preparation) and redshift calibration (Xu et al. in preparation).
3.3 KiDS
The Kilo-Degree Survey is run by the European Southern Observatory and is designed for weak lensing studies in optical bands. The KiDS data are processed by THELI (Erben et al., 2013) and Astro-WISE (de Jong et al., 2015; Begeman et al., 2013). The galaxy shear measurements are obtained by fit (Fenech Conti et al., 2017; Miller et al., 2013), and the photo-s are measured by BPZ (Benitez, 2000; Benítez et al., 2004) using the KiDS optical bands and the infrared bands from VIKING (Wright et al., 2019). The KiDS shears are calibrated following the same equation as Eq. (9) with image simulation Kannawadi et al. (2019).
3.4 HSC
The Hyper Suprime-Cam Subaru Strategic Program (HSC-SSP, or HSC) is a Japanese lensing survey using the powerful Subaru telescope. It covers five photometric bands . Compared with KiDS and DES, HSC has its unique advantage in the galaxy number density and high-z galaxies (but with a smaller footprint). The HSC shears are calibrated similarly to Eq. (9) (Mandelbaum et al., 2018) but with an additional shear responsivity (Hamana et al., 2020).
We use the HSC-Y1 shear catalog (Hikage et al., 2019; Hamana et al., 2020), which overlaps with DESI SV3 for deg2. The expected overlap between HSC-Y3 data and full DESI is deg2.
4 Results
In this section, we show the measurements of different galaxy-shear correlation functions. The estimator for the galaxy-shear correlation is:
| (10) |
where , and denotes the lensing weight (inverse-variance weight for DECaLS Phriksee et al. 2020 and HSC Hikage et al. 2019, an adjusted version for KiDS Miller et al. 2013), the multiplicative bias correction (for HSC there is an extra shear responsivity included), and the tangential shear of the source galaxy, with respect to the given lens galaxy with weight or . The -summations are calculated for all the ellipticity-density (ED) pairs and the ellipticity-random (ER) pairs. We note Eq. (10) already includes the correction for boost factor (Mandelbaum et al., 2005; Amon et al., 2018), and this equation is adequate for the multiplicative bias defined either per galaxy or per sample. The correlation uses DESI official random catalogs to simultaneously correct for the additive bias in the presence of a mask and reduce the shape noise. We will show the measurements with different lens samples and source catalogs using the above estimator.
4.1 DESI
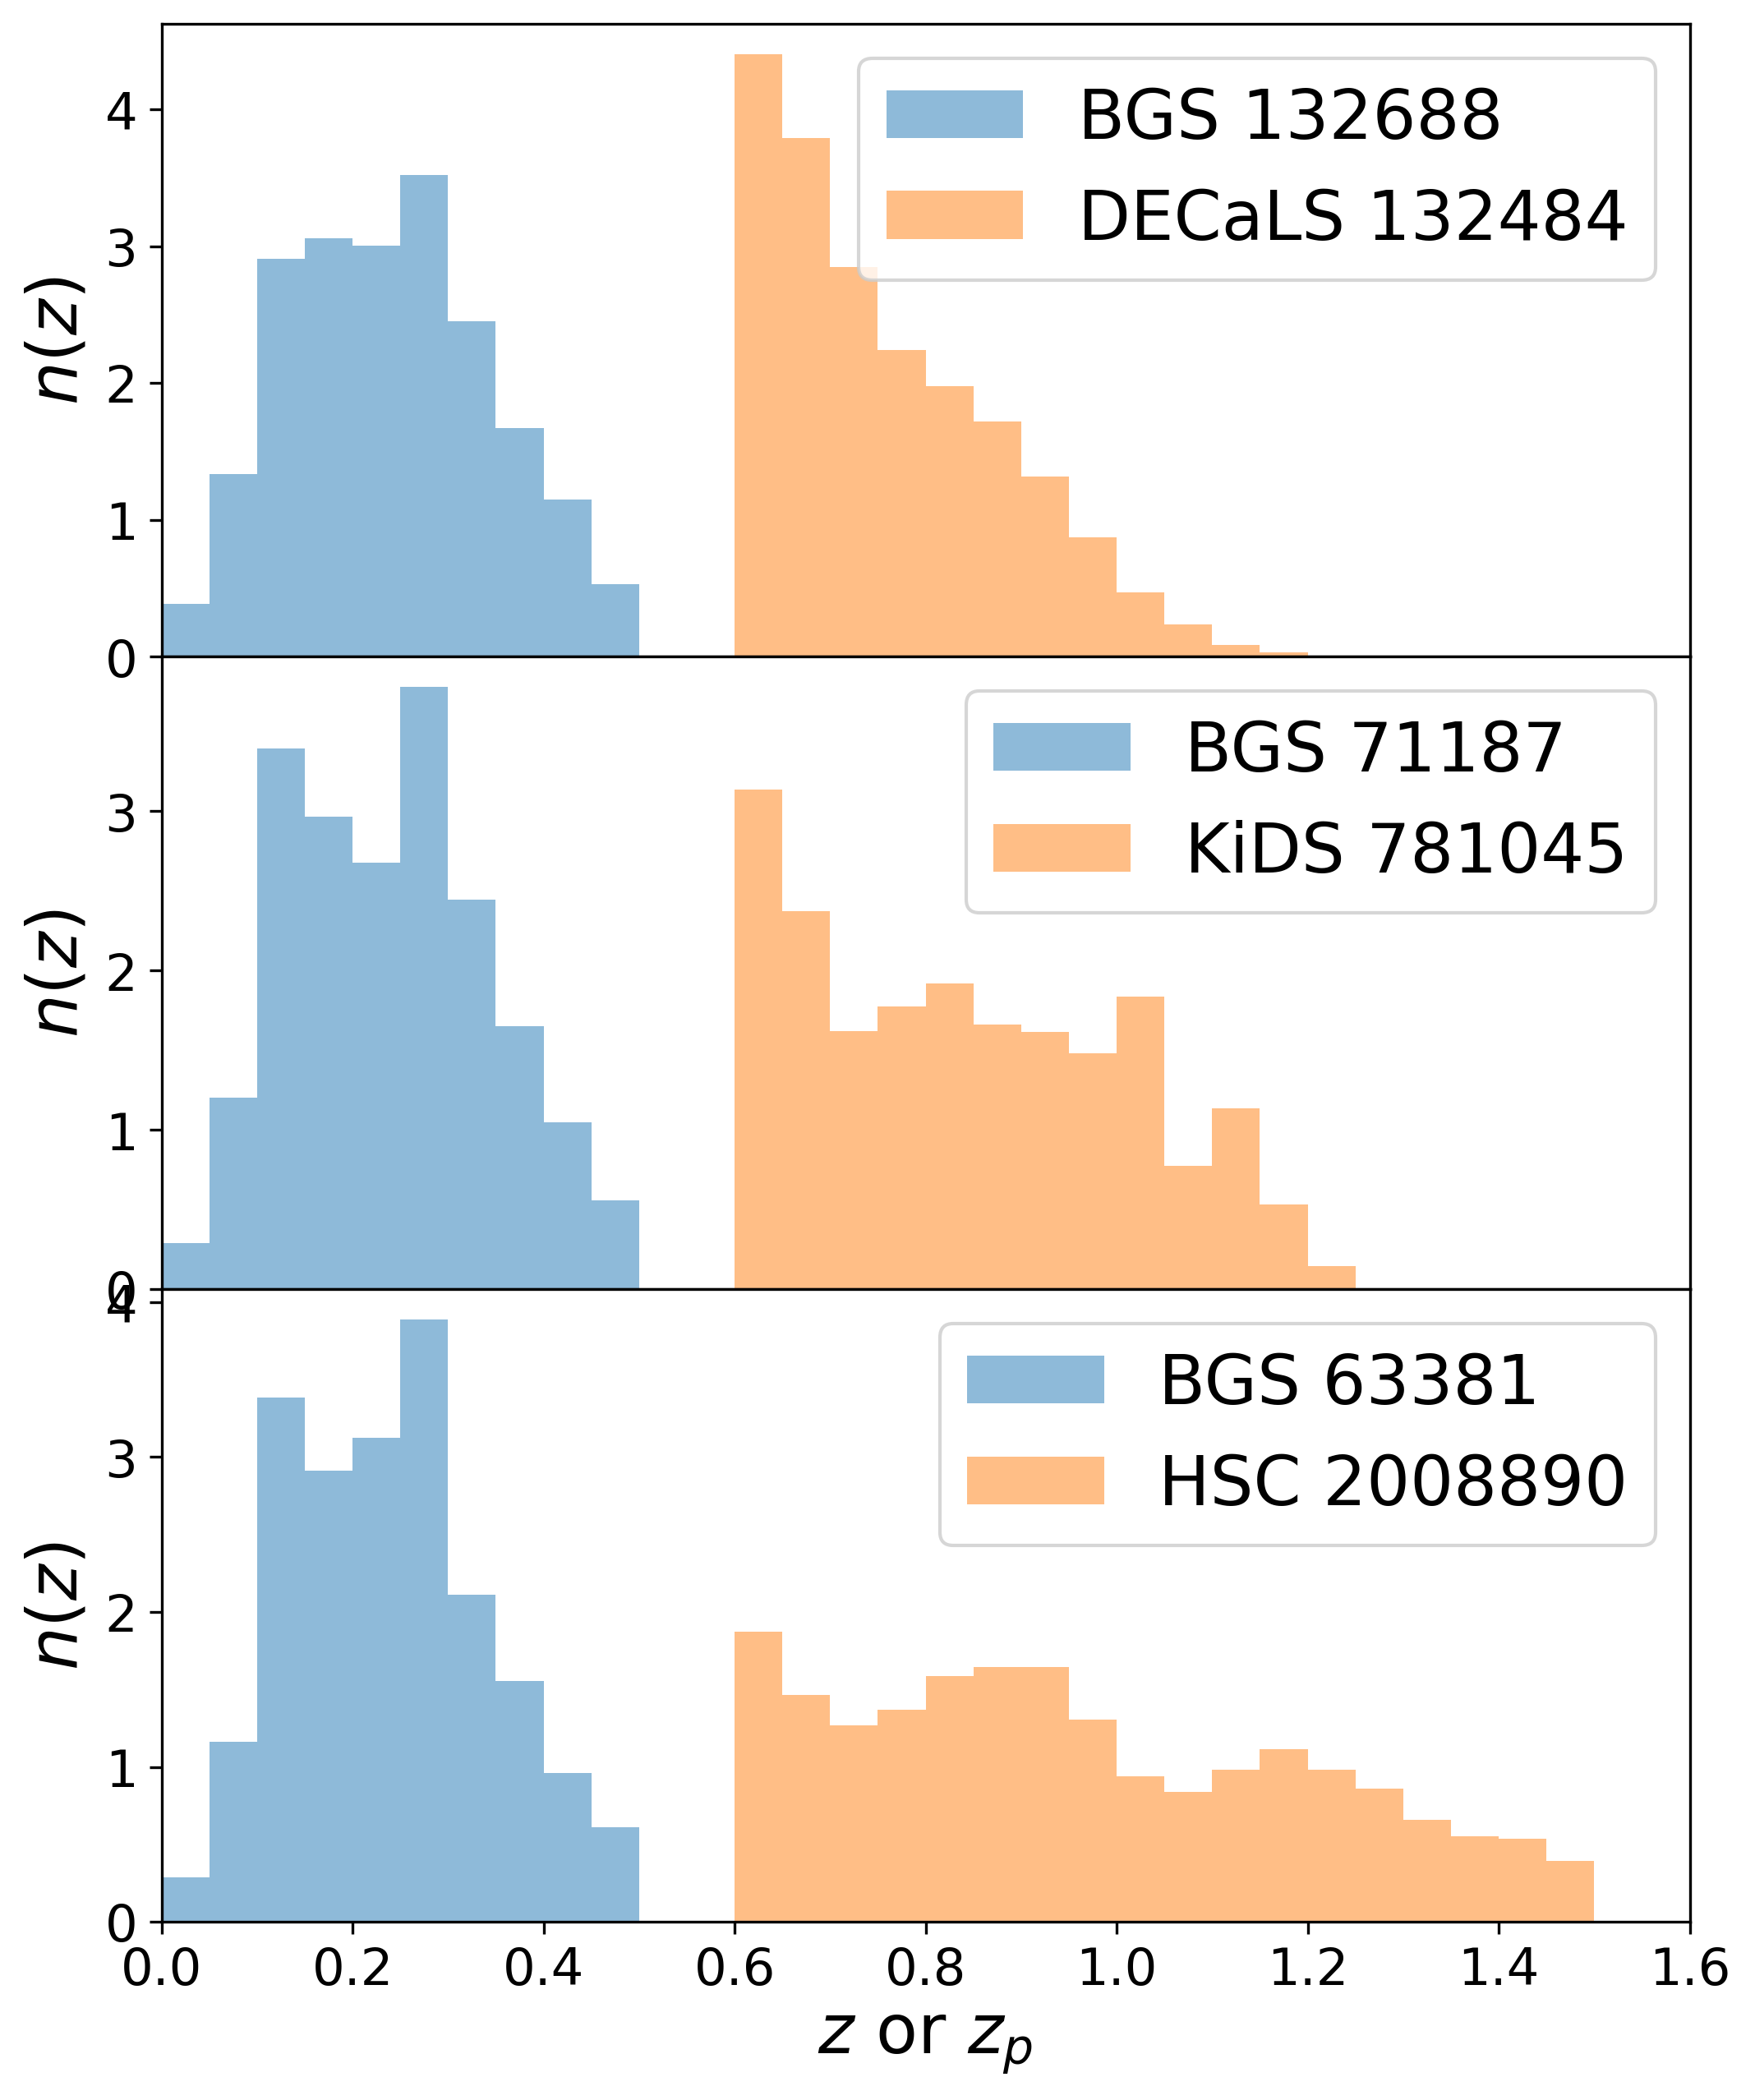
We first show the g-g lensing measurements for DESI BGS and the three shear catalogs. The normalized redshift distributions are shown in Fig. 1, with the number of galaxies being used in the labels. We use BGS with , and require the photo- of the source galaxies located at , so that the overlap in redshift is very small even considering the inaccuracy of photo-. We see that DECaLS has the most available BGS lenses, while HSC has the most available sources and the highest redshift. We notice there are unexpected spikes for the photo-z distribution of KiDS, which is probably due to cosmic variance as the overlapped area is much smaller than the full KiDS data.
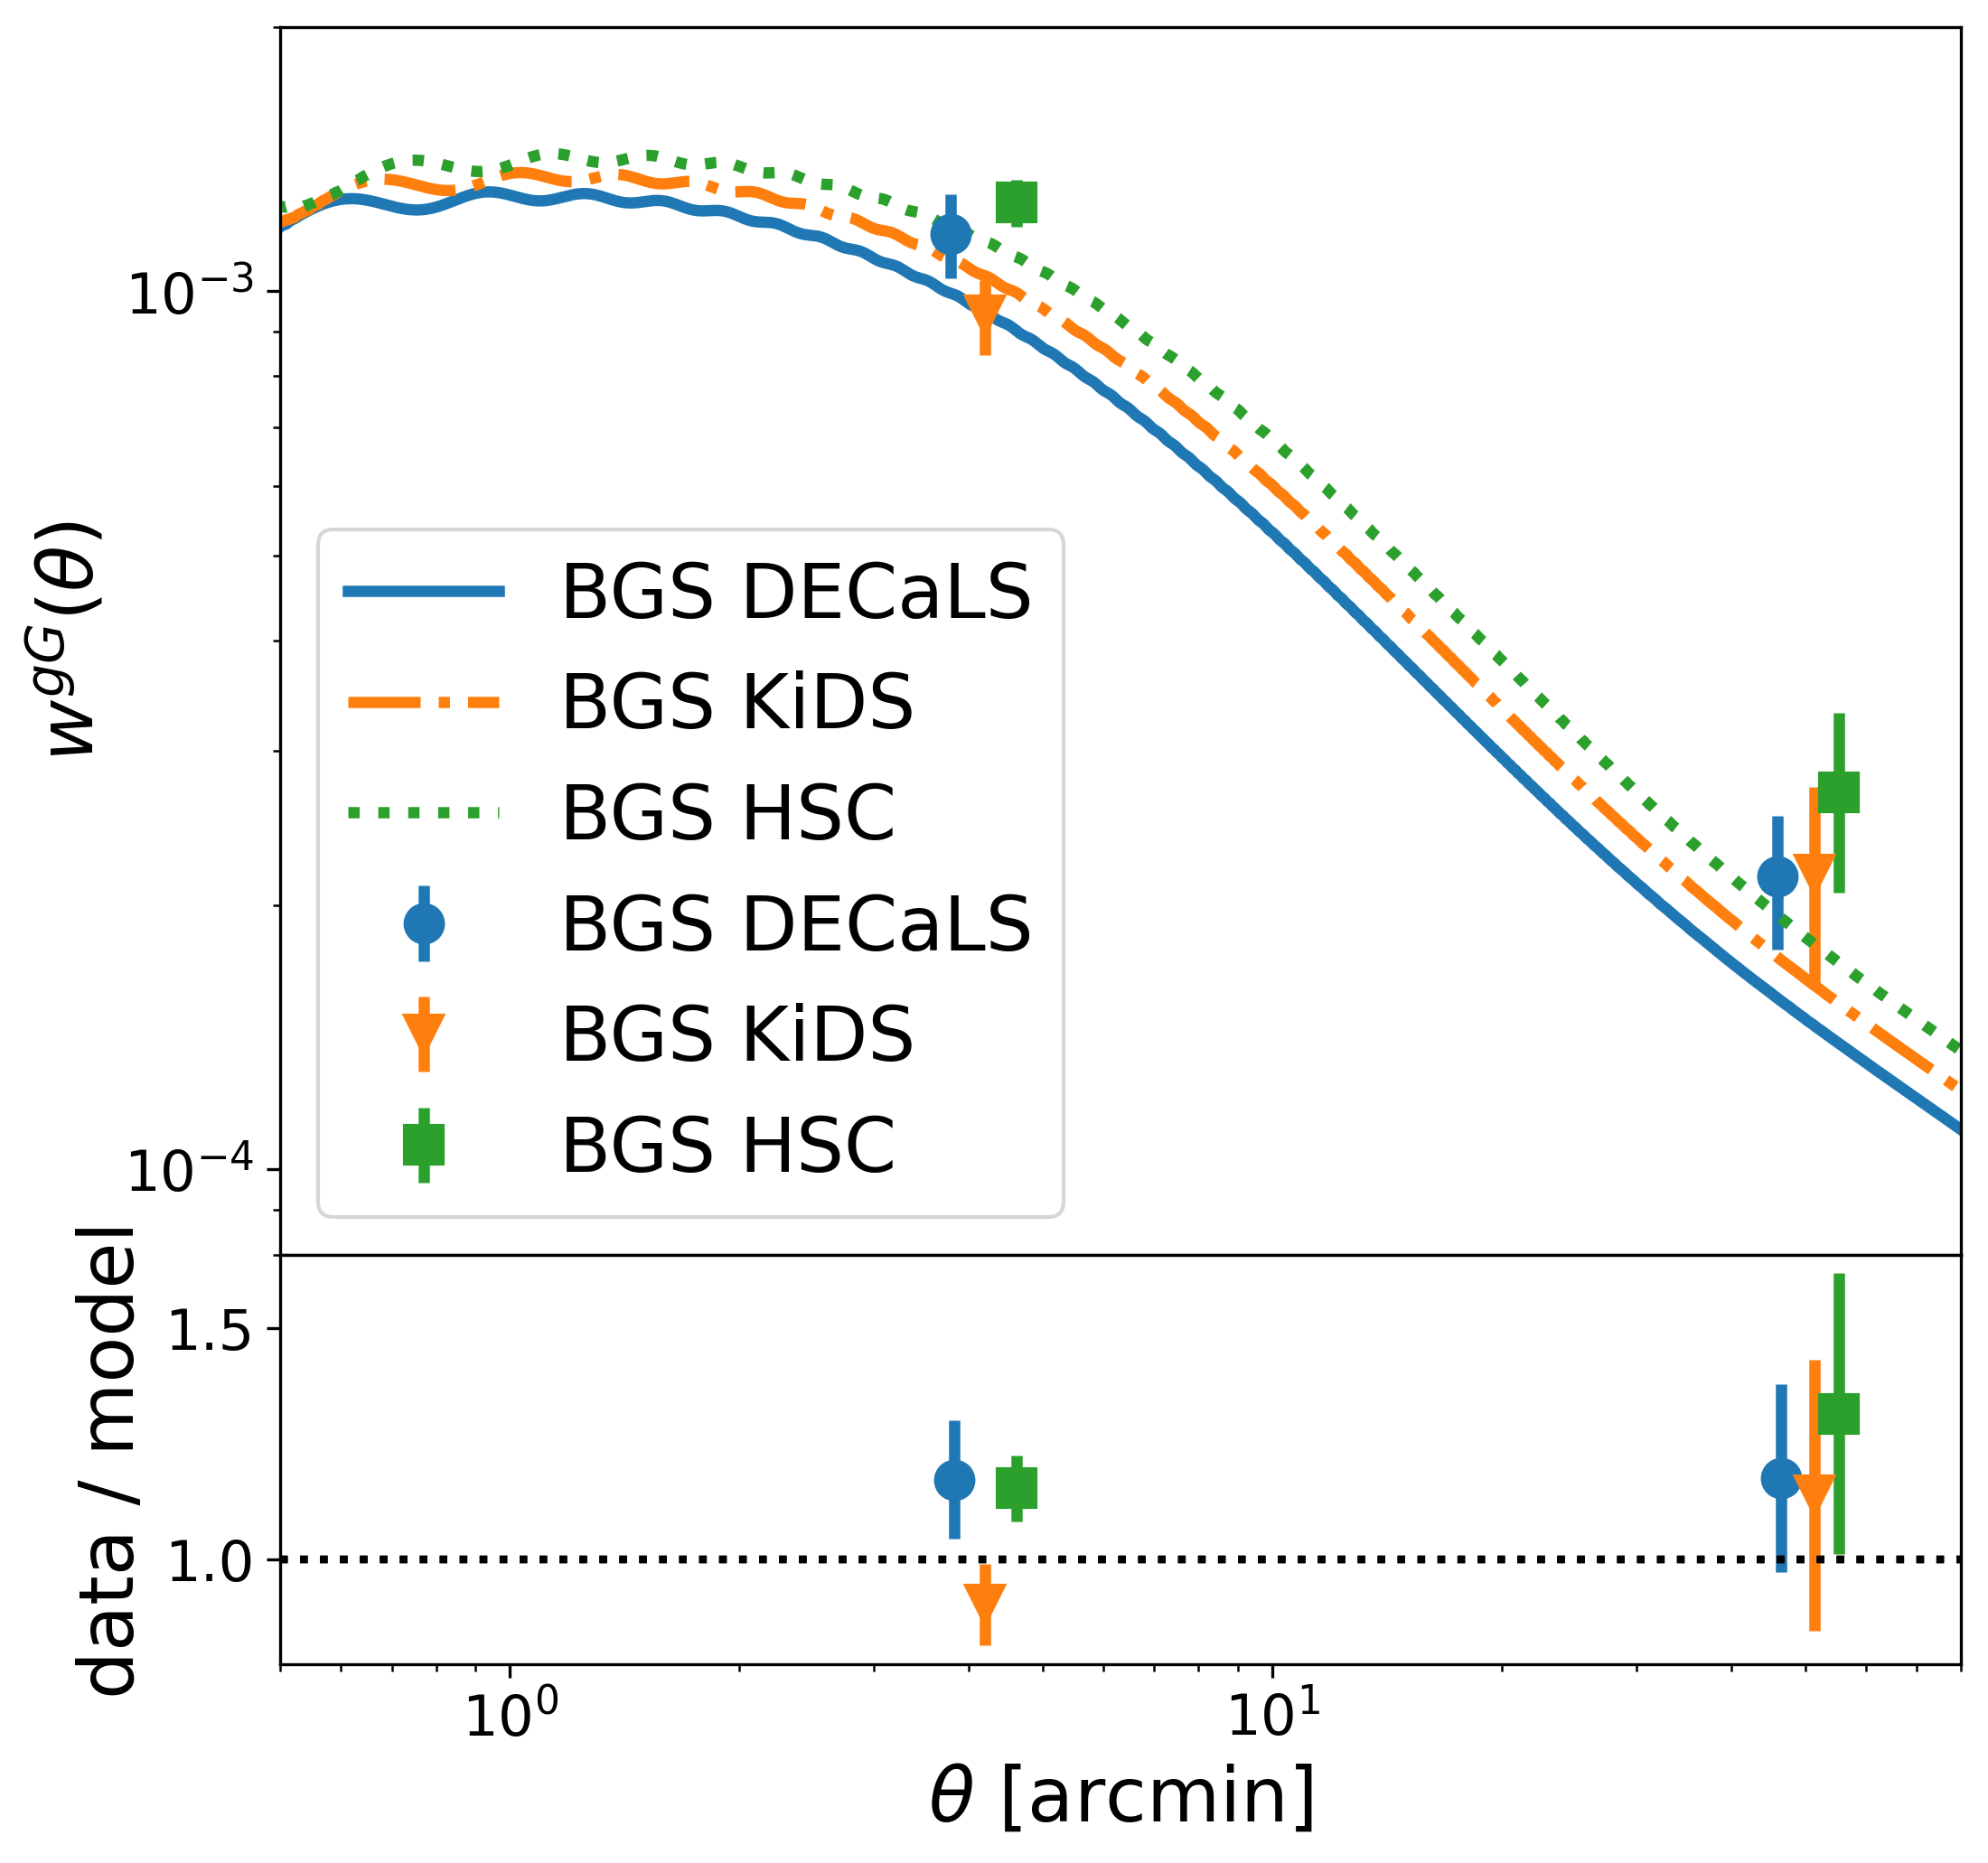
We show the measured correlation functions for the DESI BGS g-g lensing in Fig. 2. The correlations are measured in 2 logarithmic bins in arcmin, with the statistical uncertainties calculated using jackknife re-sampling. We find that all three lensing surveys have strong g-g lensing signals, even for the current 1% DESI data. The measurements are shown in blue dots (DECaLS), orange triangles (KiDS), and green squares (HSC), while the corresponding theoretical comparisons are shown in the blue solid curve, the orange dash-dotted curve, and the green dotted curve. From this figure, we find that the advantage of DECaLS is its large-scale cosmological information, with the highest S/N . This is due to DECaLS’s significantly large overlap with DESI, reducing the cosmic variance. On the other hand, KiDS and HSC has larger S/N than DECaLS at small-scale, due to their higher source galaxy number density, which lowers the shape noise.
In this work we choose not to estimate the best-fit cosmology, as for DECaLS, there are some unaddressed potential systematics (as discussed in Sec 3.2), while for KiDS and HSC we do not want to harm the ongoing blinding efforts in the DESI collaboration (although for a larger catalog with the larger overlapped area). The theoretical estimations in Fig. 2 and all the other similar figures in this work are based on the KiDS-1000 COSEBI CDM cosmology with maximum posterior of the full multivariate distribution (MAP, Asgari et al. (2021)), which has , , , and . We note the choice of other fiducial cosmology (Planck Collaboration et al., 2020; Asgari et al., 2021; DES Collaboration et al., 2021; Hamana et al., 2020) will give similar results for the current stage with DESI SV3. The linear galaxy biases are assumed following the descriptions of difference density tracers in Sec 3.1.
We note that the choice of 2 log-bins is limited by the 20 jackknife sub-regions (Yao et al., 2020; Mandelbaum et al., 2006), which is limited by: (1) the requirement of each jackknife sub-region is independent up to the largest scale we use (80 arcmin), and (2) the size of the overlapped region for KiDS and HSC ( deg2). As the DESI survey expands, the available overlapped region will increase accordingly, resulting in increases in both the available number of sub-regions and the maximum angular scale we can measure. Alternatively, we can use an analytical covariance (similar to Appendix A but more tests need to be done) or simulation based covariance for future DESI data. We also note in this work the inverses of the covariances are corrected (Hartlap et al., 2007; Wang et al., 2020) due to the limited number of sub-regions.
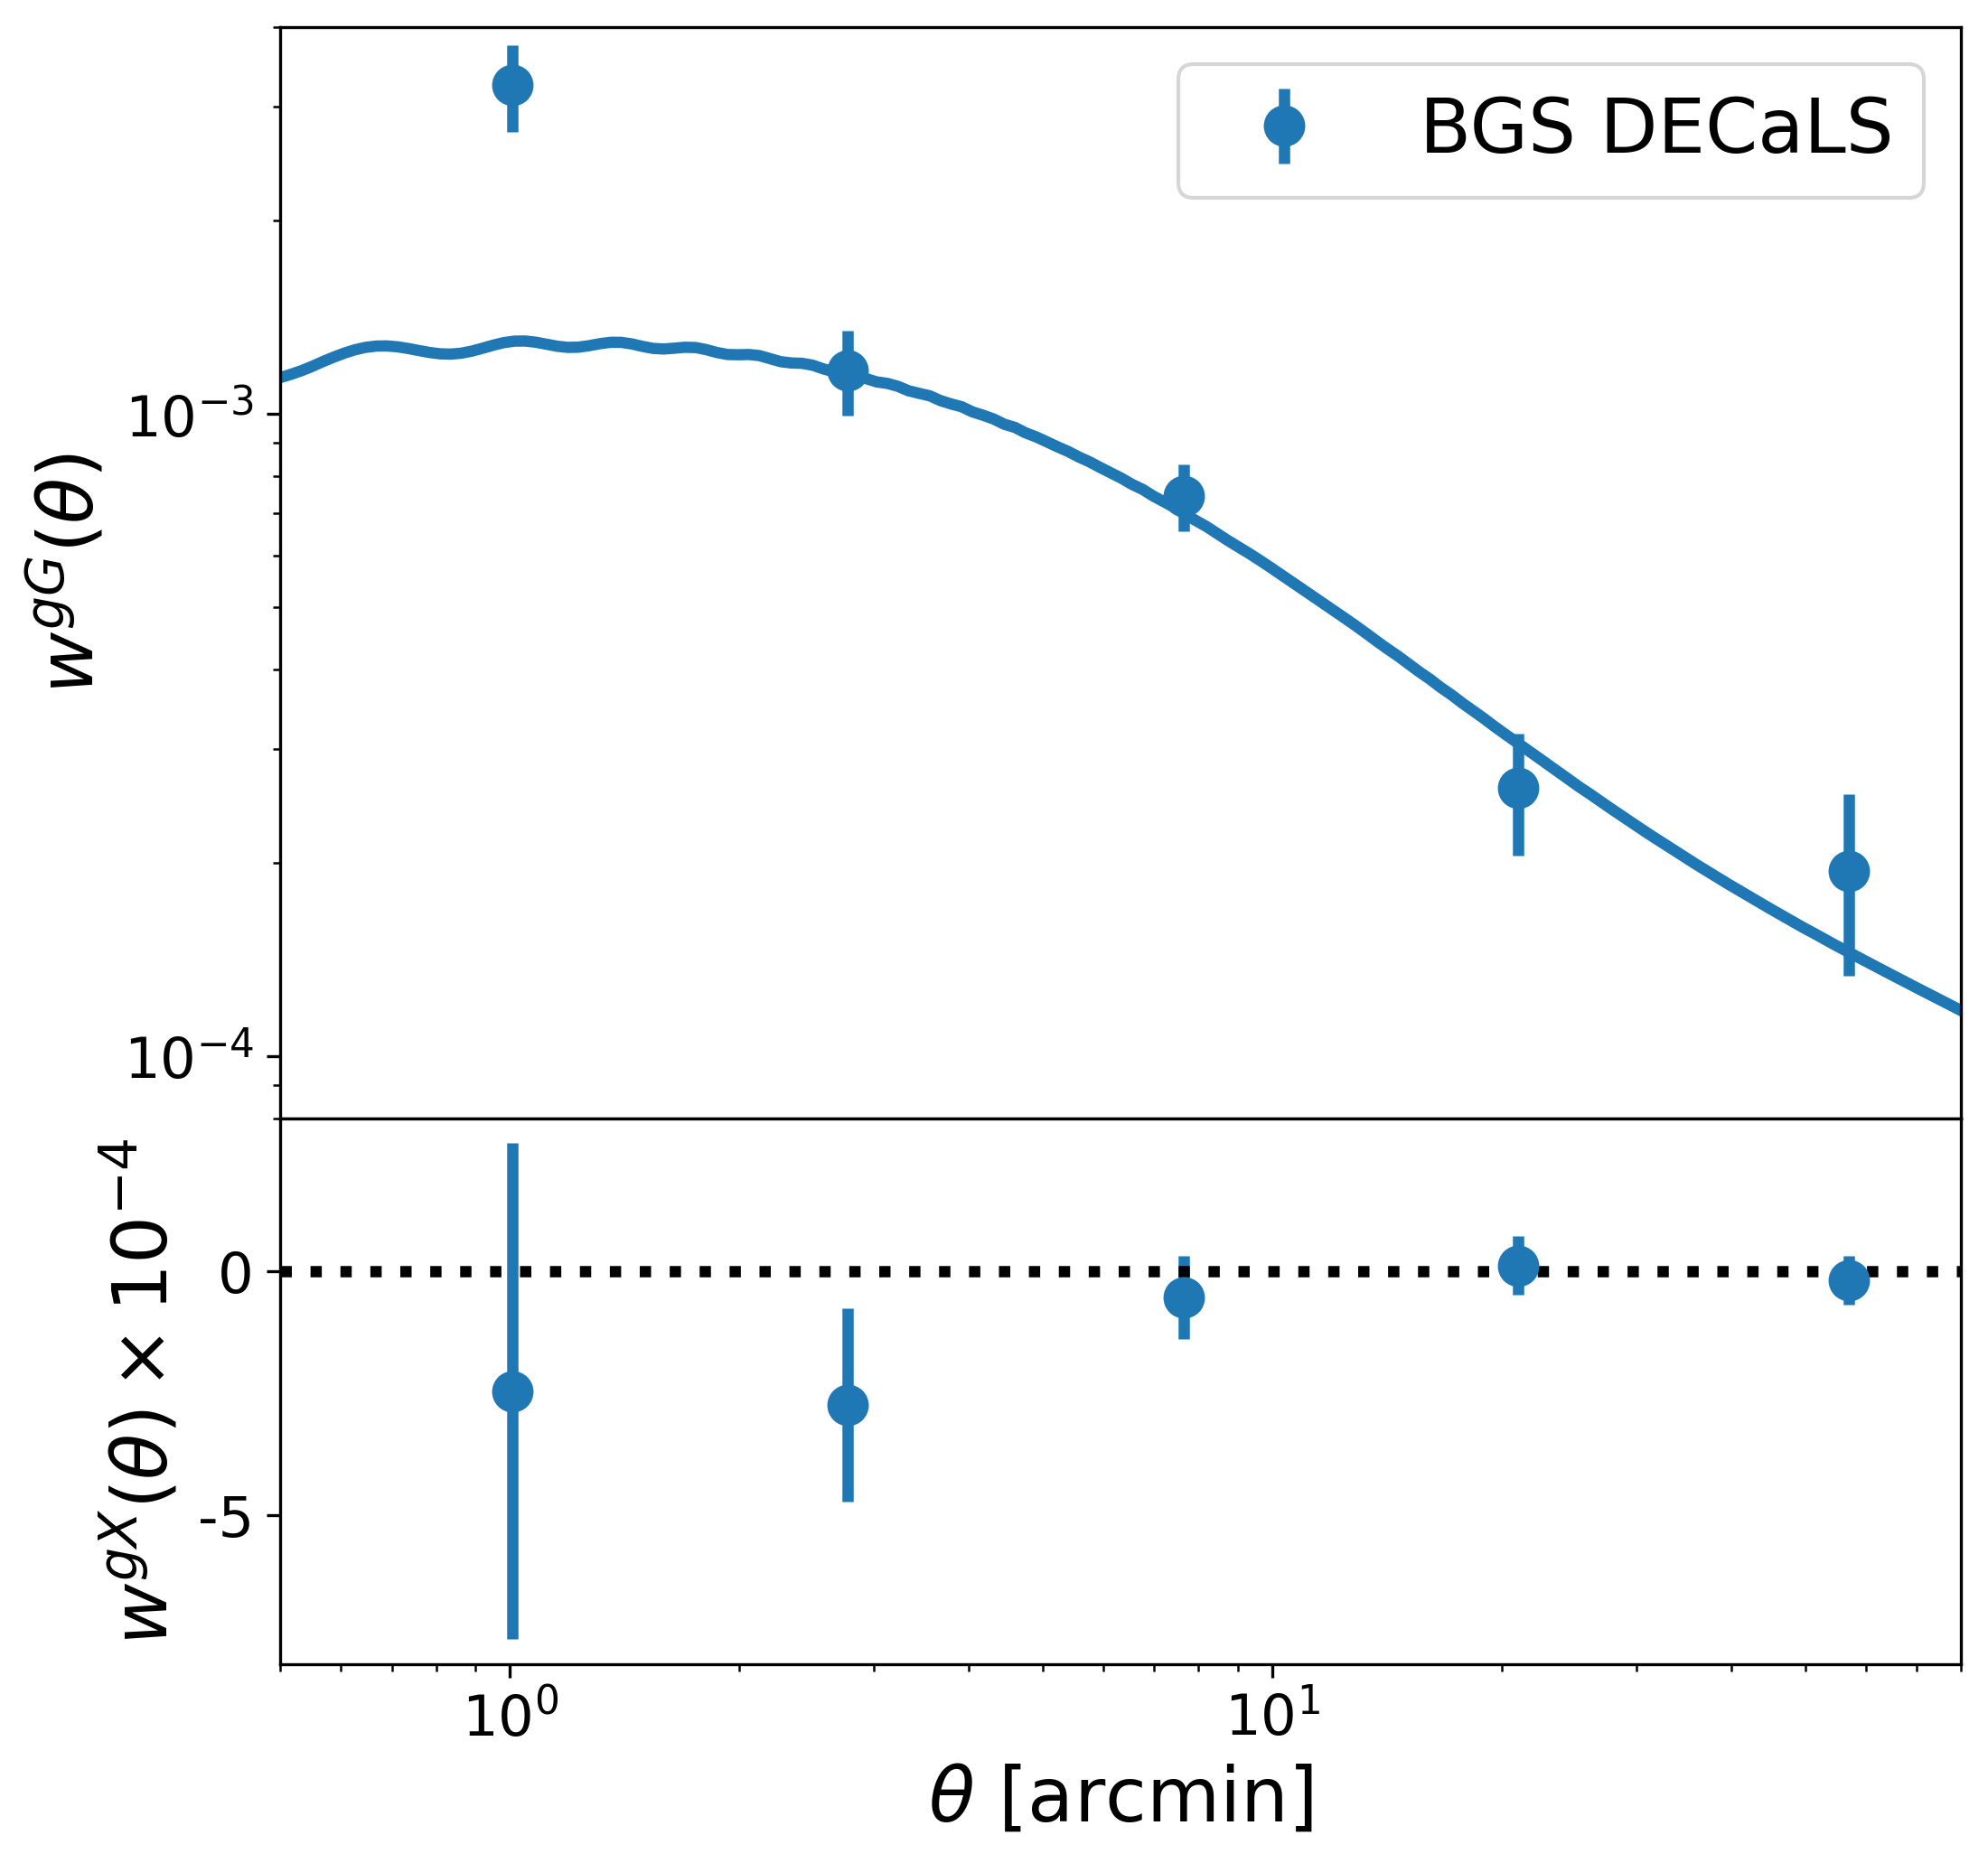
As a demonstration of more angular binning, we use BGSDECaLS data to show the choice of 50 jackknife sub-regions and 5 angular bins, as in Fig. 3. We show that with proper binning, more cosmological information can be extracted. The arcmin measurements (the right 4 large-scale dots) agree with the linear bias assumption very well. In the future, with a larger overlapped footprint, more jackknife sub-regions can be used, so that more angular bins can be measured, either to increase the total S/N or to address any scale-dependent systematics. We do see great potential for DECaLS from the above results, although measurements will ultimately be limited by systematic errors.
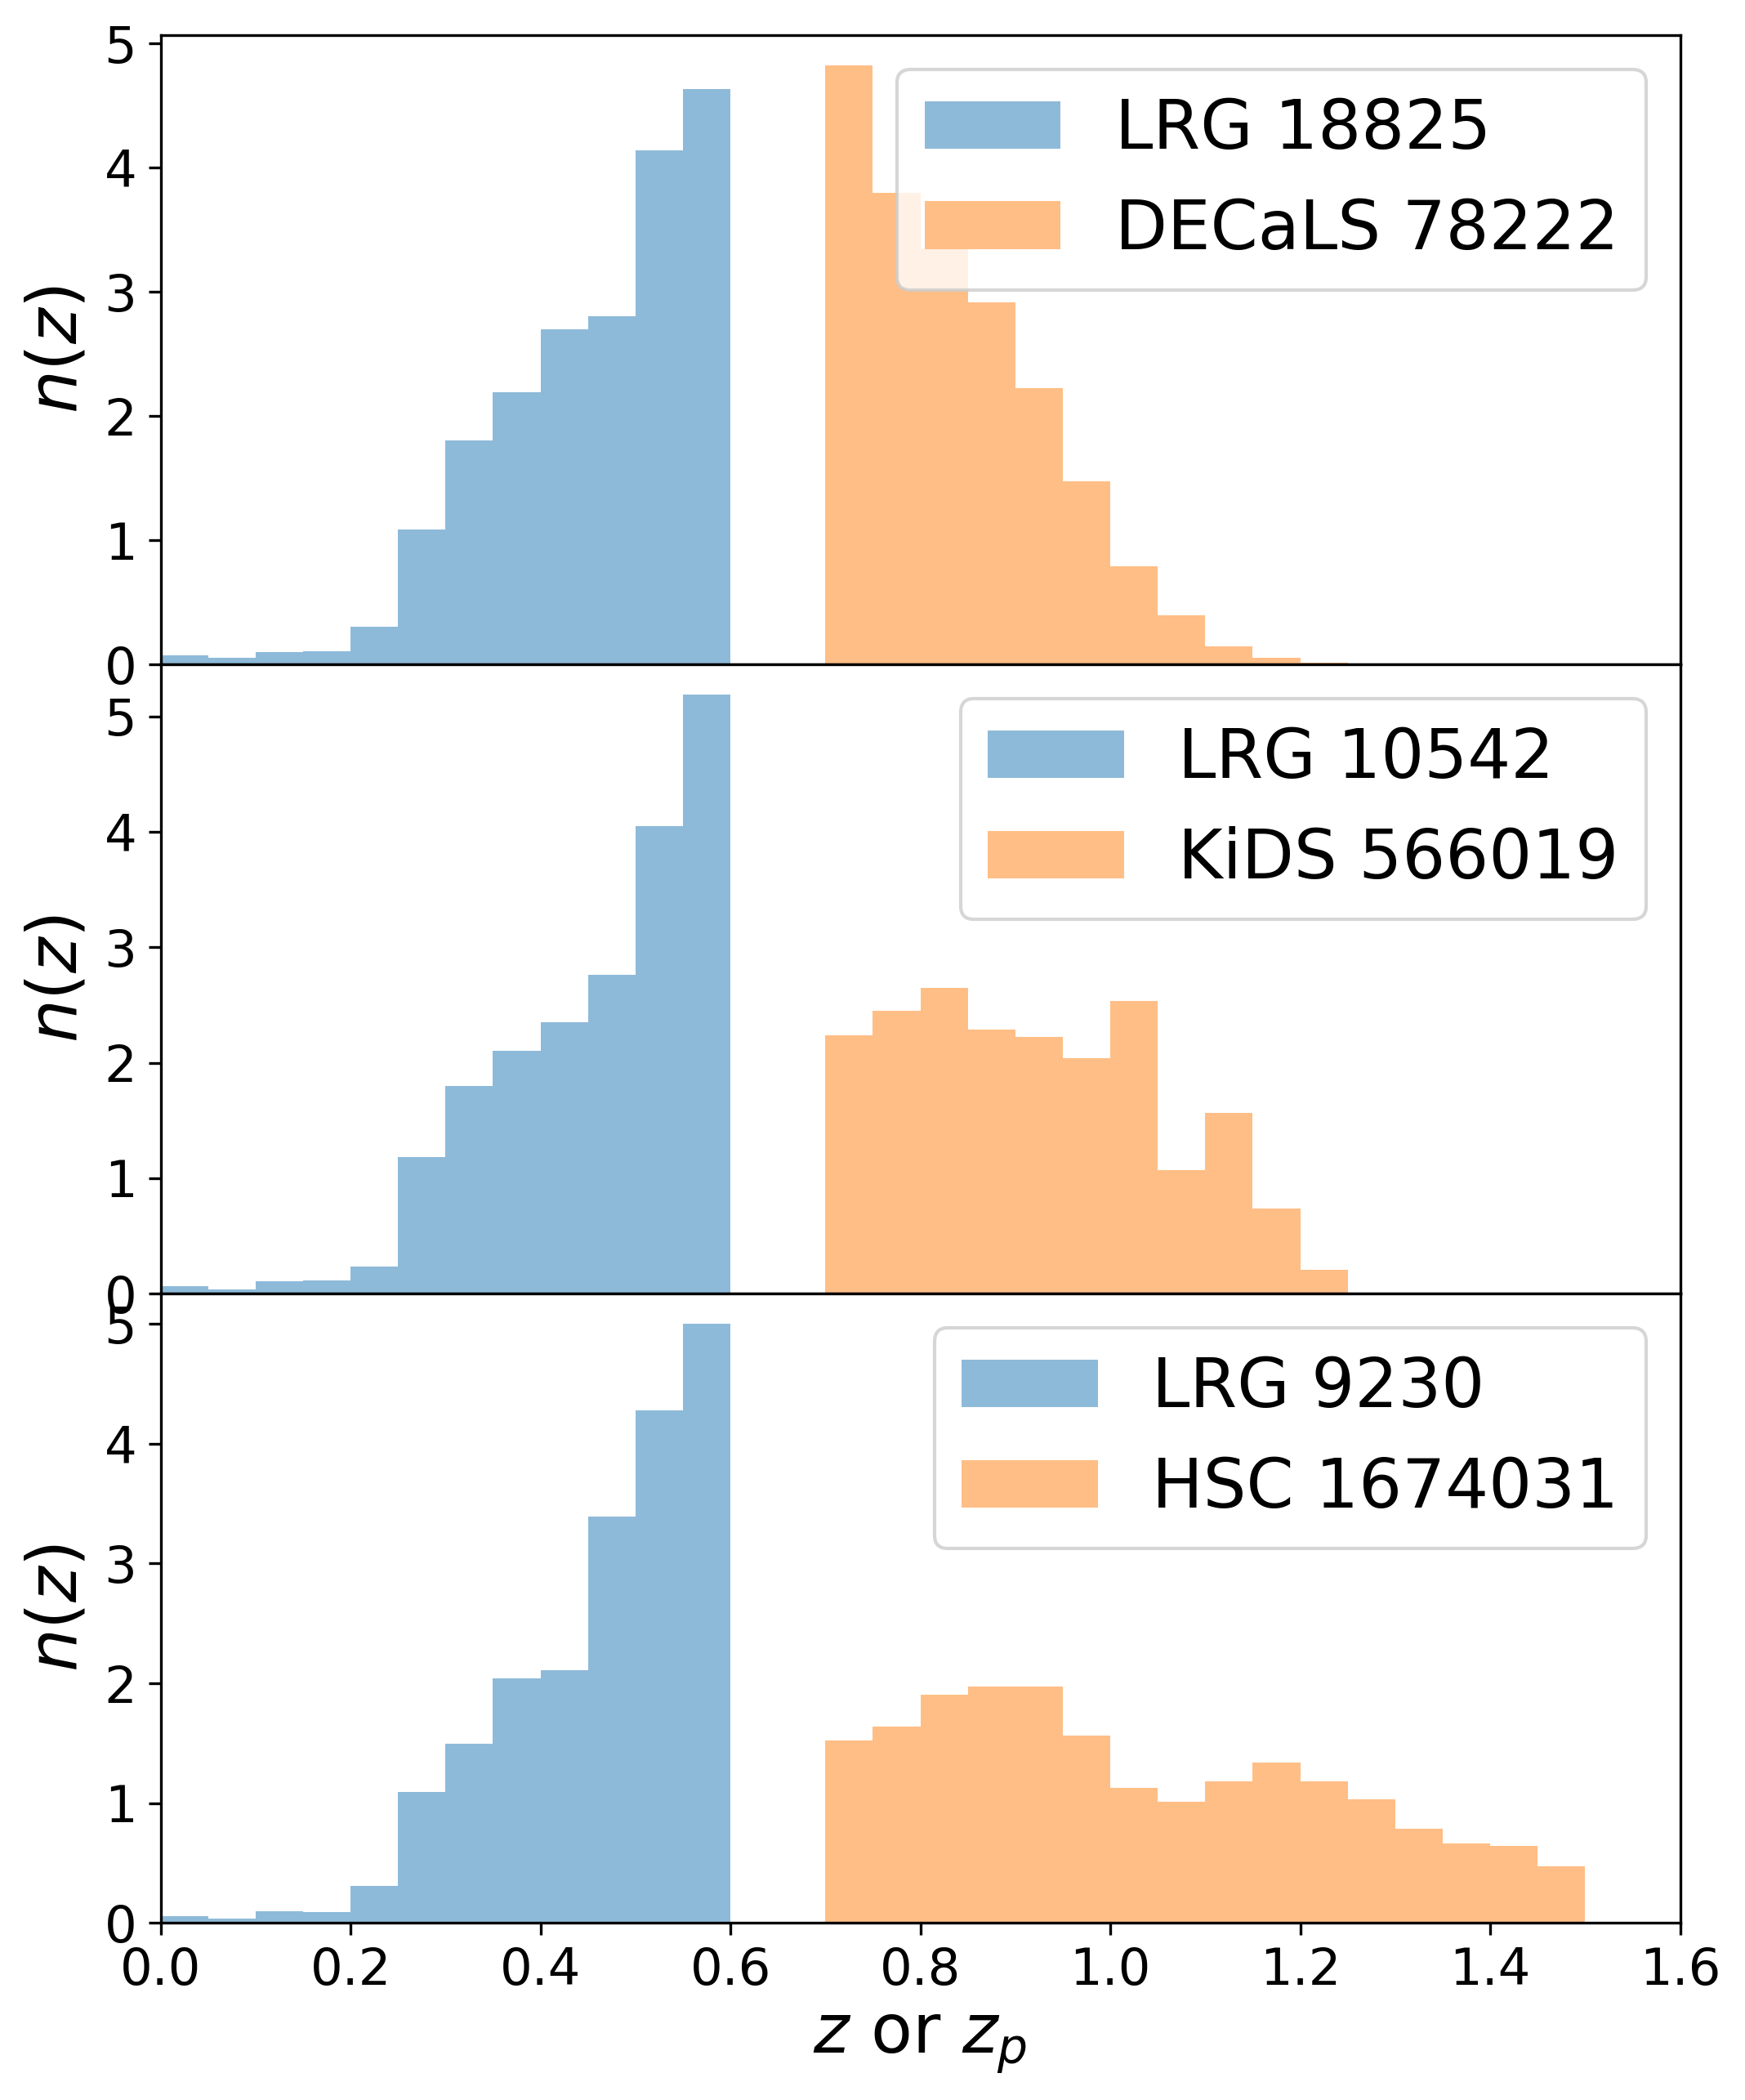
We show the redshift distribution of the DESI LRGs and the three lensing surveys in Fig. 4, requiring for the spec- LRGs and for the source galaxies. Similar to the BGS, more LRGs can be used when overlapping with DECaLS, while the available DECaLS source galaxies are less than in the other surveys. Since LRGs are generally distributed at higher than the BGS, we choose to increase the -cut of the LRGs and the -cut of the sources, resulting in reduced source galaxies compared with Fig. 1. This figure shows the DECaLS source galaxies are more reduced (from 133k to 78k) as it is shallower than the other two.
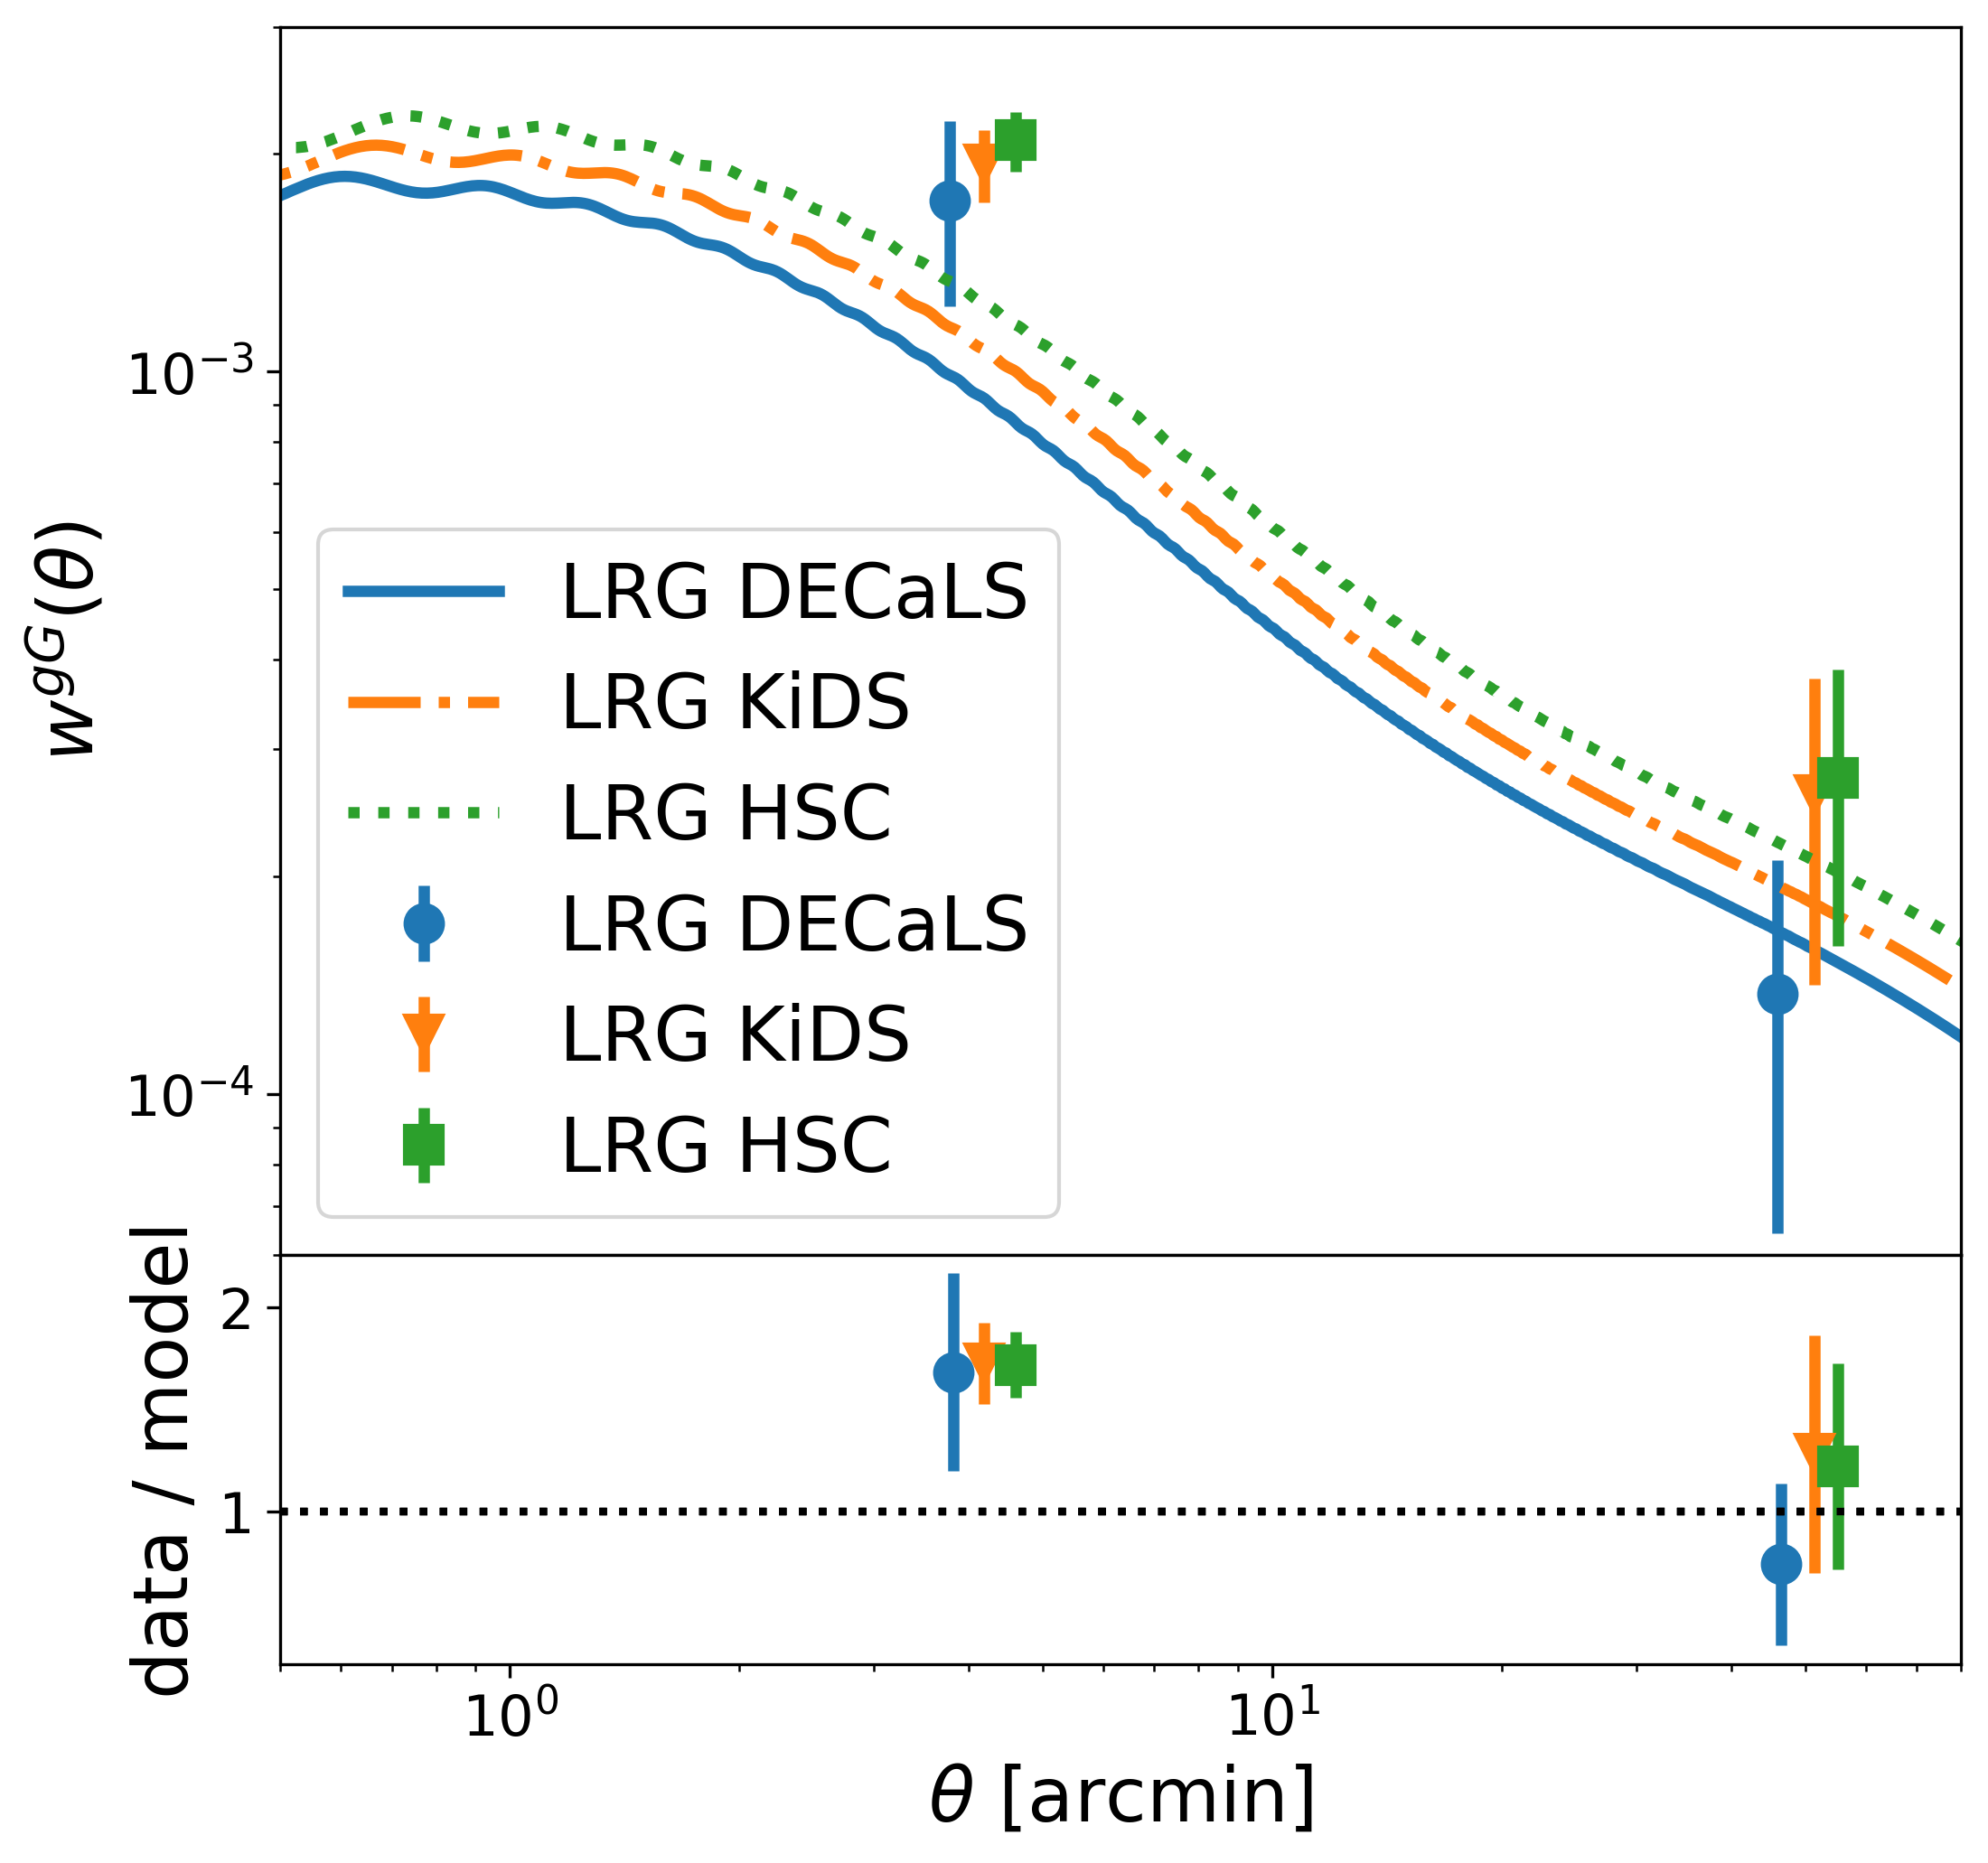
The correlation measurements for the LRGs are presented in Fig. 5. At large-scale, the DECaLS signal is weaker than KiDS and HSC, but it still offers comparable S/N. At the small-scale, the S/N is dominated by deep surveys. The small-scale measurements are significantly higher than the theoretical predictions, due to LRGs being generally more massive than BGS, with stronger non-linear galaxy bias at such separations.
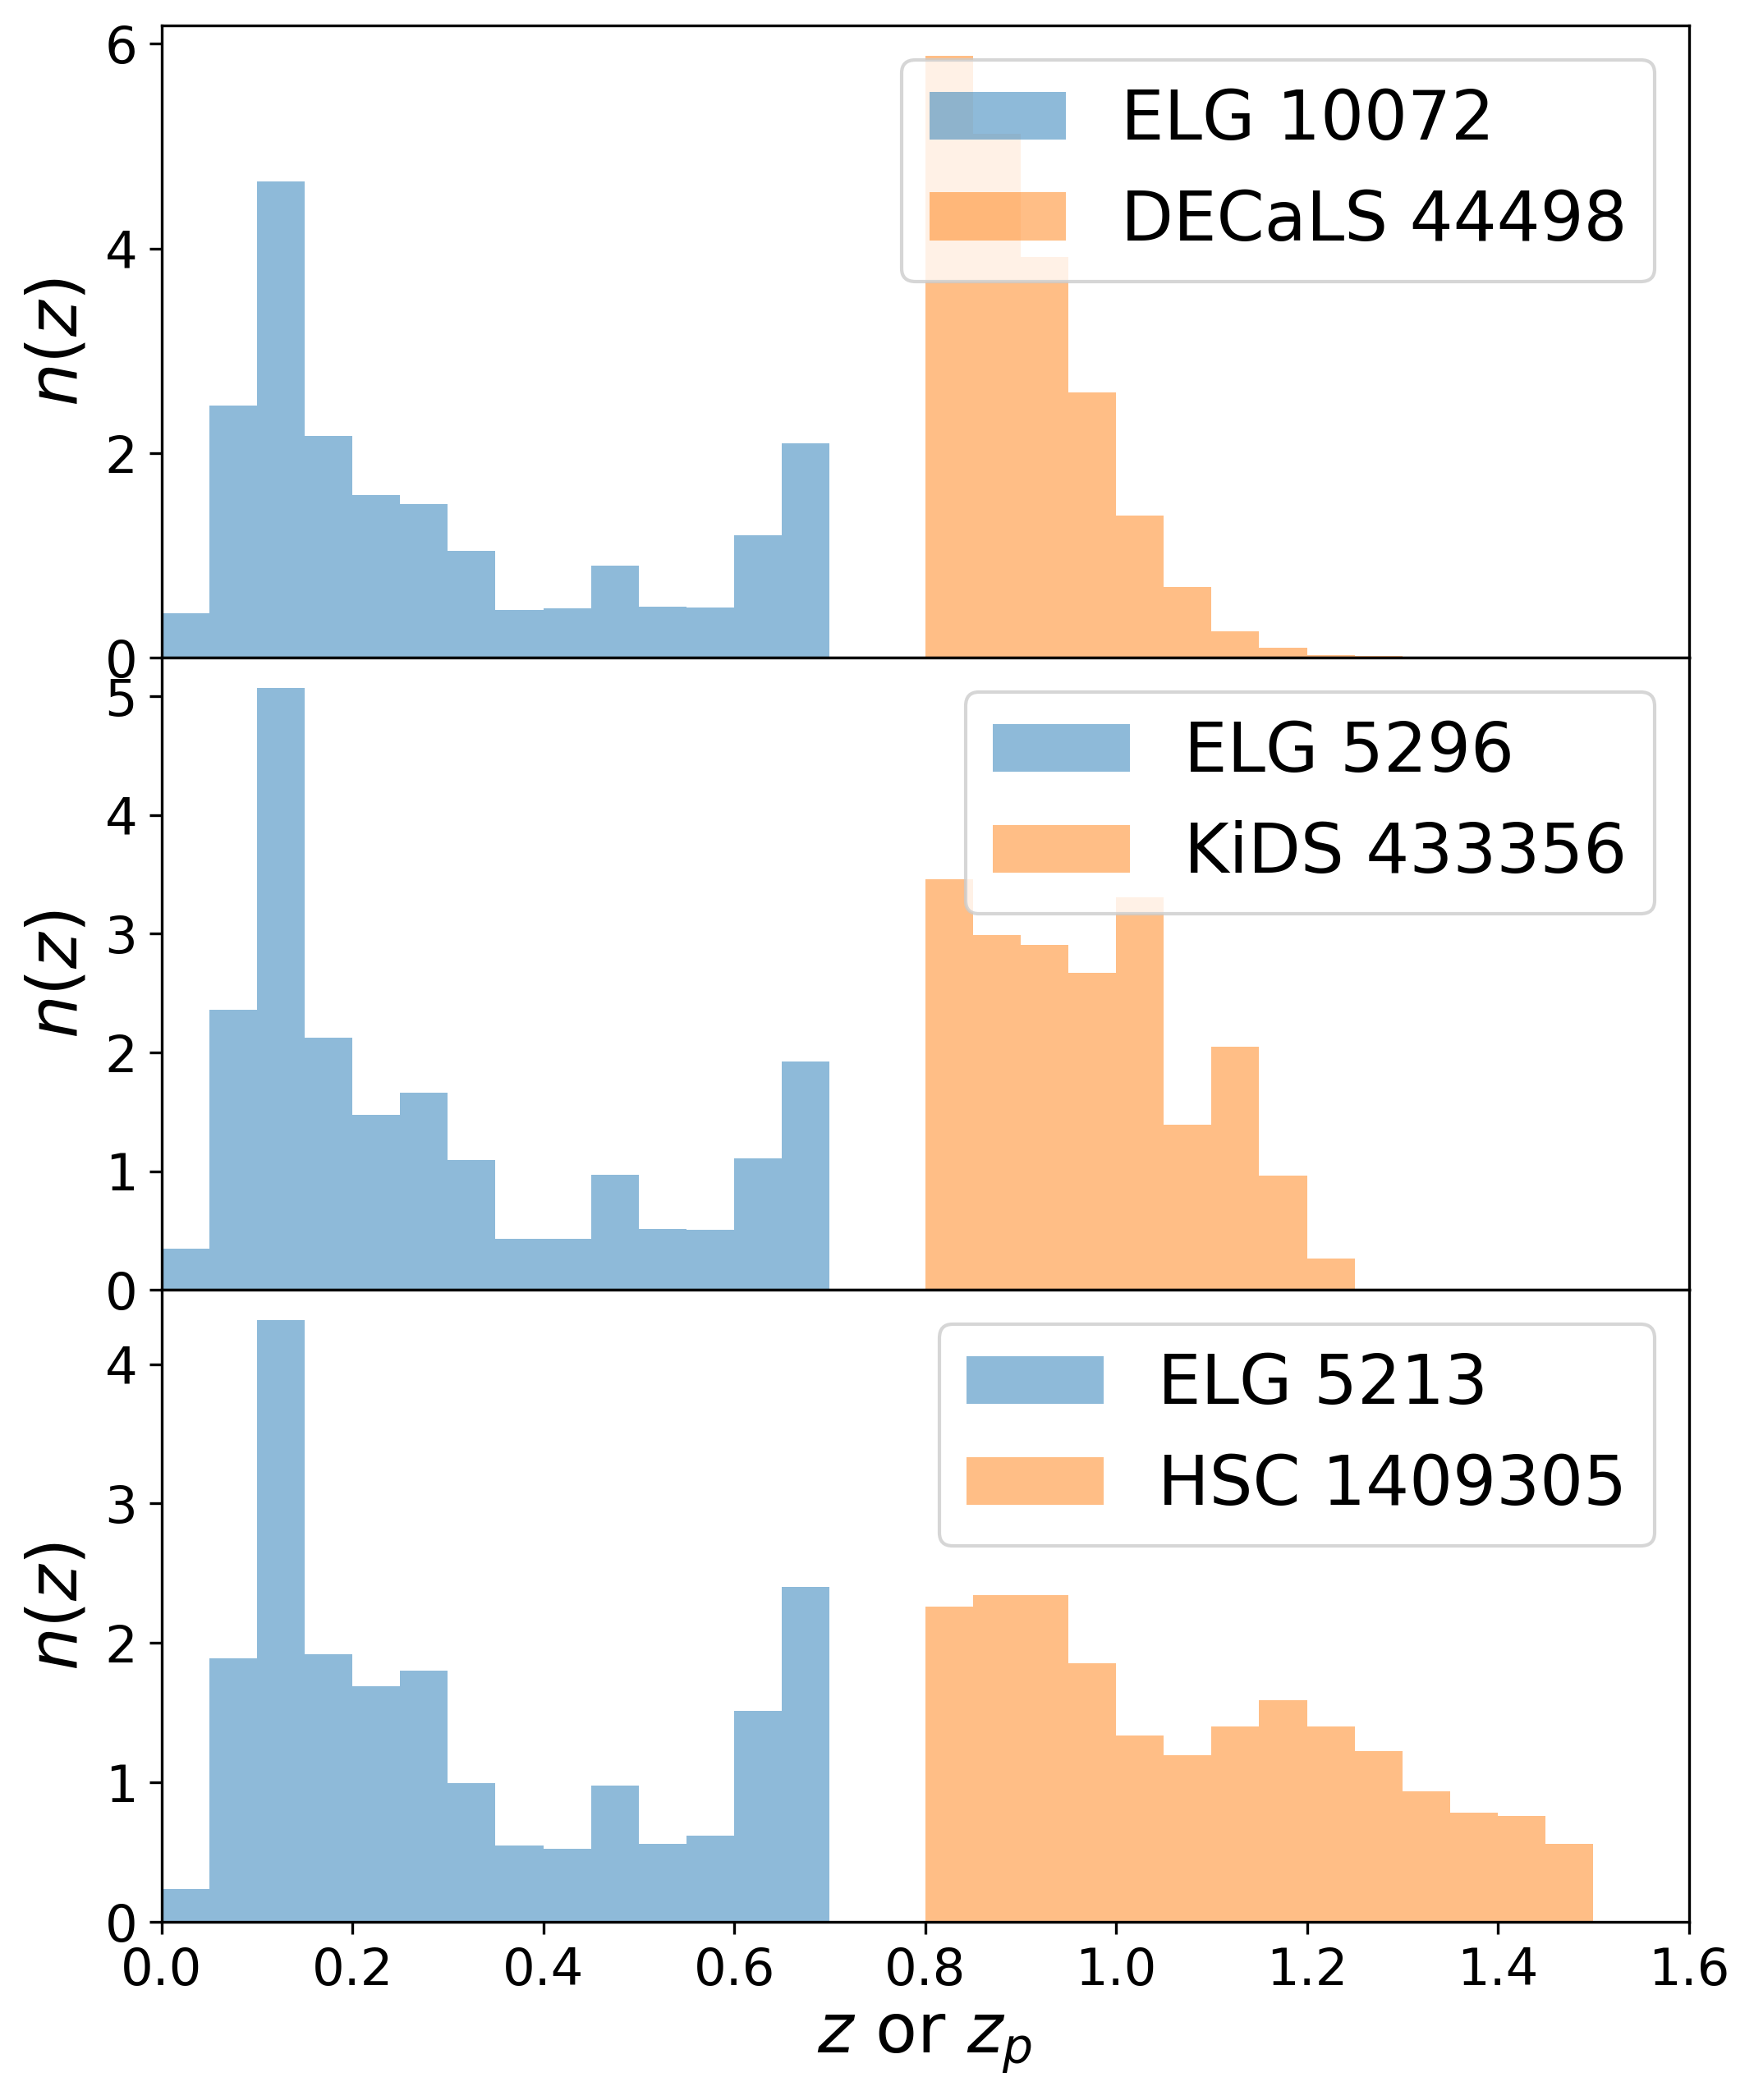
Furthermore, we study the g-g lensing measurements of the DESI ELGs. We show the redshift distribution of the DESI ELGs and the three lensing surveys in Fig. 6, requiring for the spec- ELGs and for the source galaxies. The available number of galaxies is further reduced compared to BGS and LRGs, due to DESI ELGs being mainly distributed at . And the high-z sources for DECaLS are significantly less than KiDS and HSC.
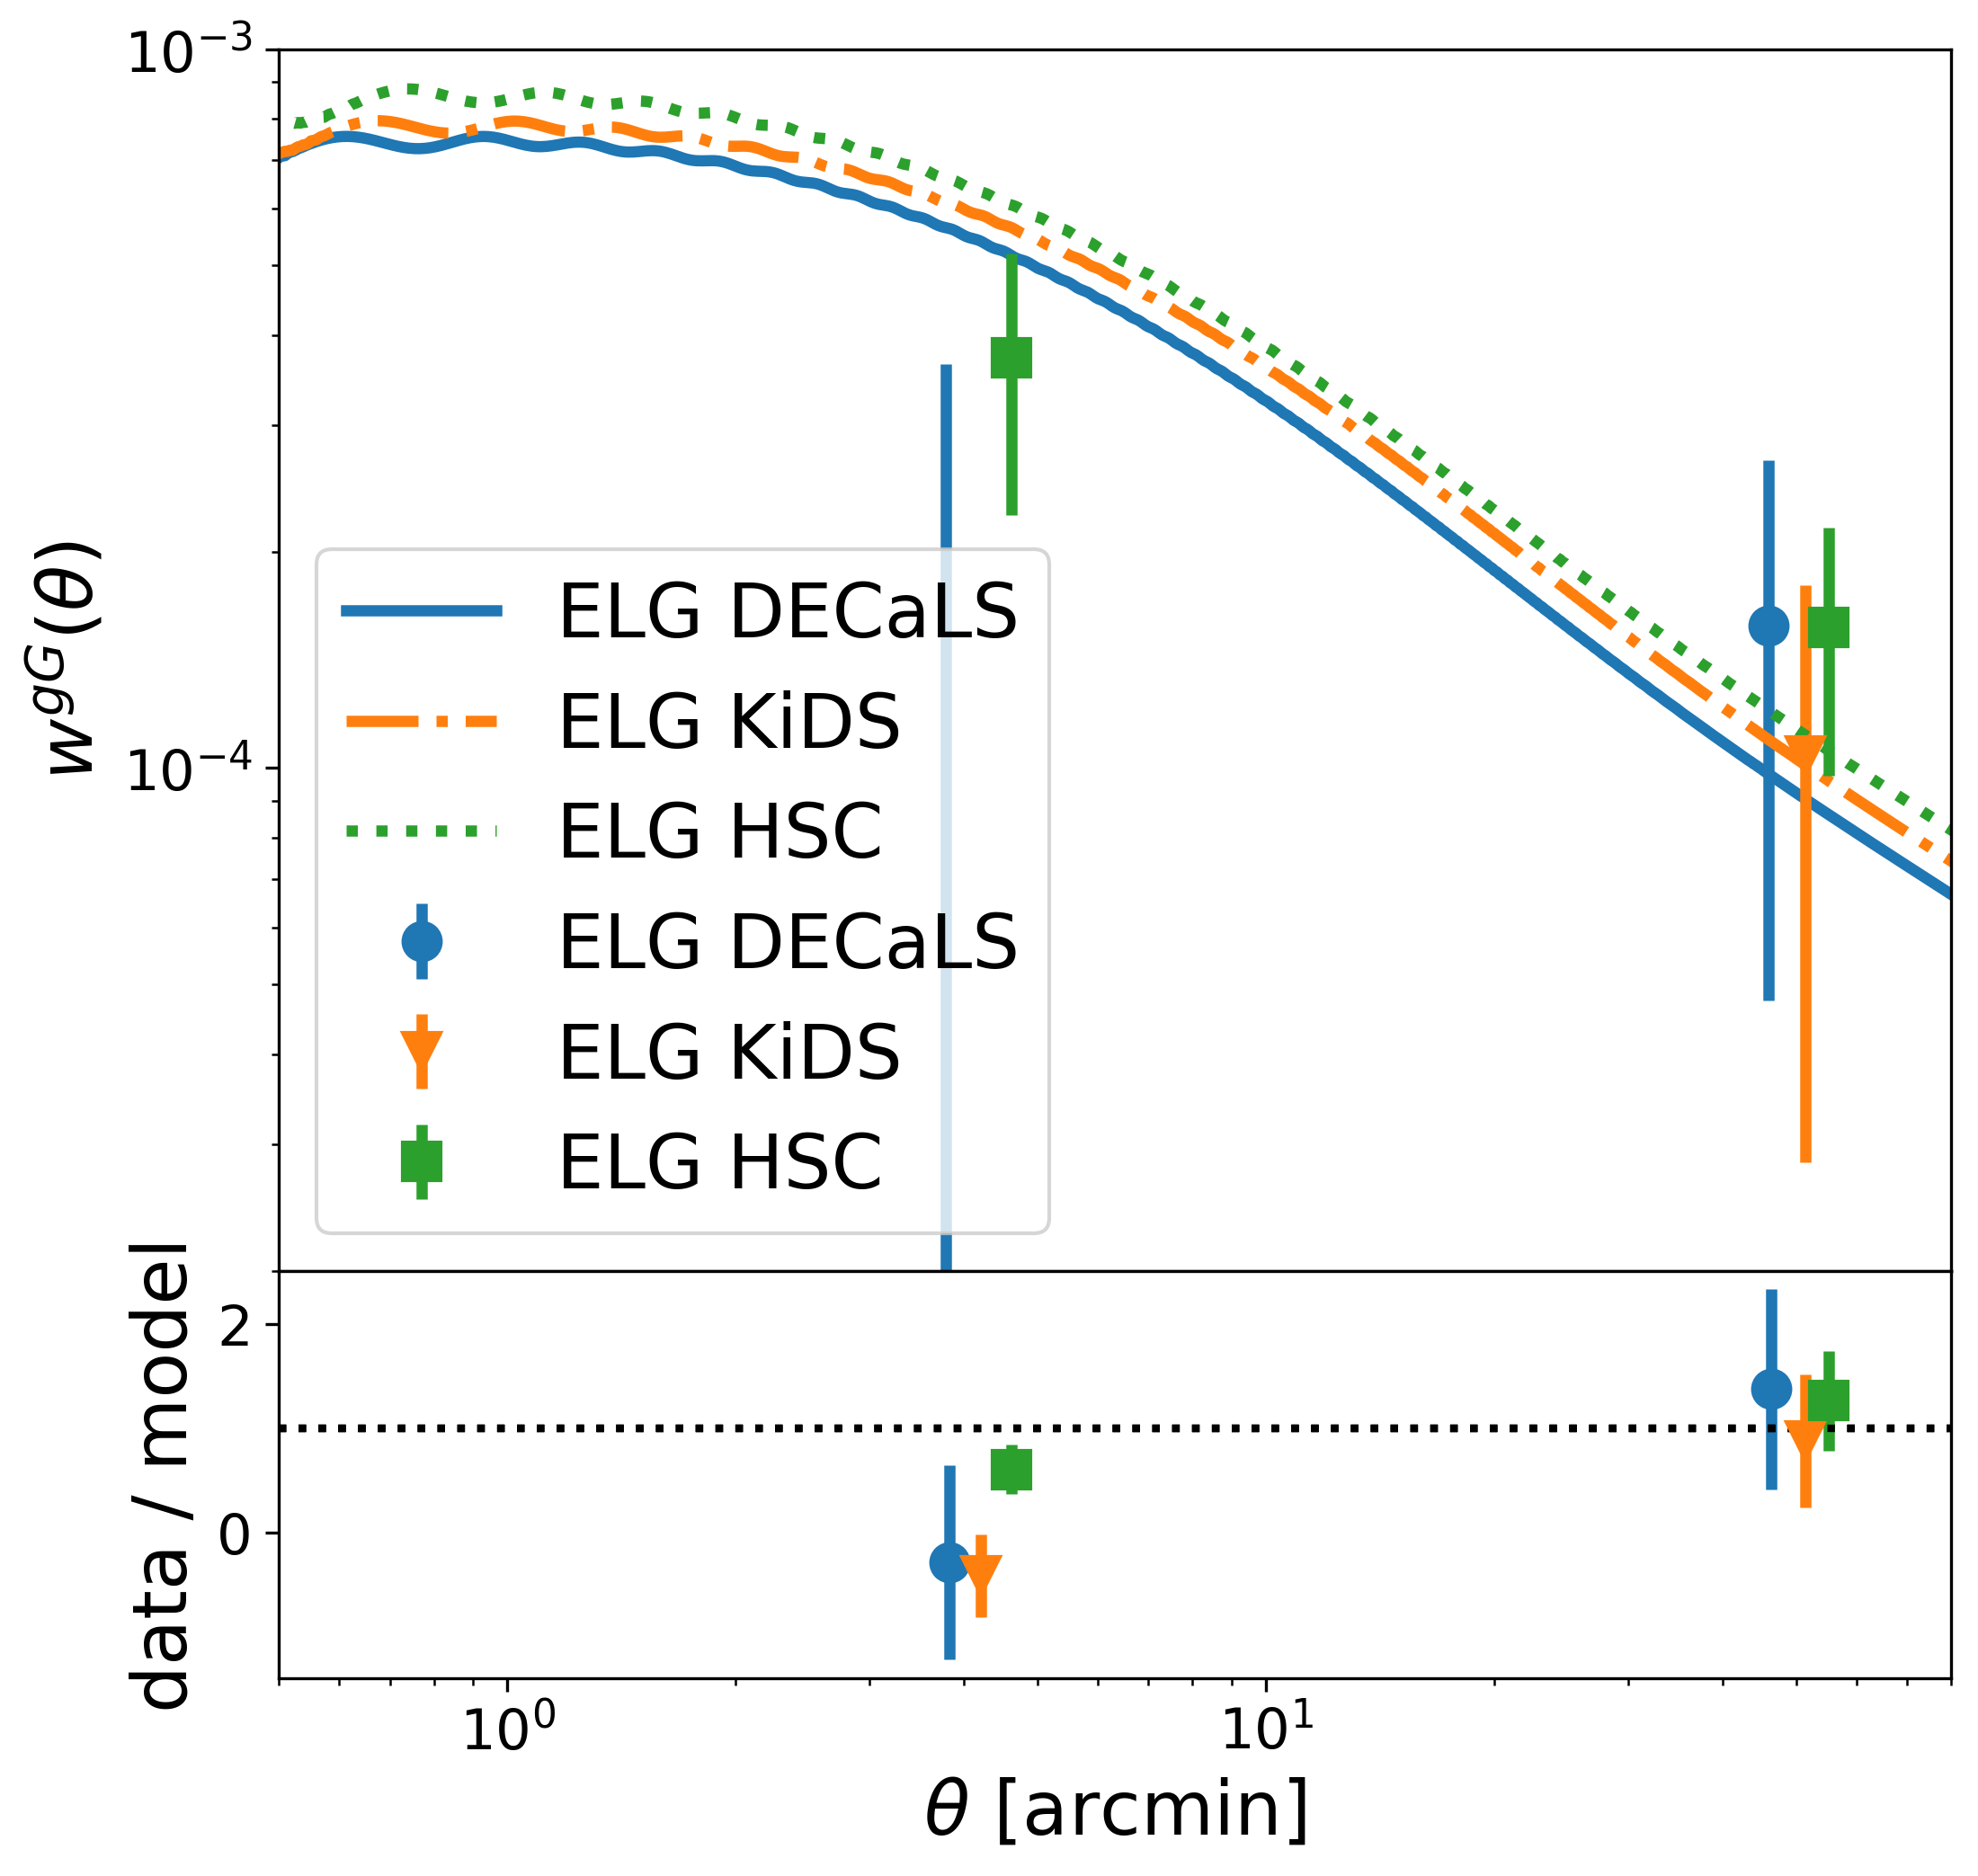
The correlation measurements of the ELGs are shown in Fig. 7. HSC appears to have the largest S/N at both large-scale and small-scale, and the S/N of DECaLS at large-scale is comparable to KiDS. All three lensing surveys have small-scale measurements lower than the theoretical predictions, suggesting the low measurement is not a systematics of DECaLS. We suspect this might be due to shape noise, sample variance, or possibly non-linear galaxy bias. As when we go from large-scale to small-scale, the non-linear halo bias for less massive halos (for example the host halos for ELGs, see Fig. 7) tends to drop compared with its linear bias, while the non-linear halo bias tends to increase for the more massive halos (for example the host halos for the LRGs, see Fig. 5) according to Fig. 1 of Fong & Han (2021). The satellite galaxy fraction in the ELGs could also lead to a low amplitude at small-scale (Niemiec et al., 2017; Favole et al., 2016; Gao et al., 2022). These will require a higher S/N to test in the future. In this work, we only focus on large-scale ELGs measurement.
| survey | SV3 overlap | SV3 S/N [small-scale, large-scale] | full overlap | ideal forecast S/N [small-scale, large-scale] | forecast potential bias S/N | |||||
|---|---|---|---|---|---|---|---|---|---|---|
| [deg2] | BGS | LRG | ELG | [deg2] | BGS | LRG | ELG | statistical | systematical | |
| DECaLS | 106 | [9.1, 5.8] | [3.5, 1.9] | [-0.3, 1.4] | [83.8, 53.4] | [32.2, 17.5] | [N/A, 12.9] | |||
| KiDS | 55 | [10.2, 3.9] | [8.7, 2.2] | [-1.1, 1.4] | 456 (DR4) | [29.3, 11.2] | [25.1, 6.3] | [N/A, 4.0] | ||
| HSC | 48 | [16.1, 4.3] | [10.6, 2.4] | [2.5, 2.6] | 733 (Y3) | [62.9, 16.8] | [41.4, 9.4] | [9.8, 10.2] | ||
4.2 Forecasts and Systematics
We summarize our findings for the g-g lensing measurements from BGS (Fig. 2), LRGs (Fig. 5), and ELGs (Fig. 7) in Table 1. We see that DECaLS has its unique advantage in extracting cosmological information at large-scale and at lower redshift (when correlating with the DESI BGS). Neglecting systematic errors for the moment, which will be dominant in practice, we give the forecast of the S/N with the complete DESI survey by re-scaling the covariance according to the overlapped area. This re-scaling assumes the covariance of the g-g lensing signal is dominated by the Gaussian covariance. Since we are extrapolating from small regions with significant boundary effects in our large-scale bin, this is only an approximation. We theoretically test the different components of the covariance in Appendix A for your interest. The large-scale information of future DECaLSBGS can reach , which is stronger than most of the current g-g lensing data, and will be very promising in studying the current tension (Hildebrandt et al., 2017; Hamana et al., 2020; Hikage et al., 2019; Asgari et al., 2021; Heymans et al., 2021; DES Collaboration et al., 2021; Secco et al., 2022; Amon et al., 2021; Planck Collaboration et al., 2020). The contribution from LRGs and ELGs, and possibly QSOs in the future, can also offer independent cosmological information.
We note that the S/N predictions in Table 1 ignored the potential bias from systematics, such as residual shear multiplicative bias and redshift distribution . The existence of the shear multiplicative bias will change the lensing efficiency from to in Eq. (1) and (2). The bias in redshift distribution will change the redshift distribution for the source galaxies from to in Eq. (2), so that the whole redshift distribution is shifted towards higher-z direction by . For example, if we assume the residual multiplicative bias is (which is found for some DECaLS galaxy sub-samples as in Phriksee et al. (2020); Yao et al. (2020)), and enlarge the covariance to account for this potential bias, then the S/N of DECaLSBGS at large-scale will be reduced from to . This is a huge loss of cosmological information, although is still comparable to the of KiDS-DR4 and of HSC-Y3. Therefore, we emphasize the importance of calibrating DECaLS data in a more precise way in the future for reliable cosmological measurements. We note the current measurements with DESI 1% survey have S/N, therefore the impacts from such biases are still within the error budget. The assumed systematics can enlarge the large(small)-scale uncertainties from to .
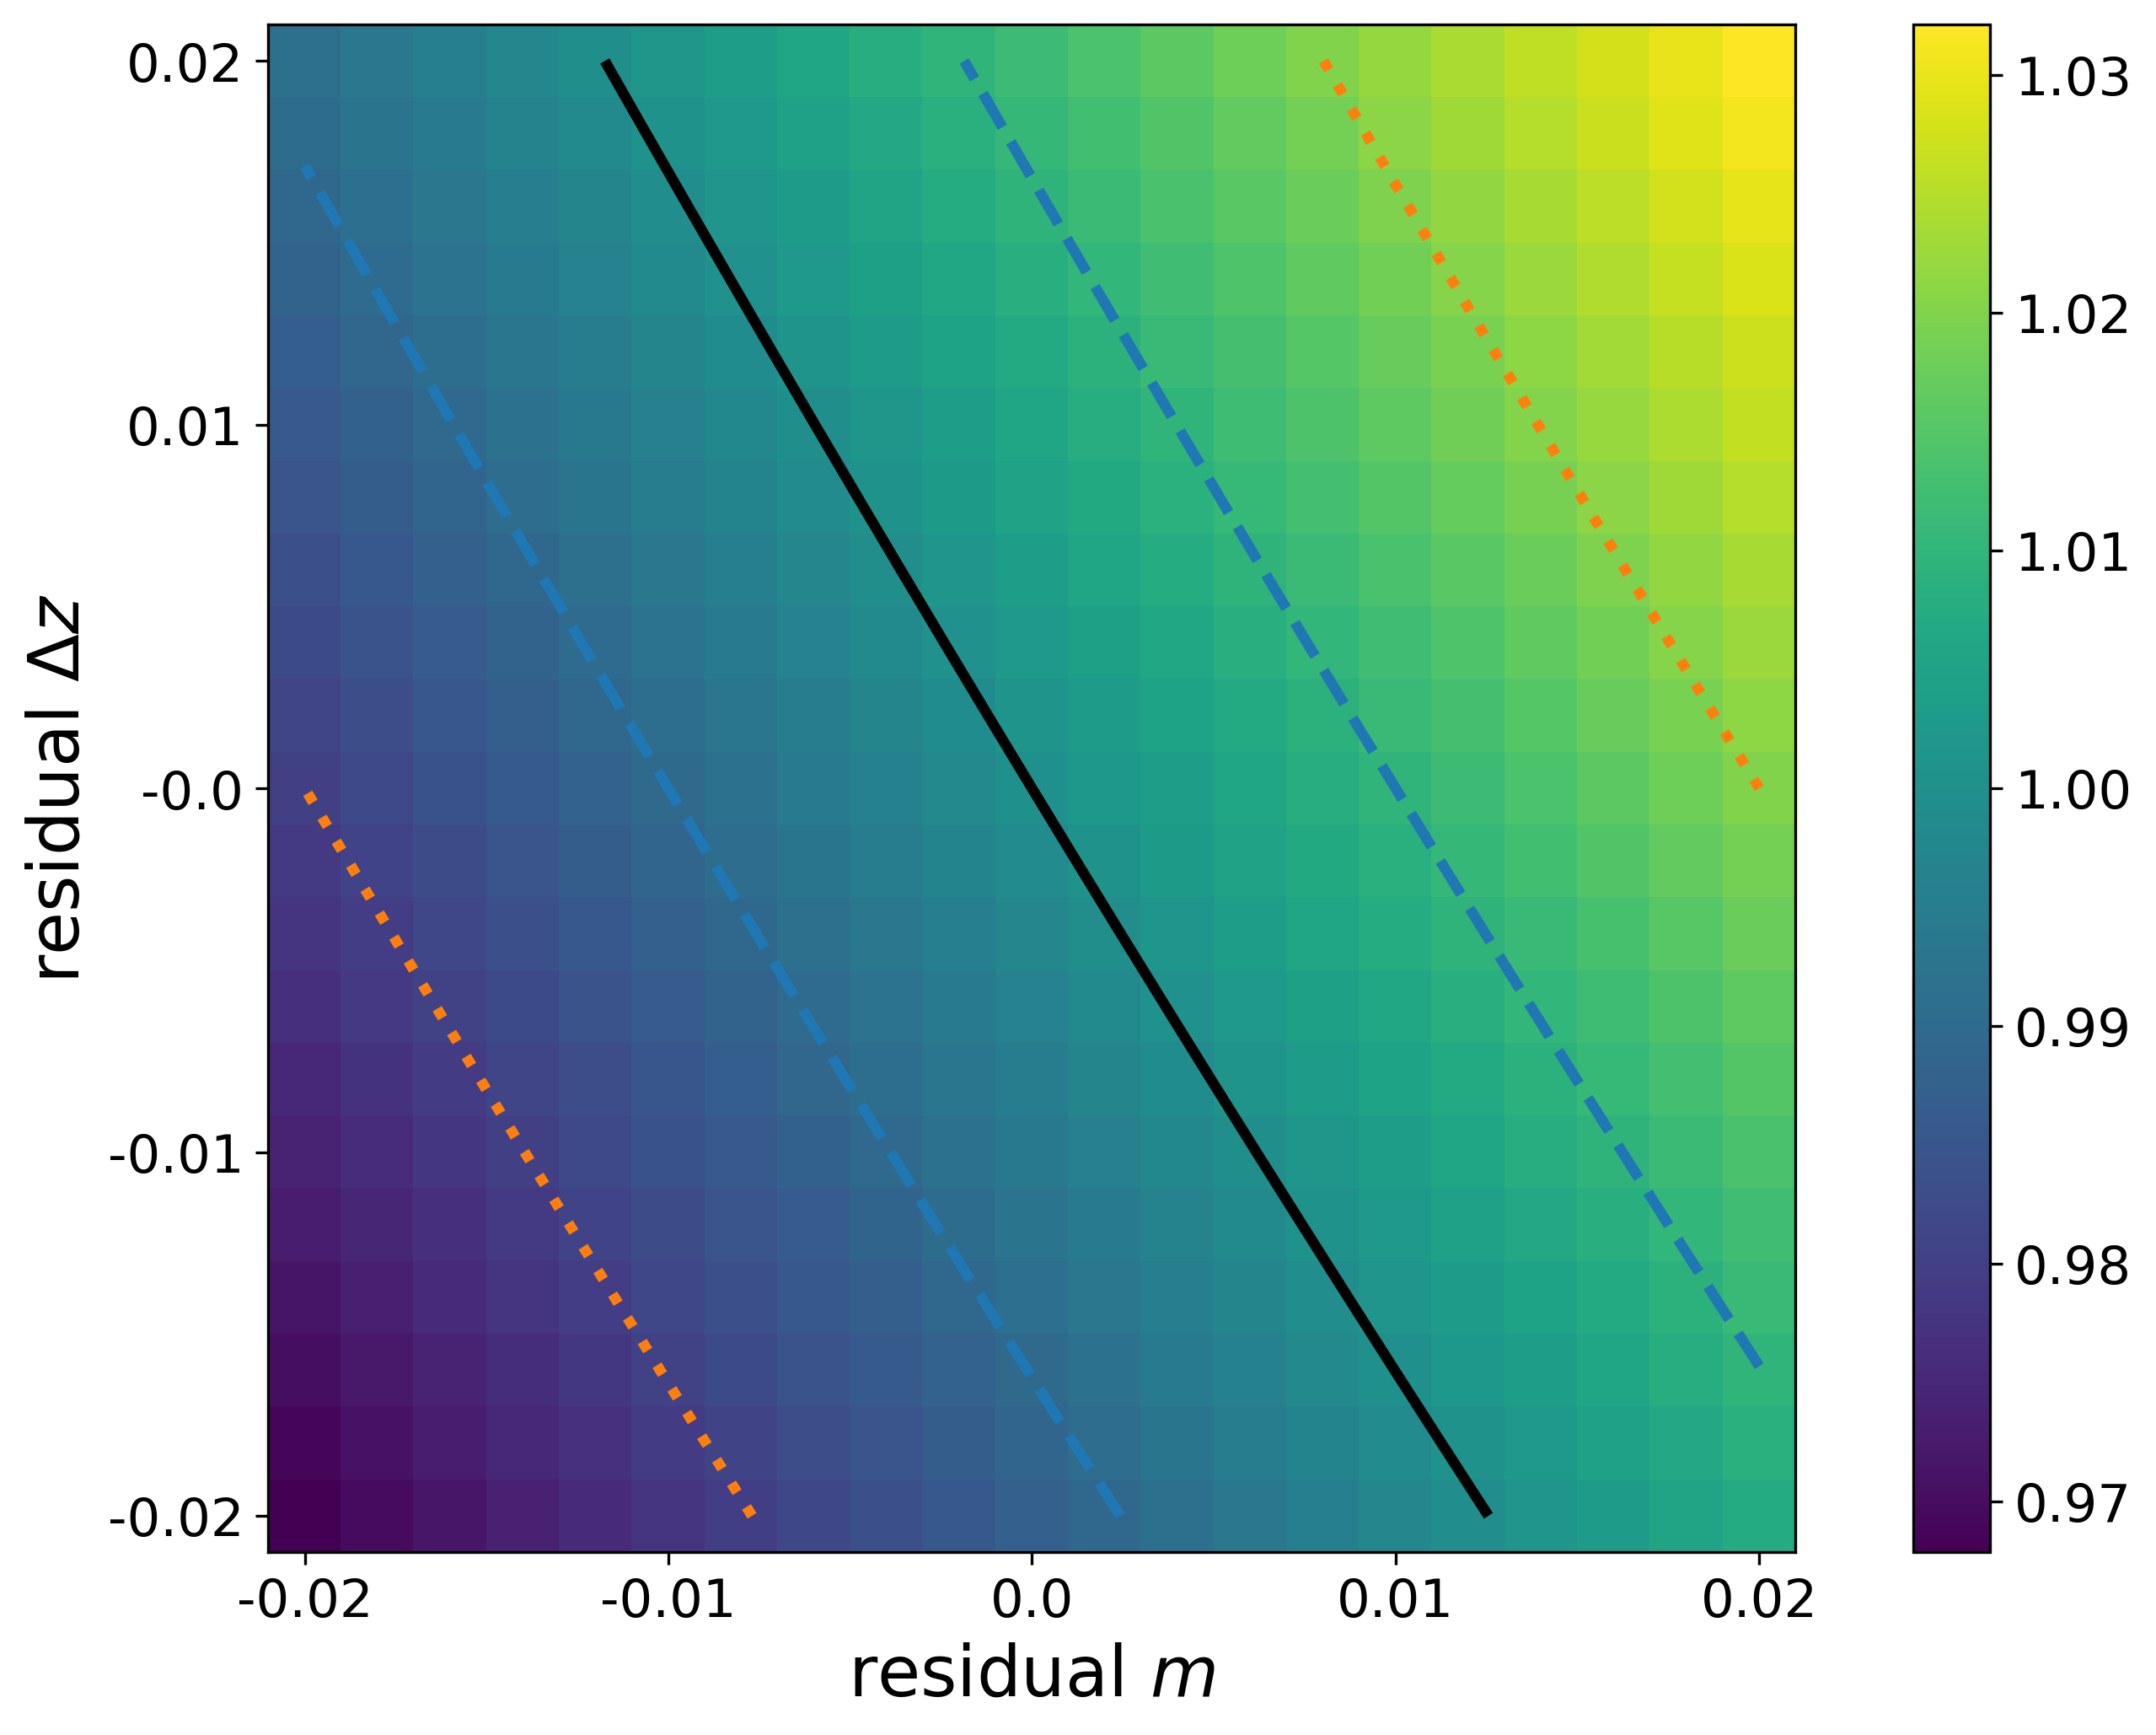
We further estimate the requirements on the DECaLS calibrations for precision cosmology. We evaluate the fractional bias in the measured correlation function , considering some residual multiplicative bias and redshift bias , and present the results in Fig. 8. To safely use the data from the large-scale of DECaLSBGS, the residual multiplicative bias alone need to be controlled within , and the mean of the redshift distribution of the source galaxies need to be controlled within on its own. The net bias considering both and should be controlled in between the orange dotted curves in Fig. 8. To safely use the cosmological information in both the large-scale and the small-scale, with overall S/N, we require the calibrations to have and individually, while the net bias considering both and should be controlled in between the blue dashed curves in Fig. 8.
We note that using tomography and combining g-g lensing measurements from different density tracers (BGS, LRGs, ELGs, and possibly QSOs in the future) can bring stronger S/N, so the requirements on the calibration terms will be more strict. However, these studies will require a much larger covariance, thus more jackknife sub-regions and much larger overlapped regions, which are beyond the ability of the current data size. We leave this study to future works.
4.3 Shear-ratio

Shear-ratio is a powerful tool to probe cosmology or test systematics (Sánchez et al., 2021; Giblin et al., 2021), and it is insensitive to many small-scale physics. As shown in Table 1, DECaLSDESI, especially for the BGS and LRGs, can offer very high S/N measurements at the small-scale. We take the BGS from the DESI 1% survey as an example to study this topic.
The galaxy samples are distributed similarly to the BGSDECaLS as in Fig. 1, but in addition, the source galaxies are further split into two groups: , and . We calculated the corresponding correlations and , and their ratio with , following Eq. (4), (5) and the description in Sec. 2.2.
The shear-ratio results are shown in Fig. 9. Following the same angular binning as in Fig. 3 for the correlation calculations, we use the two small-scale angular bins with arcmin, since the three large-scale bins are expected in the direct 2-point cosmology study, as described in Sec. 4.1. The current small-scale information can constrain shear-ratio at , which is consistent with our theoretical prediction (using , Eq. (1) and (3)) between and . This small angular variation is due to the angular dependence in in Eq. (1), which is not fully canceled when taking the ratio using correlation functions. We note this weak angular dependence is small and can be easily taken into account in the theoretical predictions.
To predict the constraining power when full DESI finishes, we rescaled the covariance based on the overlapped area as in Table 1, and find the shear-ratio can be constrained at with the small-scale information, which is not used in getting the constraint. Considering full information for the shear-ratio study, we can obtain . These statistical errors are comparable with the shear-ratio studies in (Sánchez et al., 2021) with DES-Y3 data, showing a promising future in using shear-ratio to improve cosmological constraint and/or to further constrain the systematics (Giblin et al., 2021).
4.4 Cosmic magnification
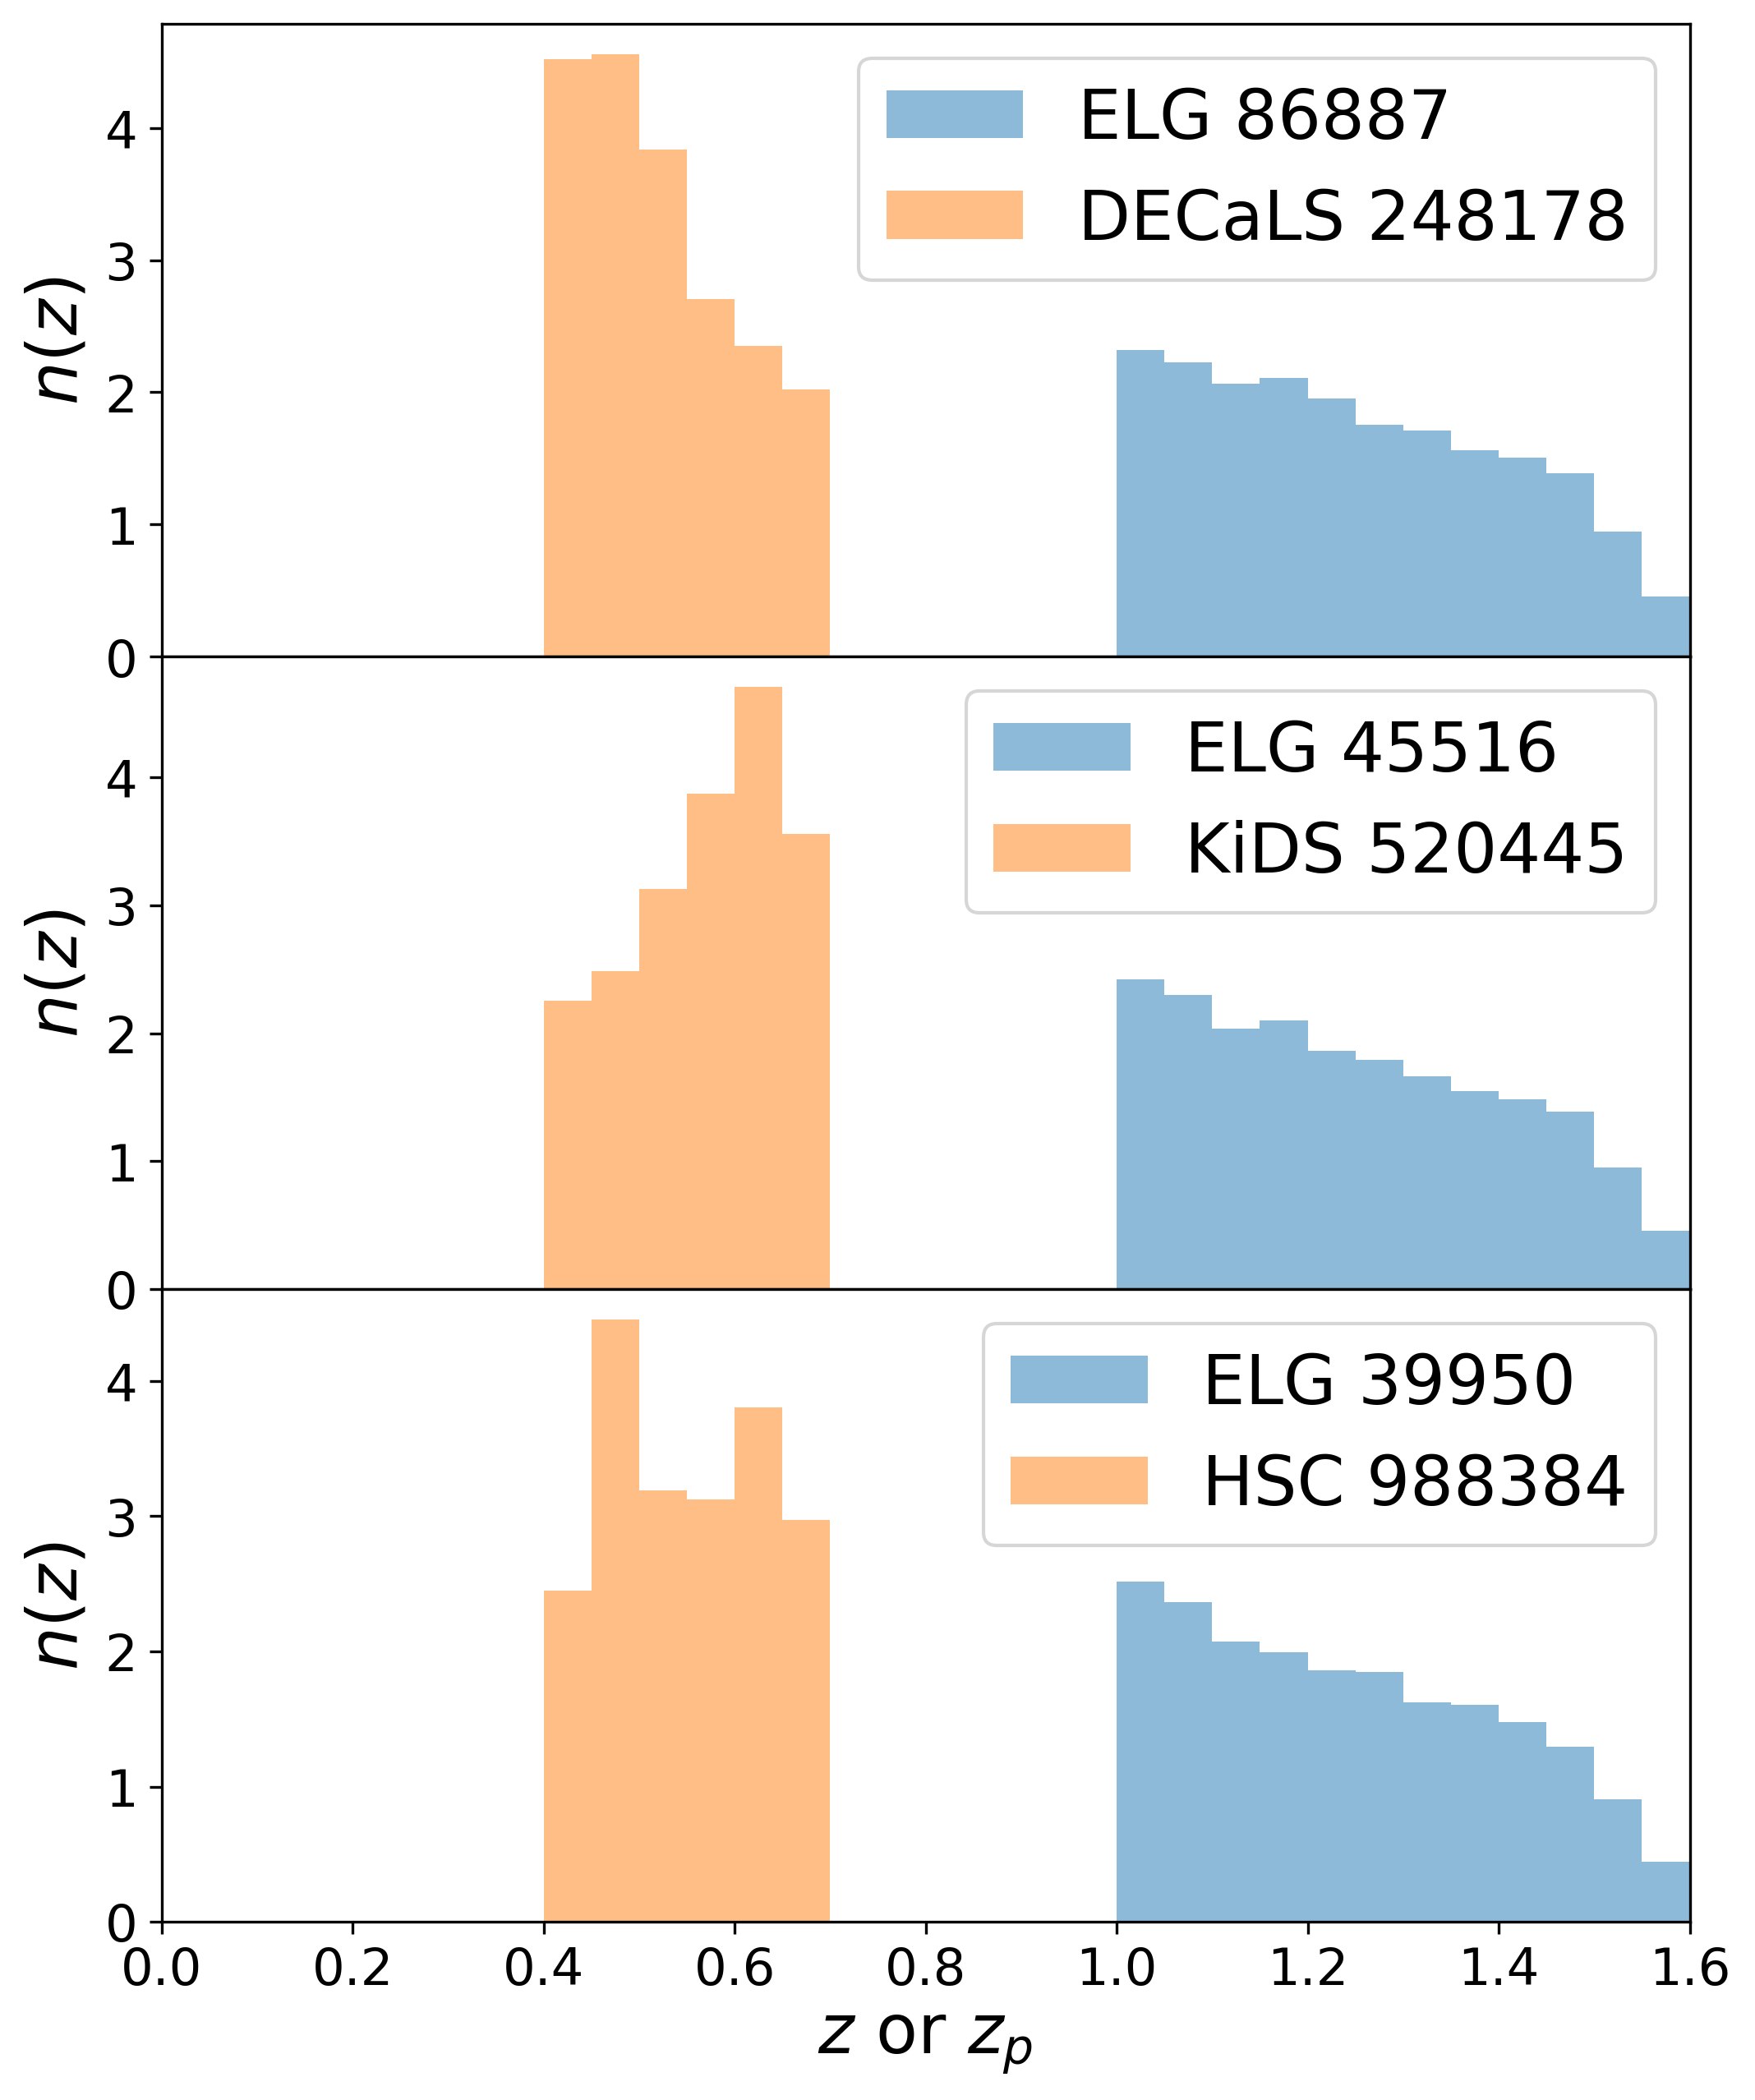
We discussed that the ELGDECaLS results have low S/N in Fig. 6, 7 and Table 1, as the ELGs are mainly distributed at large-, while the advantage of DECaLS is at low-. On the other hand, this opens a window to the study of cosmic magnification by putting the ELGs at high-z and using shear from low-z DECaLS galaxies. We follow the methodology in Liu et al. (2021) and use galaxy samples distributed as in Fig. 10. The DECaLS galaxies are located at a much lower photo- compared with the ELGs, as in the targeted shear-magnification correlation, the shear-density correlation exists as a source of systematics when even a small fraction of shear galaxies appear at higher- than the ELGs.
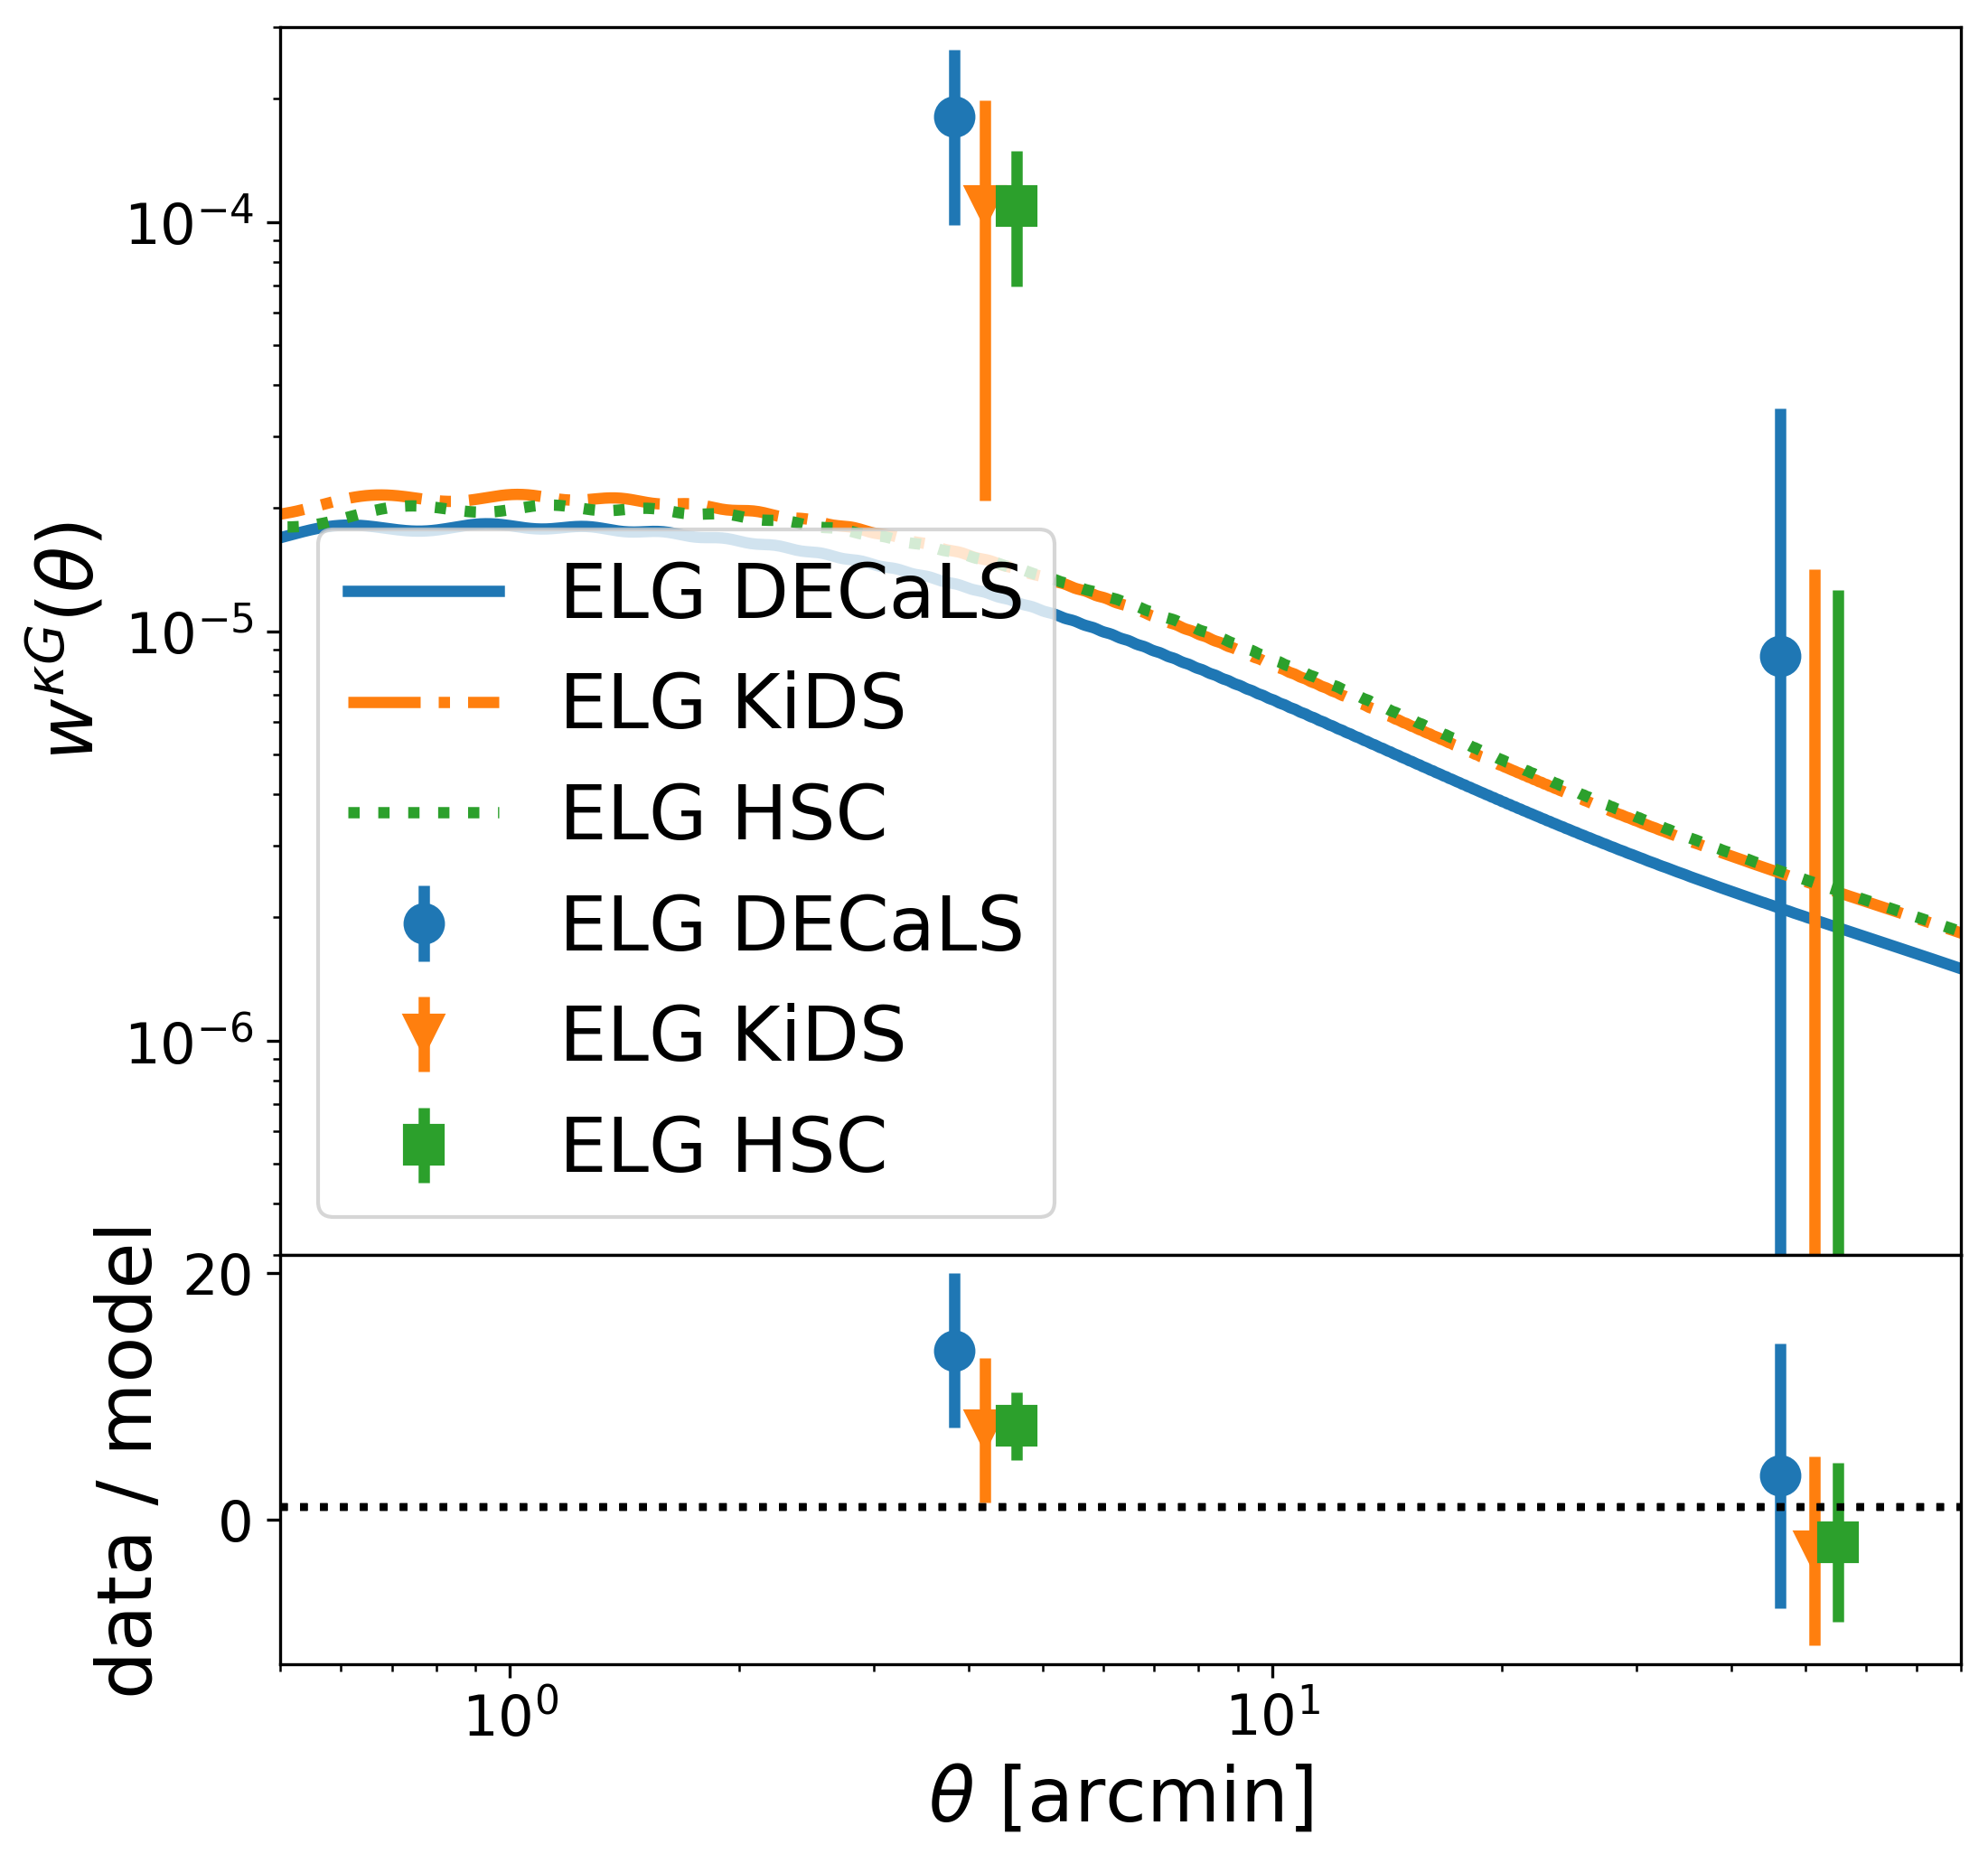
The measurements are shown in Fig. 11. We find positive signals at the small-scale, and null detections at the large-scale, for all DECaLS, KiDS, and HSC. We tested the 45-deg rotation of the shear, resulting in consistency with 0 on all scales for all the source samples. Considering the similar calculation with eBOSS ELGs 333https://www.sdss.org/surveys/eboss/ and DECaLS sources as a reference, we found the measurements are consistent with 0 on all scales, see Appendix B for details. In the measurements of Fig. 11, the null detections at the large-scale could be due to cosmic variance or some negative systematics such as intrinsic alignment. The positive measurements at the small-scale could be due to the targeted magnification signals, the cosmic variance, or photo- errors. We note to separate these different signals, either a stronger signal with clear angular dependencies or additional observables are needed to break the degeneracy.
As a further step, we present an effective amplitude fitting of for the magnification signals, following Eq. (7), in Table 2. We find measurement for KiDS and measurement for DECaLS and HSC. Considering the ELG samples are quite similar as shown in Fig. 10, and the three best-fit -amplitudes are consistent, we evaluated the combined best-fit, achieving significance. The covariance between different surveys is ignored for the combined estimation, as shot noise is more dominant in this case than the cosmic variance. Additionally, we find that by including shear galaxies from , the significance of magnification detection drops, due to the low-z data having much weaker lensing efficiency as in Eq. (2), and is mainly contributing noise.
The fitting goodness of the reduced- (defined by the between the best-fit and the data, divided by the degree of freedom) is generally close to for each case. This shows no significant deviation between the model and the data. The detected positive signal can be either due to the cosmic magnification, or very similar stochastic photo-z outliers between the three lensing surveys. As DECaLS, KiDS and HSC have totally different photometric bands, photo-z algorithms, and training samples, we think the detected signals are less likely due to the similar photo-z outliers, and more likely to be the cosmic magnification signal. Therefore, by assuming the combined best-fit of as the true value and rescaling the covariance similar to Table 1, we expect detection for DECaLS DR9, which is very promising for a stage III lensing survey. By then, with a better understanding of the systematics such as IA and photo- outlier, these cross-correlations can bring very promising constraining power in studying cosmic magnification. We can choose to: (1) cut a complete and flux-limited sample and compare it with the flux function; (2) try to use the given DESI completeness and flux function to find a relation of rather than ; (3) compare with realistic mocks to infer ; (4) add an artificial lensing signal to real data and infer as a response , similar to MetaCalibration (Sheldon & Huff, 2017; Huff & Mandelbaum, 2017).
| Case | S/N | ||
|---|---|---|---|
| DECaLS | 0.6/1 | ||
| KiDS | 1.3/1 | ||
| HSC | 1.1/1 | ||
| all | 3.9/5 | ||
| all | 12.5/11 |
5 Conclusions
In this work, we study the cross-correlations between DESI 1% survey galaxies and shear measured from DECaLS, one of the imaging surveys for DESI target selection. For the 1% DESI data, DECaLS can have comparable performances compared with the main stage-III lensing surveys KiDS and HSC. More specifically, we measure the cross-correlations of DESI BGS/LRGs/ELGs different shear catalog, shown in Fig. 2, 5 and 7. We forecast the level of significance with full DESI data in Table 1. Assuming systematic errors can be cleaned with high precision in the future, we find the large-scale S/N could reach for DECaLSBGS, for DECaLSLRG, and for DECaLSELG, which are very promising before the stage IV surveys come out.
We point out that the main difficulty in obtaining DECaLS cosmology is the calibrations for the systematics. In order to safely use the large-scale information of BGSDECaLS, we need to achieve the minimum requirements on: (1) the multiplicative bias of and (2) the mean of redshift distribution . To safely use the full-scale data, we required and for future calibrations. The requirement could be even higher when combining different observables, but it will require a larger footprint than the 1% survey for the study. These requirements are essential guides for future calibrations and studies on cosmology.
To fully use the advantage of DECaLS, we further explored two promising observables, the shear-ratio, and the cosmic magnification. We show the current 1% BGS data can constrain shear-ratio with , while the full DESI BGS can give using only the small-scale information, as shown in Fig. 9. Furthermore, weak detections of potential cosmic magnification are shown in Fig. 11 and Table 2. We discussed how the possible systematics can affect this signal in Sec. 4.4. We also expect DECaLS to have a strong contribution ( detection) to future magnification studies, if the observed signals in this work are not due to fluctuations.
To summarize, DECaLS lensing is a very promising tool that can enrich the cosmological output of DESI. It will bring new cosmological information with its huge footprint. It has great advantages in the large-scale and the low- information, after carefully addressing the systematics. It will offer strong S/N for shear-ratio study, and good potential in measuring cosmic magnification. Careful calibrations of the shear and redshift distribution can result in very promising outcomes.
Acknowledgements
We thank Xiangkun Liu, Weiwei Xu, and Jun Zhang for their helpful discussions. We thank Chris Blake, Daniel Gruen, and Benjamin Joachimi for their contribution during the DESI collaboration-wide review.
HYS acknowledges the support from NSFC of China under grant 11973070, the Shanghai Committee of Science and Technology grant No.19ZR1466600 and Key Research Program of Frontier Sciences, CAS, Grant No. ZDBS-LY-7013. PZ acknowledges the support of NSFC No. 11621303, the National Key R&D Program of China 2020YFC22016. JY acknowledges the support from NSFC Grant No.12203084, the China Postdoctoral Science Foundation Grant No. 2021T140451, and the Shanghai Post-doctoral Excellence Program Grant No. 2021419. We acknowledge the support from the science research grants from the China Manned Space Project with NO. CMS-CSST-2021-A01, CMS-CSST-2021-A02 and NO. CMS-CSST-2021-B01.
We acknowledge the usage of the following packages pyccl444https://github.com/LSSTDESC/CCL, (Chisari et al., 2019), treecorr555https://github.com/rmjarvis/TreeCorr, (Jarvis et al., 2004), healpy666https://github.com/healpy/healpy, (Górski et al., 2005; Zonca et al., 2019), matplotlib777https://github.com/matplotlib/matplotlib, (Hunter, 2007), emcee888https://github.com/dfm/emcee, (Foreman-Mackey et al., 2013), corner999https://github.com/dfm/corner.py, (Foreman-Mackey, 2016), astropy101010https://github.com/astropy/astropy, (Astropy Collaboration et al., 2013), pandas111111https://github.com/pandas-dev/pandas, scipy121212https://github.com/scipy/scipy, (Jones et al., 01), dsigma131313https://github.com/johannesulf/dsigma for their accurate and fast performance and all their contributed authors.
This research is supported by the Director, Office of Science, Office of High Energy Physics of the U.S. Department of Energy under Contract No. DE–AC02–05CH11231, and by the National Energy Research Scientific Computing Center, a DOE Office of Science User Facility under the same contract; additional support for DESI is provided by the U.S. National Science Foundation, Division of Astronomical Sciences under Contract No. AST-0950945 to the NSF’s National Optical-Infrared Astronomy Research Laboratory; the Science and Technologies Facilities Council of the United Kingdom; the Gordon and Betty Moore Foundation; the Heising-Simons Foundation; the French Alternative Energies and Atomic Energy Commission (CEA); the National Council of Science and Technology of Mexico (CONACYT); the Ministry of Science and Innovation of Spain (MICINN), and by the DESI Member Institutions: https://www.desi.lbl.gov/collaborating-institutions.
The DESI Legacy Imaging Surveys consist of three individual and complementary projects: the Dark Energy Camera Legacy Survey (DECaLS), the Beijing-Arizona Sky Survey (BASS), and the Mayall z-band Legacy Survey (MzLS). DECaLS, BASS and MzLS together include data obtained, respectively, at the Blanco telescope, Cerro Tololo Inter-American Observatory, NSF’s NOIRLab; the Bok telescope, Steward Observatory, University of Arizona; and the Mayall telescope, Kitt Peak National Observatory, NOIRLab. NOIRLab is operated by the Association of Universities for Research in Astronomy (AURA) under a cooperative agreement with the National Science Foundation. Pipeline processing and analyses of the data were supported by NOIRLab and the Lawrence Berkeley National Laboratory. Legacy Surveys also uses data products from the Near-Earth Object Wide-field Infrared Survey Explorer (NEOWISE), a project of the Jet Propulsion Laboratory/California Institute of Technology, funded by the National Aeronautics and Space Administration. Legacy Surveys was supported by: the Director, Office of Science, Office of High Energy Physics of the U.S. Department of Energy; the National Energy Research Scientific Computing Center, a DOE Office of Science User Facility; the U.S. National Science Foundation, Division of Astronomical Sciences; the National Astronomical Observatories of China, the Chinese Academy of Sciences and the Chinese National Natural Science Foundation. LBNL is managed by the Regents of the University of California under contract to the U.S. Department of Energy. The complete acknowledgments can be found at https://www.legacysurvey.org/.
The authors are honored to be permitted to conduct scientific research on Iolkam Du’ag (Kitt Peak), a mountain with particular significance to the Tohono O’odham Nation.
Data Availability
The data used to produce the figures in this work are available through https://doi.org/10.5281/zenodo.7322710 following DESI Data Management Plan.
The inclusion of a Data Availability Statement is a requirement for articles published in MNRAS. Data Availability Statements provide a standardized format for readers to understand the availability of data underlying the research results described in the article. The statement may refer to original data generated in the course of the study or to third-party data analyzed in the article. The statement should describe and provide means of access, where possible, by linking to the data or providing the required accession numbers for the relevant databases or DOIs.
References
- Alexander et al. (2022) Alexander D. M., et al., 2022, arXiv e-prints, p. arXiv:2208.08517
- Allende Prieto et al. (2020) Allende Prieto C., et al., 2020, Research Notes of the American Astronomical Society, 4, 188
- Amon et al. (2018) Amon A., et al., 2018, MNRAS, 477, 4285
- Amon et al. (2021) Amon A., et al., 2021, arXiv e-prints, p. arXiv:2105.13543
- Amon et al. (2022) Amon A., et al., 2022, Phys. Rev. D, 105, 023514
- Asgari et al. (2021) Asgari M., et al., 2021, A&A, 645, A104
- Astropy Collaboration et al. (2013) Astropy Collaboration et al., 2013, A&A, 558, A33
- Bailey et al. (2022) Bailey et al. 2022
- Begeman et al. (2013) Begeman K., Belikov A. N., Boxhoorn D. R., Valentijn E. A., 2013, Experimental Astronomy, 35, 1
- Benitez (2000) Benitez N., 2000, ApJ, 536, 571
- Benítez et al. (2004) Benítez N., et al., 2004, ApJS, 150, 1
- Blake et al. (2020) Blake C., et al., 2020, A&A, 642, A158
- Buchs et al. (2019) Buchs R., et al., 2019, MNRAS, 489, 820
- Chang et al. (2019) Chang C., et al., 2019, MNRAS, 482, 3696
- Chaussidon et al. (2022) Chaussidon E., et al., 2022, arXiv e-prints, p. arXiv:2208.08511
- Chisari et al. (2019) Chisari N. E., et al., 2019, ApJS, 242, 2
- Cooper et al. (2022) Cooper A. P., et al., 2022, arXiv e-prints, p. arXiv:2208.08514
- DES Collaboration et al. (2021) DES Collaboration et al., 2021, arXiv e-prints, p. arXiv:2105.13549
- DESI Collaboration et al. (2016a) DESI Collaboration et al., 2016a, arXiv e-prints, p. arXiv:1611.00036
- DESI Collaboration et al. (2016b) DESI Collaboration et al., 2016b, arXiv e-prints, p. arXiv:1611.00037
- DESI Collaboration et al. (2022) DESI Collaboration et al., 2022, arXiv e-prints, p. arXiv:2205.10939
- DESI collaboration et al. (2022) DESI collaboration et al. 2022
- DESI collaboration et al. (2023) DESI collaboration et al. 2023
- Deshpande & Kitching (2020) Deshpande A. C., Kitching T. D., 2020, Phys. Rev. D, 101, 103531
- Dey et al. (2019) Dey A., et al., 2019, AJ, 157, 168
- Dong et al. (2022) Dong F., Zhang P., Sun Z., Park C., 2022, arXiv e-prints, p. arXiv:2206.04917
- Duffy et al. (2008) Duffy A. R., Schaye J., Kay S. T., Dalla Vecchia C., 2008, MNRAS, 390, L64
- Duncan (2022) Duncan K. J., 2022, MNRAS, 512, 3662
- Erben et al. (2013) Erben T., et al., 2013, MNRAS, 433, 2545
- Euclid Collaboration et al. (2019) Euclid Collaboration et al., 2019, A&A, 627, A59
- Favole et al. (2016) Favole G., et al., 2016, MNRAS, 461, 3421
- Fenech Conti et al. (2017) Fenech Conti I., Herbonnet R., Hoekstra H., Merten J., Miller L., Viola M., 2017, MNRAS, 467, 1627
- Fong & Han (2021) Fong M., Han J., 2021, MNRAS, 503, 4250
- Fong et al. (2019) Fong M., Choi M., Catlett V., Lee B., Peel A., Bowyer R., King L. J., McCarthy I. G., 2019, MNRAS, 488, 3340
- Foreman-Mackey (2016) Foreman-Mackey D., 2016, The Journal of Open Source Software, 1, 24
- Foreman-Mackey et al. (2013) Foreman-Mackey D., Hogg D. W., Lang D., Goodman J., 2013, PASP, 125, 306
- Gao et al. (2022) Gao H., Jing Y. P., Zheng Y., Xu K., 2022, ApJ, 928, 10
- Giblin et al. (2021) Giblin B., et al., 2021, A&A, 645, A105
- Gong et al. (2019) Gong Y., et al., 2019, ApJ, 883, 203
- Gonzalez-Nuevo et al. (2020) Gonzalez-Nuevo J., Cueli M. M., Bonavera L., Lapi A., Migliaccio M., Argüeso F., Toffolatti L., 2020, arXiv e-prints, p. arXiv:2007.15134
- Górski et al. (2005) Górski K. M., Hivon E., Banday A. J., Wandelt B. D., Hansen F. K., Reinecke M., Bartelmann M., 2005, ApJ, 622, 759
- Guy et al. (2022) Guy et al. 2022
- Hahn et al. (2022) Hahn C., et al., 2022, arXiv e-prints, p. arXiv:2208.08512
- Hamana et al. (2020) Hamana T., et al., 2020, PASJ, 72, 16
- Harnois-Déraps et al. (2021) Harnois-Déraps J., Martinet N., Castro T., Dolag K., Giblin B., Heymans C., Hildebrandt H., Xia Q., 2021, MNRAS, 506, 1623
- Hartlap et al. (2007) Hartlap J., Simon P., Schneider P., 2007, A&A, 464, 399
- Heymans et al. (2012) Heymans C., et al., 2012, MNRAS, 427, 146
- Heymans et al. (2021) Heymans C., et al., 2021, A&A, 646, A140
- Hikage et al. (2019) Hikage C., et al., 2019, PASJ, 71, 43
- Hildebrandt et al. (2017) Hildebrandt H., et al., 2017, MNRAS, 465, 1454
- Huff & Mandelbaum (2017) Huff E., Mandelbaum R., 2017, arXiv e-prints, p. arXiv:1702.02600
- Hunter (2007) Hunter J. D., 2007, Computing in Science & Engineering, 9, 90
- Jarvis et al. (2004) Jarvis M., Bernstein G., Jain B., 2004, MNRAS, 352, 338
- Jarvis et al. (2016) Jarvis M., et al., 2016, MNRAS, 460, 2245
- Jedamzik et al. (2021) Jedamzik K., Pogosian L., Zhao G.-B., 2021, Communications Physics, 4, 123
- Joachimi et al. (2021) Joachimi B., et al., 2021, A&A, 646, A129
- Jones et al. (01 ) Jones E., Oliphant T., Peterson P., et al., 2001–, SciPy: Open source scientific tools for Python, http://www.scipy.org/
- Joudaki et al. (2018) Joudaki S., et al., 2018, MNRAS, 474, 4894
- Jullo et al. (2019) Jullo E., et al., 2019, A&A, 627, A137
- Kannawadi et al. (2019) Kannawadi A., et al., 2019, A&A, 624, A92
- Kitanidis & White (2021) Kitanidis E., White M., 2021, MNRAS, 501, 6181
- Kong et al. (2020) Kong H., et al., 2020, arXiv e-prints, p. arXiv:2007.08992
- LSST Science Collaboration et al. (2009) LSST Science Collaboration et al., 2009, arXiv e-prints, p. arXiv:0912.0201
- Lan et al. (2022) Lan T.-W., et al., 2022, arXiv e-prints, p. arXiv:2208.08516
- Lang et al. (2014) Lang D., Hogg D. W., Schlegel D. J., 2014, arXiv e-prints, p. arXiv:1410.7397
- Laureijs et al. (2011) Laureijs R., et al., 2011, arXiv e-prints, p. arXiv:1110.3193
- Leauthaud et al. (2017) Leauthaud A., et al., 2017, MNRAS, 467, 3024
- Leauthaud et al. (2022) Leauthaud A., et al., 2022, MNRAS, 510, 6150
- Lee et al. (2022) Lee S., et al., 2022, MNRAS, 509, 2033
- Levi et al. (2013) Levi M., et al., 2013, arXiv e-prints, p. arXiv:1308.0847
- Li et al. (2020) Li H., Zhang J., Liu D., Luo W., Zhang J., Dong F., Shen Z., Wang H., 2020, arXiv e-prints, p. arXiv:2006.02095
- Lin & Ishak (2017) Lin W., Ishak M., 2017, Phys. Rev. D, 96, 083532
- Liu et al. (2021) Liu X., Liu D., Gao Z., Wei C., Li G., Fu L., Futamase T., Fan Z., 2021, Phys. Rev. D, 103, 123504
- Mandelbaum (2018) Mandelbaum R., 2018, ARA&A, 56, 393
- Mandelbaum et al. (2005) Mandelbaum R., et al., 2005, Monthly Notices of the Royal Astronomical Society, 361, 1287
- Mandelbaum et al. (2006) Mandelbaum R., Hirata C. M., Ishak M., Seljak U., Brinkmann J., 2006, MNRAS, 367, 611
- Mandelbaum et al. (2015) Mandelbaum R., et al., 2015, MNRAS, 450, 2963
- Mandelbaum et al. (2018) Mandelbaum R., et al., 2018, PASJ, 70, S25
- Mead et al. (2021) Mead A. J., Brieden S., Tröster T., Heymans C., 2021, MNRAS, 502, 1401
- Meisner et al. (2017) Meisner A. M., Lang D., Schlegel D. J., 2017, AJ, 154, 161
- Miller et al. (2013) Miller L., et al., 2013, MNRAS, 429, 2858
- Miller et al. (2022) Miller et al. 2022
- Moustakas et al. (2022) Moustakas et al. 2022
- Myers et al. (2022) Myers A. D., et al., 2022, arXiv e-prints, p. arXiv:2208.08518
- Navarro et al. (1996) Navarro J. F., Frenk C. S., White S. D. M., 1996, ApJ, 462, 563
- Niemiec et al. (2017) Niemiec A., et al., 2017, MNRAS, 471, 1153
- Peng et al. (2022) Peng H., Xu H., Zhang L., Chen Z., Yu Y., 2022, arXiv e-prints, p. arXiv:2203.14609
- Perivolaropoulos & Skara (2021) Perivolaropoulos L., Skara F., 2021, arXiv e-prints, p. arXiv:2105.05208
- Phriksee et al. (2020) Phriksee A., Jullo E., Limousin M., Shan H., Finoguenov A., Komonjinda S., Wannawichian S., Sawangwit U., 2020, MNRAS, 491, 1643
- Planck Collaboration et al. (2020) Planck Collaboration et al., 2020, A&A, 641, A1
- Prat et al. (2021) Prat J., et al., 2021, arXiv e-prints, p. arXiv:2105.13541
- Pujol et al. (2020) Pujol A., Bobin J., Sureau F., Guinot A., Kilbinger M., 2020, arXiv e-prints, p. arXiv:2006.07011
- Raichoor et al. (2020) Raichoor A., et al., 2020, Research Notes of the American Astronomical Society, 4, 180
- Raichoor et al. (2022) Raichoor et al. 2022
- Refregier (2003) Refregier A., 2003, ARA&A, 41, 645
- Ruiz-Macias et al. (2020) Ruiz-Macias O., et al., 2020, Research Notes of the American Astronomical Society, 4, 187
- Sánchez et al. (2021) Sánchez C., et al., 2021, arXiv e-prints, p. arXiv:2105.13542
- Schlafly et al. (2022) Schlafly et al. 2022
- Schlegel et al. (2022) Schlegel et al. 2022
- Secco et al. (2022) Secco L. F., et al., 2022, Phys. Rev. D, 105, 023515
- Shan et al. (2018) Shan H., et al., 2018, MNRAS, 474, 1116
- Sheldon & Huff (2017) Sheldon E. S., Huff E. M., 2017, ApJ, 841, 24
- Silber et al. (2022) Silber J. H., et al., 2022, arXiv e-prints, p. arXiv:2205.09014
- Spergel et al. (2015) Spergel D., et al., 2015, arXiv e-prints, p. arXiv:1503.03757
- Sun et al. (2022) Sun Z., Zhang P., Yao J., Dong F., Shan H., Jullo E., Kneib J.-P., Yin B., 2022, arXiv e-prints, p. arXiv:2210.13717
- Takada & Hu (2013) Takada M., Hu W., 2013, Phys. Rev. D, 87, 123504
- Takada & Jain (2004) Takada M., Jain B., 2004, MNRAS, 348, 897
- Tinker et al. (2008) Tinker J., Kravtsov A. V., Klypin A., Abazajian K., Warren M., Yepes G., Gottlöber S., Holz D. E., 2008, ApJ, 688, 709
- Tinker et al. (2010) Tinker J. L., Robertson B. E., Kravtsov A. V., Klypin A., Warren M. S., Yepes G., Gottlöber S., 2010, ApJ, 724, 878
- Wang et al. (2020) Wang Y., et al., 2020, MNRAS, 498, 3470
- Wright et al. (2010) Wright E. L., et al., 2010, AJ, 140, 1868
- Wright et al. (2019) Wright A. H., et al., 2019, A&A, 632, A34
- Wright et al. (2020) Wright A. H., Hildebrandt H., van den Busch J. L., Heymans C., 2020, A&A, 637, A100
- Xu et al. (2021) Xu W., et al., 2021, ApJ, 922, 162
- Yamamoto et al. (2022) Yamamoto M., Troxel M. A., Jarvis M., Mandelbaum R., Hirata C., Long H., Choi A., Zhang T., 2022, arXiv e-prints, p. arXiv:2203.08845
- Yang et al. (2017) Yang X., Zhang J., Yu Y., Zhang P., 2017, ApJ, 845, 174
- Yao et al. (2017) Yao J., Ishak M., Lin W., Troxel M. A., 2017, preprint, (arXiv:1707.01072)
- Yao et al. (2020) Yao J., Shan H., Zhang P., Kneib J.-P., Jullo E., 2020, ApJ, 904, 135
- Yèche et al. (2020) Yèche C., et al., 2020, Research Notes of the American Astronomical Society, 4, 179
- Zhang (2010) Zhang P., 2010, ApJ, 720, 1090
- Zhang et al. (2007) Zhang P., Liguori M., Bean R., Dodelson S., 2007, Phys. Rev. Lett., 99, 141302
- Zhang et al. (2010) Zhang P., Pen U.-L., Bernstein G., 2010, MNRAS, 405, 359
- Zhou et al. (2020) Zhou R., et al., 2020, Research Notes of the American Astronomical Society, 4, 181
- Zhou et al. (2021) Zhou R., et al., 2021, MNRAS, 501, 3309
- Zhou et al. (2022) Zhou R., et al., 2022, arXiv e-prints, p. arXiv:2208.08515
- Zonca et al. (2019) Zonca A., Singer L., Lenz D., Reinecke M., Rosset C., Hivon E., Gorski K., 2019, Journal of Open Source Software, 4, 1298
- Zou et al. (2017) Zou H., et al., 2017, PASP, 129, 064101
- Zou et al. (2019) Zou H., Gao J., Zhou X., Kong X., 2019, The Astrophysical Journal Supplement Series, 242, 8
- Zu et al. (2021) Zu Y., et al., 2021, MNRAS, 505, 5117
- de Jong et al. (2015) de Jong J. T. A., et al., 2015, A&A, 582, A62
- van den Busch et al. (2020) van den Busch J. L., et al., 2020, A&A, 642, A200
- von Wietersheim-Kramsta et al. (2021) von Wietersheim-Kramsta M., et al., 2021, MNRAS, 504, 1452
Appendix A Theoretical Covariance
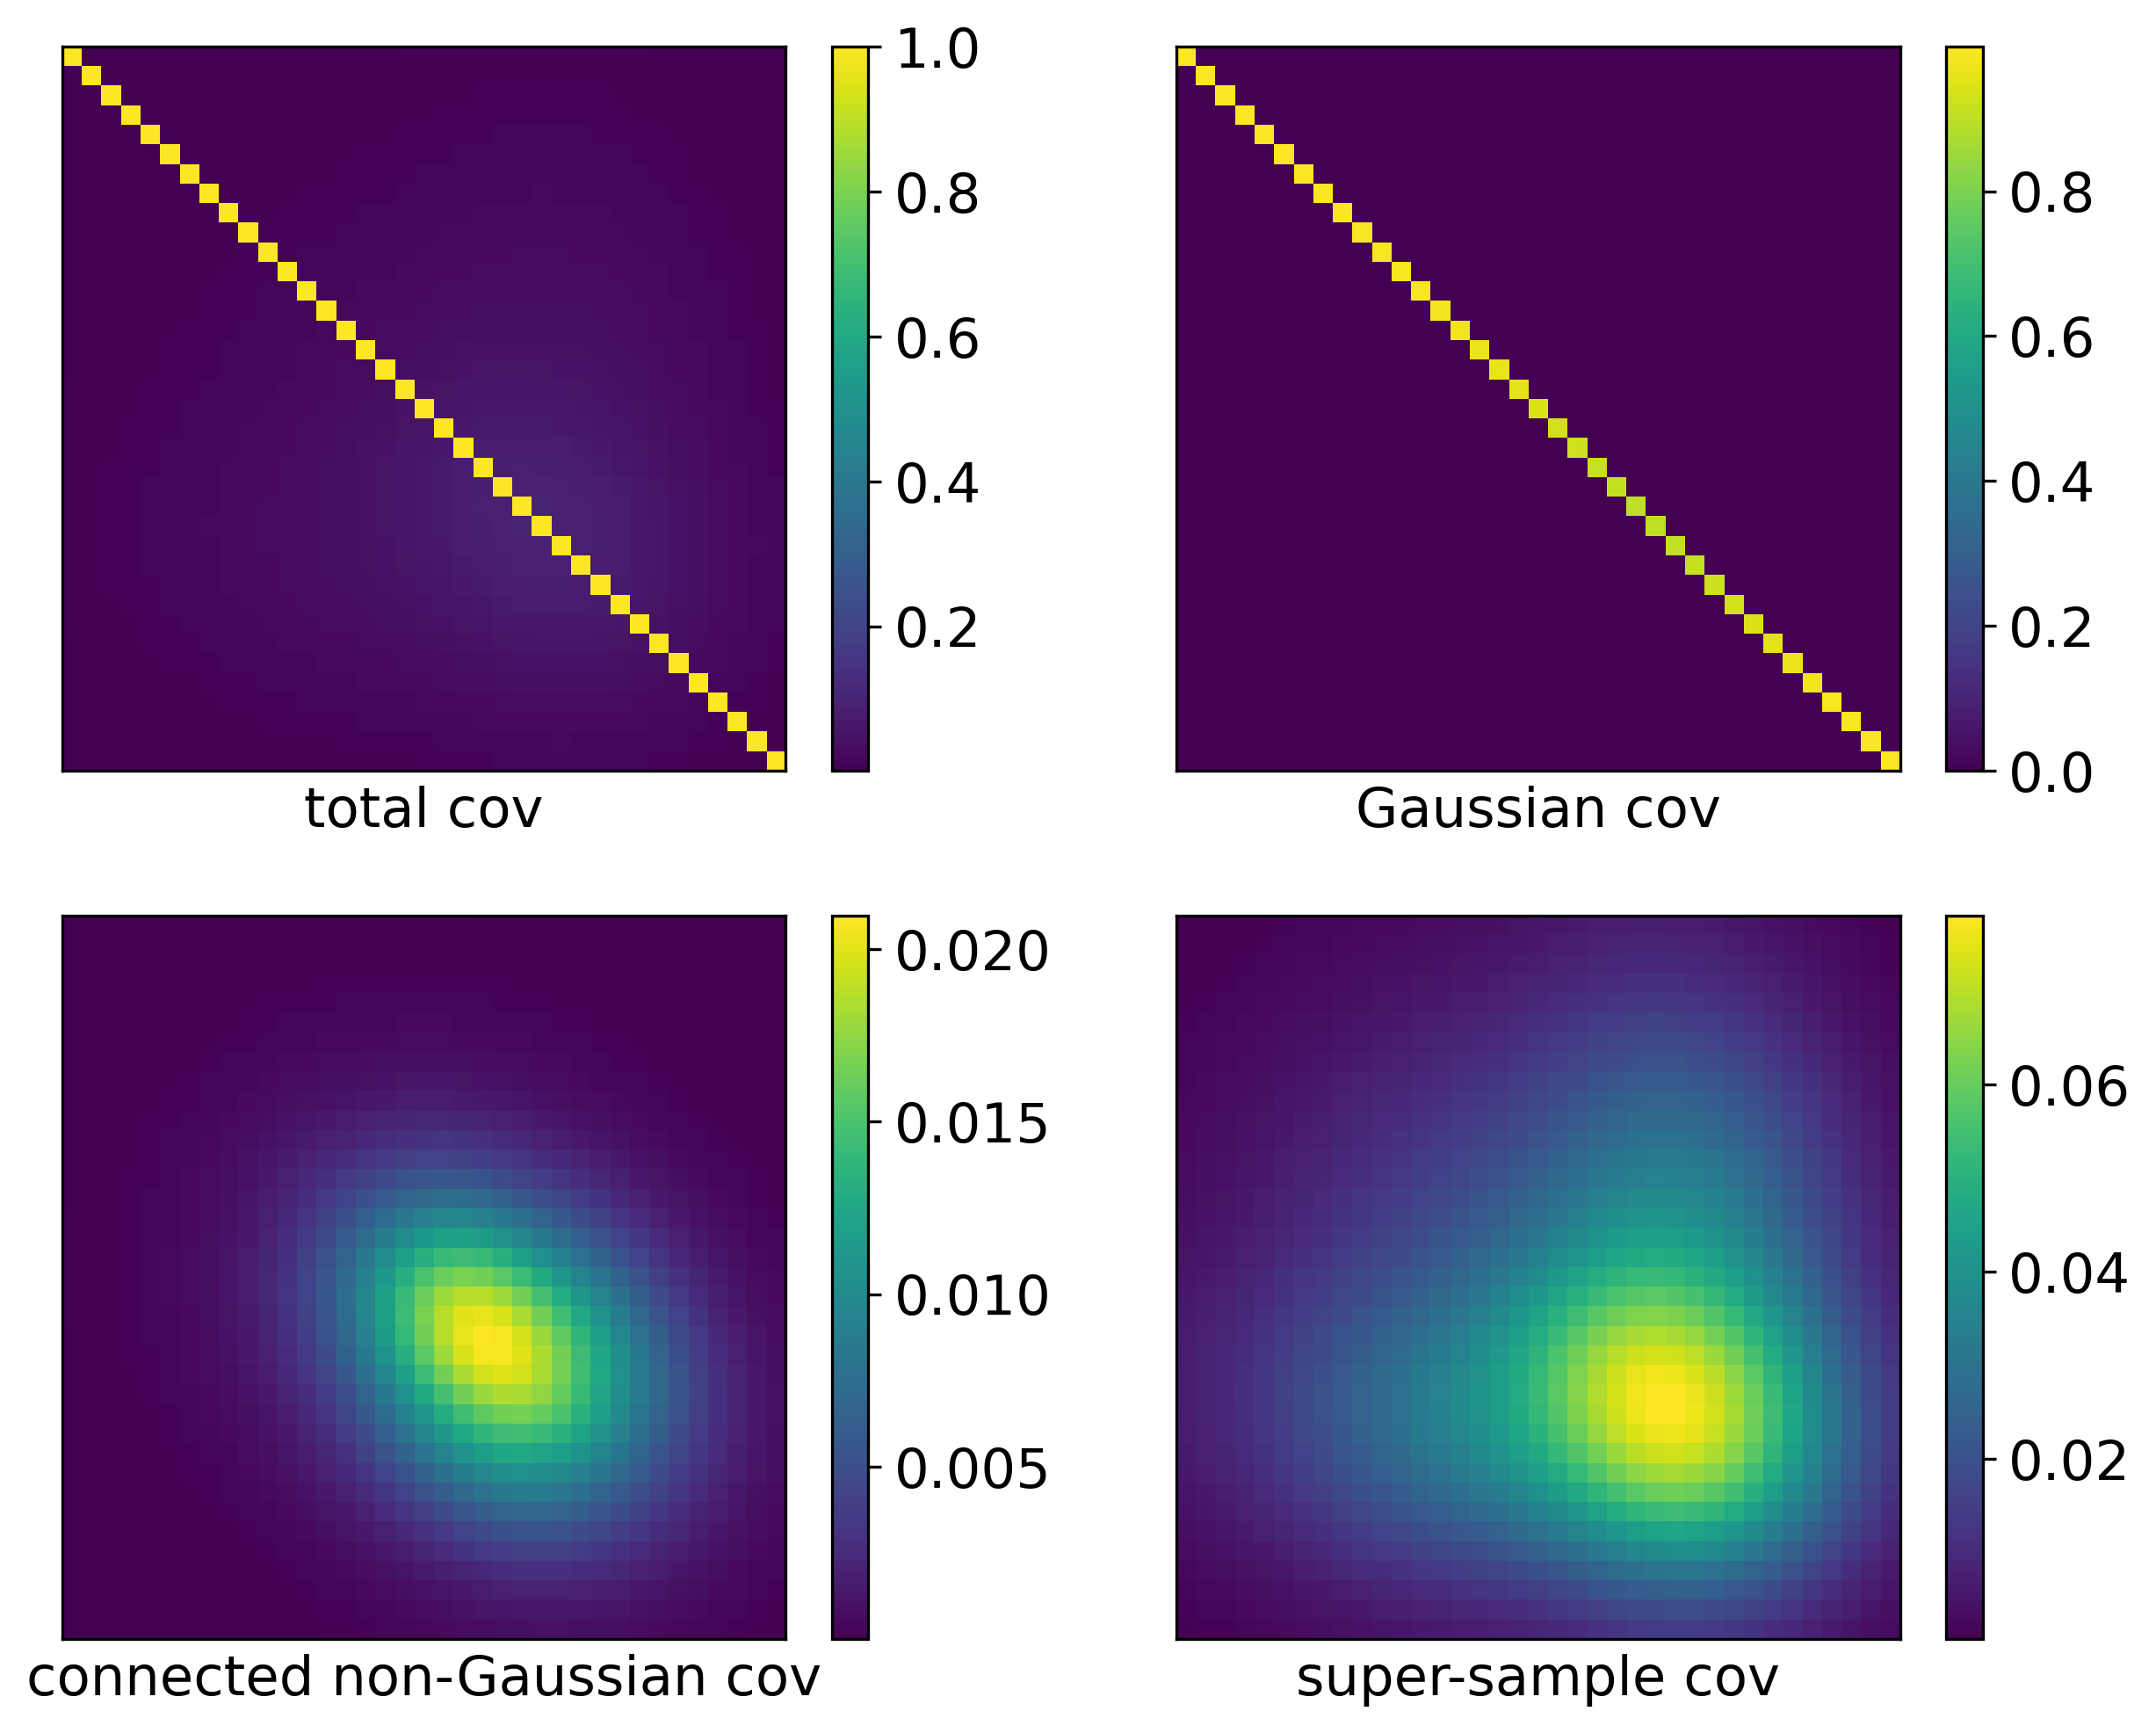
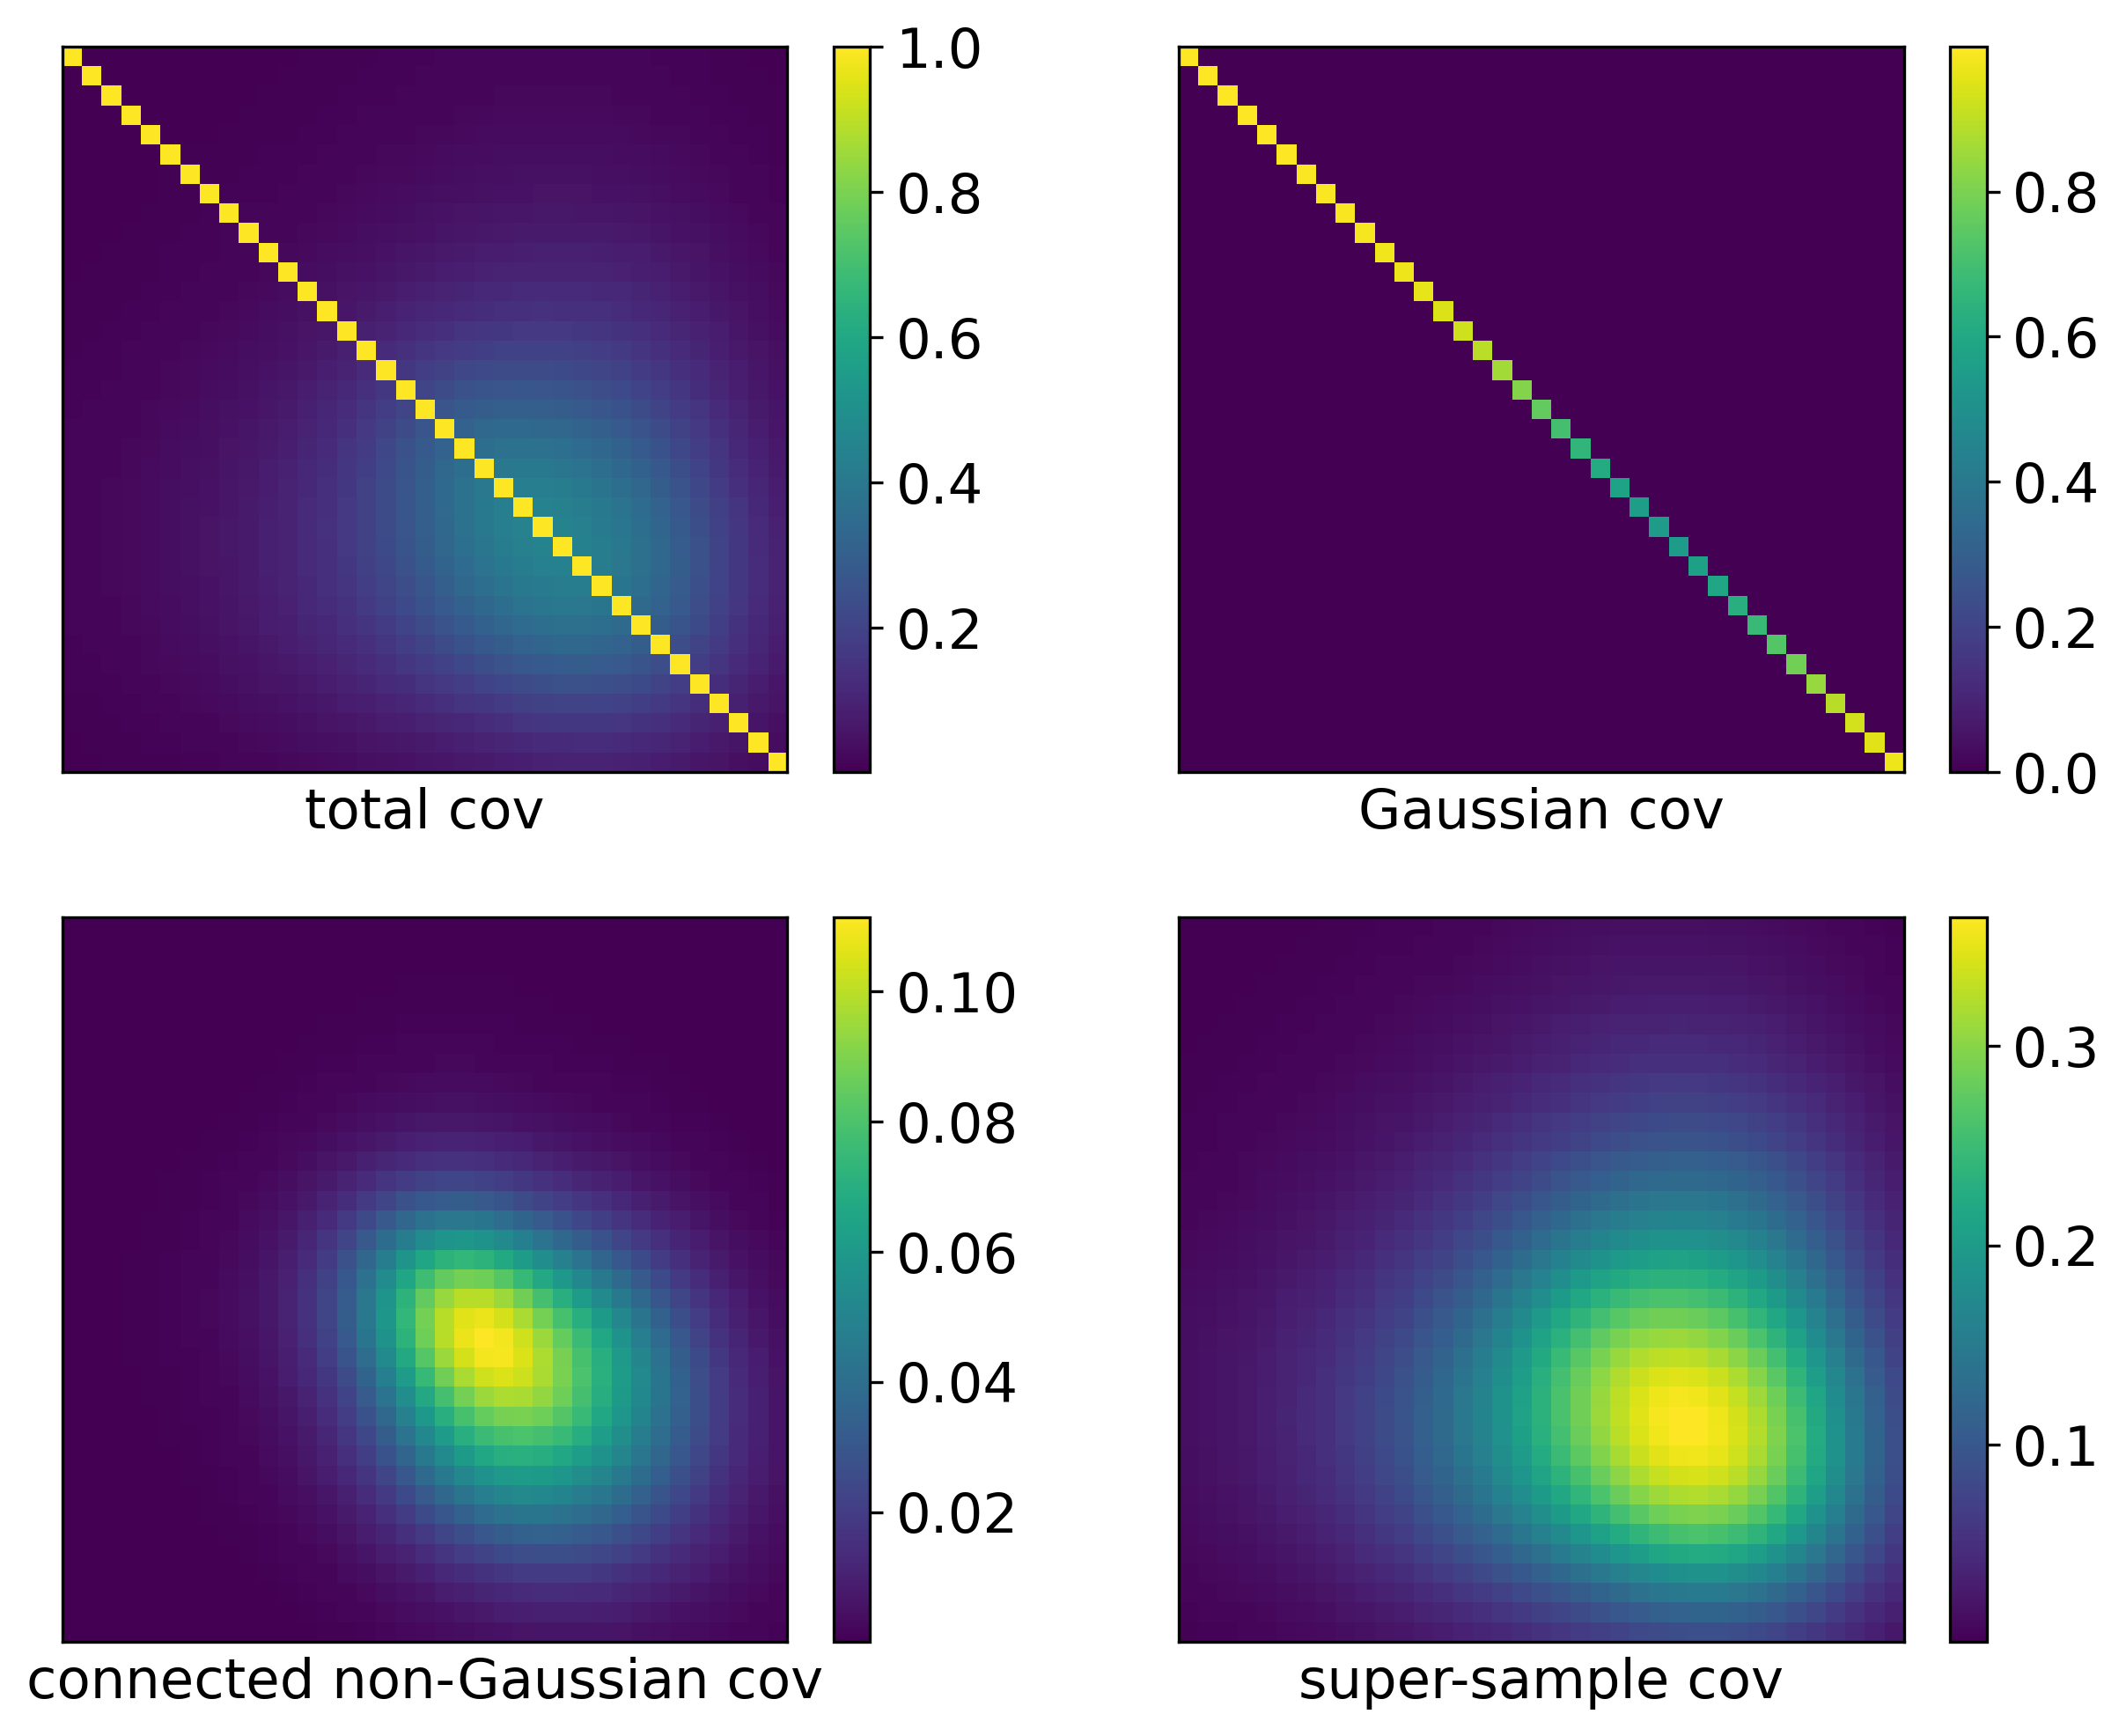
We test the Gaussian covariance assumption being used in Table 1 in this section. We use DECaLSBGS and KiDSBGS as examples, using the same galaxy number densities and redshift distributions as in Fig. 1, and the same area as shown in Table 1. The angular power spectrum is calculated within range , binned with , thus total angular bins. We follow the procedures in Joachimi et al. (2021) and divide the components into Gaussian covariance, connected non-Gaussian covariance, and super-sample covariance.
The Gaussian covariance is calculated by
| (11) |
where is the Kronecker delta function; , and are the galaxy-lensing, galaxy-galaxy, lensing-lensing angular power spectrum, respectively; and are the shot noise for and , where is the fraction of sky of the overlapped area, and are the total number of the galaxies for the lens and source.
The connected non-Gaussian covariance (Takada & Jain, 2004) is calculated by
| (12) |
where and are the lens distribution and source lensing efficiency, denotes the lens galaxy bias, denotes the comoving distance, same as those in Eq. (1); is the matter trispectrum, calculated using a halo model formalism (Joachimi et al., 2021). We assume the NFW halo profile (Navarro et al., 1996) with a concentration-mass relation (Duffy et al., 2008), a halo mass function (Tinker et al., 2008) and a halo bias (Tinker et al., 2010).
The super-sample covariance (Takada & Hu, 2013) is calculated by
| (13) |
where the derivative of gives the response of the matter power spectrum to a change of the background density contrast , while denote the variance of the background matter fluctuations in the given footprint. In this test, we use a circular disk that covers the same area as the given survey to calculate .
The calculation is performed with the halo model tools in pyccl. We show the results of DECaLSBGS in Fig. 12 and KiDSBGS in Fig. 13. It is clear that the contribution from connected non-Gaussian covariance and super-sample covariance in DECaLS is negligible, so a Gaussian covariance can be fairly assumed for DECaLS in Table 1. The Gaussian covariance is still dominant in KiDS, however, the contribution from the other two is not negligible. Therefore, due to the small footprint, the forecasted S/N for KiDS and HSC in Table 1 no longer scales exactly with the overlapped area.
We note that this test for different components of the covariance is only used to make an estimated comparison. Before using those covariances directly in the study, one needs to take care of the non-linear galaxy bias , the exact shape of the footprint that produces , and build simulations to validate the accuracy of the theoretical covariance transferring from angular power spectrum to correlation functions as in Joachimi et al. (2021). Therefore, we choose to stick with the data-driven jackknife covariance introduced in the main text, while we note that this effect could potentially reduce the forecasted S/N for KiDS and HSC in Table 1.
Appendix B eBOSS ELGs DECaLS shear
We show the cosmic magnification measurements using eBOSS ELGs DECaLS shear, following a similar procedure as described in Sec. 2.3 and 4.4. The overlapped area between eBOSS ELGs and DECaLS shear is deg2, which enables us to use 200 jackknife subregions and 5 angular bins, while we calculate the correlation in the angular range of arcmin, which is wider than Fig. 3, see discussions in Sec 4.1.
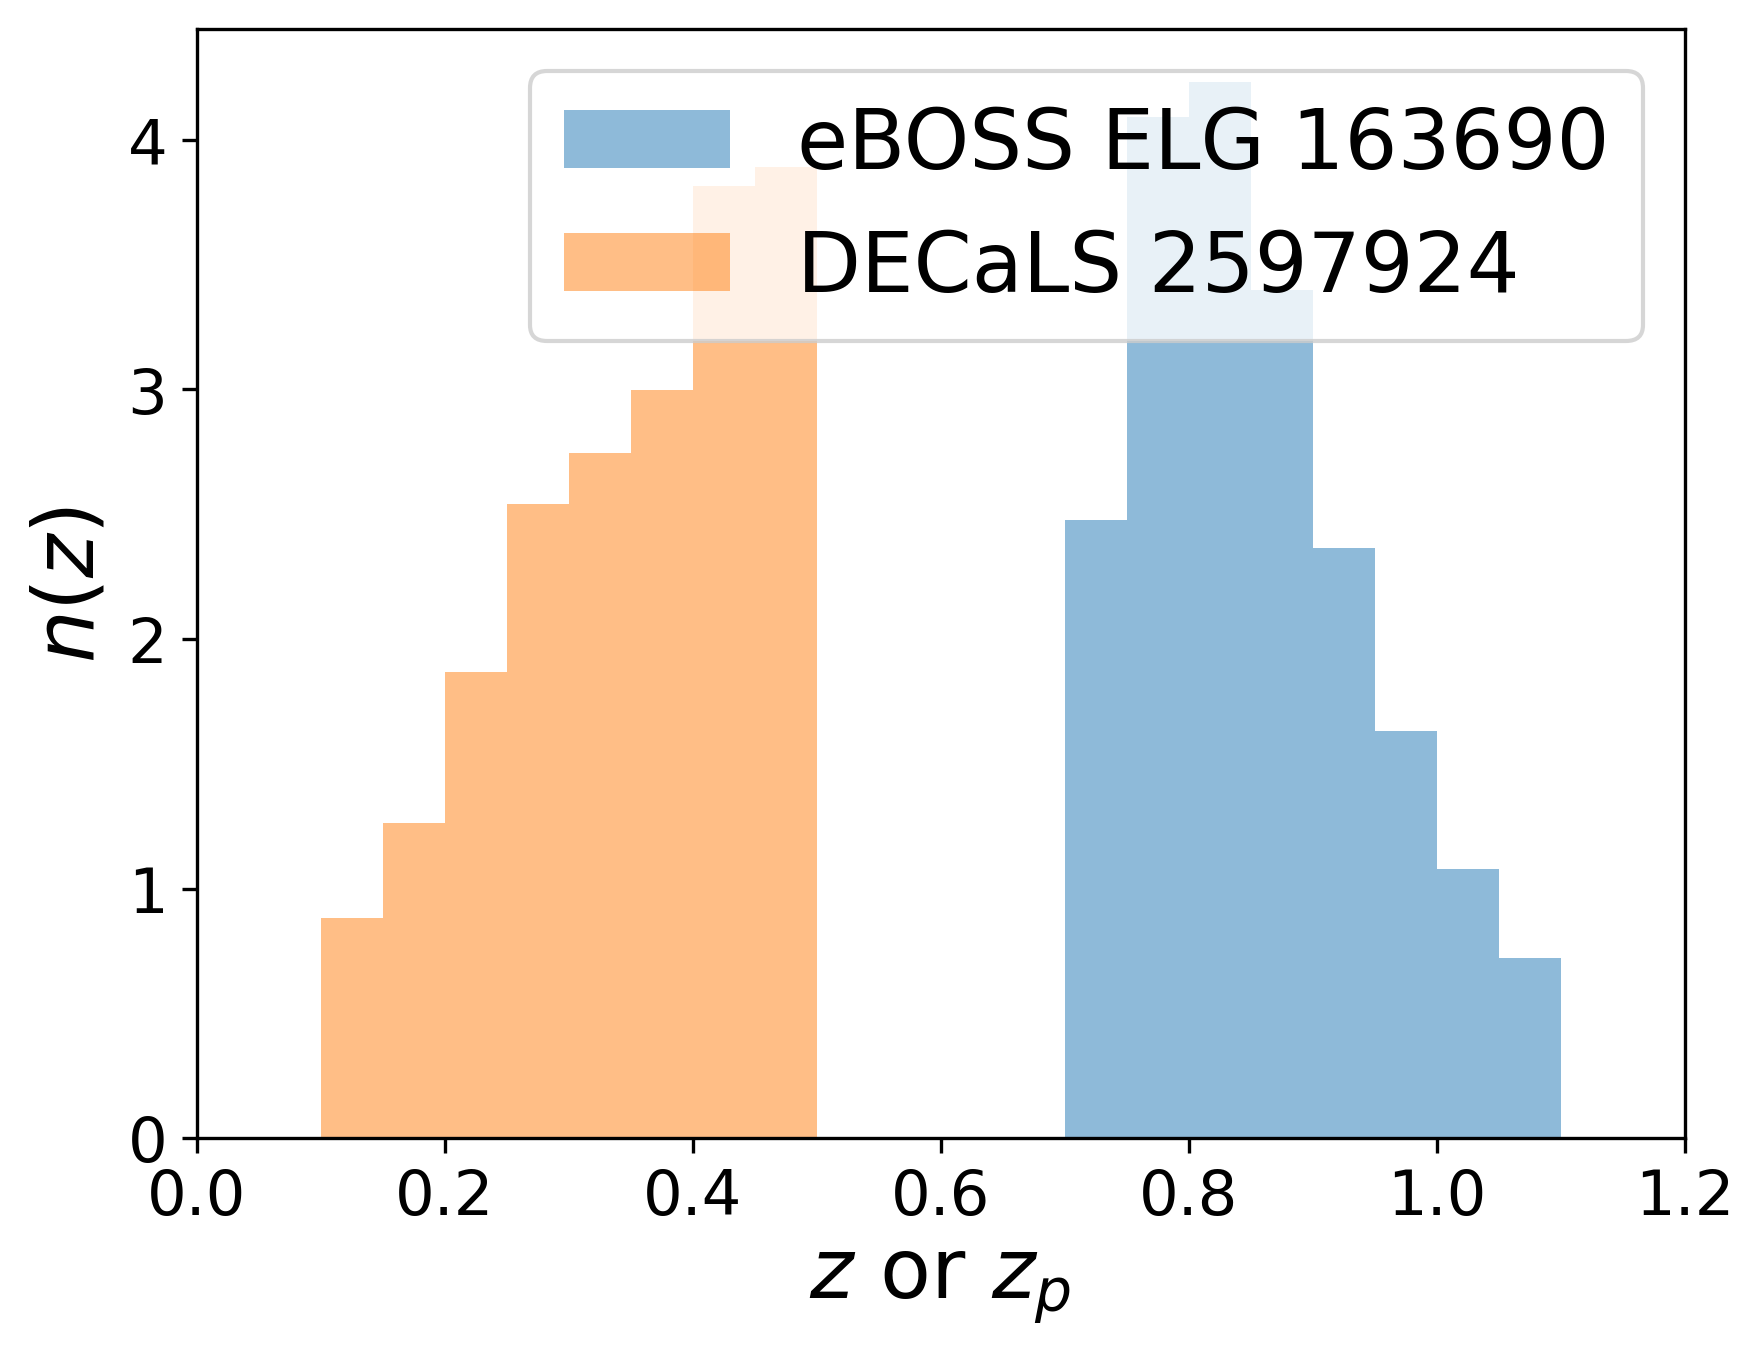
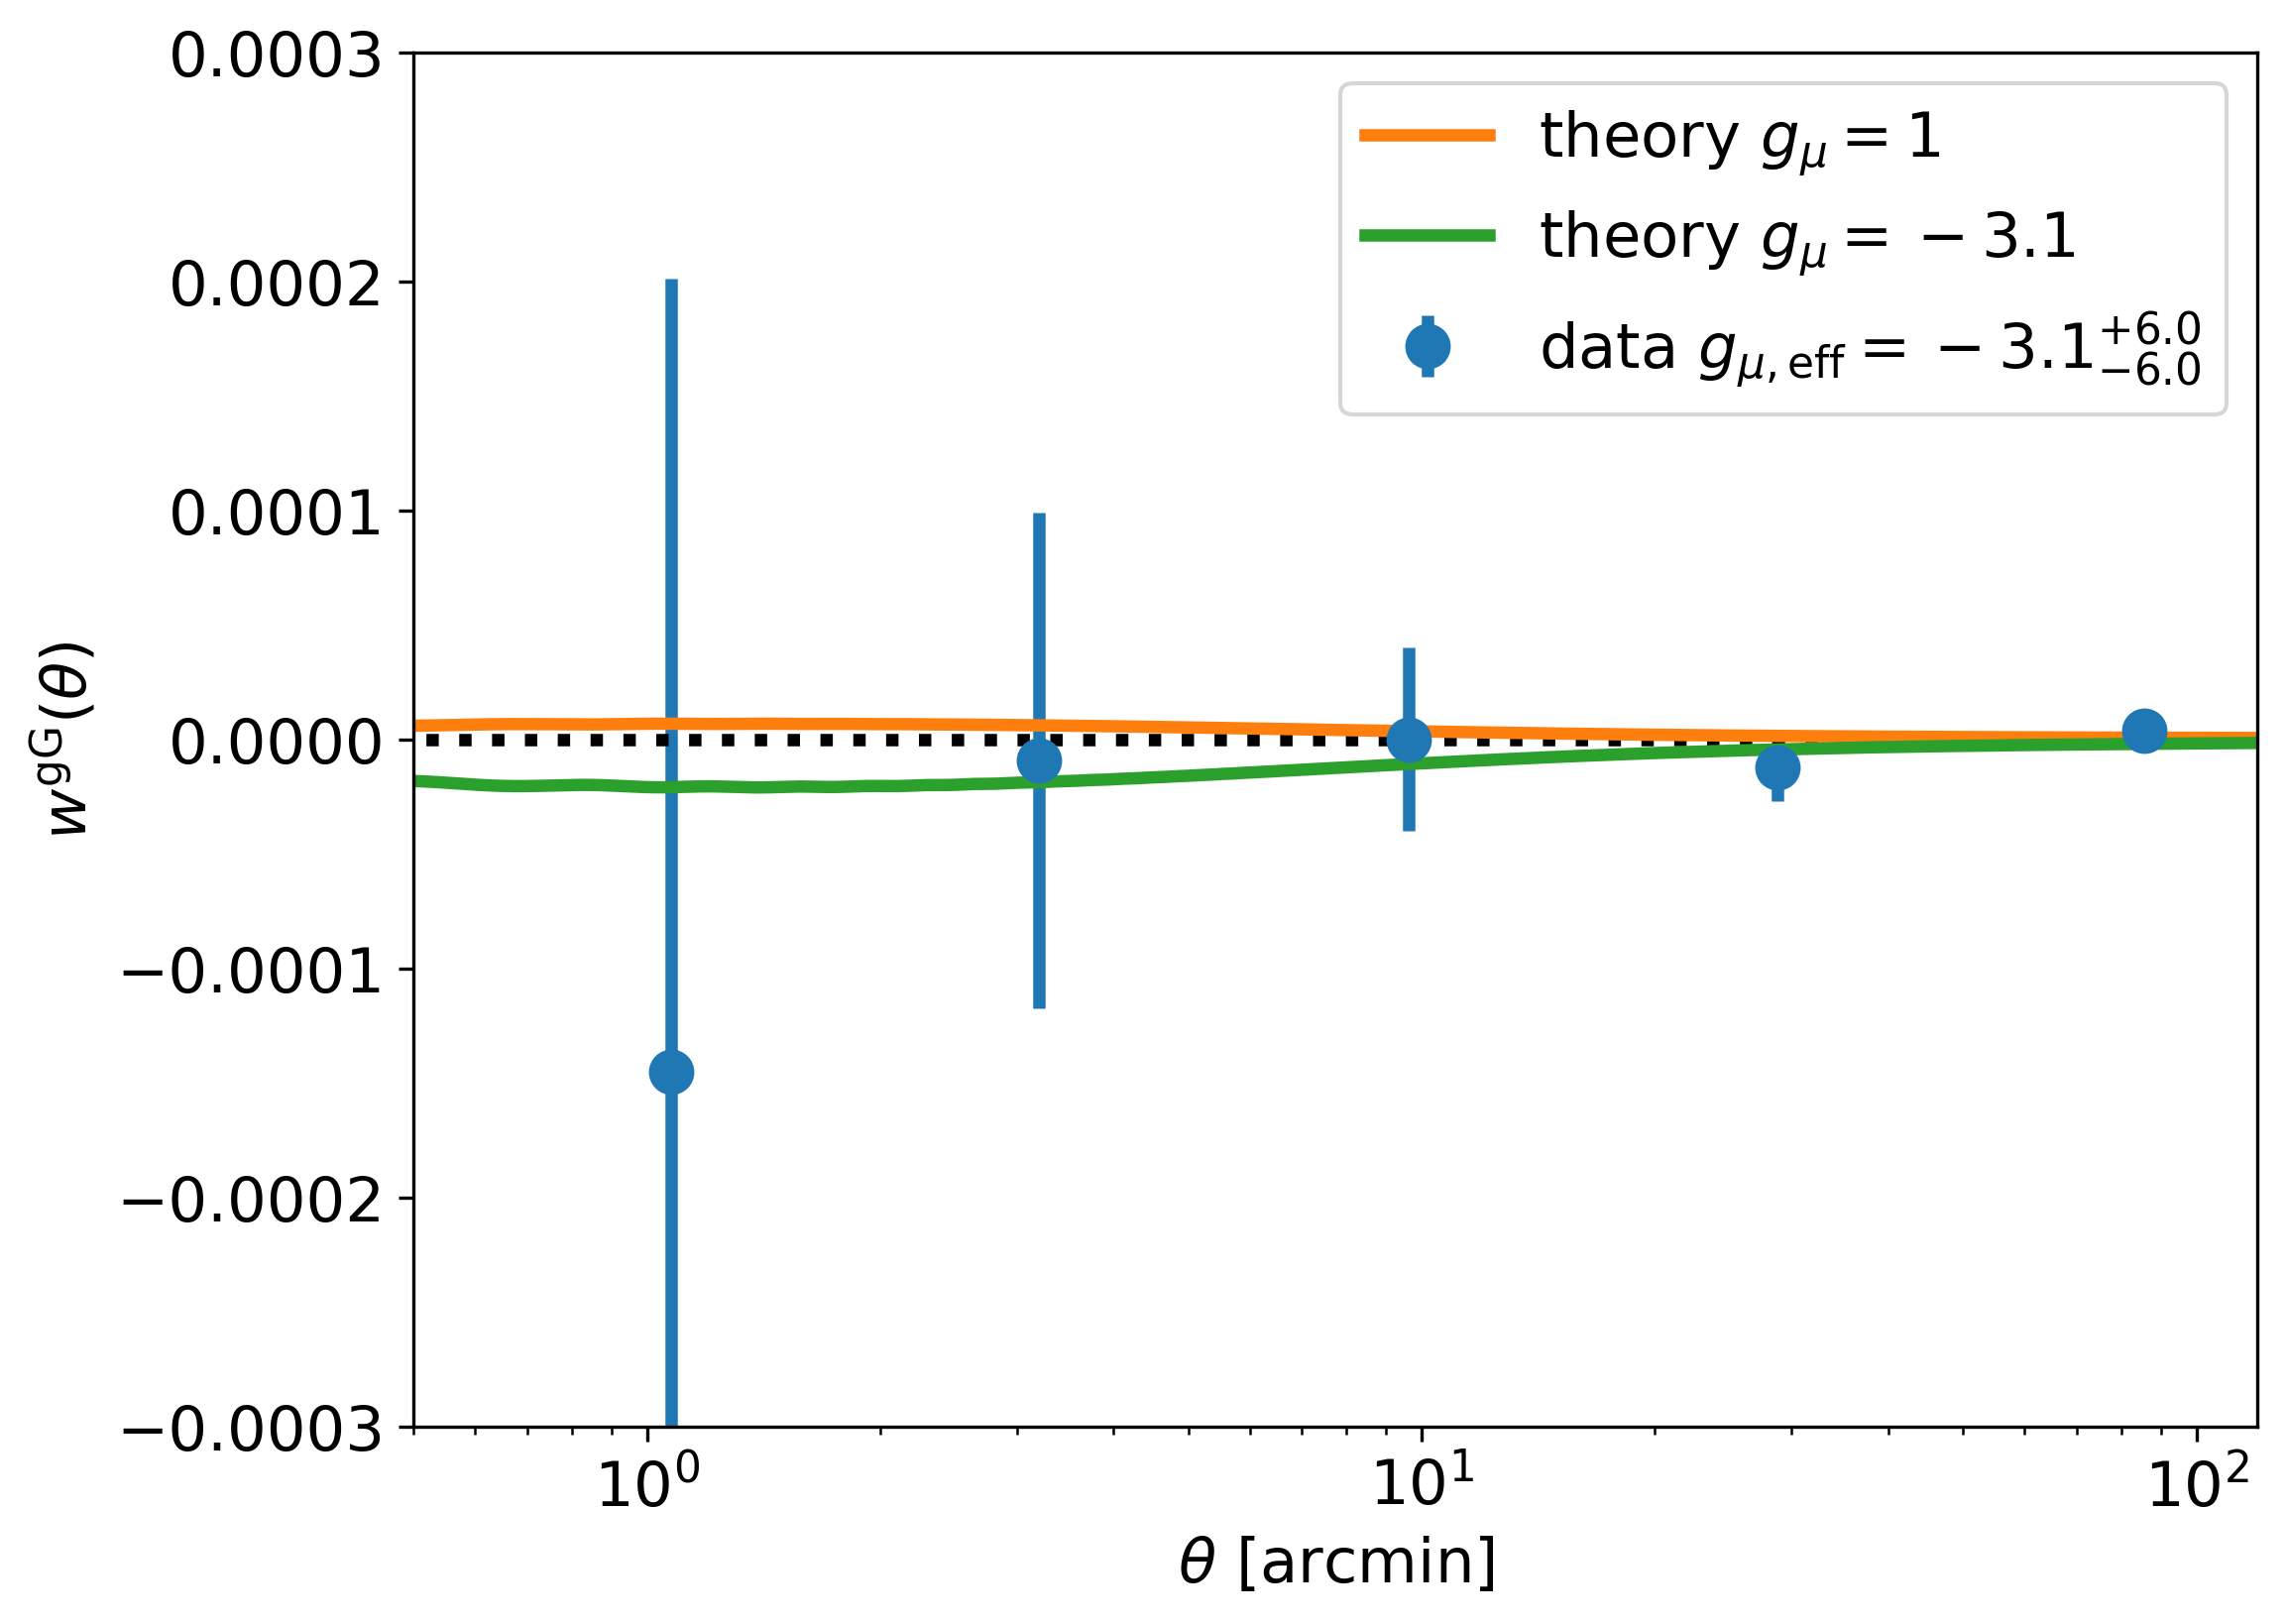
In Fig. 14 we show the galaxy redshift distribution being used in this measurement. We see that the eBOSS ELGs are distributed at lower redshift compared with DESI ELGs in Fig. 10, and more galaxies are used in this eBOSS measurement. The corresponding correlation function measurement is shown in Fig. 15, which is consistent with 0. We think this is due to the fact that the galaxy number density for the eBOSS ELGs is much lower than the DESI ELGs, leading to a larger shot noise.