On Pre-trained Language Models for Antibody
Abstract
Antibodies are vital proteins offering robust protection for the human body from pathogens. The development of general protein and antibody-specific pre-trained language models both facilitate antibody prediction tasks. However, there have been limited studies that comprehensively explore the representation capability of distinct pre-trained language models on different antibody tasks. To investigate the problem, we aim to answer several key questions in this paper, such as how pre-trained language models perform in antibody tasks with different specificity and how introducing specific biological mechanisms to the pre-training process can benefit the model. Additionally, we evaluate if the learned antibody pre-trained representations can be applied to real-world antibody problems, like drug discovery and immune process understanding. Previously, no benchmark available largely hindered the study to answer these questions. To aid in our investigation, we provide an AnTibody Understanding Evaluation (ATUE) benchmark. We comprehensively evaluate the performance of protein pre-trained language models by empirical study along with conclusions and new insights. Our ATUE and code are released at https://github.com/dqwang122/EATLM.
1 Introduction
Antibodies are a type of protein that is useful for diagnosing and treating a variety of diseases, including SARS-CoV-2 (Zhu et al., 2022). It is crucial to understand the information contained in antibody sequences to develop effective therapeutic antibodies and advance our understanding of the immune system (Greiff et al., 2020; Lu et al., 2018; Yermanos et al., 2018). Recent advances in general Pre-trained Protein Language Models (PPLM) and specific Pre-trained Antibody Language Models (PALM) offer new possibilities for antibody-related tasks. For example, PPLMs have shown promising results in transferring learned representations to antibody tasks (Kim et al., 2021; Zaslavsky et al., 2022) and PALMs have been found to improve model performance in antibody paratope predictions (Leem et al., 2022).
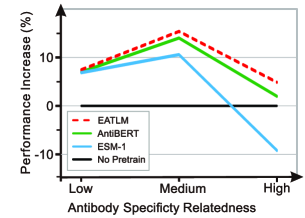
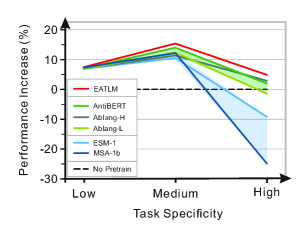
Despite these successes, few studies have thoroughly examined the capability of different pre-trained language models (e.g. general PPLMs and specific PALMs) on various antibody tasks, which hinders the development of better architectures for antibody discovery and modification. To investigate this problem, we compared the performance of the pre-trained protein language model ESM (Rives et al., 2021), the pre-trained antibody language model AntiBERT (Leem et al., 2021), a pre-trained antibody language model EATLM by introducing antibody specific mechanisms, and a model trained from scratch (No Pretrain) on three antibody tasks with varying levels of specificity. The result is illustrated in Figure 1. Here, specificity refers to the antibody’s unique evolution processes distinct from that of protein to obtain functionality, such as the ability to bind antigen (The definition is discussed in detail in §3.1).
We can see that while ESM performs well in tasks that are less antibody specific, its performance decreases significantly in tasks that are more specific. Additionally, AntiBERT does not demonstrate a clear advantage over the non-pre-trained model in the high-specificity task. These results highlight the limitations of current pre-training language models for antibody-related studies. Using general PPLM representations directly may harm performance, and current pre-training strategies for PALMs may not fit the specific biological functions of antibodies. This emphasizes the need for a comprehensive model design guideline for various antibody tasks. Our main focus is to address the following questions:
(I) How well will pre-trained language models perform on antibody tasks with varying specificity? Addressing of the question is mainly hindered by two challenges: the lack of a reliable antibody-specific benchmark for performance evaluation and comprehensive studies of current PPLMs and PALMs. (II) Can incorporating biological mechanisms, specifically antibody-specific evolution, into the pre-training process provide additional benefits for antibody representation learning? This idea has been explored in several computational biology studies, which have demonstrated promising results in antibody-related tasks such as disease diagnosis and therapeutic antibody development (Yermanos et al., 2018; Miho et al., 2019). Then, it is interesting to know whether antibody representation learning can benefit from the incorporation of antibody-specific evolution information. (III) Are the pre-trained antibody representations useful in practical applications, such as drug discovery and immune process understanding? Antibodies are critical in drug development, and it is essential to determine whether pre-training representations can be beneficial for biologists to comprehend antibody functions or develop drugs.
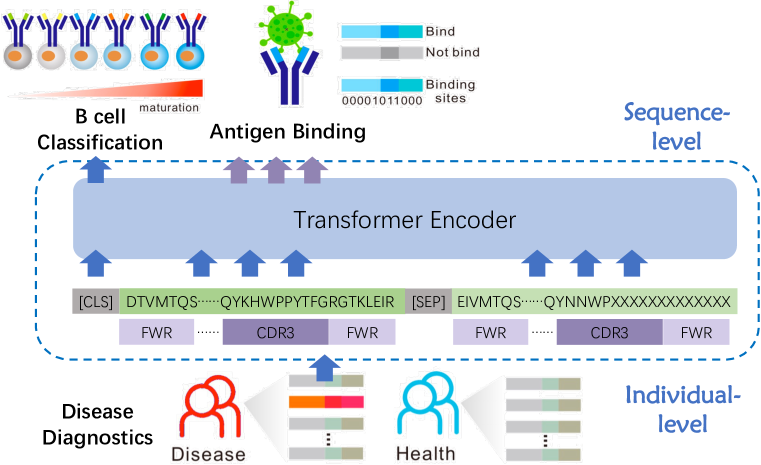
To investigate these questions, we first propose antibody study benchmark AnTibody Understanding Evaluation (ATUE). This is the first antibody benchmark with four real-world supervised tasks related to therapeutic antibody engineering, B cell analysis, and antibody discovery. These tasks cover a range of specificity levels to evaluate models on different aspects of antibody biological functions. Based on ATUE, we conduct empirical studies to investigate the representation ability of distinct pre-trained language models. To explore the impact of incorporating specific biological mechanisms in antibody pre-training, two objectives are introduced to tailor masked language modeling for evolution: (1) Ancestor germline prediction guides the model to discriminate the evolutionary relationship between antibody and ancestral sequences. (2) Mutation position prediction mimics hypermutation during the evolution. These methods are used to investigate the representation ability of antibody evolution-tailored language model. Finally, we take a close look at the SARS-CoV-2 antibody discovery to investigate the pre-trained representation under a real-world scenario.
We have three main contributions in this study:
-
•
We created the first comprehensive antibody benchmark called ATUE to help with antibody application studies, which includes four real-world supervised tasks ranging from low to high specificity. We also introduce two new objectives for antibody pretraining that incorporate antibody-specific evolutionary information.
-
•
We made key observations for providing guidelines for better antibody representation. Firstly, PPLMs perform well on antibody tasks that have a high relationship with structure, but they perform poorly on tasks with high antibody specificity. Secondly, in most cases, PALMs perform as well as or even better than PPLMs with less pre-training data. Thirdly, PALMs can be improved by incorporating the evolution process, but the evolution information from MSAs does not always benefit antibody tasks.
-
•
We identified 11 potential SARS-CoV-2 binders that have highly identical sequences to existing therapeutic antibodies that bind to the virus, which could accelerate real-world antibody discovery.
2 Related Work
Our work focuses on researching the effectiveness of protein and pre-trained antibody language models for antibody-specific tasks. Below we review the representative existing methods. We list the details in Table 1.
Pretrained Protein Language Models (PPLMs) There is an increasing interest in exploring large-scale language models using protein sequences (Rao et al., 2019; Madani et al., 2020; Meier et al., 2021; Chen et al., 2022). These models have been shown to achieve state-of-art capacity in predicting protein structure and function. ProtTrans (Elnaggar et al., 2021) and ESM-1b (Rives et al., 2021) take individual protein sequences as input and adopt Transformer language models for pre-training, demonstrating that self-supervision is a promising paradigm for protein secondary structure, contact, homology predictions, and function prediction. To extract evolutionary information from protein sequences, Rao et al. (2021) proposed the MSA-transformer/MSA-1b model utilizing multiple sequence alignment (MSA) instead of a single query sequence as input. This model is superior to ESM-1b for structure prediction, demonstrating evolution information can benefit protein representation learning. Despite the progress in the field, few studies reported their results on antibody tasks.
Pretrained Antibody Language Models (PALMs) Encouraged by the success of PLMs in protein representation learning, series work seeks to learn antibody representations based on sequences of antibodies. AntiBERTy (Ruffolo et al., 2021) proposed the first antibody-specific language model, exploring a Transformer trained on 558M natural antibody sequences in the OAS database. Olsen et al. (2022b) train two language models for antibodies: A heavy chain version Ablang-H and a light chain version Ablang-L. The study reported transfer learning results on restoring missing residues of antibody sequences, which is a task similar to pre-training objectives. AntiBERTa (Leem et al., 2021) train the antibody language model on OAS and finetuning AntiBERTa for paratope position prediction, achieving state-of-the-art performance. Recently, Li et al. (2022) proposed an antibody-specific language model and explored its performance in SARS-CoV-2 antigen binding, showing context-dependent representations of antibody sequences benefit binding prediction.
| Model | Category | Dataset | Evolution | Objective | Antibody Tasks |
| ESM-1 (Rives et al., 2021) | PPLM | UniRef50 (27M) | MLM | - | |
| MSA-1b (Rao et al., 2021) | PPLM | UniRef50 (26M MSAs) | ✓ | MLM | - |
| Ablang-H (Olsen et al., 2022b) | PALM | OAS (14M HC) | MLM | Reconstruction | |
| Ablang-L (Olsen et al., 2022b) | PALM | OAS (0.19M LC) | MLM | Reconstruction | |
| AntiBERTa (Leem et al., 2021) | PALM | OAS (72M) | MLM | Paratope Prediction | |
| EATLM | PALM | OAS (20M) | ✓ | MLM, AGP & MPP | ATUE |
3 Framework
In this section, we first give a brief introduction to the antibody and its specific evolution. Then we propose the first antibody-specific benchmark (ATUE) composed of four tasks with different specificities. Finally, we implement several PPLMs and PALMs baselines and design an evolution-aware PALM to incorporate the biological mechanism into the pre-training process.
3.1 Background
Antibody Antibodies are vital proteins generated by the immune system to remove harmful foreign pathogens in the human body. they can specifically bind to antigens on the pathogen and recognize it. Antibodies are composed of two identical heavy chains and two identical light chains and form a large Y-shaped structure. Two tips on it contain highly variable loops, called Complementarity Determining Regions (CDR), which function for antigen binding.
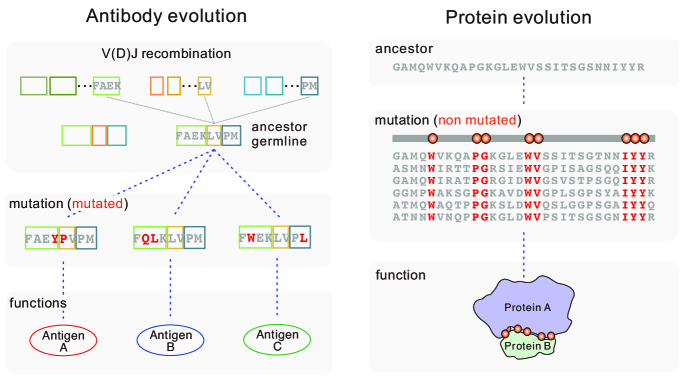
Antibody Specific Evolution Notably, the antibody evolution process is significantly different from that of proteins, providing a good opportunity for us to investigate the impact of general PPLMs on specific subdomains. To perform its protective function, the antibody sequence undergoes evolution selection to search for optimal patterns that can specifically recognize pathogens (Honjo & Habu, 1985). Deciphering the information stored in antibody sequences may benefit our understanding of disease and accelerate therapeutic antibody development (Greiff et al., 2020; Lu et al., 2018; Yermanos et al., 2018). During evolution, the random recombination of V/D/J-gene segments provides the initial diversity for the ancestor sequence (germline). Upon exposure to a pathogen, this sequence undergoes frequent sequence mutations to search for progeny antibody sequences with optimal binding specificity. In other words, gene recombination provides millions of germlines in the human body, and the germlines further mutate into a huge number of progeny antibodies. Thus, the ancestor relationship between an antibody and its corresponding germline as well as the mutation it undergoes together determine the unique biological functions. In brief, the evolutionary relationships between antibodies arise to gain new functions such as antigen binding. It is significantly different from that of proteins, which are to maintain certain functions across different organisms. We further illustrate this process in Figure 7 in §A.1.
Unsupervised Antibody Corpus To obtain the evolutionary information of antibody sequences, we utilize Observed Antibody Space (OAS), a database containing more than 1.5 billion natural antibody sequences (Kovaltsuk et al., 2018; Olsen et al., 2022a) The antibody sequences in the database have been precisely annotated with evolutionary and structural information, including the paired germline and CDR3 for each antibody. To pair the antibody with its germline used in the pretraining task, we used the annotated sequences provided in the OAS database. Further information on data processing can be found in §A.2.
3.2 AnTibody Understanding Evaluation (ATUE)
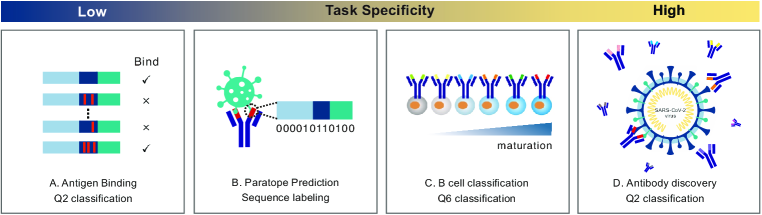
We provide four biologically relevant downstream prediction tasks to serve as antibody benchmarks, covering four major application aspects for antibodies in the real world: therapeutic antibody engineering, disease diagnostics, antibody discovery, and B cell maturation analysis. The antibody specificity of these tasks ranges from low to high, offering scaled tasks with subdomain specificity for pre-trained language model evaluation. Detailed information is listed in Figure 2. All data are publicly open and used under the right license. For each task, we focus on the following aspects and leave the details in Appendix (§A.3 and §A.4):
[Definition] The formal definition of the task and the understanding ability required.
[Impact] The importance of the task in the biological area.
[Dataset] The data source and size.
[Specificity] Antibody’s specific evolution characteristics are different from general proteins.
We use several classification metrics to evaluate the performance. Accuracy (ACC) calculates the ratio of correct predictions. Matthews Correlation Coefficient (MCC) is the coefficient between true and predicted values. F1 is the average weighted score of precision and recall. AUC is the area under the ROC curve, which shows the performance at all classification thresholds.
Antigen Binding Prediction is a binary sequence classification task to determine whether the CDR region of the antibody can bind to the specific antigen.
[Impact] A better understanding of the binding affinity between antibodies and antigens can accelerate the affinity optimization of therapeutic antibodies.
[Dataset] We collect the antigen binding data from Mason et al. (2021) and follow the training/validation/test split of 15,128/3,242/3,242.
[Specificity] Low. All the antibodies sequence in the dataset are derived from a single germline sequence indicating the task is not antibody-specific evolution-related.
Paratope Prediction It is to identify binding positions on the antibody sequence, which is a sequence labeling task to predict a 0/1 label for each residue of CDR fragments.
[Impact] The exploration of paratope (binding positions between antibody and antigen) can help to understand the binding mechanisms of therapeutic antibodies.
[Dataset] The paratope data is collected from Liberis et al. (2018) with 1,662 CDR segments on 277 antibodies.
[Specificity] This task is medium specificity related because only partial antibodies from the database are derived from evolution.
B Cell Maturation Analysis It is a 6-category classification task to distinguish the maturation stage of B cell antibody sequences. Each sequence belongs to one of {immature, transitional, mature, plasmacytes, memory IgD+, memory IgD-}. It requires the model to learn a representation sensitive to different maturation states.
[Impact] It benefits the understanding of the mechanism during immune evolution, which is a critical biological process in the immune system affecting the function and antigen specificity of antibodies (Ghraichy et al., 2021; Meffre et al., 2000).
[Dataset] We collect 88,094 sequences from Mroczek et al. (2014) with 6 maturation stages.
[Specificity] High. Antibody evolution is highly coupled with B cell maturation (Meffre et al., 2000).
Antibody Discovery The task is a binary sequence classification task to distinguish which antibody is directly responsible for SARS-CoV-2 binding. The task is highly challenging from two aspects: (1) Less than 1% of antibodies from SARS-CoV-2 patients are directly responsible for virus binding. (2) It is hard to get a reliable sequence-level classifier using unreliable and noisy individual-level labels.
[Impact] Antibody discovery from B cell repertoire has been widely recognized as a important approach to accelerate antibody discovery for diverse antigens (Weiner, 2015; Pedrioli & Oxenius, 2021), and achieved great success for SARS-CoV-2 antibody discovery (Kovaltsuk et al., 2018; Cao et al., 2020; Shiakolas et al., 2022).
[Dataset] We collected antibody sequences from 133 SARS-CoV-2 patients and 87 health persons from OAS and followed the processing pipeline of Kim et al. (2021). Inspired Zaslavsky et al. (2022), we match the high-ranked sequences with the sequences in the CoV-AbDab (Raybould et al., 2021) database, which have been proved to bind SARS-CoV-2 using wet-lab experiments.
[Specificity] High. It is widely reported antibodies derived from the same disease such as SARS-CoV-2 share strong convergent germline signals (Galson et al., 2020).
3.3 Experiment Setup
Based on the antibody benchmark ATUE, we evaluate the performance of current pertaining language models in different specificity tasks. Furthermore, to investigate the benefit of introducing the biological mechanism, we incorporate evolution information as the extra pretraining objectives for PALMs and propose EATLM. The detailed description of the objective and the implementation can be found in §A.5
Current Pre-trained language models Existing antibody and protein language models are summarized in Table 1. Since the code and pre-training data of AntiBERTa are not released, we train a BERT model named AntiBERT on the full OAS database following the same setting as the original study. MSA-1b (Rao et al., 2021) takes protein-specific evolutionary sequences (Multiple Sequence Alignment, MSA) as the input. Because it is hard to align sequences between antibodies due to the diversity of CDR3, we take the germline and create pseudo-MSAs with depth 2. We add a linear layer on top of the language models and finetune the whole model on the downstream tasks.
Evolution-aware antibody pretraining method To incorporate the biological mechanism into the pre-training, we propose a model with evolution information: Antibody EvoluTion-aware pretraining Language Model. The antibody can be represented as and the germline of the individual antibody can be represented as . Typically, PALMs are trained with basic masked language modeling (MLM). Based on it, we design another two pre-training objectives to simulate the biological mechanism of antibody evolution. The evolutionary relationship between the antibody and its germline includes two folds: (i) Whether the antibody and the germline have an evolutionary relationship. (ii) How to mutate residues from the germline to get the specific antibody. Two evolution-related objectives are introduced to solve the above questions: Ancestor Germline Prediction (AGP) and Mutation Position Prediction (MPP). For ancestor germline prediction, we substitute the paired germline with random germline in the batch via a probability . The model is made to distinguish the ancestor germline of the antibody by capturing the shared features. To predict mutation position, for each token in the germline , the objective is to predict a 0/1 label for each token to indicate whether this token has been mutated. For the antibody sequence , we mask the mutation position and predict these tokens.
Hyper-parameters We use the base Transformer architecture (Vaswani et al., 2017) with 12 layers, 12 heads, and 768 hidden states. For each task in ATUE, we finetune the model with supervised data. We follow the standard split of Antigen Binding Prediction. For other tasks that do not provide a standard split, we use a 10-fold cross-validation. Since our pre-training model learns the representation of the antibody sequence, we expand the CDR fragment to the full antibody by searching the biological database for therapeutic antibody engineering tasks. We also use the same Transformer architecture to train from scratch for each downstream task. This model is indicated as non-pretrain since it is not pre-trained on a protein/antibody database.
Reproduction We conduct 10-fold validation on paratope prediction, B cell maturation analysis, and antibody discovery. For antigen binding prediction, we conduct three repetitive experiments with different random seeds. We report the average results and the standard derivation.
4 Results and Analysis
In this section, we present the experimental results and analysis for the representation capability of existing PPLMs, PALMs, and the EATLM method with evolutionary incorporation, using ATUE benchmark. Additionally, we summarize our observations aiming to address the problems highlighted in the introduction.
4.1 Main Results
Antigen binding
We evaluate the performance PLMs models for antibody binding and paratope prediction, which are less antibody specific. The results in Table 2 indicate that PPLMs and PALMs perform similarly on these tasks, suggesting that PALMs can learn comparable general protein representations to PPLMs. Among different PALMs, Ablang-H outperforms Ablang-L and AntiBERT. It indicates that separate training for heavy and light chain sequences is beneficial for these tasks. Moreover, the introduction of AGP and MPP provides improvement over AUC and F1 metrics.
| Antigen Binding (Low) | Paratope (Medium) | Cell (High) | |||||
| AUC | F1 | MCC | AUC | F1 | MCC | ACC | |
| non-pretrain | 0.8580.014 | 0.5840.330 | 0.4320.183 | 0.8450.014 | 0.6050.033 | 0.4630.037 | 0.554 0.042 |
| ESM-1 | 0.9170.001 | 0.8540.002 | 0.6890.002 | 0.8860.009 | 0.6690.024 | 0.5470.026 | 0.503 0.031 |
| MSA-1b | 0.9210.001 | 0.8570.004 | 0.6890.014 | 0.8870.009 | 0.6790.019 | 0.5570.025 | 0.416 0.050 |
| Ablang-H | 0.9180.001 | 0.8610.003 | 0.7040.010 | 0.8780.009 | 0.6740.018 | 0.5460.023 | 0.570 0.010 |
| Ablang-L | 0.9170.002 | 0.8560.001 | 0.6820.001 | 0.8820.010 | 0.6800.018 | 0.5530.023 | 0.546 0.008 |
| AntiBERT | 0.9180.003 | 0.8430.009 | 0.6780.008 | 0.8790.011 | 0.6900.020 | 0.5590.026 | 0.565 0.028 |
| EATLM | 0.9220.004 | 0.8620.004 | 0.6990.010 | 0.8870.008 | 0.6980.017 | 0.5750.024 | 0.581 0.005 |
| EATLM w/o AGP | 0.9200.003 | 0.8550.000 | 0.6970.008 | 0.8830.011 | 0.6760.021 | 0.5520.027 | 0.559 0.012 |
| EATLM w/o MPP | 0.9230.001 | 0.8550.002 | 0.6870.005 | 0.8830.011 | 0.6910.022 | 0.5660.030 | 0.563 0.010 |
| EATLM w/o AGP & MPP | 0.9180.001 | 0.8450.005 | 0.6810.005 | 0.8800.009 | 0.6740.018 | 0.5520.023 | 0.559 0.009 |
Paratope prediction
The results presented in Table 2 demonstrate that for paratope prediction, both PPLMs and PALMs can significantly boost the prediction accuracy over the model with pre-training. However, PALMs do not exhibit a significant advantage over PPLMs. EATLM outperforms other models, particularly in terms of F1 and MCC, while other models exhibit high recall and low precision, indicating that they tend to predict more residues as binding sites. With the incorporation of mutation residue prediction, EATLM can focus on the specific mutated positions adapted to bind with antigen. Among the two PPLMs, MSA-1b outperforms ESM-1 on F1 and MCC, which benefits from the structure information learning from MSAs.
B Cell Analysis
In this task, we investigate the ability of different pre-trained language models to distinguish between various B cell mature states during evolution. The findings, as demonstrated in Table 2, indicate that PPLMs are not effective in discerning minor differences between B cell sequences, resulting in mediocre results. Both ESM-1 and MSA-1b perform significantly worse than randomly initialized models. MSA-1b, in particular, performs poorly among all pre-trained language models, implying that representations that excel in protein structure prediction may be detrimental to antibody-specific tasks. Conversely, all PALMs show promising results for the task. This may be due to the fact that the general protein has little correlation with the specific antibody mature process and cannot capture this feature during protein pretraining. Our EATLM significantly outperforms the other PALMs. This is because our model can effectively capture the evolution feature and better distinguish between B cells at different stages of maturation by explicitly modeling the biological mechanism.
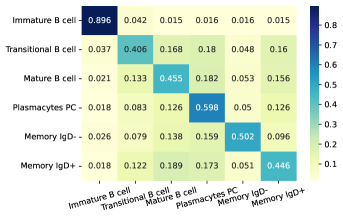
We conduct further analysis to figure out whether our EATLM successfully captures sequence characteristics during the evolutionary process. We explore the probabilities of predicting antibodies in class to class . The results shown in Figure 3 reveal EATLM can easily classify the immature B cell with an accuracy of 0.9. It is consistent with the biological study that CDR3 sequence length in immature B cells is significantly shorter than that of the other mature B cells (Ghraichy et al., 2021). From the diagonal, we can figure out that our model tends to mistake the B cell sequences with their previous or post-evolutionary stage, consistent with the biological process.
Antibody Discovery
We investigated the potential of PPLMs and PALMs in aiding the discovery of antigen-specific antibodies for real-world problems. To achieve this, we followed a two-step process similar to Zaslavsky et al. (2022). Firstly, we created a sequence classifier to differentiate SARS-CoV-2 antibodies using noisy individual-level labels. Secondly, we compared the highly-ranked sequences with true binding sequences in the CoV-AbDab (Raybould et al., 2021) database to determine if there are similarities. We used a 90% sequence identity threshold to determine the likelihood of biological functionality similar to the existing binders. The experimental design for this is outlined in §A.7.
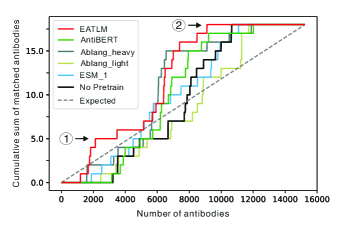
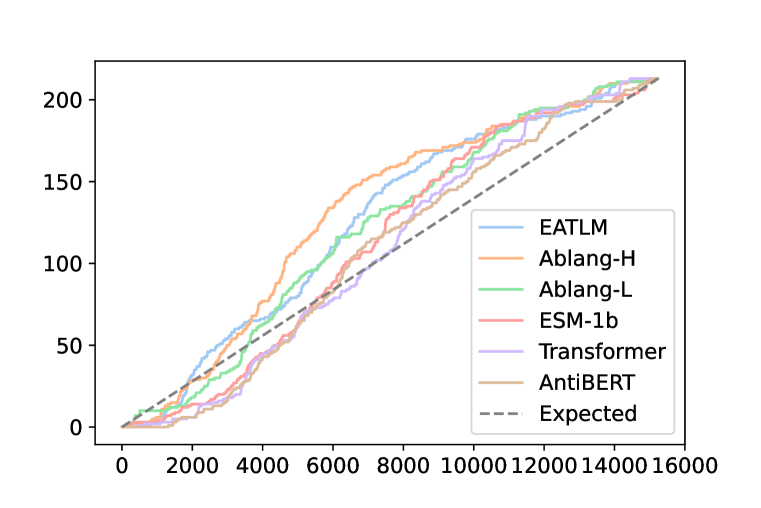
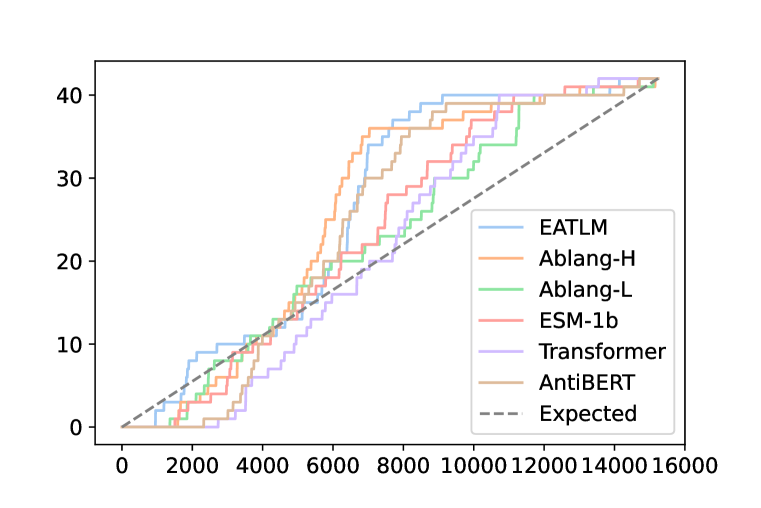
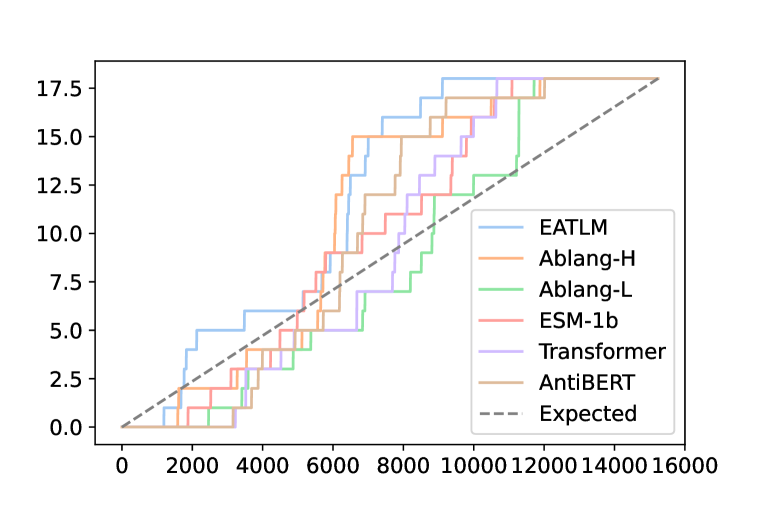
Figure 4 shows the cumulative sum of matched sequences in the order of predicted probabilities by different pre-trained language models for the SARS-CoV-2 specific antibody discovery task. We can observe that PALMs outperform PPLMs in identifying potential binders, as the sequences predicted with high probability by PALMs match better with the existing binders. Moreover, among PALMs, EATLM significantly outperforms other models, with the red line indicating its performance. Initially, EATLM is the quickest method to find potential binders, but it loses to Ablang-H, and eventually overtakes again and converges. This suggests that EATLM is the most effective method for identifying all potential binders in this dataset.
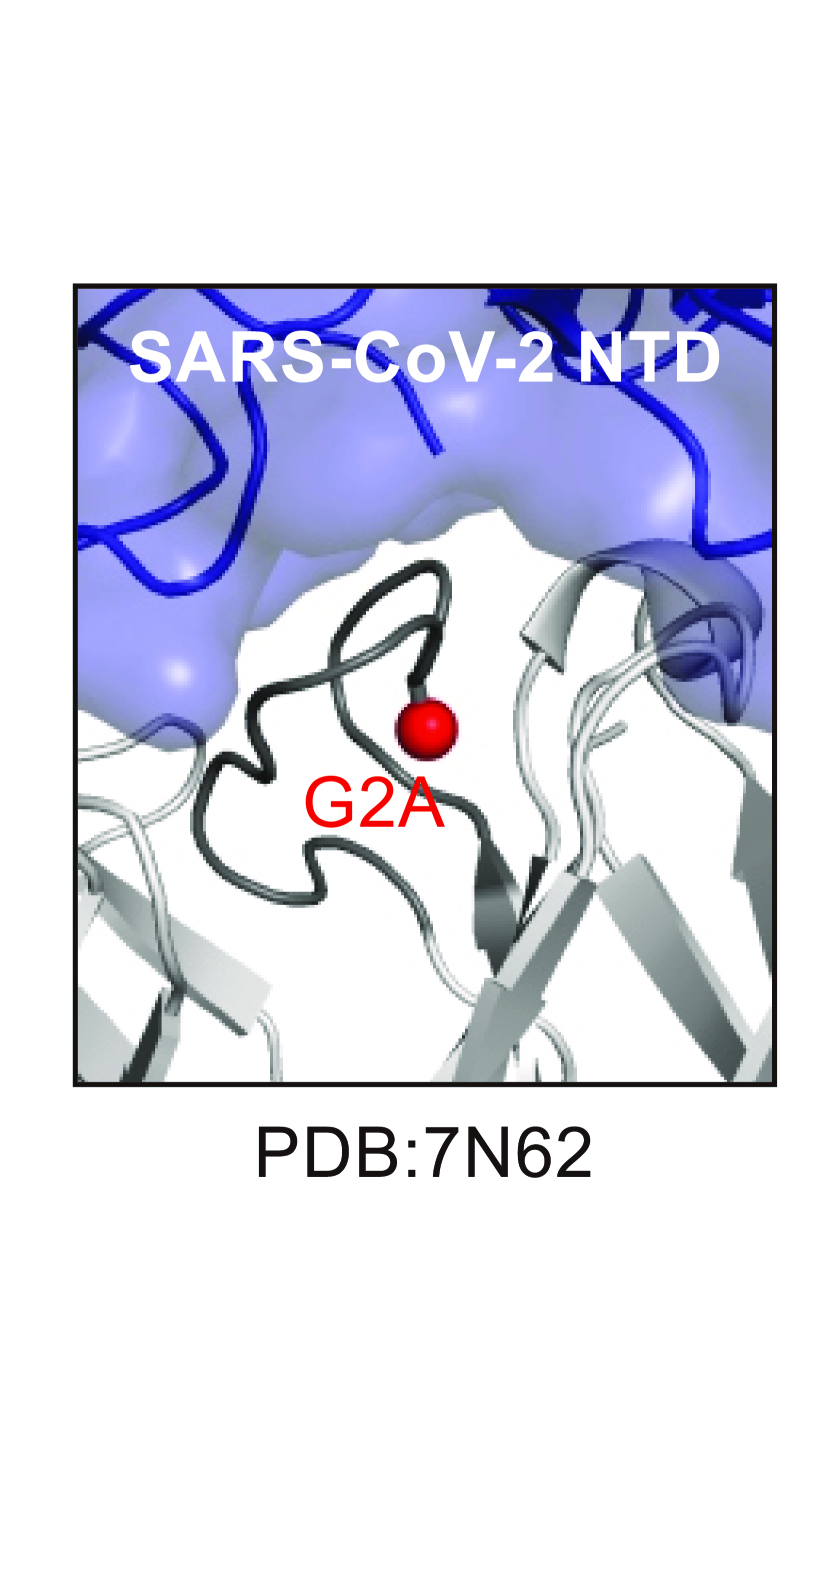
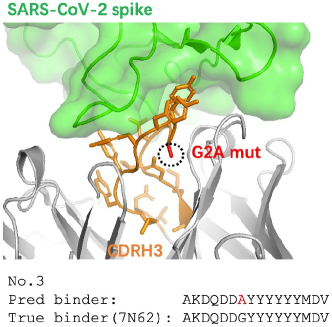
Furthermore, we list 11 potential binder sequences discovered by EATLM in Table 4. Without supervised labels, EATLM gives a high probability of 2 SARS-CoV-2 existing binding antibodies. Besides, EATLM suggests 9 potential sequences with high CDR-H3 sequence identity, indicating the potential for diverse-epitope antibody discovery and selection. These results demonstrate the potential of EATLM in therapeutic antibody discovery.
To validate whether the antibody sequences with 90% sequence identity can indeed bind the same target, we investigate the 3D structure of the true binding antibody. Table 4 shows only one single residue difference between the predicted binder and the existing binder, suggesting the predicted binders are highly possible to interact with SARS-CoV-2.
| No | Predicted Binder | Existing Binder | Epitope | Identity |
|---|---|---|---|---|
| 1 | AREGIVGATTGFDY | AREGIVGATTGFDY | spike | 1.000 |
| 2 | ARDLGGYFDY | ARDLGGYFDY | RBD | 1.000 |
| 3 | AKDQDDAYYYYYYMDV | AKDQDDGYYYYYYMDV | NTD | 0.938 |
| 4 | ASYYYDSSGYHYGMDV | ASYYYDSSGYYYGMDV | RBD | 0.938 |
| 5 | ARRGLGLYYYGMDV | ARRGDGLYYYGMDV | S2 | 0.929 |
| 6 | ARAFRGSYYYGMDV | ARATRGSYYYGMDV | S2 | 0.929 |
| 7 | ARLSGSSWYFDY | ARLSGSSWDFDY | spike | 0.917 |
| 8 | ARLGSSSWYFDY | ARVGSSSWYFDY | spike | 0.917 |
| 9 | ARGWLRGYFDL | ARRGWLRGYFDL | RBD | 0.909 |
| 10 | ARDWGELYFDY | ARDWGEYYFDY | RBD | 0.909 |
| 11 | ARDLGGVFDY | ARDLGGYFDY | RBD | 0.900 |
4.2 How does evolution pretraining task influence the representation?
To comprehend the reasons for the better performance of EATLM on antibody-related tasks, we conduct the analysis of the pre-trained representations. The objective of this analysis is to evaluate the effectiveness of the evolution-aware pre-training strategies from two perspectives: (1) Does the pre-trained representation of antibodies reflect their ancestor relationship? (2) Does the specificity of antibodies get captured by the evolution objective?
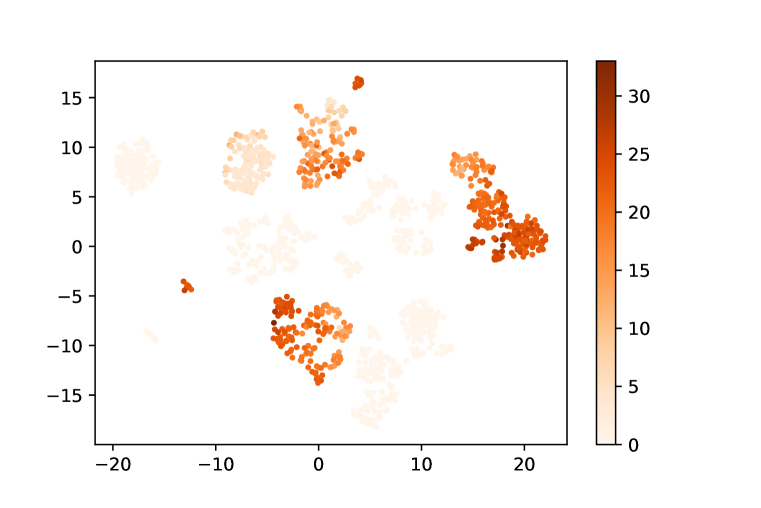
Ancestor Gerlime Visualization
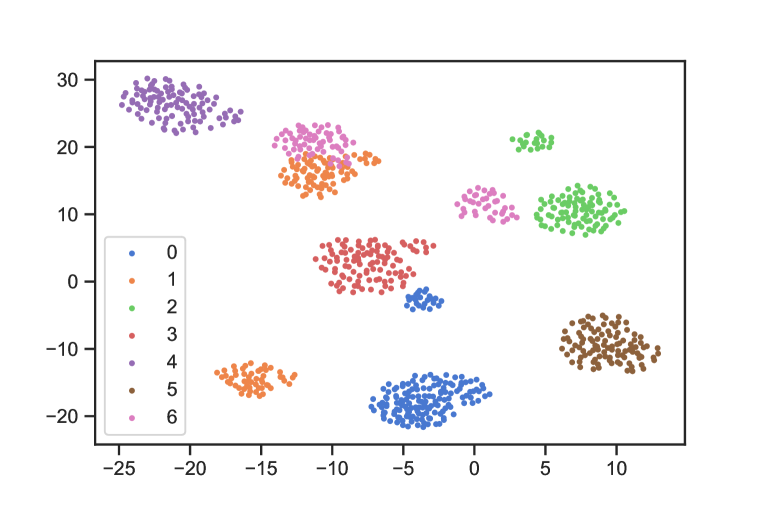
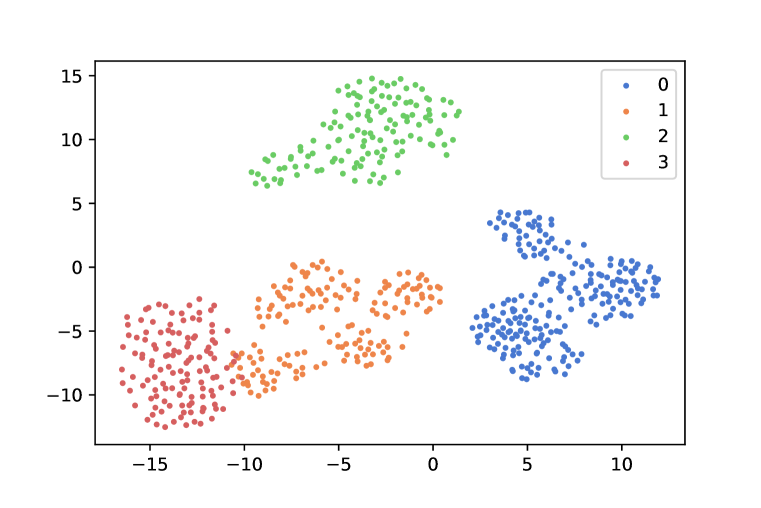
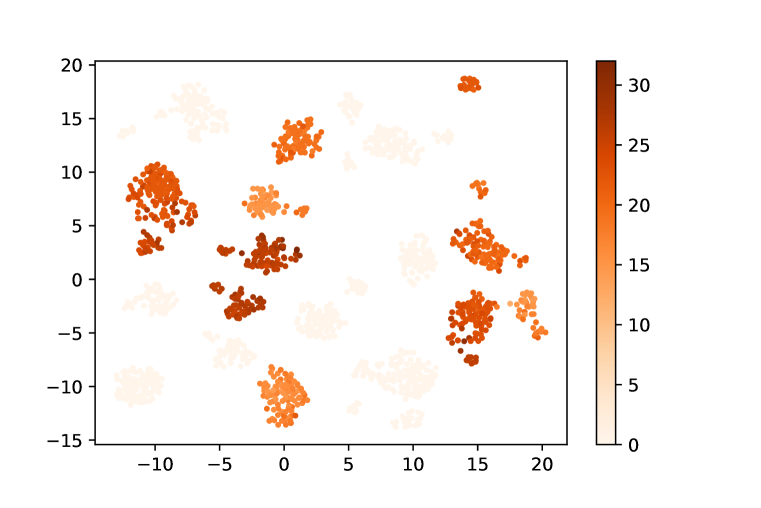
We perform UMAP visualization analyses in Figure 5. First, we observe that antibodies evolved from the same germline are nicely clustered together (Figure 5(a) and 5(b)), indicating the learned embedding is encoded with germline information. Besides, sequences with similar scales of evolutionary distance tend to cluster together, and a clear gradation of evolutionary distance can be observed in Figure 5(c) and 5(d). The visualization provides a sanity check for the ability of EATLM to extract the sequence information of antibodies.
Accuracy of Mutation Position
Based on the specific evolution process described in §3.1, we can find the mutation during the evolution process bring specificity to the antibody. Thus, we explore the model’s ability to predict mutated residue from the masked token, which can reflect the specificity feature the model captures. We find that although AntiBERT can predict with an accuracy of 0.889 on all positions, it fails on mutation positions with a 0.031 accuracy. In contrast, EATLM achieves an accuracy of 0.443 on mutation position, which indicates that the model captures the specificity information. Note that during the MPP training, we mask the mutation position on antibody sequences, which are different from its germline. Thus, the model cannot get the mutated residue from the germline directly. The only way is to learn the underlying mutation rules. The full results are shown in Table 8 in Appendix.
›
4.3 Key Observations
The performance of pre-trained language models is highly dependent on the specificity of the task. In tasks with low antibody-specificity, PPLMs perform similarly to PALMs, indicating that using general protein representations from PPLMs is an effective way to transfer learning in these tasks. On medium specificity tasks such as paratope prediction, PALMs show their advantage and outperform PPLMs. However, for tasks with high specificity, PPLMs have significantly lower performance, suggesting that general pre-trained protein models are insufficient for antibody-specific representation learning. Additionally, incorporating protein evolution information does not always benefit antibody tasks, especially those that require antibody evolution information, as shown by the 20% decrease in performance observed with MSA-1b compared to the model without pre-training. This finding is consistent with the biological understanding that the mechanism of antibody evolution is significantly different from that of proteins.
Incorporation of biological evolution mechanism into PALM generally benefits antibody prediction tasks. The inclusion of evolution-related training objectives assists in identifying mutation positions on antibodies, which is a distinguishing feature from germline. Notably, the performance increase of EATLM in comparison to other PALMs is linked with the level of task specificity. The ablation study showed removing the evolution-related pretraining objectives leads to decreased performance, confirming their contribution to the prediction task. Further research in this direction is promising and could offer more in-depth insights.
Antibody pre-trained representations are helpful for real-world drug discovery. By utilizing the language model, we predict the likelihood of each antibody binding with SARS-CoV-2. Despite lacking precise sequence-level labels, we successfully identify 11 promising antibody binders.
5 Conclusions and Limitations
In this paper, we conduct a detailed investigation into the effects of pre-trained protein and antibody language models on various antibody tasks. To facilitate research in the antibody and machine learning fields, we provide ATUE consisting of four important antibody tasks from four different biological categories with varying levels of antibody specificity.
However, there are certain constraints to our research. Firstly, due to the scarcity of data, the diversity of tasks in our ATUE is limited. As more data becomes available, we anticipate expanding our benchmark to include a greater range of diseases and larger data sets. Additionally, we did not examine any 3D structure information during antibody pre-training. As antibody structures offer more information than just sequences, such as geometry, incorporating structural information in future studies may lead to improved results.
Ethic Statement
This research involving the use of pre-existing data and computational methods did not involve any human or animal subjects, and therefore, no ethical approval was required. The authors followed all applicable ethical standards and guidelines for data analysis and reporting. All data used in this study were obtained from publicly available sources, and proper citation and attribution have been given. The authors have made efforts to ensure that the research presented in this paper does not infringe upon any existing copyrights or intellectual property rights.
Acknowledgement
We thank members of ByteDance Research for discussion, Zaixiang Zheng and Yi Zhou for useful writing suggestions. Hao Zhou is supported by Vanke Special Fund for Public Health and Health Discipline Development, Tsinghua University (NO.20221080053), Guoqiang Research Institute General Project, Tsinghua University (No. 2021GQG1012);
References
- Cao et al. (2020) Yunlong Cao, Bin Su, Xianghua Guo, Wenjie Sun, Yongqiang Deng, Linlin Bao, Qinyu Zhu, Xu Zhang, Yinghui Zheng, Chenyang Geng, et al. Potent neutralizing antibodies against sars-cov-2 identified by high-throughput single-cell sequencing of convalescent patients’ b cells. Cell, 182(1):73–84, 2020.
- Chen et al. (2022) Can Chen, Jingbo Zhou, Fan Wang, Xue Liu, and Dejing Dou. Structure-aware protein self-supervised learning. arXiv preprint arXiv:2204.04213, 2022.
- Elnaggar et al. (2021) Ahmed Elnaggar, Michael Heinzinger, Christian Dallago, Ghalia Rehawi, Yu Wang, Llion Jones, Tom Gibbs, Tamas Feher, Christoph Angerer, Martin Steinegger, et al. Prottrans: Towards cracking the language of lifes code through self-supervised deep learning and high performance computing. IEEE Transactions on Pattern Analysis and Machine Intelligence, 2021.
- Galson et al. (2020) Jacob D Galson, Sebastian Schaetzle, Rachael JM Bashford-Rogers, Matthew IJ Raybould, Aleksandr Kovaltsuk, Gavin J Kilpatrick, Ralph Minter, Donna K Finch, Jorge Dias, Louisa K James, et al. Deep sequencing of b cell receptor repertoires from covid-19 patients reveals strong convergent immune signatures. Frontiers in immunology, 11:605170, 2020.
- Ghraichy et al. (2021) Marie Ghraichy, Valentin von Niederhäusern, Aleksandr Kovaltsuk, Jacob D Galson, Charlotte M Deane, and Johannes Trück. Different b cell subpopulations show distinct patterns in their igh repertoire metrics. ELife, 10:e73111, 2021.
- Greiff et al. (2020) Victor Greiff, Gur Yaari, and Lindsay G Cowell. Mining adaptive immune receptor repertoires for biological and clinical information using machine learning. Current Opinion in Systems Biology, 24:109–119, 2020.
- Gupta et al. (2017) Namita T Gupta, Kristofor D Adams, Adrian W Briggs, Sonia C Timberlake, Francois Vigneault, and Steven H Kleinstein. Hierarchical clustering can identify b cell clones with high confidence in ig repertoire sequencing data. The Journal of Immunology, 198(6):2489–2499, 2017.
- Honjo & Habu (1985) Tasuku Honjo and Sonoko Habu. Origin of immune diversity: genetic variation and selection. Annual review of biochemistry, 54(1):803–830, 1985.
- Jumper et al. (2021) John Jumper, Richard Evans, Alexander Pritzel, Tim Green, Michael Figurnov, Olaf Ronneberger, Kathryn Tunyasuvunakool, Russ Bates, Augustin Žídek, Anna Potapenko, et al. Highly accurate protein structure prediction with alphafold. Nature, 596(7873):583–589, 2021.
- Kim et al. (2021) Inyoung Kim, Sang Yoon Byun, Sangyeup Kim, Sangyoon Choi, Jinsung Noh, Junho Chung, and Byung Gee Kim. Analysis of b-cell receptor repertoires in covid-19 patients using deep embedded representations of protein sequences. bioRxiv, 2021.
- Kingma & Ba (2015) Diederik P. Kingma and Jimmy Ba. Adam: A method for stochastic optimization. In Yoshua Bengio and Yann LeCun (eds.), Proc. of ICLR, 2015.
- Kovaltsuk et al. (2018) Aleksandr Kovaltsuk, Jinwoo Leem, Sebastian Kelm, James Snowden, Charlotte M Deane, and Konrad Krawczyk. Observed antibody space: a resource for data mining next-generation sequencing of antibody repertoires. The Journal of Immunology, 201(8):2502–2509, 2018.
- Leem et al. (2021) Jinwoo Leem, Laura S Mitchell, James HR Farmery, Justin Barton, and Jacob D Galson. Deciphering the language of antibodies using self-supervised learning. bioRxiv, 2021.
- Leem et al. (2022) Jinwoo Leem, Laura S Mitchell, James HR Farmery, Justin Barton, and Jacob D Galson. Deciphering the language of antibodies using self-supervised learning. Patterns, pp. 100513, 2022.
- Lefranc et al. (1999) Marie-Paule Lefranc, Véronique Giudicelli, Chantal Ginestoux, Julia Bodmer, Werner Müller, Ronald Bontrop, Marc Lemaitre, Ansar Malik, Valérie Barbié, and Denys Chaume. Imgt, the international immunogenetics database. Nucleic acids research, 27(1):209–212, 1999.
- Li et al. (2022) Lin Li, Esther Gupta, John Spaeth, Leslie Shing, Tristan Bepler, and Rajmonda Sulo Caceres. Antibody representation learning for drug discovery. arXiv preprint arXiv:2210.02881, 2022.
- Liberis et al. (2018) Edgar Liberis, Petar Veličković, Pietro Sormanni, Michele Vendruscolo, and Pietro Liò. Parapred: antibody paratope prediction using convolutional and recurrent neural networks. Bioinformatics, 34(17):2944–2950, 2018.
- Lu et al. (2018) Lenette L Lu, Todd J Suscovich, Sarah M Fortune, and Galit Alter. Beyond binding: antibody effector functions in infectious diseases. Nature Reviews Immunology, 18(1):46–61, 2018.
- Madani et al. (2020) Ali Madani, Bryan McCann, Nikhil Naik, Nitish Shirish Keskar, Namrata Anand, Raphael R Eguchi, Po-Ssu Huang, and Richard Socher. Progen: Language modeling for protein generation. arXiv preprint arXiv:2004.03497, 2020.
- Mason et al. (2021) Derek M Mason, Simon Friedensohn, Cédric R Weber, Christian Jordi, Bastian Wagner, Simon M Meng, Roy A Ehling, Lucia Bonati, Jan Dahinden, Pablo Gainza, et al. Optimization of therapeutic antibodies by predicting antigen specificity from antibody sequence via deep learning. Nature Biomedical Engineering, 5(6):600–612, 2021.
- Meffre et al. (2000) Eric Meffre, Rafael Casellas, and Michel C Nussenzweig. Antibody regulation of b cell development. Nature immunology, 1(5):379–385, 2000.
- Meier et al. (2021) Joshua Meier, Roshan Rao, Robert Verkuil, Jason Liu, Tom Sercu, and Alex Rives. Language models enable zero-shot prediction of the effects of mutations on protein function. Advances in Neural Information Processing Systems, 34, 2021.
- Miho et al. (2019) Enkelejda Miho, Rok Roškar, Victor Greiff, and Sai T Reddy. Large-scale network analysis reveals the sequence space architecture of antibody repertoires. Nature communications, 10(1):1–11, 2019.
- Montague et al. (2021) Zachary Montague, Huibin Lv, Jakub Otwinowski, William S DeWitt, Giulio Isacchini, Garrick K Yip, Wilson W Ng, Owen Tak-Yin Tsang, Meng Yuan, Hejun Liu, et al. Dynamics of b cell repertoires and emergence of cross-reactive responses in patients with different severities of covid-19. Cell Reports, 35(8):109173, 2021.
- Mroczek et al. (2014) Eva Szymanska Mroczek, Gregory C Ippolito, Tobias Rogosch, Kam Hon Hoi, Tracy A Hwangpo, Marsha G Brand, Yingxin Zhuang, Cun Ren Liu, David A Schneider, Michael Zemlin, et al. Differences in the composition of the human antibody repertoire by b cell subsets in the blood. Frontiers in immunology, 5:96, 2014.
- Olsen et al. (2022a) Tobias H Olsen, Fergus Boyles, and Charlotte M Deane. Observed antibody space: A diverse database of cleaned, annotated, and translated unpaired and paired antibody sequences. Protein Science, 31(1):141–146, 2022a.
- Olsen et al. (2022b) Tobias H Olsen, Iain H Moal, and Charlotte M Deane. Ablang: An antibody language model for completing antibody sequences. bioRxiv, 2022b.
- Pedrioli & Oxenius (2021) Alessandro Pedrioli and Annette Oxenius. Single b cell technologies for monoclonal antibody discovery. Trends in immunology, 42(12):1143–1158, 2021.
- Rao et al. (2019) Roshan Rao, Nicholas Bhattacharya, Neil Thomas, Yan Duan, Peter Chen, John Canny, Pieter Abbeel, and Yun Song. Evaluating protein transfer learning with tape. Advances in neural information processing systems, 32, 2019.
- Rao et al. (2021) Roshan M Rao, Jason Liu, Robert Verkuil, Joshua Meier, John Canny, Pieter Abbeel, Tom Sercu, and Alexander Rives. Msa transformer. In International Conference on Machine Learning, pp. 8844–8856. PMLR, 2021.
- Raybould et al. (2021) Matthew IJ Raybould, Aleksandr Kovaltsuk, Claire Marks, and Charlotte M Deane. Cov-abdab: the coronavirus antibody database. Bioinformatics, 37(5):734–735, 2021.
- Rives et al. (2021) Alexander Rives, Joshua Meier, Tom Sercu, Siddharth Goyal, Zeming Lin, Jason Liu, Demi Guo, Myle Ott, C Lawrence Zitnick, Jerry Ma, et al. Biological structure and function emerge from scaling unsupervised learning to 250 million protein sequences. Proceedings of the National Academy of Sciences, 118(15), 2021.
- Roskin et al. (2020) Krishna M Roskin, Katherine JL Jackson, Ji-Yeun Lee, Ramona A Hoh, Shilpa A Joshi, Kwan-Ki Hwang, Mattia Bonsignori, Isabela Pedroza-Pacheco, Hua-Xin Liao, M Anthony Moody, et al. Aberrant b cell repertoire selection associated with hiv neutralizing antibody breadth. Nature immunology, 21(2):199–209, 2020.
- Ruffolo et al. (2021) Jeffrey A Ruffolo, Jeffrey J Gray, and Jeremias Sulam. Deciphering antibody affinity maturation with language models and weakly supervised learning. arXiv preprint arXiv:2112.07782, 2021.
- Shiakolas et al. (2022) Andrea R Shiakolas, Kevin J Kramer, Nicole V Johnson, Steven C Wall, Naveenchandra Suryadevara, Daniel Wrapp, Sivakumar Periasamy, Kelsey A Pilewski, Nagarajan Raju, Rachel Nargi, et al. Efficient discovery of sars-cov-2-neutralizing antibodies via b cell receptor sequencing and ligand blocking. Nature Biotechnology, pp. 1–6, 2022.
- Steinegger & Söding (2018) Martin Steinegger and Johannes Söding. Clustering huge protein sequence sets in linear time. Nature communications, 9(1):1–8, 2018.
- Vaswani et al. (2017) Ashish Vaswani, Noam Shazeer, Niki Parmar, Jakob Uszkoreit, Llion Jones, Aidan N. Gomez, Lukasz Kaiser, and Illia Polosukhin. Attention is all you need. In Isabelle Guyon, Ulrike von Luxburg, Samy Bengio, Hanna M. Wallach, Rob Fergus, S. V. N. Vishwanathan, and Roman Garnett (eds.), Proc. of NeurIPS, pp. 5998–6008, 2017.
- Wang et al. (2022) Yiquan Wang, Meng Yuan, Huibin Lv, Jian Peng, Ian A Wilson, and Nicholas C Wu. A large-scale systematic survey reveals recurring molecular features of public antibody responses to sars-cov-2. Immunity, 2022.
- Weiner (2015) George J Weiner. Building better monoclonal antibody-based therapeutics. Nature Reviews Cancer, 15(6):361–370, 2015.
- Widrich et al. (2020) Michael Widrich, Bernhard Schäfl, Milena Pavlović, Hubert Ramsauer, Lukas Gruber, Markus Holzleitner, Johannes Brandstetter, Geir Kjetil Sandve, Victor Greiff, Sepp Hochreiter, et al. Modern hopfield networks and attention for immune repertoire classification. Advances in Neural Information Processing Systems, 33:18832–18845, 2020.
- Ye et al. (2013) Jian Ye, Ning Ma, Thomas L Madden, and James M Ostell. Igblast: an immunoglobulin variable domain sequence analysis tool. Nucleic acids research, 41(W1):W34–W40, 2013.
- Yermanos et al. (2018) Alexander Dimitri Yermanos, Andreas Kevin Dounas, Tanja Stadler, Annette Oxenius, and Sai T Reddy. Tracing antibody repertoire evolution by systems phylogeny. Frontiers in immunology, 9:2149, 2018.
- Zaslavsky et al. (2022) Maxim E Zaslavsky, Nikhil Ram-Mohan, Joel M Guthridge, Joan T Merrill, Jason D Goldman, Ji-Yeun Lee, Krishna M Roskin, Charlotte Cunningham-Rundles, M Anthony Moody, Barton F Haynes, et al. Disease diagnostics using machine learning of immune receptors. bioRxiv, 2022.
- Zhu et al. (2022) Feng Zhu, Thomas Althaus, Chee Wah Tan, Alizée Costantini, Wan Ni Chia, Nguyen Van Vinh Chau, Giada Mattiuzzo, Nicola J Rose, Eric Voiglio, Lin-Fa Wang, et al. Who international standard for sars-cov-2 antibodies to determine markers of protection. The Lancet Microbe, 3(2):e81–e82, 2022.
Appendix A Appendix
A.1 Antibody Specific Evolution
Antibodies, composed of two identical heavy chains and two identical light chains, form a large Y-shaped structure, where the two tips are responsible for pathogens binding. Antibody evolution, described by sequence-sequence relationships between ancestor and progeny antibodies, reflects antibodies’ key antigen-binding function (Honjo & Habu, 1985). During antibody evolution (Figure 7), the initial diversity is encoded into the ancestor sequence through randomly recombination of V-, D- and J-gene segments. Upon exposure to a pathogen, the sequence undergoes frequent sequence mutations to search for progeny sequences with optimal binding specificity. Sequence evolution analysis has been employed by many computational biology studies and shows promising results in antibody-related tasks, such as disease diagnosis and therapeutic antibody development (Yermanos et al., 2018; Miho et al., 2019).
Importantly, antibody evolution is significantly different from that of proteins. Antibodies only contain hundreds of thousands ancestor sequences so-called germline. To bind dozens of millions of diverse antigens, antibodies need to mutate from the ancestor sequences to gain new functions (Figure 7). Therefore, the non-conserved amino acids (mutated ones) plays important roles for structure and function. On the contrary, the conserved amino acids (not mutated) in proteins determine structure and function. During protein evolution, evolutionary pressure to maintain protein structure and functions leads to the conservation or co-evolution of residues located in structural folding core for binding interface. Diverse methods have been developed to extract the co-evolution information from conserved amino acids sequences for structure and function prediction, such as AlphaFold (Jumper et al., 2021).
In brief (Figure 7), antibody evolution specificity distinct from that of proteins can be defined with two main features: (i) ancestor germlines; (ii) the mutated amino acids of germlines.
A.2 Data Processing Details
Pairing Antibody with Germline
For germline annotation in the pre-training task, we used the annotated germline sequences provided in the OAS database (Kovaltsuk et al., 2018). For downstream benchmarks tasks like B-cell classification, therapeutic antibody engineering, and disease diagnosis, we completely followed the methods shown in the OAS database paper. IgBLAST, an immunoinformatic benchmarking tool for the analysis of B-cell antibody repertoires was used for germline annotation (Ye et al., 2013). The antibody nucleotide-containing FASTA file was aligned to germline and translated to amino acids using IgBLASTn. The antibody amino-acid sequence was aligned using IgBLASTp. The germline databases for human patients used ImMunoGeneTics (IMGT) germline sequences derived from Lefranc et al. (1999). For each antibody, usually, multiple germline sequences can be obtained and only the single sequence showing the highest confidence score for the alignment was chosen.
Pre-training Data Processing
We downloaded OAS Oct 2021 version from its website and removed duplicate sequences. To avoid data leakage, we cluster sequences based on the CDR3 sequence and filter each cluster by 70% identity over the whole sequence using Linclust (Steinegger & Söding, 2018). Then, we shuffle the dataset and split it into 100k-size chunks. The last chunk is used as the validation set. The dataset size is 20,245,249 and 45,249 are used for validation.
| Specificity | Task Name | Input | Formalization | Size |
|---|---|---|---|---|
| Low | Antigen Binding Prediction | CDR fragment | Q2 Cls. | 21,612 seqs |
| Medium | Paratope Prediction | CDR residue | Q2 Labeling | 1,662 seqs, 21,342 positions |
| High | SARS Antibody Classification | Sequence | Q2 Cls. | 22,000 seqs |
| High | B Cell Classification | Sequence | Q6 Cls. | 88,094 seqs |
A.3 ATUE Details
We summarize the tasks used in ATUE in Table 5 and discuss each task in detail in this section.
Antigen Binding
Accurate antigen-binding prediction approaches could allow significantly more efficient antibody discovery with higher affinity. Machine learning methods have already achieved some success in antibody binding capacity optimization. We collect the antigen-binding data from Mason et al. (2021) and follow the training/validation/test split of 15,128/3,242/3,242. The original dataset only has CDR3 fragments, and we extend them to the full antibody sequences. For cross-validation, we split the dataset by antibody sequences to ensure that no antibody sequences overlap between 90% training and 10% validation.
Paratope Prediction
Paratope is the antibody residues involved in antigen binding. The ability to accurately map the paratope can provide detailed knowledge about the binding mechanism and accelerate antibody discovery. 1D sequence-based deep learning methods have been employed for paratope prediction. The paratope data is collected from Liberis et al. (2018) with 1,662 CDR segments on 277 antibodies. Each antibody contains three CDR fragments (CDR1, CDR2 and CDR3) in the heavy chain and three CDR fragments in the light chain. We also search the full sequence for each antibody and use the whole sequence as input. For cross-validation, we split the dataset by antibody sequences to ensure that no antibody sequences overlap between 90% training and 10% validation.
| Type | Size |
|---|---|
| Immature b cell | 14,145 |
| Transitional b cell | 13,197 |
| Mature b cell | 16,139 |
| Plasmacytes PC | 22,236 |
| Memory IgD- | 8,437 |
| Memory IgD+ | 13,940 |
B Cell Analysis
We formulate a 6-category classification task for B cell maturation analysis, which includes {immature, transitional, mature, memory IgD+, memory IgD-, plasmacytes,}. The analysis of B cell maturation plays an important role in understanding the mechanisms underlying B cell responses in the immune system Ghraichy et al. (2021); Meffre et al. (2000).
The order of B cell type follows the evolutionary process in the immune system, from an immature state to a transitional state, and finally becomes a memory B cell. Both memory IgD- and IgD+ belong to memory B cells with different isotypes, and they have a high affinity to foreign antigens. Among the other categories, the Plasmacytes PC sequences also have some affinity ability. It is widely reported that changes in antibody sequence patterns correlate with B-cell maturation. Therefore, we use this task to evaluate the representation learning capacity of the language model.
Antibody Discovery
Antibody discovery from B cell repertoire has been widely recognized as a novel trend to improve the efficiency of antibody discovery for diverse antigens (Weiner, 2015; Pedrioli & Oxenius, 2021). However, previous studies highly rely on expensive wet-lab experiments (Cao et al., 2020; Shiakolas et al., 2022). Deep learning-based methods have shown the potential capacity to help antibody discovery by reducing cost and increasing efficiency (Widrich et al., 2020; Wang et al., 2022). Here, we ask whether pre-trained models can benefit real-world problems and enable fast-track neutralization of SARS-CoV-2 antibody discovery.
In the first step, we develop a sequence classifier to distinguish which antibody sequence from the numerous sequences is responsible for the recognition of SARS-CoV-2. This task is highly challenging since we can hardly get the sequence-level disease label that indicates whether the antibody sequence is related to the disease. Thus, we follow the practice of Roskin et al. (2020); Zaslavsky et al. (2022) to use the individual label as the rough sequence label and train a sequence-level predictor. Then, with the help of a sequence-level predictor, we can give each sequence a most likely label to help antibody discovery, whose accuracy has been verified by the excellent results on individual prediction, which may accelerate the discovery of new antibody sequences.
We follow the condition of Kim et al. (2021) to filter SARS-CoV-2 antibody data from the OAS database. The basic condition is ‘Chain = heavy; Isotype = IGHG; BSource = PBMC; Species = human; Vaccine = None’. We further add the condition of ‘Unique Sequences >= 10000’. For health/SARS we set the ‘Disease’ field to ‘None’, ‘SARS-CoV-2’. Then we obtain 87/133 patient profiles for each type. To make a balanced dataset, we limit the size of the health profile and mix up the healthy ones and the ones with the SARS-CoV-2. For cross-validation, we randomly split the dataset by profiles 10 times: 90% for training and 10% for validation. We further select sequences with top100 redundancy to make the positive labels more accurate.
A.4 Quantitative Analysis of ATUE Task Specificity
It is important to include statistical significance tests relative to the antibody-specific features in antibody functional tasks we proposed in the ATUE benchmark. According to the evolution process shown in Figure 7, antibody evolution specificity distinct from that of proteins can be defined with two main features: (i) ancestor germlines; (ii) the mutated amino acids of germlines. We implemented statistical significance tests of (i) ancestor germlines subtype usage; (ii) the number of mutated amino acids in antibodies against different labels of downstream tasks in ATUE to quantitatively assess the "Task specificity". The analysis is now summarized in Table 7. Generally, it is clearly shown that ATUE benchmark comprises antibody tasks showing different scales of antibody specificity for later modeling analysis. Moreover, they are used for statistical analysis of task specificity and pre-training model objectives in our study.
| Task | Statistical significance (p-value) | General Specificity | |
|---|---|---|---|
| Germline Usage | Mutations Numbers | ||
| Antigen Binding | Nan | Nan | Low |
| Paratope Prediction | 0.296 | 0 | Medium |
| B cell classification | 0 | 0 | High |
| SARS antibody discovery | 0 | 0 | High |
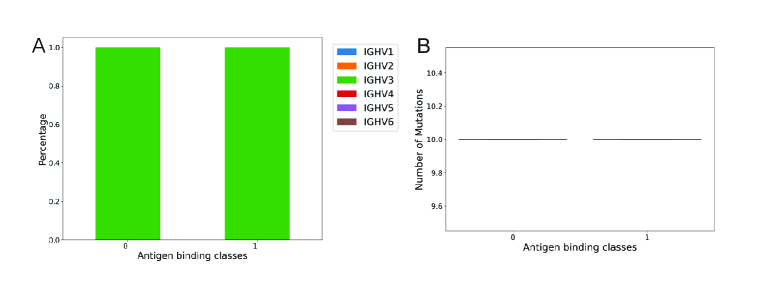
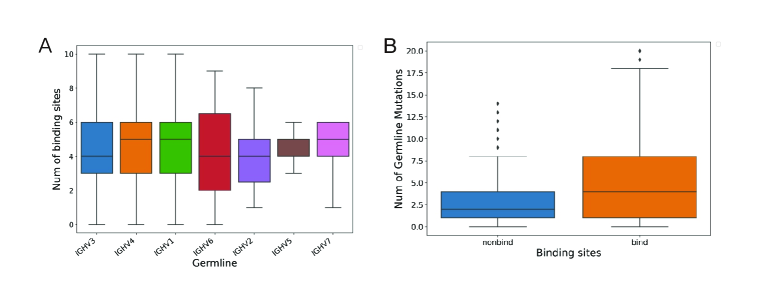
Antigen Binding
In the Antigen binding dataset, both antibody binding and none antigen-binding sequences share the same germline subtype sequence (IGHV3.1) (Figure 8A) as well as the same number of germline mutations 8B). Therefore, None of two antibody-specific features show significant distribution differences between data with different labels, demonstrating antigen binding is a task with low antibody specificity.
Paratope Prediction
For the paratope prediction task, we first evaluate the germline subtype distribution difference between sequences with different numbers of binding sites (Figure 9A). Kruskal Wallis test showed a p-value of 0.296 suggesting germline subtype usage is not statistically significant. Also, we find the binding sites can be significantly mapped with more germline mutations than the non-binding sites, which is consistent with the knowledge of antibody specificity definition (Figure 9B). One out of two antibody-specific features shows significant distribution differences between data with different labels. Therefore, we define this task as a medium specificity task.
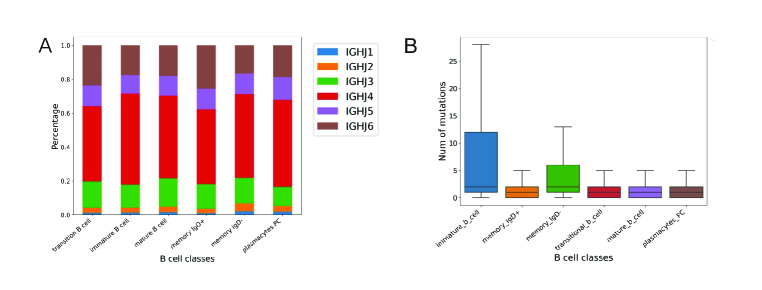
B Cell Analysis
As shown in Figure 10, the distribution of the germline usage as well as the number of germline mutations are significantly different between antibodies in B cells with different developmental stages. This observation is highly consistent with previous studies Mroczek et al. (2014); Ghraichy et al. (2021). Since both of the antibody-specific features show significant distribution differences, this task is defined as a high-specificity task.
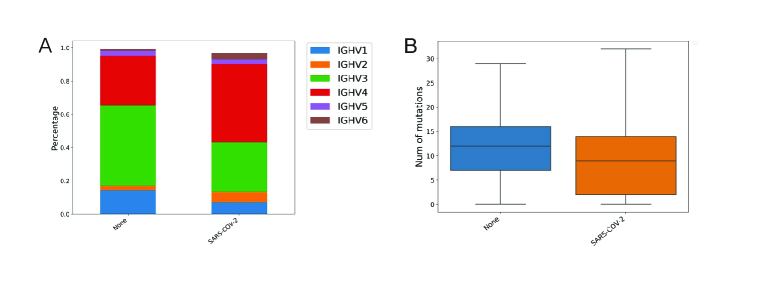
SARS Antibody Discovery
Antibodies in SARS patients and healthy ones show a significant difference in their germline subtype usage and the number of germline mutations (Figure 11). This observation is highly consistent with previous studies showing SARS antibody convergent among patients Galson et al. (2020). Since both of the antibody-specific features are highly significant, this task is defined as a high-specificity task.
A.5 Model Training Details
Antibody can be represented as and the germline of individual antibody can be represented as , where and are the lengths. Each token or in the sequence is called a residue that belongs to the amino acid set . includes 20 common amino acids with a residue ‘X’ that indicates the residue is unknown (mostly in the germline). Typically, antibody PLMs are trained with basic mask language modeling objective on the antibody sequences .
A.5.1 Evolution-aware Pretraining
In order to incorporate the evolutionary information into the pre-training, we pair the antibody sequence with its germline and concatenate them into a long sequence with a special token ‘[SEP]’ as the delimiter: . Thus, we optimize the MLM objective on the long sequence :
| (1) |
where is the index set of masked tokens. It helps the model learn the basic residue distribution for antibody sequences. Besides, it can also capture the interaction between residues of the antibody and its germline.
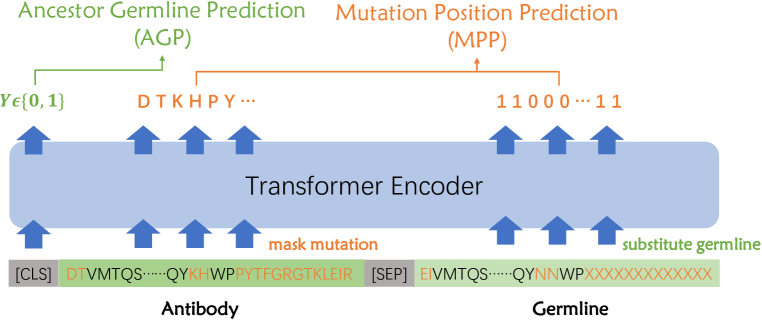
Ancestor Germline Prediction The ancestor relationship between the antibody and its germline determines the shared biological functions obtained in the evolution. Antibody sequences with similar residues evolved from different germline sequences may have different biological functions. When stimulated by a foreign antigen, the common ancestor germline evolves to various antibody sequences. Similar antibody sequences may have different germline sequences, which will affect their biological functions. Thus, the aim of this task is to determine whether the antibody has an evolutionary relationship with the given germline. During training, we substitute the paired germline with random germline in the batch via a probability . The new sequence is denoted as and the training loss can be described as:
| (2) |
where indicate whether the noisy germline is the ancestor of the antibody . It can help the model to distinguish the ancestor germline of the antibody by capturing the shared features.
Mutation Position Prediction The somatic hypermutations on the germline further give progeny antibodies the specificity of binding with the specific antigen. In order to model this specificity, this task focuses on predicting the mutation positions and the residues mutated. Specifically, for each token in the germline , the target is to predict a label to indicate whether this token has been mutated. For the antibody sequence , we mask the mutation position and predict these tokens. The objective can be formalized as:
| (3) |
Here, is the ground-truth mutation position and we mask these tokens on the antibody sequence. This task is more difficult than MLM which equally masks tokens in the , because the tokens on the mutation position of get less information from the germline, compared with other shared residues between the antibody and the germline. By optimizing this objective, the model learns to capture the specificity obtained from the somatic hypermutation in the evolutionary process.
A.5.2 Implementation Details
We use the base Transformer architecture (Vaswani et al., 2017) with 12 layers, 12 heads, and 768 hidden states. The total parameters are 86M. We use Adam optimizer (Kingma & Ba, 2015) with a maximum learning rate of 2e-4 and a warm-up step of 24,000. The maximum length is set to 400 since most antibody sequences are shorter than 180. We first pre-train our model with the MLM objective. During the pre-training, 15% tokens are randomly selected with 80% masked, 10% replaced, and 10% kept. Then we conduct further pre-training on two antibody-related tasks with a smaller learning rate of 1e-5.
For each task in ATUE, we finetune the model with supervised data. We follow the standard split of Antigen Binding Prediction. For other tasks that do not provide a standard split, we conduct 10-cross validation and report the average results. Since our pre-training model learns the representation of the antibody sequence, we expand the CDR fragment to the full antibody by searching the biological database for therapeutic antibody engineering tasks. For finetuning, we limit the max epochs to 30 and use the Adam optimizer with a max learning rate of 3e-5. We use the mean representation of 12 layers as the sequence representation.
| Model | Size | Loss | Step | Germline | Position | Mutation |
| AntiBERT | 85M | 0.437 | 568000 | / | / | 0.031 |
| AntiBERT w AGP | 85M | 0.558 | 587000 | 0.330 | / | / |
| AntiBERT w MPP | 85M | 1.744 | 622000 | / | 0.965 | 0.410 |
| ESM-1 FT | 85M | 0.2636 | 136000 | / | / | / |
| ESM-1b FT | 650M | 0.2704 | 278000 | / | / | / |
| EATLM w/o AGP & MPP | 85M | 0.143 | 108000 | / | / | / |
| EATLM w/o AGP | 85M | 1.744 | 134000 | / | 1.000 | 0.442 |
| EATLM w/o MPP | 85M | 0.001 | 126000 | 1.000 | / | / |
| EATLM | 85M | 1.856 | 252500 | 0.996 | 1.000 | 0.443 |
| EATLM-large w/o AGP & MPP | 650M | 0.149 | 193000 | / | / | / |
| EATLM-large w/o AGP | 650M | 1.753 | 267000 | / | 1.000 | 0.438 |
| EATLM-large w/o MPP | 650M | 0.001 | 200000 | 1.000 | / | / |
| EATLM-large | 650M | 1.773 | 384000 | 0.996 | 1.000 | 0.431 |
The model is trained with 108,000 steps and gets a 0.9606 token accuracy on the MLM task. It takes further steps for AGP and MPP. The model quickly converges for AGP and gets a 0.99 accuracy on the ancestor germline prediction because more than 80% residues are shared between the antibody and its germline. For MPP, it can predict the mutation position with the accuracy of 1.000 and obtains a 0.442 accuracy in the mutation position (EATLM w/o AGP). It means that the model can easily find the mutation positions by the self-attention between the antibody and germline, but it is still difficult to predict which residues this position will mutate to. We assume it is because the ancestor germline can undergo different somatic hypermutations and get various progeny antibodies, resulting in different valid mutations at the same position. We also compare this mutation accuracy with the model without MPP, which is only trained with MLM on the concatenation of the antibody and its germline. With a high prediction accuracy of 0.889 on all positions, it achieves only a 0.031 accuracy on the mutations. It implies that the masking among all positions on the sequence can do accurate predictions of the shared residues but hardly capture the mutation information.
We also conduct AGP and MPP to finetune the baseline model AntiBERT. The pre-training results are shown in Table 8. We can find that without the concatenation of the antibody and its germline, it is difficult to predict the ancestor relationship. It also underperforms than EATLM in MPP.
Negative sampling ratio
We have tried the ratio of 0.1/0.3/0.5/0.75 and found that this ratio has little influence on performance and convergence speed. As we discussed above, the model can quickly converge for AGP and get an accuracy of 0.99.
Finetuned Protein Language Models and Larger Architecture
We pre-train our method with a larger architecture and compare it with ESM-1b, which also has 650M parameters. We also further pre-trained the ESMs to transfer to the antibody field. After that, we evaluate them on the antigen binding and paratope prediction task. The results are shown in Table 9. The result shows that the larger architecture does show an advantage in terms of performance improvement. For antigen binding, ESM-1b has better performance than ESM-1. However, in paratope prediction, it performs worse. In addition, for ESM, fine-tuning the antibody dataset may cause the overfitting problem, leading to a decrease in the performance of all three tasks.
| Antigen Binding | Paratope | |||||
| AUC | F1 | MCC | AUC | F1 | MCC | |
| ESM-1 | 0.917+0.001 | 0.854+0.002 | 0.689+0.002 | 0.886+0.009 | 0.669+0.024 | 0.547+0.026 |
| ESM-1 FT | 0.914+0.001 | 0.858+0.001 | 0.695+0.003 | 0.883+0.009 | 0.657+0.031 | 0.534+0.030 |
| ESM-1b | 0.924+0.002 | 0.860+0.002 | 0.707+0.003 | 0.873+0.009 | 0.655+0.042 | 0.524+0.036 |
| ESM-1b FT | 0.916+0.003 | 0.844+0.003 | 0.686+0.004 | 0.869+0.010 | 0.660+0.021 | 0.527+0.015 |
| EATLM | 0.922+0.052 | 0.862+0.021 | 0.699+0.027 | 0.887+0.008 | 0.698+0.017 | 0.575+0.024 |
| EATLM-large | 0.921+0.004 | 0.854+0.004 | 0.677+0.010 | 0.887+0.007 | 0.685+0.015 | 0.561+0.020 |
A.6 Limitation about EATLM
First, EATLM doesn’t use any 3D structure information during pre-training. As a special subgroup of proteins, antibody structures provide much more information such as geometry than sequences. In the future, recruiting structure information for antibody pre-training may be able to improve the results. However, the data scale available for antibody structure is dramatically less than that of antibody sequences. The largest dataset of antibody structures only contains thousands of 3D high-resolution structures, while the number of antibody sequences is in billions. Using structure prediction methods like AlphaFold may help to bridge the gap between sequences and structures. Second, EATLM requires germline as input during downstream tasks, this will slow down the prediction speed.
A.7 New SARS Binder Discovery
The main challenge for disease diagnosis is to distinguish the disease-related antibodies from millions of antibody sequences in the individual profile, as stated in Section A.3. Here, with the help of a sequence-level predictor, we can give each sequence a most likely label to help antibody discovery, whose accuracy has been verified by the excellent results on individual prediction, which may accelerate the discovery of new antibody sequences.
SARS Sequence-level Predictor
We first train a sequence-level predictor for SARS-CoV-2. The results are shown in Table 10. Compared with Figure 4 in the main text, we find that good results in the sequence-level predictor do not necessarily mean good results in the antibody discovery. It can be mainly affected by the noisy label of the sequence level.
| Sequence-level | SARS | ||
|---|---|---|---|
| AUC | F1 | MCC | |
| No pretrain | 0.8940.029 | 0.8010.045 | 0.6370.078 |
| ESM-1 | 0.9030.061 | 0.7990.032 | 0.6480.093 |
| MSA-1b | 0.9140.025 | 0.8100.050 | 0.6710.080 |
| Ablang-H | 0.9150.027 | 0.8170.038 | 0.6680.068 |
| Ablang-L | 0.8930.035 | 0.8010.054 | 0.6370.099 |
| AntiBERT | 0.9160.026 | 0.8100.033 | 0.6610.060 |
| EATLM | 0.9040.027 | 0.8080.035 | 0.6430.069 |
| EATLM w/o AGP | 0.9040.029 | 0.8080.039 | 0.6440.078 |
| EATLM w/o MPP | 0.9010.026 | 0.8080.035 | 0.6480.069 |
| EATLM w/o MPP & AGP | 0.9010.026 | 0.8070.034 | 0.6450.067 |
Figure out SARS Binders
As shown in Table 4 in the main body, we find 2 true SARS binders and 9 potential binders with the help of EATLM. Specifically, we first use our sequence-level predictor to get a probability score for each sequence in the SARS dataset. Then we select the sequence with a high-ranked score (the probability > 0.5) and compare them with the public Cov-AbDab database Raybould et al. (2021) 111http://opig.stats.ox.ac.uk/webapps/covabdab/, which contains data on published/patented antibodies known to bind to SARS-CoV-2 (Raybould et al., 2021). Since the CDR3 fragment in the heavy chain is the most relevant to the binding of antibody and antigen, we calculate the edit distance between the CDR3 fragments in heavy chains (CDR-H3) with those of the known binder and use a threshold of 85% similarity as the sequence identity. 85% Hamming distance for B cell antibody sequence clustering (identify similar B cell antibody sequences responding to the same antigen/epitope) was previously suggested in this paper (Gupta et al., 2017). This method then was widely used for B cell antibody repertoire analysis in different studies (Montague et al., 2021; Wang et al., 2022).
SARS Binder Analysis
To provide a more intuitive analysis of the similarity between our predicted antibody and true SARS-CoV-2 binders, we investigate the 3D structure of the true binding antibodies and the mutation site of our predicted sequence on the corresponding structure. High resolution structure of true binding antibody #3 in Table 4 with SARS-CoV-2 are shown in Figure 13 (PDB code: 7N62). The interaction interface between the antibodies and SARS-CoV-2 spike/RBD is shown in Figure 4 in the main body. CDR-H3 were shown in orange. Only one single residue highlighted in red is different between the predicted binder and the true binder. Obviously, these different residues don’t localize to the direct binding site and CDR-H3 founding core, suggesting the sequence difference likely will not affect antibody-virus interaction. Furthermore, we found the epitopes of the 11 identified SARS-CoV-2 antibodies cover a wide range of different structures from traditional RBD domain to novel non-RBD epitopes like S2 and NTD as shown in Table 4. This result shows our method enables diverse-epitope antibody discovery.
| Threshold | Total | Hit | Hit rate (%) |
|---|---|---|---|
| 0.5 | 13253 | 66 | 0.498 |
| 0.7 | 10227 | 54 | 0.528 |
| 0.8 | 9338 | 49 | 0.525 |
| 0.9 | 8178 | 47 | 0.562 |
Probability Threshold Sensitivity
In order to investigate the influence of the threshold used to determine the potential binders, we try different thresholds in Table 11. Here, the probability threshold means that if the sequence predictor gives a probability higher than the threshold for one sequence, it will be viewed as a potential binder. If the predicted binder has a sequence similarity higher than 85% with the existing binders in Cov-AbDab, we view it as one hit. As the threshold score increases, the hit rate corresponding increases from 0.528% to 0.562%, indicating that our model may enable priority selection of SARS-CoV-2 antibodies and reduce experimental costs.
Sequence Similarity Sensitivity
In previous work, two antibodies with CDR-H3 similarity over 85% can be viewed as similar and have a high probability to share the same functionality. And here we also check the influence on the binder matching of different thresholds of similarity. The results are shown in Figure 14. Here, we fix the probability threshold as 0.5. As we can see, the baselines have similar trends in all thresholds. If we relax the threshold, there will be more matching sequences. However, the predictors will have less advantage over the random order, which indicates that the ranking is less important if we relax the similarity threshold.
The Potential of New Binder Discovery
During the training of our sequence-level predictor, we have no reliable ground-truth labels, which means that the model has never known which sequences can bind to SARS in a real-world scenario. However, the model can learn from the noisy data and rank the real SARS binders with high probabilities. Sequence identity of 1 means that the CDR-H3 fragment can be directly found in the Cov-AbDab database, which implies that the sequences have been verified by wet laboratory testing. The other sequences with an identity over 90% are thought to have a similar binding performance to existing binders, indicating that they are promising SARS binders that can help the discovery of therapeutic antibodies for SARS-CoV-2.
A.8 Extented Study for Disease Diagnosis
It would be interesting to see whether our sequence classifier can be used for other applications, such as disease diagnosis. Each human is estimated to maintain about distinct antibody sequences, constructing an informative encyclopedia recording the past and present health and disease. Interpreting the pattern of the sequences has already proved useful in disease diagnosis and allows us to assess many infectious diseases without expensive laboratory testing. However, it is difficult to distinguish which antibody sequence from the numerous sequences is responsible for the recognition of the specific antigen, which hinders the discovery of the antibody for diseases (Zaslavsky et al., 2022; Lu et al., 2018; Greiff et al., 2020).
Benefiting from the recent high-throughput sequencing, we can obtain millions of antibody sequences from the individual human. At the same time, we can get a disease label that indicates whether the human is infected by the disease. The main challenge is that we can hardly get the sequence-level disease label that indicates whether the antibody sequence is related to the disease. Thus, we follow the practice of Roskin et al. (2020) to use the individual label as the rough sequence label and train a sequence-level predictor. Then we use this predictor to predict sequences of the individual profile and make the trimmed mean score as the individual score.
We use the same data processing as Antibody Discovery stated in Section A.3. For health/SARS/HIV/Ebola/Allergy/SLE/MS, we set the ‘Disease’ field to ‘None’, ‘Ebola’, ‘Allgery’, ‘SLE’,‘MS’. Then we obtain 87/133/51/14/12/8/8 patient profiles for each type. We also do 10-cross validation and select sequences with high redundancy.
Disease Classification
We use all these disease profiles to build the Q7 classification task for disease diagnosis. Previous biological studies mainly use this multi-classification task for disease diagnosis Zaslavsky et al. (2022); Wang et al. (2022), highlighting the discriminatory power among different diseases is important for disease diagnosis. The results are shown in Table 12. We found both PPLM and PALM show comparable results as the randomly initialized model, suggesting the finetuning part plays a more important role and the pre-trained language model cannot help this task.
| ACC | |
| No pretrain | 0.7540.023 |
| ESM-1 | 0.7470.016 |
| ESM-1 FT | 0.7620.024 |
| MSA-1b | 0.7460.019 |
| Ablang-H | 0.7040.033 |
| Ablang-L | 0.7020.040 |
| AntiBERT | 0.7500.016 |
| EATLM | 0.7560.020 |
| EATLM w/o AGP | 0.7540.020 |
| EATLM w/o MPP | 0.7550.020 |
| EATLM w/o AGP & MPP | 0.7560.021 |
Sequence-level Predictor for Various Disease
As before, we train a sequence-level predictor for each disease. The results are shown in Table 13. Compared with Table 4 in the main text, we find that good results in the sequence-level predictor do not necessarily mean good results in the individual-level predictor. It is mainly due to the trimmed mean we use to get individual-level results, which is a central estimate that is robust to noise labels. Overall, our model has comparable results to other models in terms of sequence prediction with noisy labels and has better results for individual diagnosis.
Individual-level Predictor for Various Disease
It is observed our evolution-aware EATLM performs the best in the individual-level classifier to determine whether the patient suffering from SARS. Besides, PALMs significantly outperform PPLMs. The results are shown in Table 14.
| Sequence-level | SARS | HIV | ||||
|---|---|---|---|---|---|---|
| AUC | F1 | MCC | AUC | F1 | MCC | |
| No Pretrain | 0.8940.029 | 0.8010.045 | 0.6370.078 | 0.8930.081 | 0.6220.223 | 0.5630.209 |
| ESM-1 | 0.9030.061 | 0.7990.032 | 0.6480.093 | 0.9270.039 | 0.7390.082 | 0.7010.080 |
| MSA-1b | 0.9140.025 | 0.8100.050 | 0.6710.080 | 0.9030.064 | 0.6800.103 | 0.6170.102 |
| Ablang-H | 0.9150.027 | 0.8170.038 | 0.6680.068 | 0.8950.058 | 0.6840.087 | 0.6040.108 |
| Ablang-L | 0.8930.035 | 0.8010.054 | 0.6370.099 | 0.8810.072 | 0.6680.111 | 0.5840.131 |
| AntiBERT | 0.9160.026 | 0.8100.033 | 0.6610.060 | 0.9210.046 | 0.7420.088 | 0.6890.101 |
| EATLM | 0.9040.027 | 0.8080.035 | 0.6430.069 | 0.9300.044 | 0.7440.079 | 0.6770.105 |
| EATLM w/o AGP | 0.9040.029 | 0.8080.039 | 0.6440.078 | 0.9330.041 | 0.7470.077 | 0.6790.103 |
| EATLM w/o MPP | 0.9010.026 | 0.8080.035 | 0.6480.069 | 0.9320.037 | 0.7490.072 | 0.6820.096 |
| EATLM w/o MPP & AGP | 0.9010.026 | 0.8070.034 | 0.6450.067 | 0.9300.045 | 0.7490.074 | 0.6780.098 |
| Ebola | Allergy | |||||
| AUC | F1 | MCC | AUC | F1 | MCC | |
| No Pretrain | 0.9670.031 | 0.7960.115 | 0.7870.113 | 0.9940.006 | 0.9760.017 | 0.9580.019 |
| ESM-1 | 0.9700.035 | 0.8450.098 | 0.8360.097 | 0.9940.006 | 0.9880.006 | 0.9750.011 |
| MSA-1b | 0.9700.026 | 0.8030.103 | 0.7990.096 | 0.9660.019 | 0.9180.037 | 0.8350.093 |
| Ablang-H | 0.9510.024 | 0.7000.087 | 0.6910.079 | 0.8210.093 | 0.7340.091 | 0.4590.190 |
| Ablang-L | 0.9450.027 | 0.7190.110 | 0.7100.100 | 0.7820.136 | 0.7350.104 | 0.3810.262 |
| AntiBERT | 0.9590.030 | 0.8040.110 | 0.7950.106 | 0.9930.008 | 0.9840.009 | 0.9700.014 |
| EATLM | 0.9690.036 | 0.8480.096 | 0.8410.094 | 0.9950.006 | 0.9880.005 | 0.9750.011 |
| EATLM w/o AGP | 0.9670.032 | 0.8430.097 | 0.8350.093 | 0.9960.004 | 0.9830.006 | 0.9680.007 |
| EATLM w/o MPP | 0.9690.037 | 0.8400.094 | 0.8280.098 | 0.9960.004 | 0.9800.005 | 0.9610.011 |
| EATLM w/o MPP & AGP | 0.9700.025 | 0.8210.098 | 0.8110.091 | 0.9960.002 | 0.9810.007 | 0.9630.009 |
| SLE | MS | |||||
| AUC | F1 | MCC | AUC | F1 | MCC | |
| No Pretrain | 0.9940.004 | 0.9820.009 | 0.9600.012 | 0.8410.182 | 0.8470.129 | 0.6170.378 |
| ESM-1 | 0.9920.005 | 0.9790.014 | 0.9540.021 | 0.8790.127 | 0.8450.123 | 0.6210.358 |
| MSA-1b | 0.9980.001 | 0.9880.007 | 0.9730.011 | 0.8530.150 | 0.8360.135 | 0.5940.392 |
| Ablang-H | 0.9940.003 | 0.9640.022 | 0.9310.021 | 0.8360.184 | 0.8280.108 | 0.5620.353 |
| Ablang-L | 0.9950.002 | 0.9770.017 | 0.9560.021 | 0.8460.175 | 0.8520.115 | 0.6330.351 |
| AntiBERT | 0.9940.009 | 0.9520.068 | 0.9190.096 | 0.8930.095 | 0.8540.112 | 0.7010.214 |
| EATLM | 0.9900.008 | 0.9700.018 | 0.9390.018 | 0.8470.135 | 0.7980.156 | 0.5720.294 |
| EATLM w/o AGP | 0.9900.007 | 0.9620.031 | 0.9290.040 | 0.8460.132 | 0.7990.162 | 0.5840.284 |
| EATLM w/o MPP | 0.9810.021 | 0.9400.063 | 0.8910.086 | 0.8090.185 | 0.8070.152 | 0.5350.381 |
| EATLM w/o MPP & AGP | 0.9880.010 | 0.9520.051 | 0.9150.070 | 0.8270.159 | 0.7980.147 | 0.5470.311 |
| Pateint-level | SARS | HIV | ||||
|---|---|---|---|---|---|---|
| AUC | F1 | MCC | AUC | F1 | MCC | |
| No pretrain | 0.9750.033 | 0.9620.024 | 0.9020.062 | 0.9200.092 | 0.8150.117 | 0.7760.122 |
| ESM-1 | 0.9790.017 | 0.9330.032 | 0.8240.090 | 0.9670.056 | 0.8830.107 | 0.8490.135 |
| MSA-1b | 0.9890.012 | 0.9540.033 | 0.8870.078 | 0.9620.039 | 0.8330.068 | 0.7890.072 |
| Ablang-H | 0.9880.013 | 0.9680.024 | 0.9200.063 | 0.9600.040 | 0.7880.134 | 0.7440.137 |
| Ablang-L | 0.9900.015 | 0.9380.039 | 0.8430.091 | 0.9310.069 | 0.7980.131 | 0.7420.170 |
| AntiBERT | 0.9830.017 | 0.9760.022 | 0.9380.056 | 0.9690.053 | 0.8780.112 | 0.8500.134 |
| EATLM | 0.9770.028 | 0.9830.017 | 0.9550.045 | 0.9780.054 | 0.9140.081 | 0.8840.106 |
| EATLM w/o AGP | 0.9830.019 | 0.9730.025 | 0.9290.066 | 0.9780.054 | 0.9030.076 | 0.8690.099 |
| EATLM w/o MPP | 0.9870.015 | 0.9690.024 | 0.9210.061 | 0.9760.053 | 0.9060.092 | 0.8800.112 |
| EATLM w/o MPP & AGP | 0.9860.014 | 0.9690.023 | 0.9200.061 | 0.9730.052 | 0.9190.096 | 0.8960.117 |
| Ebola | Allergy | |||||
| AUC | F1 | MCC | AUC | F1 | MCC | |
| No Pretrain | 0.9940.017 | 0.9330.133 | 0.9340.132 | 1.0000.000 | 1.0000.000 | 1.0000.000 |
| ESM-1 | 1.0000.000 | 0.9330.133 | 0.9340.132 | 1.0000.000 | 1.0000.000 | 1.0000.000 |
| MSA-1b | 1.0000.000 | 0.9330.133 | 0.9340.132 | 1.0000.000 | 1.0000.000 | 1.0000.000 |
| Ablang-H | 0.9440.167 | 0.7670.213 | 0.7500.254 | 1.0000.000 | 0.9600.080 | 0.9160.169 |
| Ablang-L | 0.9610.100 | 0.7310.205 | 0.7030.277 | 1.0000.000 | 0.9600.080 | 0.9160.169 |
| AntiBERT | 0.9780.067 | 0.9330.133 | 0.9340.132 | 1.0000.000 | 1.0000.000 | 1.0000.000 |
| EATLM | 1.0000.000 | 0.9470.111 | 0.9440.114 | 1.0000.000 | 1.0000.000 | 1.0000.000 |
| EATLM w/o AGP | 1.0000.000 | 0.9330.133 | 0.9340.132 | 1.0000.000 | 1.0000.000 | 1.0000.000 |
| EATLM w/o MPP | 1.0000.000 | 0.9330.133 | 0.9340.132 | 1.0000.000 | 1.0000.000 | 1.0000.000 |
| EATLM w/o MPP & AGP | 0.9940.017 | 0.9330.133 | 0.9340.132 | 1.0000.000 | 1.0000.000 | 1.0000.000 |
| SLE | MS | |||||
| AUC | F1 | MCC | AUC | F1 | MCC | |
| No Pretrain | 1.0000.000 | 1.0000.000 | 1.0000.000 | 0.7000.200 | 0.9000.137 | 0.8930.400 |
| ESM-1 | 1.0000.000 | 1.0000.000 | 1.0000.000 | 0.9000.200 | 0.9330.133 | 0.9000.200 |
| MSA-1b | 1.0000.000 | 1.0000.000 | 1.0000.000 | 0.7000.400 | 0.8930.137 | 0.7000.400 |
| Ablang-H | 1.0000.000 | 1.0000.000 | 1.0000.000 | 0.8000.245 | 0.8930.137 | 0.7000.400 |
| Ablang-L | 1.0000.000 | 1.0000.000 | 1.0000.000 | 1.0000.000 | 0.9600.080 | 0.8000.400 |
| AntiBERT | 1.0000.000 | 1.0000.000 | 1.0000.000 | 1.0000.000 | 1.0000.000 | 1.0000.000 |
| EATLM | 1.0000.000 | 1.0000.000 | 1.0000.000 | 1.0000.000 | 0.8670.163 | 0.8000.245 |
| EATLM w/o AGP | 1.0000.000 | 1.0000.000 | 1.0000.000 | 1.0000.000 | 0.8670.163 | 0.8000.245 |
| EATLM w/o MPP | 1.0000.000 | 1.0000.000 | 1.0000.000 | 1.0000.000 | 0.8270.150 | 0.6000.374 |
| EATLM w/o MPP & AGP | 1.0000.000 | 1.0000.000 | 1.0000.000 | 1.0000.000 | 0.8270.150 | 0.8000.374 |