Cybersecurity Threat Hunting and Vulnerability Analysis Using a Neo4j Graph Database of Open Source Intelligence
Abstract
Open source intelligence is a powerful tool for cybersecurity analysts to gather information both for analysis of discovered vulnerabilities and for detecting novel cybersecurity threats and exploits. However the scale of information that is relevant for information security on the internet is always increasing, and is intractable for analysts to parse comprehensively. Therefore methods of condensing the available open source intelligence, and automatically developing connections between disparate sources of information, is incredibly valuable. In this research, we present a system which constructs a Neo4j graph database formed by shared connections between open source intelligence text including blogs, cybersecurity bulletins, news sites, antivirus scans, social media posts (e.g., Reddit and Twitter), and threat reports. These connections are comprised of possible indicators of compromise (e.g., IP addresses, domains, hashes, email addresses, phone numbers), information on known exploits and techniques (e.g., CVEs and MITRE ATT&CK Technique ID’s), and potential sources of information on cybersecurity exploits such as twitter usernames. The construction of the database of potential IoCs is detailed, including the addition of machine learning and metadata which can be used for filtering of the data for a specific domain (for example a specific natural language) when needed. Examples of utilizing the graph database for querying connections between known malicious IoCs and open source intelligence documents, including threat reports, are shown. We show that this type of relationship querying can allow for more effective use of open source intelligence for threat hunting, malware family clustering, and vulnerability analysis.
1 Introduction
Open source intelligence offers an extraordinary amount of information that a cybersecurity analyst can use for threat detection, mitigation, and analysis [1, 2, 3, 4, 5, 6]. However, open source intelligence contains a large amount of noise (i.e., irrelevant information) and most importantly the scale of the data is too large to be useful in its raw form. To this end, automating the process of finding indicators of compromise and relevant relationships between the indicators of compromise, has become increasingly important [7, 8, 5]. The central idea utilized in this article is forming a network of associations between open source intelligence documents and potential indicators of compromise (IoCs) that exist in the open source intelligence text. The term potential IoC is important because it specifies that the text is potentially useful and quite unstructured, but there is a pattern match in the data that does fit a particular form (for example, an IP address, or a CVE). Graphs are a natural way to express these types of higher order connections and are used in a variety of cybersecurity contexts [9, 10]. These types of networks, when they are intended for providing semantic meaning between heterogeneous data types are also referred to as knowledge graphs [11, 12, 13]. In order to create a graph representation of a large amount of open source intelligence, we utilize Neo4j which provides a visual interface to search the graph, allows a number of users to interact with the data, and also provides an efficient query time for the database to interact with other analysis systems or to simply query and display the raw OSint text documents that are connected to a relevant exploit or IoC. Neo4j graph databases have been used in other domains for the purpose of storing and querying data structures with complex networks [14, 15, 16, 17] including social network analysis [18] and typhoon disaster knowledge [19]. Utilizing graphs in order to better evaluate potentially relevant connections that exist in a large dataset is a subject of considerable interest in the literature [20, 21, 22].
In this article we outline a methodology which consists of collecting and aggregating open source intelligence, in conjunction with antivirus scan results, and presenting the information contained in this data in the form of a network, or a graph. Specifically, edges represent a connection between a potential IoC and a document. The challenge is that most open source intelligence text from the web is unstructured therefore analyzing the text for relevant pattern matches is a means to extract the potential IoCs. Here a document is simply a collection of natural language or data - for example a single tweet from Twitter could be a document. Furthermore, metadata is included with the node document when constructing the database - several machine learning algorithms identify whether the text is discussing cybersecurity and specifically what type of exploit techniques are being discussed. This type of metadata is important because it can can serve as a signal for the quality of the given node document - meaning that a piece of open source intelligence text gathered from social media will have a higher confidence of being relevant if the machine learning algorithm tells us it is likely discussing a cybersecurity topic. In Section 2 we detail the construction of this type of cybersecurity intelligence graph, instantiated as a Neo4j graph database. In Section 3 we give specific examples of where this type of open source intelligence graph database can provide useful information and analysis in cybersecurity. We conclude in Section 4 with a discussion of what this type of approach to open source intelligence analysis can be used for and future research directions.
2 Methods
In this section we outline the pipeline used to construct the Neo4j database. In Section 2.1 the open source intelligence data sources are defined, in Section 2.2 the database construction is outlined.
2.1 Open source intelligence data sources
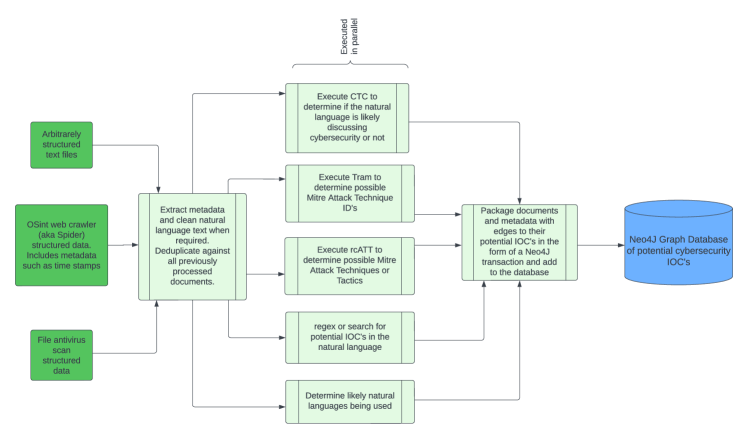
The open source intelligence documents that are fed into the system broadly fall into three categories; the three green starting blocks in Figure 1 show these categories. The first type of data is entirely unstructured text - typically this type of data is simply a threat report or a list of indicators or vulnerabilities. This option allows any collection of text sourced from any internet discussion to be analyzed for potential IoCs and to be added into the Neo4j database. Figure 1 was created in Lucidchart111www.lucidchart.com.
The second type of data comes from a system of web crawlers (the details of this system are outlined in ref. [23]). The text found by the web crawlers is typically similarly unstructured and can originate from a variety of sources such as Reddit, Twitter, blogs, cybersecurity bulletins, and news sites. However, the web crawler data also contains metadata including links that the crawler followed to this current site, time and date information, and cybersecurity keywords that were found when parsing the site. Therefore, this data is slightly more structured and is therefore parsed differently from arbitrary text; specifically the metadata is kept separate from the text that will be analyzed for potential IoCs, which is eventually added into the node information in Neo4j.
The third type of data is structured antivirus scans of files that are potentially malware. This data is entirely machine readable and does not contain natural language information. Therefore, this data is also parsed differently to the other two data sources. In particular, these antivirus scans include hashes of files and the names of those files. Therefore, those specific fields (hashes and file names) that are present in the structured data are parsed for creating edges in Neo4j, but no other natural language analysis or pattern matching for potential IoCs is performed.
2.2 Neo4j database construction
| Node type | Count of unique nodes | Count of edges |
|---|---|---|
| Document | 2128992 | |
| MD5 Hash | 394826 | 944671 |
| SHA1 Hash | 323321 | 990817 |
| SHA256 Hash | 642535 | 1941248 |
| SHA512 Hash | 18339 | 28112 |
| Malware name | 365 | 117528 |
| APT name | 457 | 165741 |
| 85396 | 953757 | |
| CVE ID | 174668 | 1313206 |
| Twitter username | 174143 | 402899 |
| Phone number | 23756 | 144397 |
| IP address | 119699 | 705386 |
| domain | 214720 | 3116508 |
| File name | 351507 | 1326480 |
| MITRE ATT&CK Technique ID | 445 | 21018 |
Figure 1 details the high level workflow that constructs the Neo4j database of potential IoCs. This entire system is operating continuously by reading in new data from the independent web crawler infrastructure and then adding relevant information into the Neo4j database. First, the data is parsed depending on its source, as outlined in Section 2.1. This input data is referred to as a document because this collection of text is all originating from the same source and is therefore logically linked, which could be helpful for identifying relationships when searching the database. As an example, a single document could be a piece of text from social media, such as a Reddit post or a tweet from Twitter. Any metadata that is associated with the input text is parsed at this point, to be added into the Neo4j database if a node representing this document is created. Importantly, once the raw text input has been extracted (this includes the JSON structured antivirus file scan data), a SHA256 checksum of the data is created and this checksum is then checked against the checksums of all of the documents that are in the Neo4j database; and if the document is a duplicate, it is not added to the database. Next, several processes begin executing in parallel, all of which are designed to extract useful meaning from the natural language input. To this end, the antivirus file scan data is not parsed using the machine learning algorithms or language detection; however the potential IoCs such as filenames and hashes are extracted and used to create edge relationships in the database. The Cybersecurity Topic Classification (CTC) tool, which is compromised of multiple machine learning algorithms trained to detect cybersecurity vs non-cybersecurity discussions from social media and developer forum English text sources [24], is executed on the text. The output of this algorithm is simply three states - either it is likely cybersecurity related text, or not, or there was not enough data (e.g., English words) to make a decision.
The Reports Classification by Adversarial Tactics and Techniques (rcATT) machine learning python tool [25] is also executed on the text. This tool gives a list of likely MITRE ATT&CK tactics and techniques 222https://attack.mitre.org/ that were mentioned in the text. The MITRE ATT&CK framework provides a consistent basis for tracking cybersecurity techniques [26, 27, 28, 29, 30, 31]. The rcATT tool was trained on threat report text and therefore the error rates on non-threat report documents is expected to be high. The tool is applied uniformly to all documents because it is not necessarily known a-priori what the exact semantic content of the document is (e.g., whether it is a threat report, or a news report, or entirely non-cybersecurity). It is generally expected that based on the training data used to create the machine learning models in the tool, cybersecurity content (e.g., documents where CTC returned True) will have higher accuracy results in regards to detecting discussions of specific MITRE ATT&CK tactics and techniques.
The Threat Report ATT&CK Mapper (TRAM) machine learning python tool333https://github.com/center-for-threat-informed-defense/tram/ is also executed on the document. TRAM, similar to rcATT, returns likely MITRE ATT&CK techniques that were mentioned in threat reports. Therefore similarly to rcATT, this data will likely have high error rates for natural language text that is quite different from threat reports, but could be more accurate for cybersecurity related text.
Especially for the data coming from the web crawlers, the natural language text could be non-English. Having some signal to indicate when this occurs in the Neo4j database could be useful (for example if one just wants to query documents that are only English or Spanish text). The other reason that this signal is important is because all of the natural language machine learning algorithms vectorize the input text using a very broadly defined English dictionary - meaning that other languages are not used in these models, which means that their results will be very inaccurate and should not be used. Therefore, the python tool langdetect is also executed on the text and the resulting language detection information is included in the node metadata.
Lastly, pattern matches for all potential IoCs are performed on the text. With the exception of the structured antivirus file scans, where the potential IoCs that can be extracted can be done automatically, all of the other input text can be entirely unstructured. Therefore, simple pattern matching procedures are performed in order to find potential IoCs. Hashes (md5, sha1, sha256, sha512) are found by searching for high entropy hexadecimal text that fits within the required character length. File names are found by matching tokenized words (NLTK [32] was used for most of the tokenization procedures) that have a file ending that matches some standard file ending (for example .py for python). Advanced Persistent Threat (APT) group names and malware names are all simply pattern matched against tokenized words in the text. Phone numbers, Email addresses, IP addresses, twitter usernames, and domain names are all found by pattern match searching for the known standard formats that they appear in. Some simple checks are used to rule out pattern matches which do not fit the expected format of the data type and in the case of domain names, the top 1 million (Alexa top 1 million list) most searched domains are removed in order to reduce noise in the graph. Common Vulnerabilities and Exposures (CVEs) [33] and the unique ID numbers of MITRE ATT&CK techniques [34] are also pattern matched for; both of these data types also follow a standard format which can be identified. Each of these pattern matches will correspond to an edge (e.g., a connection) between the document node that contained this data and a node representing that unique pattern match. This unique pattern match we broadly call a potential IoC, but it can also simply be a unique ID to track a known vulnerability (for example a CVE), or it could be a potentially useful piece of information for connecting two document nodes but not be a malicious IoC.
Once all of this pattern matching and data processing has been completed, a number of Neo4j transactions are created in order to add the new data into the database. All of the processed documents have unique nodes created which contain several different components. The most important part of the node is the original raw text that was in the node document. Next, web crawler metadata is in the nodes which originated from web crawling - here the metadata includes the link, parent link, time stamps, keywords, and potentially other data such as checksums. Next, some document nodes are antivirus scans - in these cases there is a large amount of metadata about the scan that was performed, but typically the data is not natural language. All nodes also have language detection metadata, if there was natural language text that could be processed. The natural language detection is useful for filtering nodes which contain only a specific language of interest, however as expected most of the document nodes are English text. The pattern matches that were found in the text that form the edges in the graph are also included as a segment in the node data. Lastly, the machine learning results from CTC, rcATT, and TRAM are also included as a separate data segment (if there is applicable English text that could be fed to these ML algorithms). Each of these components of node data can be used to filter for specific nodes which have specific attributes that are relevant for a specific task. Any documents which have no pattern matches are not added to the database as they would simply be degree 0 nodes. Next, for all unique pattern matches found in this set of documents, check if the nodes already exist in the database. If they do exist, do nothing, but if they do not exist, then create them. This is to avoid creating duplicate potential IoC or pattern match nodes. Lastly, edges are formed between the document nodes and the nodes representing the pattern matches found in those documents. Table 1 shows the counts of nodes and edges in the database as of the writing of this paper. Therefore, the constructed graph database is always bipartite where one partition is the node documents (i.e., the sources of information) and the other partition is the set of nodes representing different potential IoCs or vulnerability IDs that exist in the node documents. This structure allows users, or algorithms, to query for relationships based on potential IoCs (e.g., a path connecting two potential IoCs or the network of neighbors associated with a potential IoC) and then examine the sources of the information within the node documents, including machine learning and language metadata.
3 IoC connections in the graph database
In this section some specific visual examples of the structure of the database indicates what is available to the user when searching for IoCs or vulnerability IDs. The hard part of cybersecurity analysis is aggregating information, in this case open source unstructured text, into a meaningful form that can provide a network of related documents and potential indicators of compromise. In Section 3.1 we show the graph connectivity around an md5 hash of a known malware file from the WannaCry ransomware. In Section 3.2 we show the graph connectivity surrounding an IP address known to be a command and control server for the Qakbot trojan. In Section 3.3 we show the graph connectivity around a CVE that is known to be exploited in the wild.
Section 3.4 shows a specific case where a sha256 hash of a contained resource was in several antivirus scans of different portable executable malware. This shared contained resource is reasonably unique, and indicates software re-use during the development of otherwise seemingly unconnected malware samples.
In Section 3.5 we show the distribution of CVE node degrees in the Noe4j database compared to their Common Vulnerability Scoring System (CVSS) scores, and show that for reputable open source cybersecurity sources (e.g., threat reports), there is a weak-to-median linear relationship between the two. Lastly, in Section 3.6 the Neo4j Graph Data Science implementation of PageRank is applied to the graph database, allowing a ranking of the most influential CVEs across the entire database.
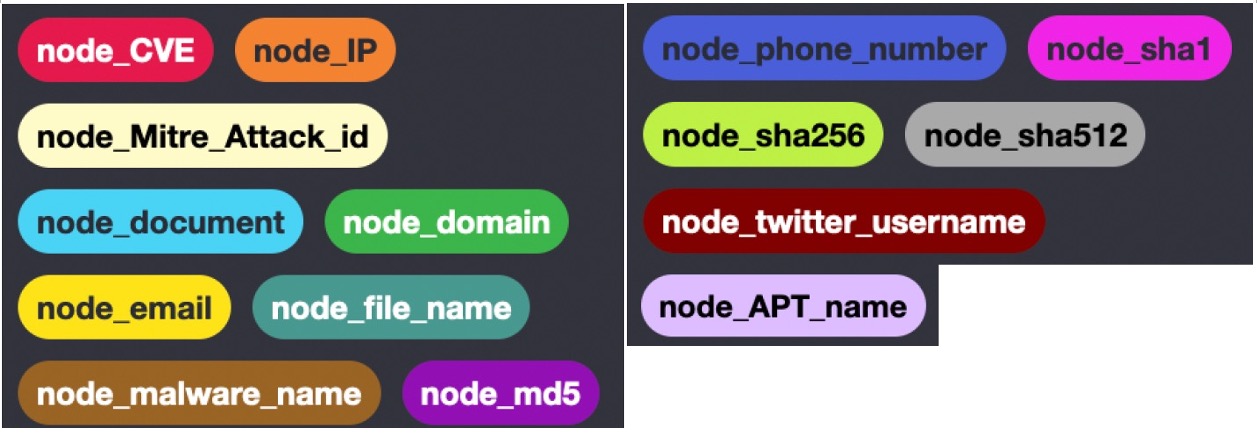
For the visual graph examples we query the database with the Neo4j browser using the Cypher query language444https://neo4j.com/developer/cypher/. The node and edge coloring’s encode the following information. Document nodes are large cyan nodes, SHA1 nodes are magenta, SHA256 nodes are lime, SHA512 nodes are grey, MD5 nodes are purple, file name nodes are teal, email address nodes are yellow, IP address nodes are orange, malware name nodes are brown, Twitter usernames are maroon, APT name nodes are lavender, domain name nodes are green, phone number nodes are blue, CVE nodes are red, and MITRE ATT&CK technique IDs are beige. The edge coloring matches the node coloring; for example an edge connecting a CVE to a document node where it was mentioned will also be colored red. Figure 2 shows the node and edge coloring legend. In order to reduce visual clutter, if there are near duplicate documents from the web crawlers which have the same connections to a group of nodes, we manually remove all but one of the duplicate document nodes.
3.1 Visual analysis: md5 malware hash
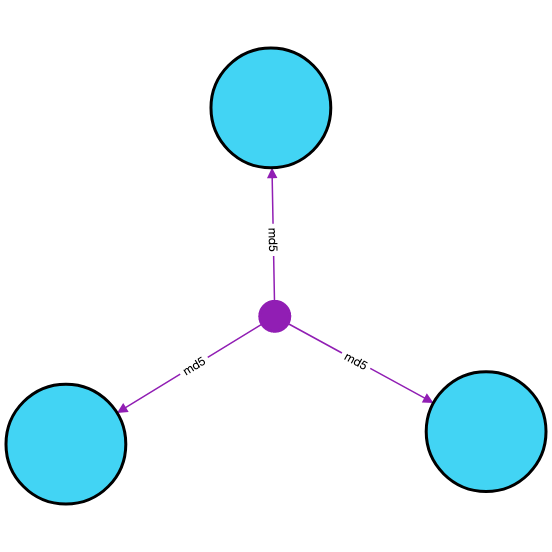
In order to show a specific malware hash subgraph of the database, we will perform a query to the Neo4j database for the md5 hash 84c82835a5d21bbcf75a61706d8ab549. The Cypher language query used to search for this single md5 node is:
MATCH p=(find:node_md5 {name: ‘84c82835a5d21bbcf75a61706d8ab549’}) RETURN p
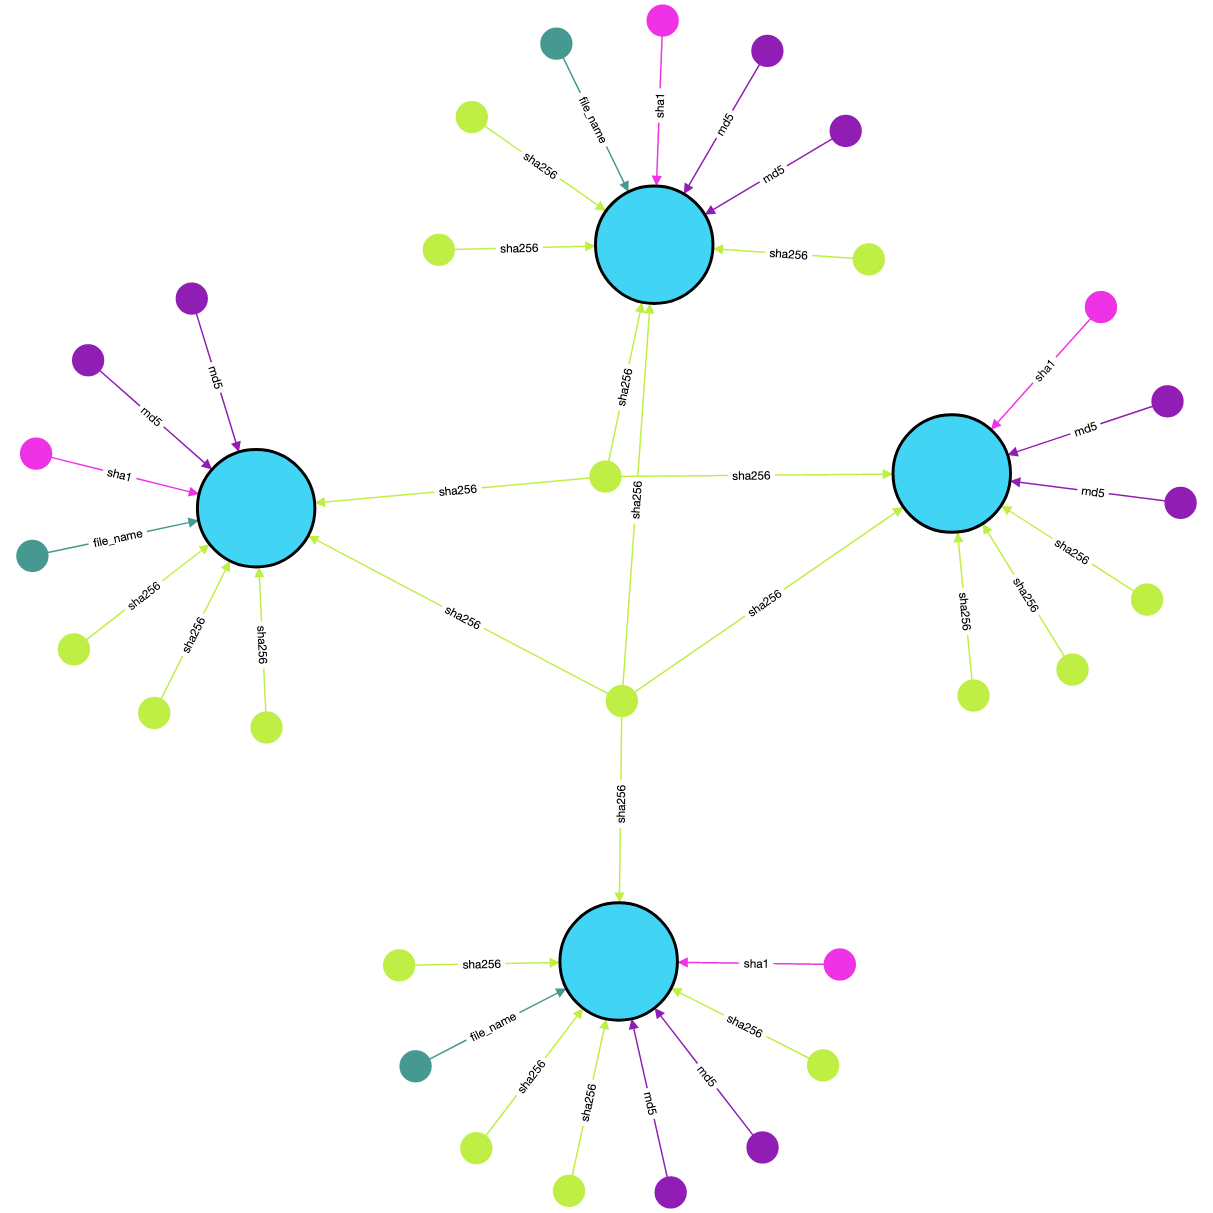
In order to illustrate the utility of the database, we have selected this hash because it is known to be a hash of a piece of malware. The query results show that there are three unique document nodes that reference this specific hash. Figure 3 shows this connectivity graph. The content of these three document nodes contains useful context information. The lower left hand node document is a cybersecurity blog-style website that is detailing a network and security analysis tool, which used the example of this md5 hash for detecting malware using antivirus software. The lower right hand node document is a manalyzer report on this md5 hash555https://manalyzer.org/report/84c82835a5d21bbcf75a61706d8ab549. The top node document is a 4chan thread for which a user linked to this manalyzer report within a long discussion thread.
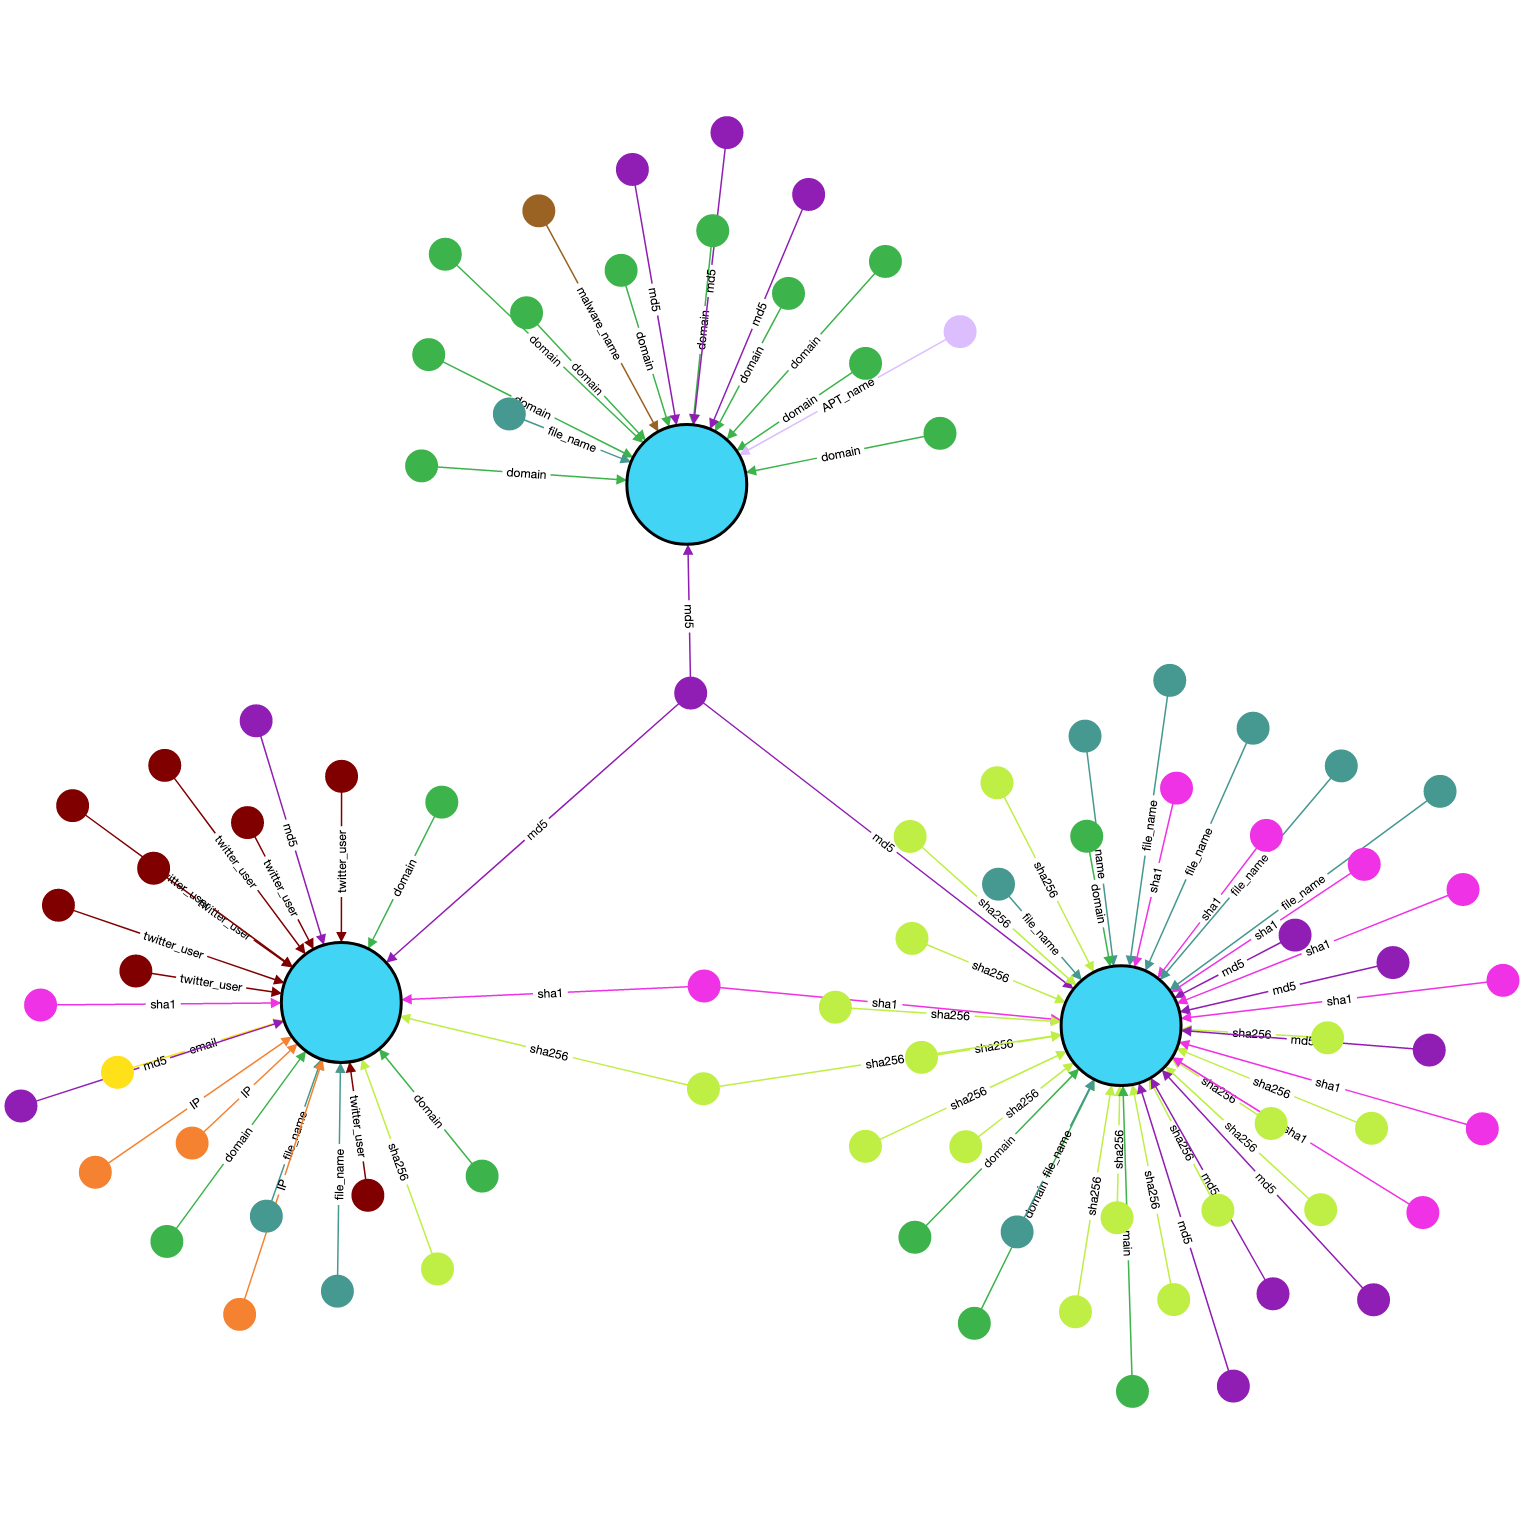
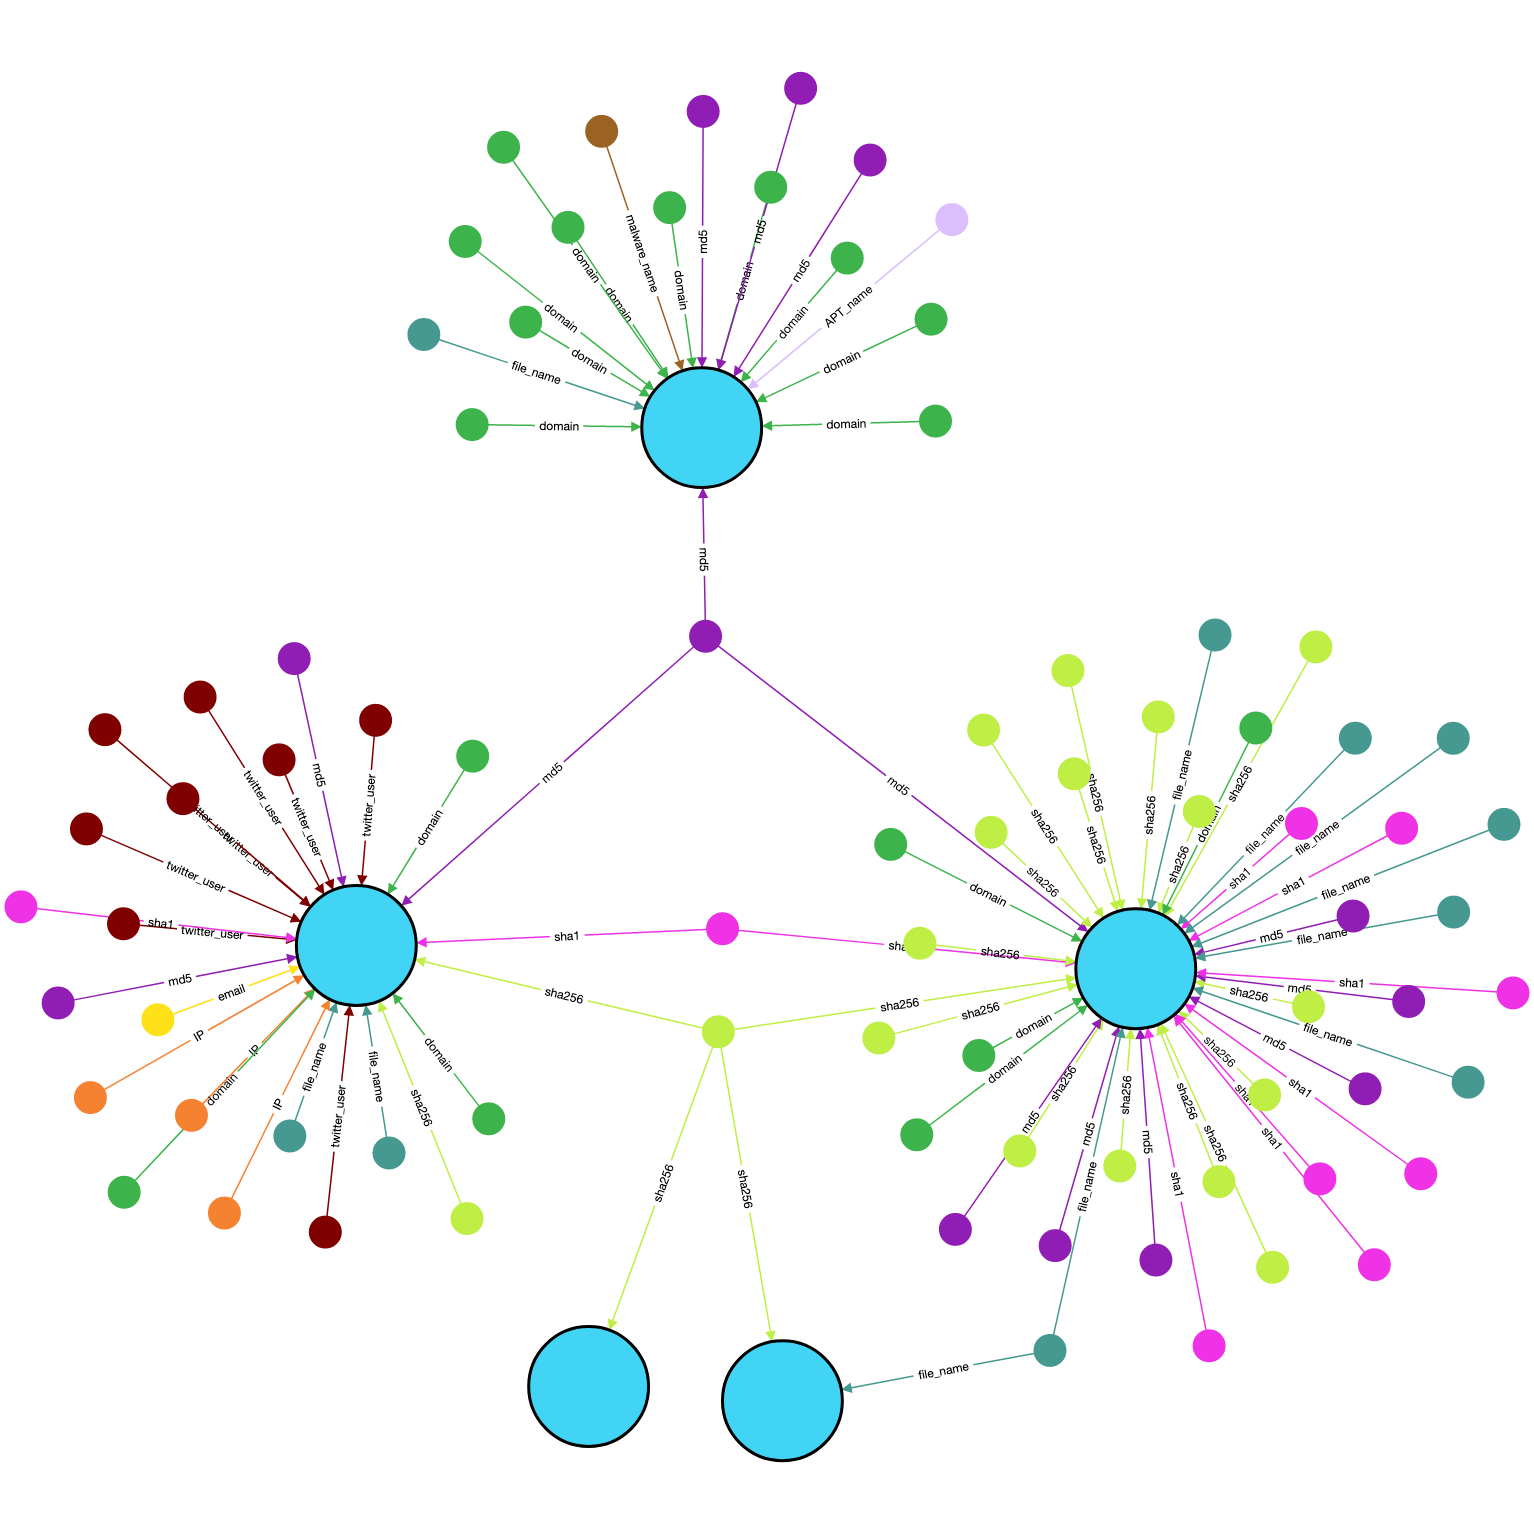
Next, we can query the neighbors of those three document nodes - the connectivity graph for this result is shown in Figure 4. Notably, there is a SHA1 and a SHA256 hash which were both in two of the node documents. These these two hashes and the md5 hash are all checksums of the same file.
Next, we expand the neighbor relationships for these two SHA1 and SHA256 hashes that were both contained in the two threat report nodes in order to see if there are relevant connections we can investigate further. This neighborhood expansion is shown in Figure 5. We see that there are two node documents that are linked to the SHA256 hash. These two nodes are threat reports. One of these threat reports is also linked to the earlier manalyzer report node by a common filename. However, this filename is simply the command prompt executable (cmd.exe). These two nodes represent slightly different versions of a threat report titled The Lazarus Constellation, authored by Avisa Partners. This specific malware hash is associated with the WannaCry ransomware. WannaCry is ransomware [35, 36, 37, 38, 39] that propagated across the world in 2017 targeting computers running Windows OS primarily using an exploit known as EternalBlue. Figure 6 shows the neighborhood of connections that the The Lazarus Constellation threat reports contain, which includes a large number of hashes, CVEs, domains, and filenames that are all associated with this APT group. This malware hash example shows how the graph database can retrieve relevant information for an IoC - here we were able to find two other hashes of the same file, a place where the hash was mentioned on a 4chan board, and finally threat reports which give the larger context of why these hashes are relevant.
3.2 Visual analysis: Qakbot IP address
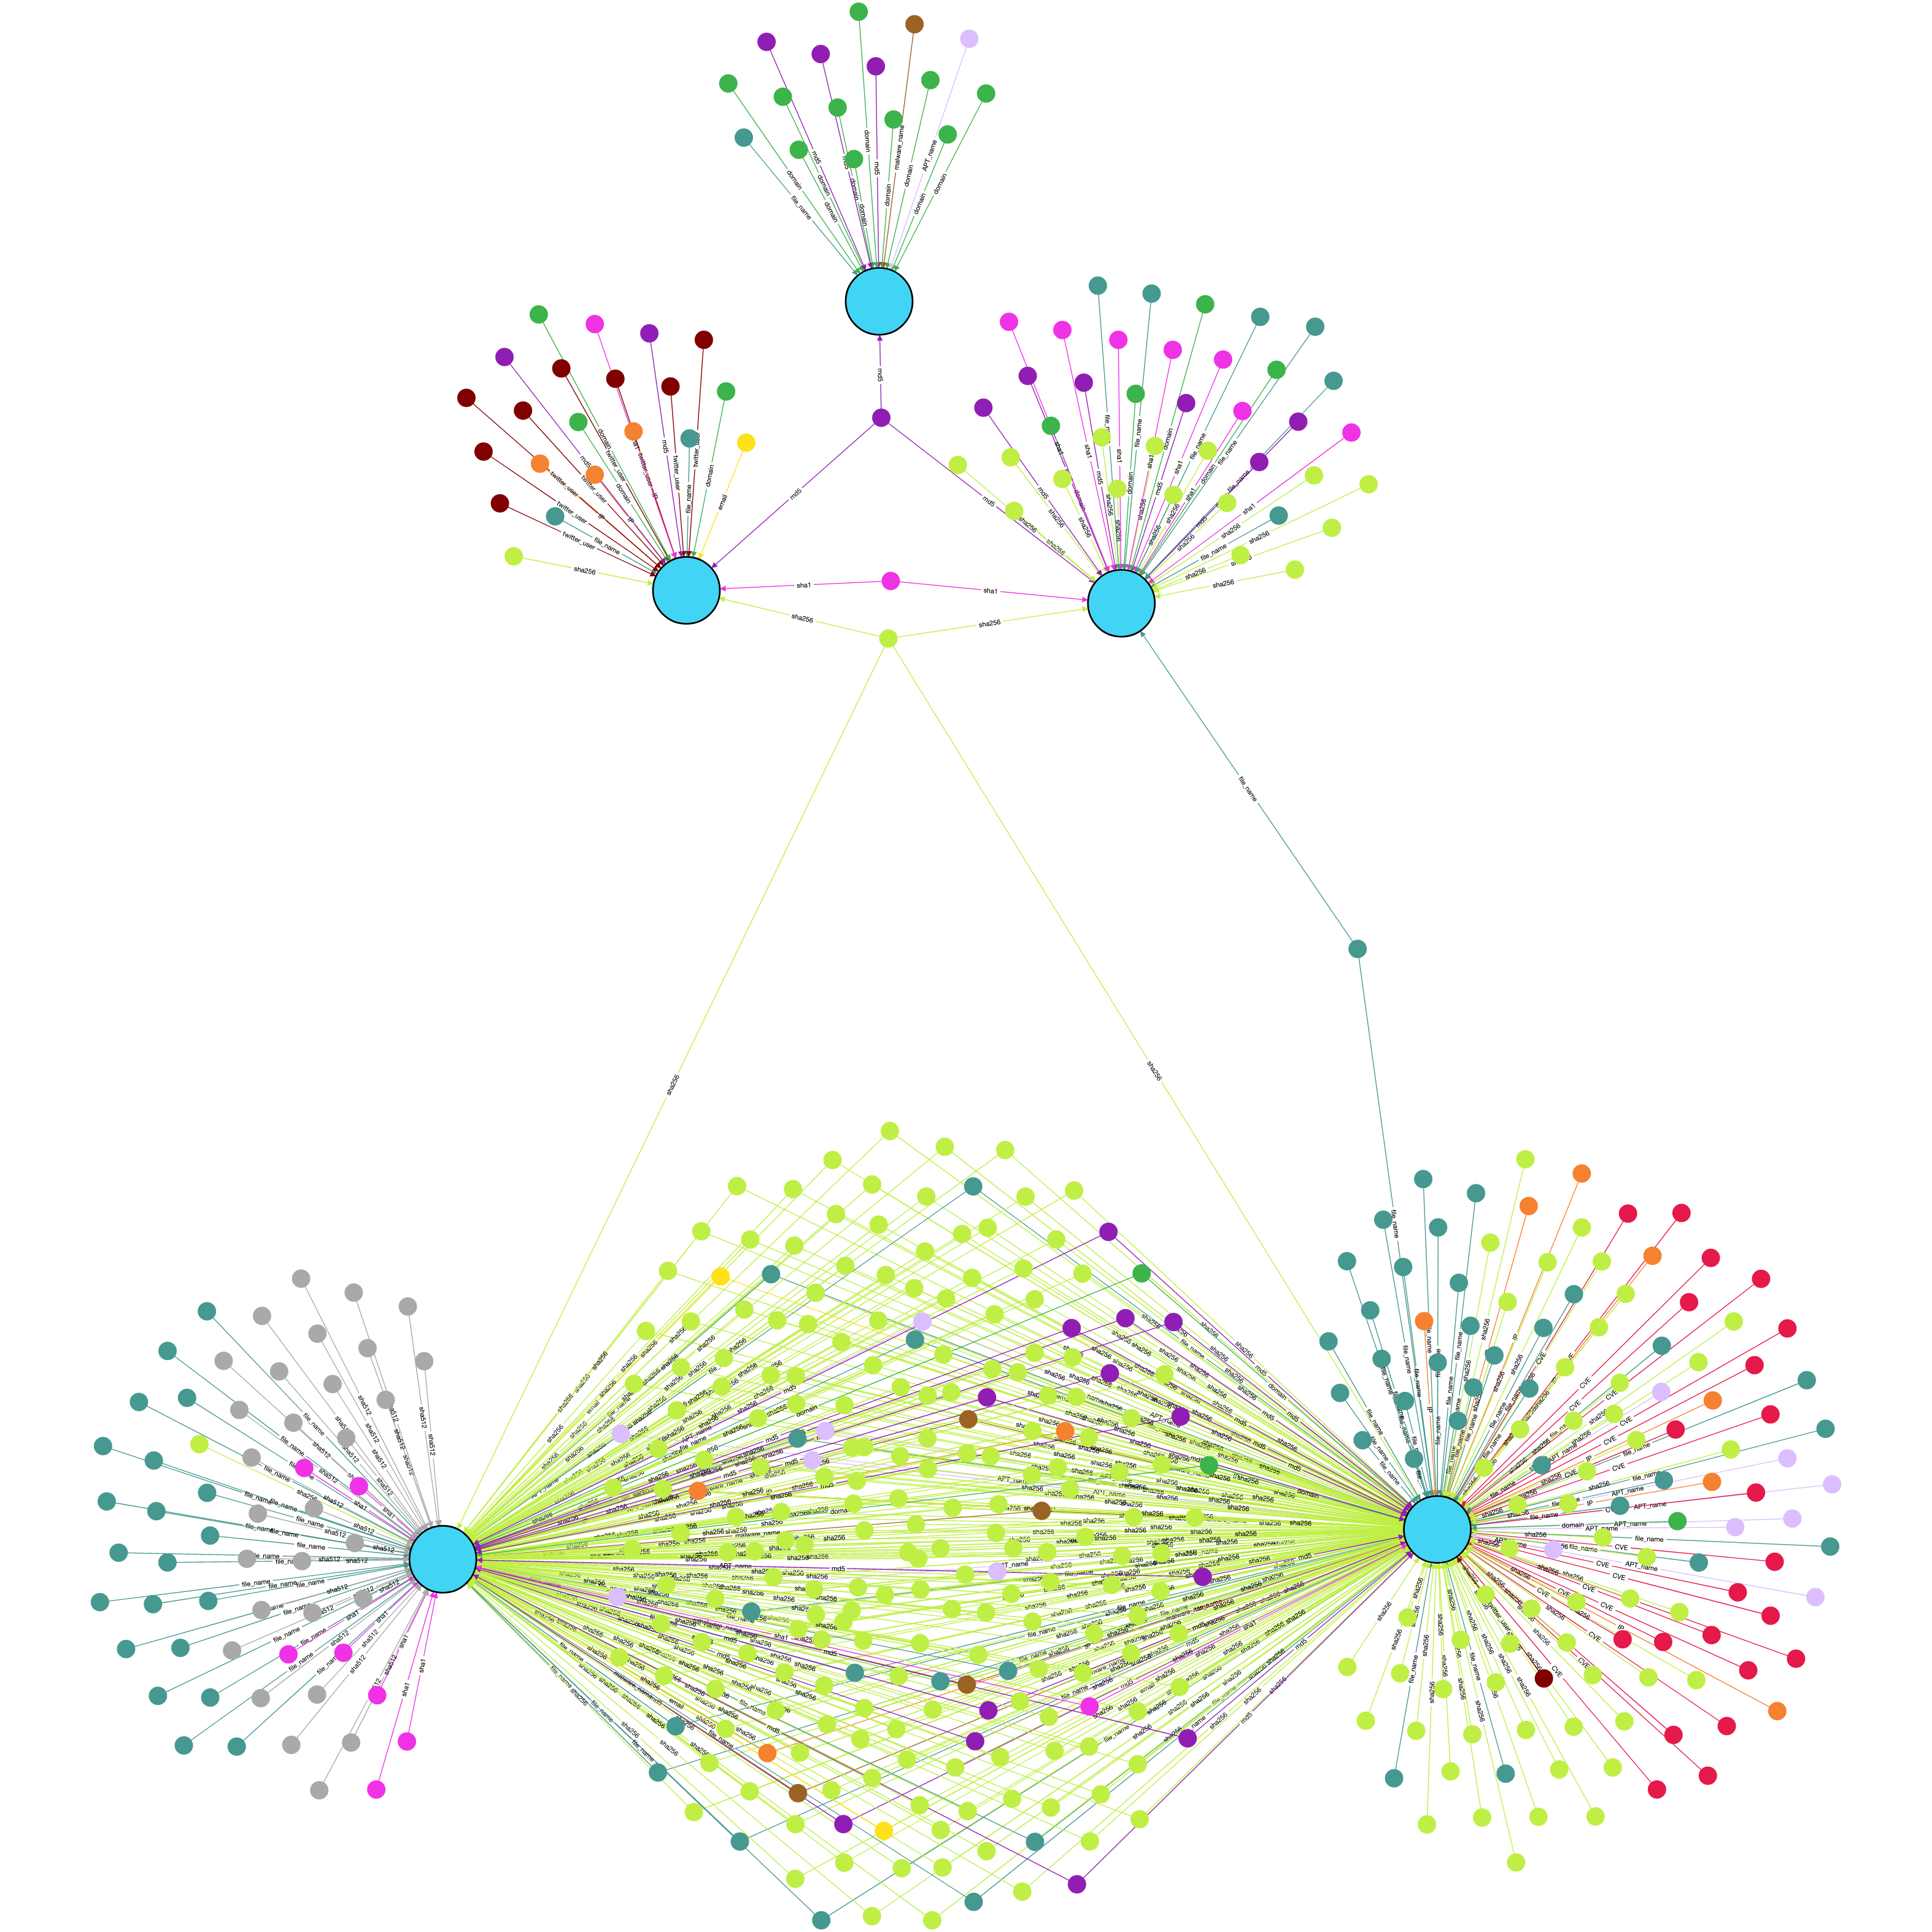
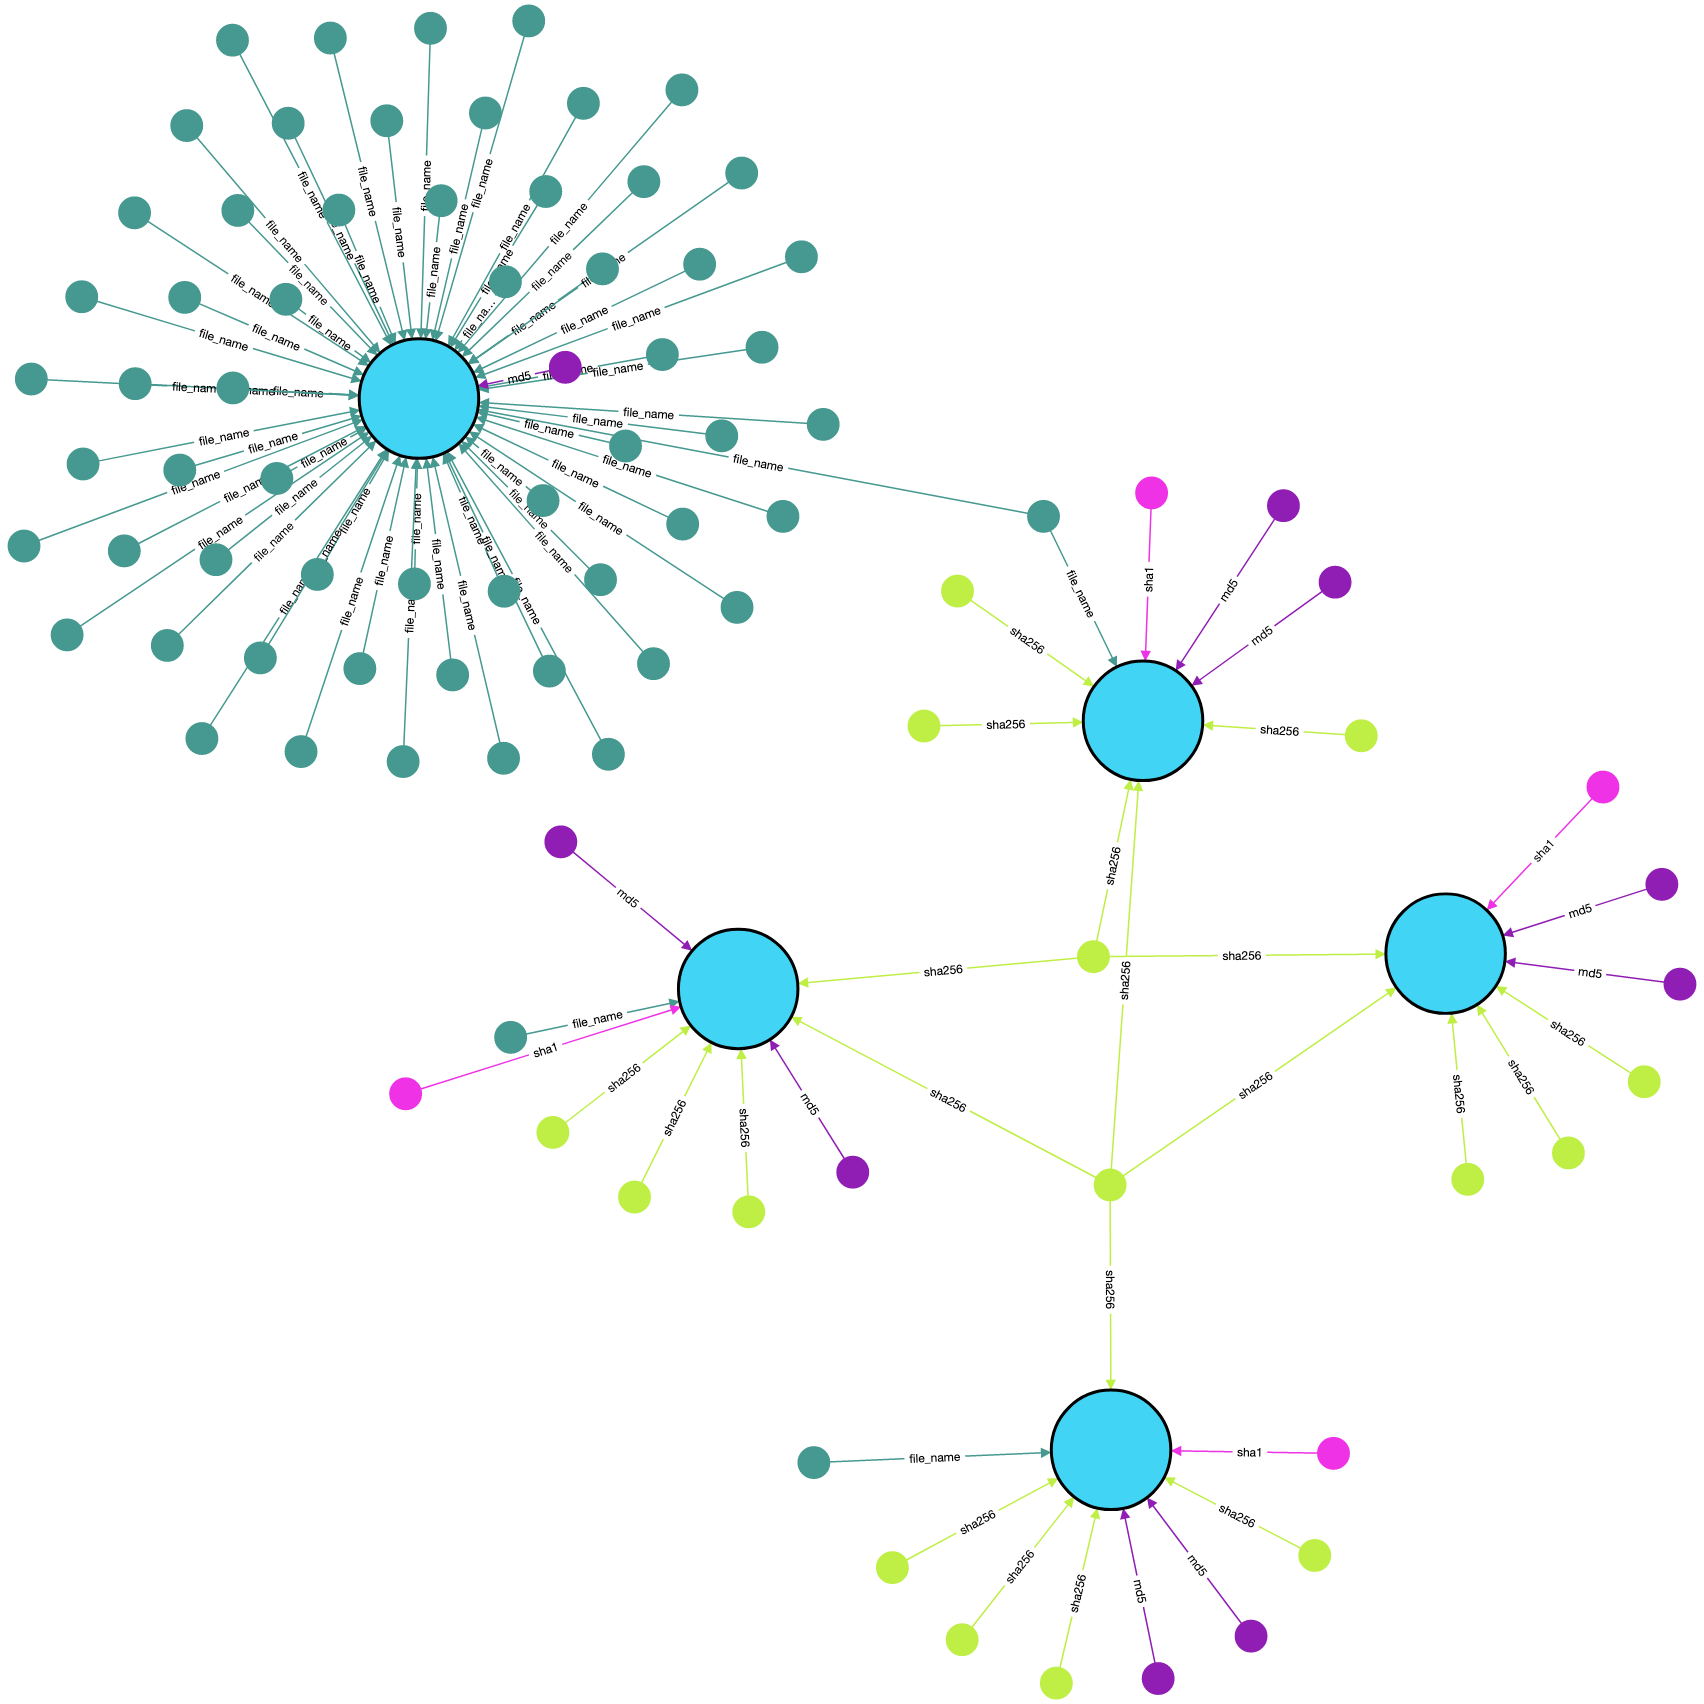
Next we will consider the connectivity graph around a known malicious IP address 89.101.97.139, which is the IP address for a command and control server for the malware called Qakbot. The connections showing where this IP address was mentioned in the database are shown in Figure 7. There were three document nodes which mentioned this IP address. Two of these documents were from Github repositories where known IoCs on Qakbot were published, and the third document is from a pastebin page which also posted Qakbot IoCs. Interestingly, there are several IP addresses that are common to all, or a subset, of these documents. Note that the malware name (brown colored degree three node near the center of the graph) was the name Qakbot. This graph shows the relevant context around this IP address - namely that it is a command and control server for Qakbot and the connectivity graph shows many additional IoCs that should be monitored in association with Qakbot. Importantly, these graph connections take advantage of multiple (separated) data sources - where if we were to have read only a single one of these documents we would not have the aggregated data which includes many more IP addresses and hash IoCs. It is clear from this graph that this specific IP address is not a lone command and cotnrol server for Qakbot, rather it is one of many IP addresses and domains that are connected to this malware. Figure 15 in the Appendix B shows significantly larger graph renderings for the degree 3 and 4 connections in the database from this IP address node.
3.3 Visual analysis: known exploited CVE
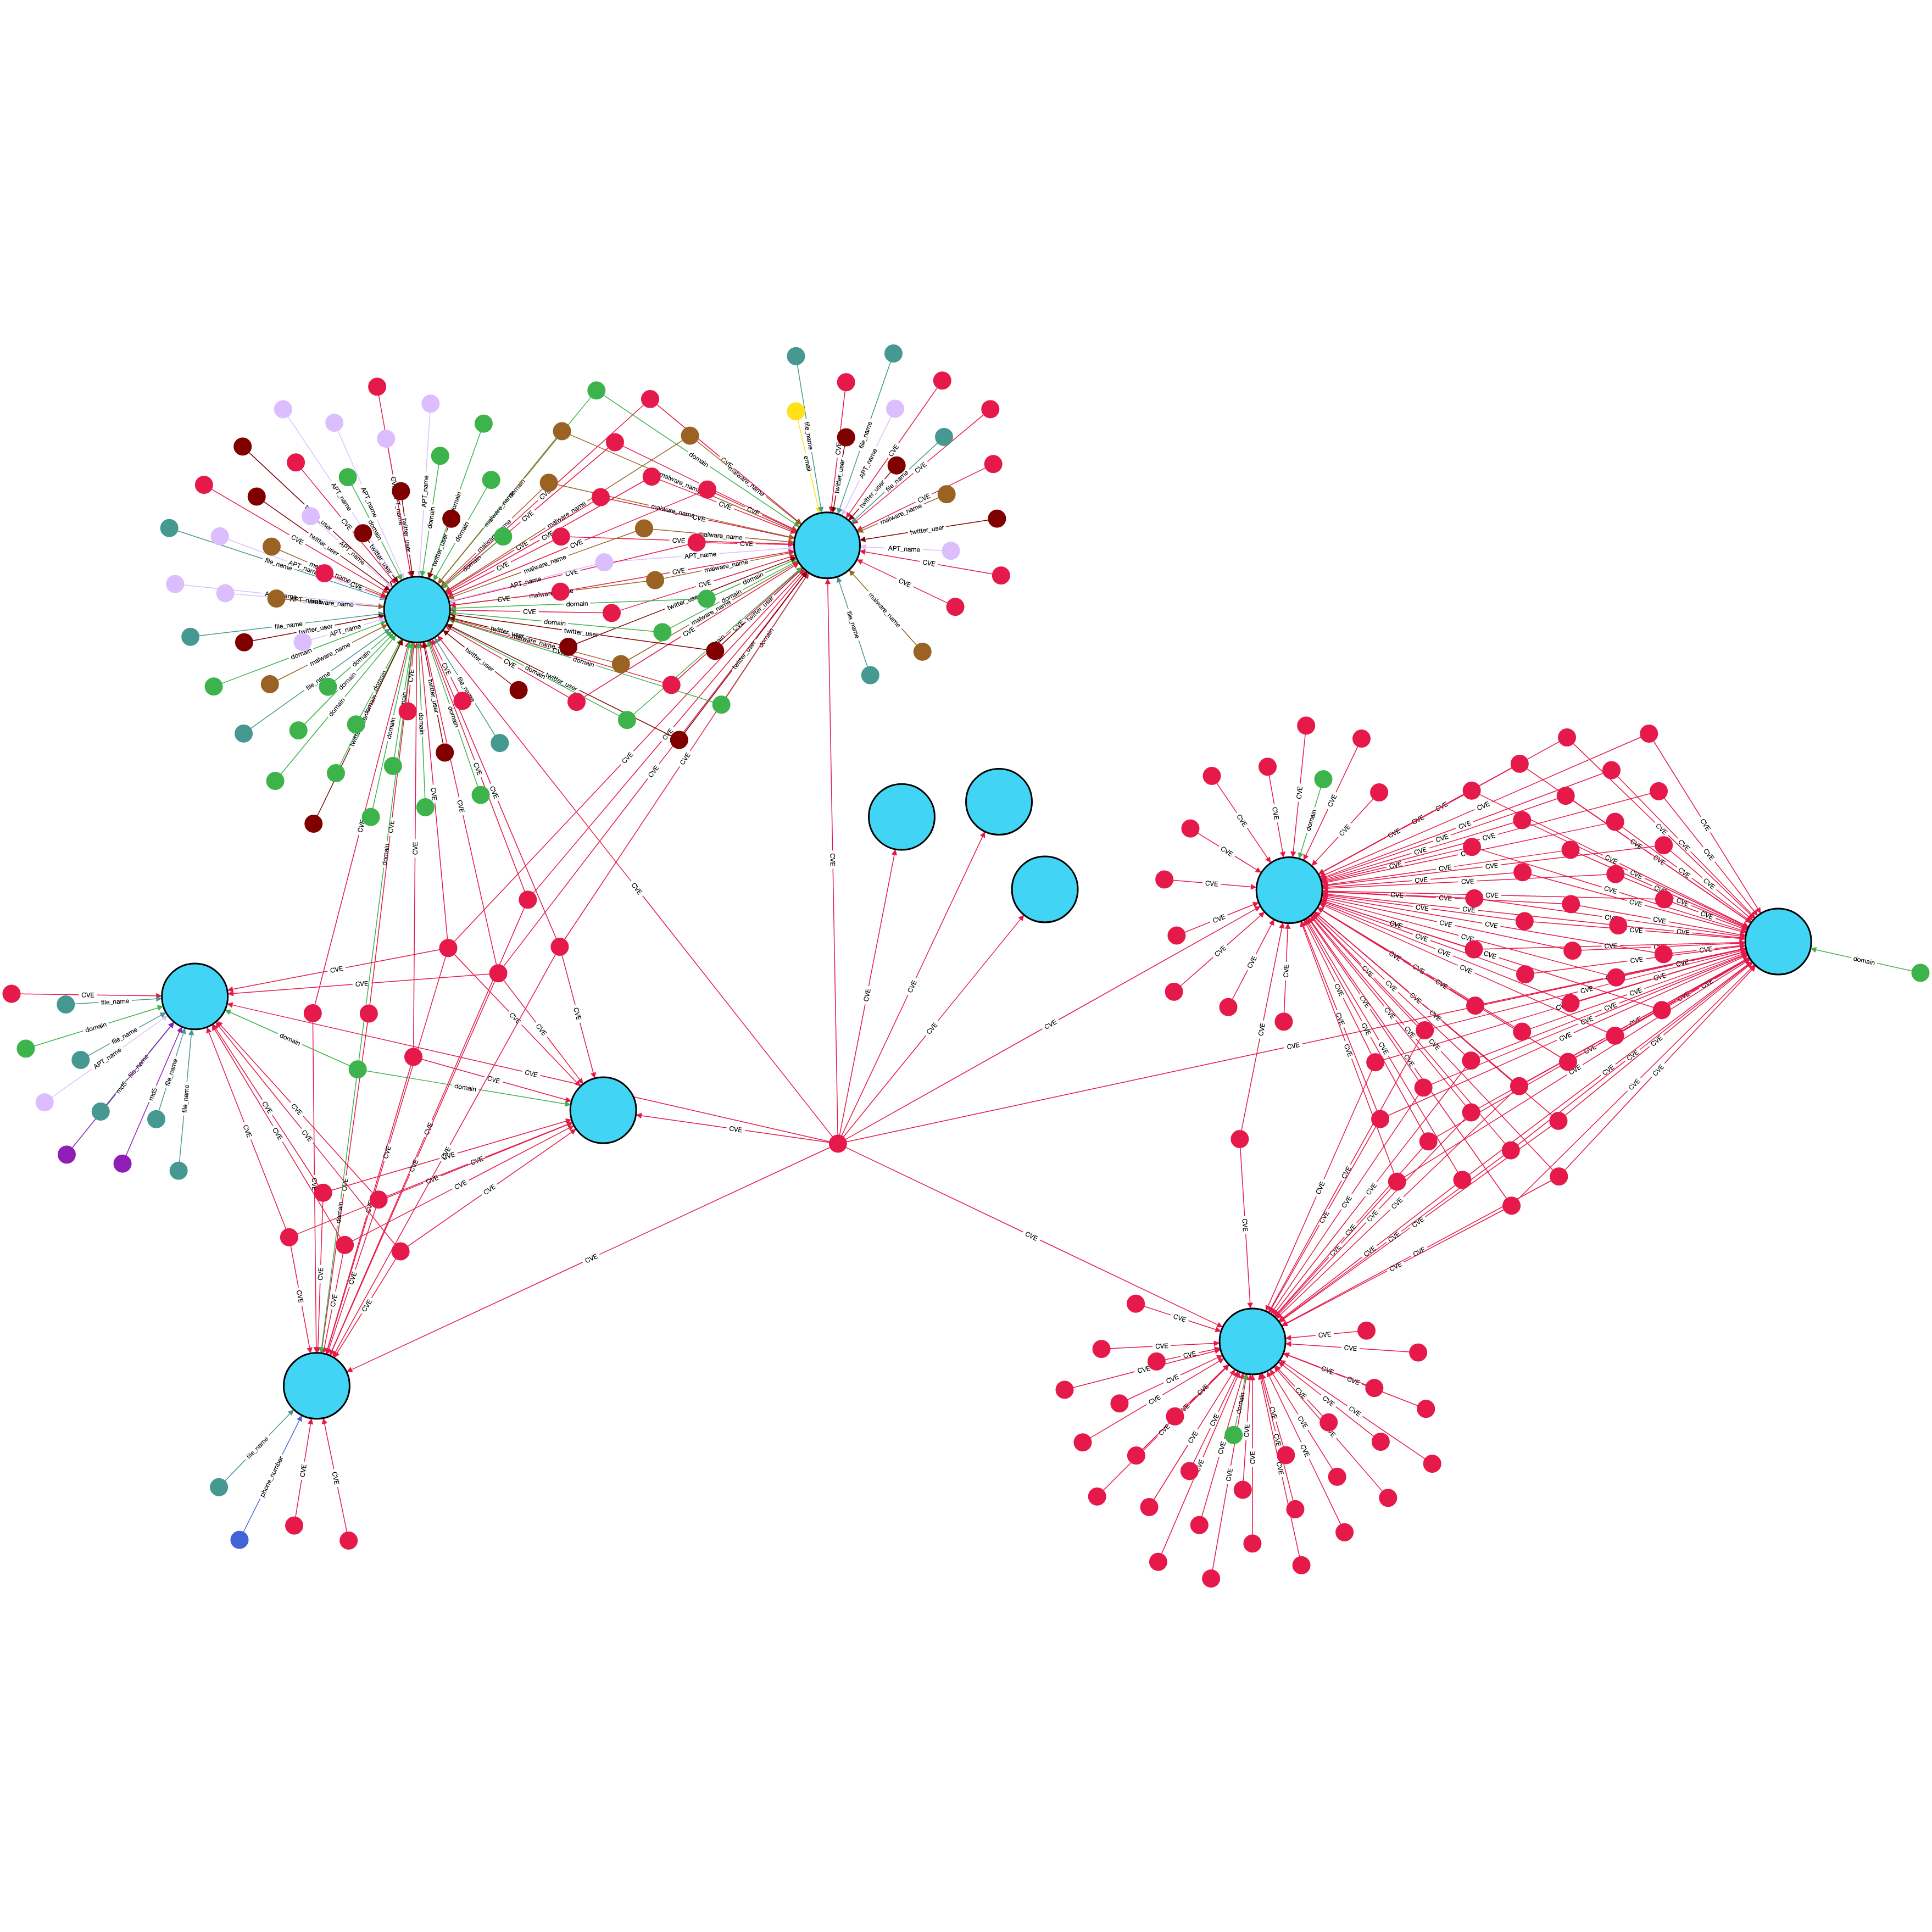
Here we show the connectivity graph for all neighboring nodes up to degree 2 away from a CVE that is known to be exploited in the wild666https://www.cisa.gov/known-exploited-vulnerabilities-catalog; CVE-2014-4404. CVE-2014-4404 is a remote code execution exploit on Apple OS X, earlier iOS versions and Apple TV. The neighborhood graph is shown in Figure 8. The neighboring nodes connected to this specific node are showing the halo of data that is connected to this CVE. In particular, these neighboring nodes show filenames, other CVEs, twitter usernames, domain names, hashes etc., that were mentioned along with this CVE in various documents. Two of these nodes were threat reports which described the state of various cyberattacks in 2021 - therefore they broadly discussed a number of different exploits, APT groups, twitter usernames, and malware families with CVE-2014-4404 being one of the more exploited Apple software CVEs. As one would expect, the CTC tool labelled each of these text documents that are in this halo as being cybersecurity related. This ML metadata can be used to filter for a subgraph of the graph database which contains only cybersecurity related (English) natural language.
3.4 Malware hash files: code and resource re-use
The static analysis antivirus [40] scan hash file data nodes that are formed in Neo4j include hashes of extracted files, functions, or strings contained within the malware (as well as the malware itself). What these additional hashes allow within the graph database is detection of shared code components, for example shared header files, strings, or functions. Of course some of these may not be incredibly useful indicators - for example they may be standard Portable Executable manifest files. However, if there are unique code artifacts in some subset of antivirus file scans which are known to be malicious, then those could serve as indicators of shared code re-use from a group. These could even serve as malware signatures for antivirus products. The graph database is good for investigating these shared resource hashes because it is easy to find where a set of antivirus scans have a shared resource hash node.
Here we provide a specific example - that is a SHA256 hash which we can search for in the Neo4j graph database with the Cypher syntax of:
MATCH p=(find:node_sha256 {name: ’84f7c54dc015637a28f06867607c2e0b
dd225d10debb1390ff212d91cd2d042b’}) RETURN p
Using FileScan777https://www.filescan.io, which contains references to this hash, we can find that this is a hash of the following English ASCII text: BundleInstall BundleInstall. Note that this representation is not necessarily capturing the full hexadecimal data present in the data segment. The terms bundle install suggest that the source code language is Ruby, and this text artifact could be a result of packaging Ruby source code into a portable executable.
Within the current Neo4j database, this SHA256 hash node has a degree of 5 (meaning that is referenced in 5 node documents). Two of these nodes are actually effectively duplicates - they are scans of the same file, meaning that they have the same file name and associated extracted hashes (such as the hashes of contained resources in the PE), but were scanned at different times and therefore have slightly different data so the direct de-duplication did not remove one of them. Therefore as with the other Neo4j figures in order to reduce clutter, one of these duplicates is removed in the displayed figures. The graph renderings of these nodes and their degree 1 neighborhood connections are shown in Figures 9.
For the bottom graph in Figure 9 we can examine what some of the important information is that the nodes have, such as the malware filename and the hash of the file. These four nodes are known malware samples (this statement is based on the high proportion of antivirus scans indicating malware) and additional information on them is available on VirusTotal.
Top document node in Figure 9: the filename is rkinstaller.exe and the full sha256 hash is given in the virustotal link888https://www.virustotal.com/gui/file/5577ce9aa4e4ec2735247c5769f0e84db599825f2d95159b0102f3b30e80b6bb/details.
Right document node in Figure 9: no associated filename and the full sha256 hash is given in the virustotal link999https://www.virustotal.com/gui/file/06f11f4a555a4891c93f13f82dc06e8bcedda2a71c8a5e6aa5c18da871f41238/details.
Bottom document node in Figure 9: the filename is rkinstaller364.exe and the full sha256 hash is given in the virustotal link101010https://www.virustotal.com/gui/file/f8d11b1e3e027355a11163049b530de4fd67183abd08a691d5d18744653ef575/details.
Left document node in Figure 9: the filename is poinstaller257.exe and the full sha256 hash is given in the virustotal link111111https://www.virustotal.com/gui/file/f3efcfc7121f2348deb6f3b5ffde60878d978c25281e67defdc288feaef8b38c/details.
The notable observation from this data is that this shared portable executable resource hash is a reasonably unique artifact (meaning that it is not a commonly re-used ASCII text segment in PE development) and was found across a small subset of malware samples, some of which also have other shared characteristics such as similar (or identical) file names. This suggests, with reasonable confidence, that the development of these pieces of malware are linked in a meaningful way, for example the same developer could have created these portable executables. This demonstrates where the graph database construction of OSint allows a user to link together pieces of information in order to group together seemingly unconnected documents and other potential indicators.
3.5 CVE degree and CVSS score
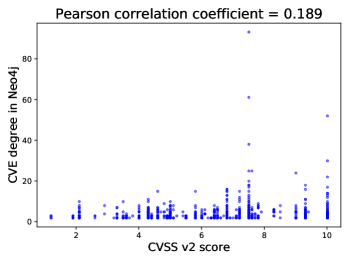
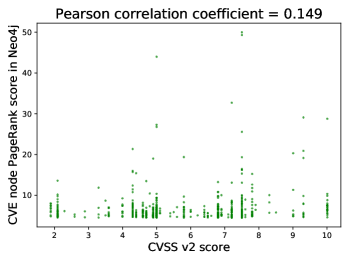
Because this database is constructed in a largely unsupervised manner - i.e., pattern matches are automatically generated and new data is added to the database without human review - a natural question that arises is whether the graph structure of the data represents the real world properties of the vulnerabilities or potential IoCs. An easy example of this that we can numerically compute is the degree of CVE nodes in the database (which corresponds to how many times that CVE was mentioned in the text from the different data sources) and compare that against the CVSS scores of CVEs. CVSS scores are intended to approximately represent the overall severity of the vulnerability [41, 42, 43, 44] where a CVSS score of is the lowest severity and is the maximum severity. There are two CVSS score versions that we will compare - CVSS version 2 and version 3. Version 3 is the newest CVSS scoring method, which is intended to be a more accurate rating scale for modern cybersecurity threats.
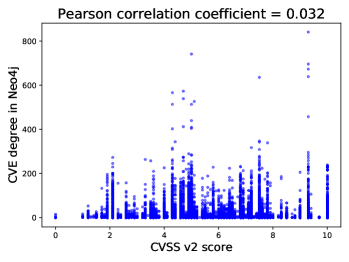
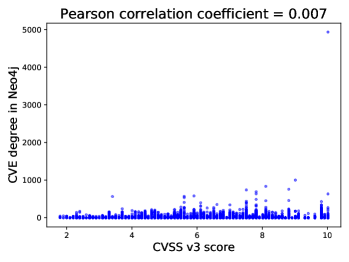
The relevant question is whether there exists a relationship of increasing degree of the CVE nodes in the graph database with respect to CVE CVSS score. Intuitively, if the severity of a CVE corresponds to how frequently that CVE is mentioned in social media, news, and threat reports, then higher CVSS scores will correspond to higher degree CVE nodes in the Neo4j graph database. The CVSS scores are retrieved from the NIST NVD dataset 121212https://nvd.nist.gov. To this end, we compute the Pearson correlation coefficient between CVE node degrees and their CVSS score using scipy in python [45, 46, 47, 48]. Some CVEs do not have a version 2 or a version 3 score, and therefore are not able to plotted in this dataset.
Figure 11 plots all CVE CVSS scores against CVE node degrees in the Neo4j graph database, which shows there is not a positive or linear correlation between the CVE node degrees and CVSS scores. This is notable because it shows that across all of the cybersecurity mentioned natural text that was gathered, there is not a strong correlation between the rate of CVE mentions (e.g. CVE popularity) and CVSS scores. However, it could be the case that more focused cybersecurity documents have a higher CVE CVSS score and Neo4j node degree correlation. It could also be the case there is not a strong signal of correlation for CVE nodes which are not commonly mentioned in news, threat reports, and cybersecurity bulletins - and therefore only considering nodes which have at least a degree of could remove some noise in the dataset. Lastly, due to popularity of new CVEs, necessarily the web scraping will have a temporal bias for the times during which the spiders were operating.
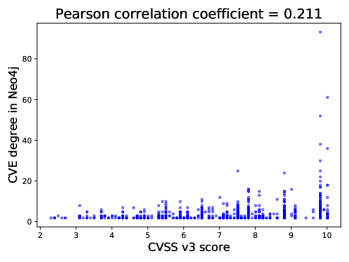
Figure 12 shows the correlation plot for CVE node degrees vs CVSS score, but the Neo4j node degrees are computed using a restricted set of document sources namely reputable blogs, information sites, and threat reports - specifically fireeye131313https://www.trellix.com/en-us/about/newsroom/stories/threat-labs.html, all threat reports, proofpoint141414https://www.proofpoint.com/us/blog/threat-insight, exploitdb151515https://www.exploit-db.com/, the Hackernews161616https://thehackernews.com/. Additionally, CVE nodes with degree are not included in this computation since low degree nodes do not necessarily provide a strong signal in regards to how referenced that CVE is. Lastly, the data in Figure 12 are restricted to the years during which the OSint crawler system was operational [23] because there is an inherent temporal bias in regards to what web pages are mentioned and scraped. Because only a subset of the CVEs had CVSS v3 scores, there were fewer data points available for those plots. In Figure 12 we observe that there is a weak to median linear positive correlation between CVSS score and Neo4j degree for the documents that are cybersecurity domain focused. Interestingly, there is a slightly higher Pearson correlation () for CVSS version 2 compared to version 3 (). This shows that taking into account the source of the data, temporal bias, and not considering degree nodes shows that there is a CVSS and CVE node degree correlation, as opposed to these correlations shown in the entire dataset in Figure 11. There are two potential reasons why the CVSS score - node degree correlations are only weakly linear in Figure 12:
-
1.
The inherent bias present in the documents from the web crawlers - i.e., a CVE could be more commonly discussed on social media or news sites because of a reason other than its significance for cybersecurity. This reason seems to be the most prevalent due to the presence of social media and news content. In essence, the frequency of mentions of a CVE are more related to what catches attention than severity of the vulnerability.
-
2.
The CVSS score does not perfectly reflect the real world severity of a given CVE.
| CVE ID | CVE node Page Rank score in Neo4j | Vulnerability name and description | In CISA known exploited vulnerability catalog | CVSS score v2 | CVSS score v3 |
|---|---|---|---|---|---|
| CVE-2021-44228 | 758.1 | Apache Log4j2 Remote Code Execution Vulnerability | Yes | 9.2 | 10.0 |
| CVE-2021-45046 | 113.06 | It was found that the fix to address CVE-2021-44228 in Apache Log4j 2.15.0 was incomplete in certain non-default configurations. | No | 5.1 | 9.0 |
| CVE-2021-34527 | 106.21 | “PrintNightmare” - Microsoft Windows Print Spooler Remote Code Execution Vulnerability | Yes | 9.0 | 8.8 |
| CVE-2017-11882 | 95.64 | Microsoft Office memory corruption vulnerability | Yes | 9.3 | 7.8 |
| CVE-2012-0158 | 86.71 | Microsoft MSCOMCTL.OCX Remote Code Execution Vulnerability | Yes | 9.3 | N/A |
| CVE-2014-0160 | 81.13 | OpenSSL Information Disclosure Vulnerability. “heartbleed” | Yes | 5.0 | 7.5 |
| CVE-2021-34481 | 73.47 | Windows Print Spooler Elevation of Privilege Vulnerability | No | 4.6 | 7.8 |
| CVE-2021-45105 | 70.92 | Apache Log4j2 versions 2.0-alpha1 through 2.16.0 (excluding 2.12.3 and 2.3.1) did not protect from uncontrolled recursion from self-referential lookups. | No | 4.3 | 5.9 |
| CVE-2021-1675 | 64.43 | Microsoft Windows Print Spooler Remote Code Execution Vulnerability | Yes | 9.3 | 8.8 |
| CVE-2021-40444 | 59.45 | Microsoft MSHTML Remote Code Execution Vulnerability | Yes | 6.8 | 7.8 |
| CVE-2017-0199 | 56.32 | Microsoft Office/WordPad Remote Code Execution Vulnerability with Windows API | Yes | 9.3 | 7.8 |
3.6 CVE Page Rank
Neo4j has a library called Graph Data Science (GDS) which contains various graph algorithms that can be executed on a graph that is stored in Neo4j. These graphs algorithms could be useful for identifying patterns and clusters in this specific potential IoC graph database. As a simple example of how the structure of the graph yields node rankings based only on the reference to potential IOCs and vulnerability IDs, Table 2 details the top 11 highest ranked CVEs in the (undirected) graph database according to the PageRank algorithm. PageRank [49, 50] is an algorithm, originally designed for search engine ranking, which can be applied to any network data structure to determine which nodes are the most influential and referenced (here a reference is simply an edge in the network). All parameters were set to default for the PageRank computation with the exception of maxIterations which was set to and dampingFactor which was set to instead of the typical . The reasoning for selecting a smaller damping factor than what is typically used in search engines is that in this specific graph we are interested in potentially longer range influences on the relevance of nodes.
The PageRank scores in Table 2 clearly show that the most referenced CVE nodes in the graph database are high impact and well known CVEs including the heartbleed, Log4j, and PrintNightmare vulnerabilities. The only two CVEs which are not currently in the CISA known exploited catalog are follow up CVEs to the Log4j vulnerability. All of these CVEs not only are high impact and typically rank high on CVSS scores, but they are also notable because of how widespread their discussion was throughout the various social media channels, in large part because of the wide user base of the software these vulnerabilities exploit, that this graph database is constructed from.
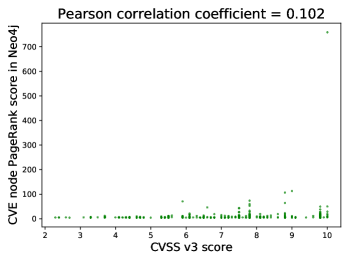
Another natural question that arises from the PageRank scores, is how those scores relate to the CVE CVSS score. Table 2 shows that there does seem to be at least some correlation, where the high PageRank score CVEs have high CVSS scores. Similar to the degree correlation plots in Figures 11 and 12, in Figure 13 CVE node PageRank scores are plotted against CVSS scores. Because the majority of the OSint crawler data is temporally biased towards the more recent years of data gathering, the datapoints plotted in Figure 13 are restricted to the years during which the OSint crawler system was operational [23], the same as in Figure 12. Additionally, in order to filter only for nodes which have a robust distribution of neighbors in the graph, only points with a PageRank score of or over is plotted. Figure 13 shows that there is a low to medium linear correlation for the relevance, i.e. the PageRank score, against the CVE CVSS scores. Interestingly, the CVSS v3 scores are more correlated with the PageRank scores. This could indicate that the CVSS v3 scores more accurately represent the severity of the CVE’s compare to CVSS v2.
4 Discussion and Conclusion
There are primarily two technical challenges that still need to be improved in this data gathering and analysis pipeline:
-
1.
There are many instances of near duplicate content from the web crawling system. For example, the content of a web page could be slightly altered from day to day (for example even if the web page content includes the current date and time); and if the web crawlers end up at that same web page multiple times direct de-duplication will not remove the content for being a near duplicate. Another example of near duplicate content that occurs often is that the web-crawling will catch a social media conversation (for example a Reddit thread) while it is occurring. We want the crawlers to catch this type of conversation because they could save content that is removed at some point in the future, but it also leads to potentially a large number of near duplicates of the same social media thread as it evolves over time. The challenge is in quantifying how close a document is to being a duplicate in order to remove it; in particular computing a distance metric pairwise between all documents can be very computationally intensive. A reasonable solution could be to not remove near duplicates, but instead to take the union of near duplicate documents, and to compute similarity metrics among close clusters of documents (for example determined by their relationship in the Neo4j potential IoC graph) for finding near duplicates.
-
2.
Reduce the amount of noise in the data set. It is difficult to know a-priori which content is relevant, and therefore in this work we tend to gather more information rather than remove potentially not useful information. This allows the database to be able to catch interesting edge cases and atypical cybersecurity content, but it comes at the cost of increased noise. However, there are some consistent sources of noise which are almost always not relevant which can be manually filtered out. For example localhost IP addresses or standard file names from popular programs. Another example of noise in the data set is software version numbers being identified as IP addresses due to the similarity in their format in text. It is not clear how to reduce the noise in the data set uniformly across all document types of potential IoCs, however, machine learning algorithms which more closely identify relevant information in a piece of text could be used to better filter the data.
There are additional potential indicators and vulnerability tracking ids that could be extracted from natural language text in future work, such as CWE’s (Common Weakness Enumeration).
Aggregating and condensing open source intelligence into a human readable and easily searchable form is an important task given the scale of the data that is available in the form of social media, news, blogs and threat reports in the cybersecurity space. Here we present one possible way to address this problem by parsing and transforming the open source data into a graph structure where each document can be associated with potential cybersecurity indicators of compromise, other infrastructure, CVEs, or MITRE ATT&CK Techniques. Querying this database based on the indicators then allows analysts to find open source intelligence documents connected to that indicator and review their content; this graph database thus reduces the overhead required in searching a massive amount of open source documents to a succinct cloud of relevant documents.
5 Acknowledgements
Sandia National Laboratories is a multimission laboratory managed and operated by National Technology and Engineering Solutions of Sandia, LLC., a wholly owned subsidiary of Honeywell International, Inc., for the U.S. Department of Energy’s National Nuclear Security Administration under contract DE-NA-0003525. The New Mexico Cybersecurity Center of Excellence (NMCCoE) is a statewide Research and Public Service Project supported center for economic development, education, and research. The authors would like to thank both SNL and NMCCoE for funding and computing system access and support.
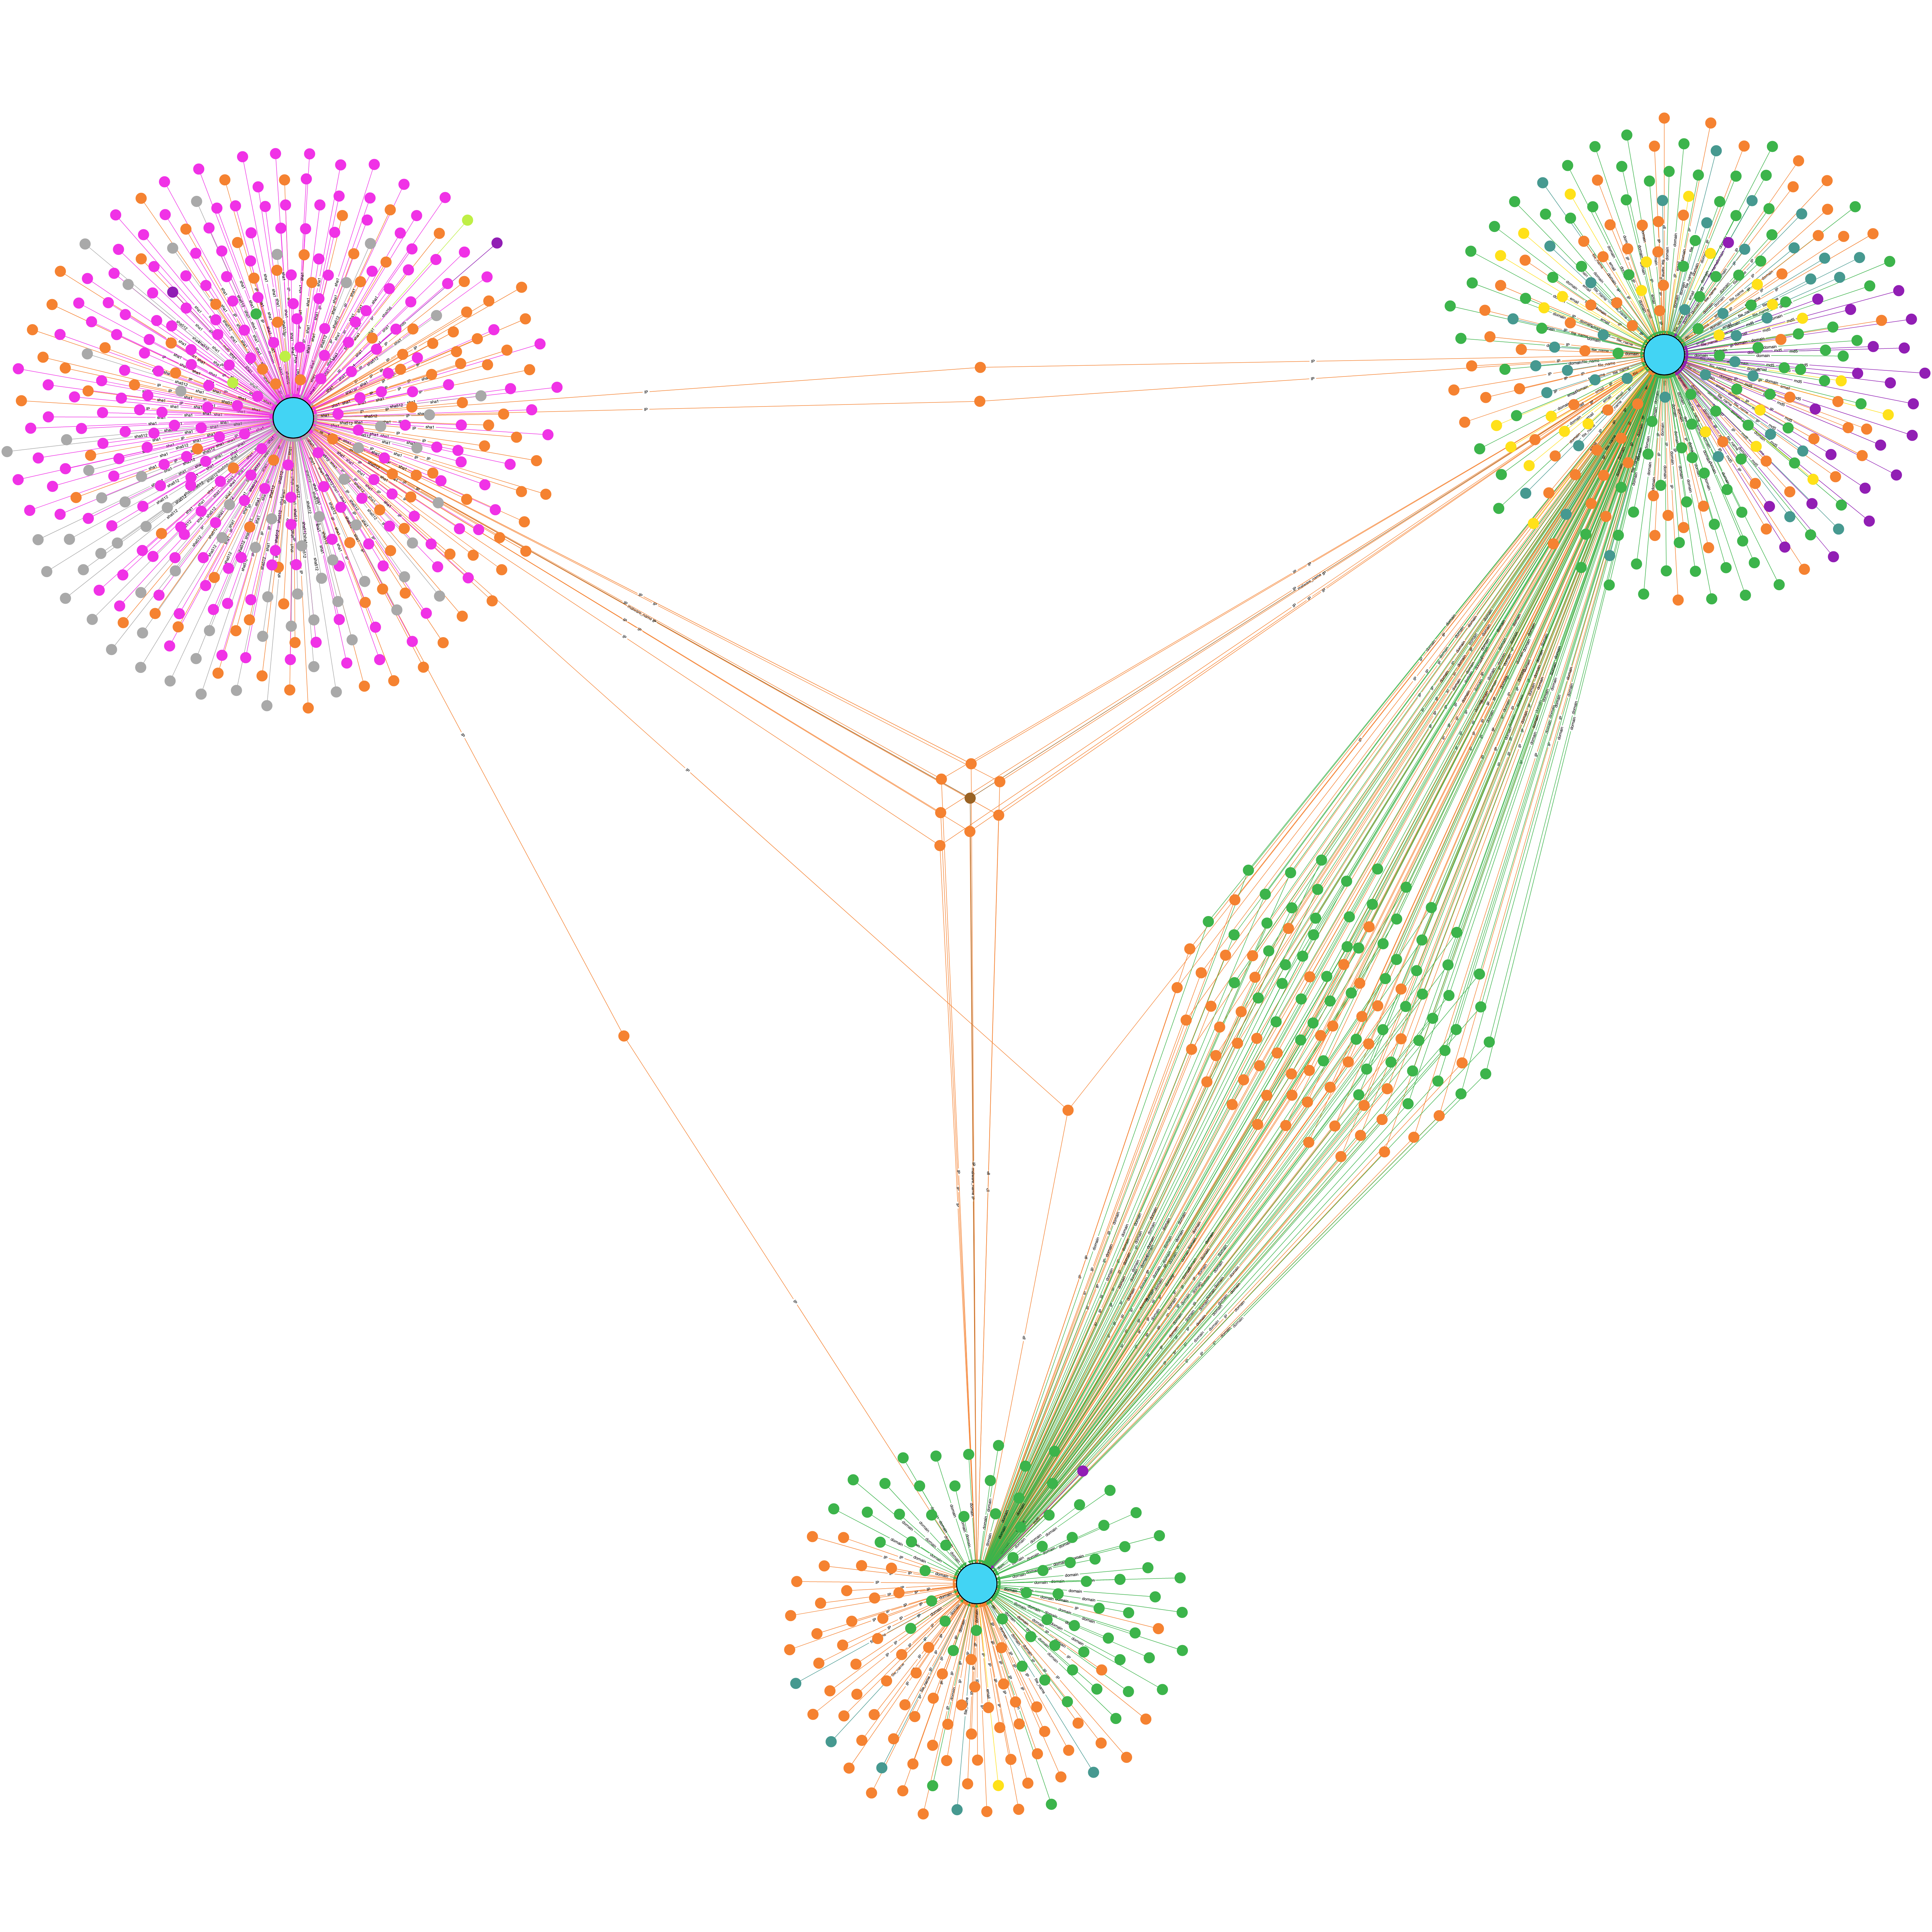
Appendix A Portable Executable malware visualization

Figure 14 shows visualizations of three malware examples which contain a common PE resource artifact which was identified by its sha256 checksum. These three examples are different from the Neo4j nodes (specifically their hashes are not the same). These three distinct PE samples are also accessible on VirusTotal 171717https://www.virustotal.com/gui/file/34aa24656d5527a5ff1f7eb4ce4e782085618ded3766730c81f8f16a15d7e0ce 181818https://www.virustotal.com/gui/file/4f0d5a81b8a5bc3f998a0ac7a37db5bad49e1a22173251ed916363375360d5a4 191919https://www.virustotal.com/gui/file/8b53201f1914764f384c6ec5a7a5c5ab2924afaf382d2bbe79f68e43e5dfa3ba. This suggests that this particular indicator, while unique and not very common, is likely seen on other static analysis tools beyond these two datasets. These visualizations were generated using FileScan202020https://www.filescan.io and PortEx212121https://github.com/struppigel/PortEx.
Appendix B Large graph visualization
Expanding out the network connections that exist in the Neo4j graph database is difficult to show visually because of the scale of the graphs in terms of edges and nodes. Here though in Figure 15 we show two large graph examples, which is possible using pygraphistry222222https://github.com/graphistry/pygraphistry and networkx [51] in python3. The graphistry version which was used to generate these figures is 2.39.32, and the graph layout algorithm is ForceAtlas2Barnes. The primary observation that is important from Figure 15 is that just a couple of degrees out from an indicator can already result in a very large graph, even though the entire graph database is very sparse. One of the reasons for this is that different types of indicators, names, and vulnerability IDs will naturally be mentioned at different rates in the gathered internet text. For example, popular malware names will be very common in cybersecurity text, whereas hashes will generally not be mentioned very frequently. Therefore, it is important to filter down to the types of edges you want to follow in the database when you are searching for specific indicators - for example by searching only for IP and domain edges if you are searching for server infrastructure connections. It is also useful in these cases to use the CTC metadata and language detection metadata in order to search specifically for document nodes which are, with high confidence, English text discussing cybersecurity in order to get more relevant text. When there is limited information available on an indicator or document, searching through all available network connections (such as in the malware hash cases shown in Sections 3.1 and 3.4) can also be useful.
References
- [1] Michael Glassman and Min Ju Kang “Intelligence in the internet age: The emergence and evolution of Open Source Intelligence (OSINT)” In Computers in Human Behavior 28.2 Elsevier, 2012, pp. 673–682 DOI: 10.1016/j.chb.2011.11.014
- [2] João Rafael Gonçalves Evangelista, Renato José Sassi, Márcio Romero and Domingos Napolitano “Systematic literature review to investigate the application of open source intelligence (osint) with artificial intelligence” In Journal of Applied Security Research 16.3 Taylor & Francis, 2021, pp. 345–369 DOI: 10.1080/19361610.2020.1761737
- [3] Robert David Steele “Open source intelligence” In Handbook of Intelligence Studies Routledge, 2007, pp. 147–165
- [4] Aritran Piplai et al. “Knowledge enrichment by fusing representations for malware threat intelligence and behavior” In 2020 IEEE International Conference on Intelligence and Security Informatics (ISI), 2020, pp. 1–6 IEEE DOI: 10.1109/ISI49825.2020.9280512
- [5] Peng Gao et al. “A System for Efficiently Hunting for Cyber Threats in Computer Systems Using Threat Intelligence” In 2021 IEEE 37th International Conference on Data Engineering (ICDE), 2021, pp. 2705–2708 DOI: 10.1109/ICDE51399.2021.00309
- [6] Nidhi Rastogi et al. “MALOnt: An Ontology for Malware Threat Intelligence” In Deployable Machine Learning for Security Defense Cham: Springer International Publishing, 2020, pp. 28–44
- [7] Onur Catakoglu, Marco Balduzzi and Davide Balzarotti “Automatic extraction of indicators of compromise for web applications” In Proceedings of the 25th International Conference on World Wide Web, 2016, pp. 333–343 DOI: 10.1145/2872427.2883056
- [8] Yuta Kazato, Yoshihide Nakagawa and Yuichi Nakatani “Improving maliciousness estimation of indicator of compromise using graph convolutional networks” In 2020 IEEE 17th Annual Consumer Communications & Networking Conference (CCNC), 2020, pp. 1–7 IEEE DOI: 10.1109/CCNC46108.2020.9045113
- [9] Ryan Christian, Sharmishtha Dutta, Youngja Park and Nidhi Rastogi “An Ontology-Driven Knowledge Graph for Android Malware” In Proceedings of the 2021 ACM SIGSAC Conference on Computer and Communications Security, CCS ’21 Virtual Event, Republic of Korea: Association for Computing Machinery, 2021, pp. 2435–2437 DOI: 10.1145/3460120.3485353
- [10] Benjamin Bowman and H. Howie Huang “Towards Next-Generation Cybersecurity with Graph AI” In SIGOPS Oper. Syst. Rev. 55.1 New York, NY, USA: Association for Computing Machinery, 2021, pp. 61–67 DOI: 10.1145/3469379.3469386
- [11] Yongfu Wang et al. “The Analysis Method of Security Vulnerability Based on the Knowledge Graph” In 2020 the 10th International Conference on Communication and Network Security, ICCNS 2020 Tokyo, Japan: Association for Computing Machinery, 2021, pp. 135–145 DOI: 10.1145/3442520.3442535
- [12] Shuqin Zhang, Minzhi Zhang, Hong Li and Guangyao Bai “Threat Analysis of IoT Security Knowledge Graph Based on Confidence” In Emerging Technologies for Education Cham: Springer International Publishing, 2021, pp. 254–264
- [13] Sharmishtha Dutta et al. “Knowledge Graph for Malware Threat Intelligence” Unpublished, 2021 DOI: 10.13140/RG.2.2.27340.95367
- [14] Justin J Miller “Graph database applications and concepts with Neo4j” In Proceedings of the Southern Association for Information Systems Conference, Atlanta, GA, USA 2324.36, 2013
- [15] José Guia, Valéria Gonçalves Soares and Jorge Bernardino “Graph Databases: Neo4j Analysis.” In ICEIS (1), 2017, pp. 351–356
- [16] Jaroslav Pokorny “Graph databases: their power and limitations” In Ifip International Conference on Computer Information Systems and Industrial Management, 2015, pp. 58–69 Springer
- [17] Hongcheng Huang and Ziyu Dong “Research on architecture and query performance based on distributed graph database Neo4j” In 2013 3rd International Conference on Consumer Electronics, Communications and Networks, 2013, pp. 533–536 IEEE
- [18] Łukasz Warchał “Using Neo4j graph database in social network analysis” In Studia Informatica 33.2A, 2012, pp. 271–279
- [19] Pengcheng Liu et al. “Construction of typhoon disaster knowledge graph based on graph database Neo4j” In 2020 Chinese Control And Decision Conference (CCDC), 2020, pp. 3612–3616 IEEE
- [20] Steven Noel et al. “CyGraph: graph-based analytics and visualization for cybersecurity” In Handbook of Statistics 35 Elsevier, 2016, pp. 117–167 DOI: 10.1016/bs.host.2016.07.001
- [21] Yan Jia et al. “A practical approach to constructing a knowledge graph for cybersecurity” In Engineering 4.1 Elsevier, 2018, pp. 53–60 DOI: 10.1016/j.eng.2018.01.004
- [22] Cliff Joslyn et al. “Massive scale cyber traffic analysis: a driver for graph database research” In First International Workshop on Graph Data Management Experiences and Systems, 2013, pp. 1–6 DOI: 10.1145/2484425.2484428
- [23] Donovan Jenkins, Lorie M. Liebrock and Vince Urias “Designing a Modular and Distributed Web Crawler Focused on Unstructured Cybersecurity Intelligence” In 2021 International Carnahan Conference on Security Technology (ICCST), 2021, pp. 1–6 DOI: 10.1109/ICCST49569.2021.9717379
- [24] Elijah Pelofske, Lorie M Liebrock and Vincent Urias “A Robust Cybersecurity Topic Classification Tool” In International Journal of Network Security & Its Applications, V14, N1, 2022 DOI: 10.48550/ARXIV.2109.02473
- [25] Valentine Solange Marine Legoy “Retrieving ATT&CK tactics and techniques in cyber threat reports”, 2019
- [26] Roger Kwon et al. “Cyber Threat Dictionary Using MITRE ATT&CK Matrix and NIST Cybersecurity Framework Mapping” In 2020 Resilience Week (RWS), 2020, pp. 106–112 IEEE DOI: 10.1109/RWS50334.2020.9241271
- [27] MITRE ATT&CK “Mitre ATT&CK” In URL: https://attack. mitre. org, 2021
- [28] Rawan Al-Shaer, Jonathan M Spring and Eliana Christou “Learning the associations of mitre ATT&CK adversarial techniques” In 2020 IEEE Conference on Communications and Network Security (CNS), 2020, pp. 1–9 IEEE DOI: 10.1109/CNS48642.2020.9162207
- [29] Aditya Kuppa, Lamine Aouad and Nhien-An Le-Khac “Linking CVE’s to MITRE ATT&CK Techniques” In The 16th International Conference on Availability, Reliability and Security, 2021, pp. 1–12
- [30] Md Rayhanur Rahman and Laurie Williams “Investigating co-occurrences of MITRE ATT&CK Techniques” arXiv, 2022 DOI: 10.48550/ARXIV.2211.06495
- [31] Md Rayhanur Rahman and Laurie Williams “An investigation of security controls and MITRE ATT&CK techniques” arXiv, 2022 DOI: 10.48550/ARXIV.2211.06500
- [32] Steven Bird, Ewan Klein and Edward Loper “Natural language processing with Python: analyzing text with the natural language toolkit” ” O’Reilly Media, Inc.”, 2009
- [33] Kensuke Sumoto et al. “Automatic labeling of the elements of a vulnerability report CVE with NLP” In 2022 IEEE 23rd International Conference on Information Reuse and Integration for Data Science (IRI), 2022, pp. 164–165 DOI: 10.1109/IRI54793.2022.00045
- [34] Blake E Strom et al. “Mitre ATT&CK: Design and philosophy” In Technical report The MITRE Corporation, 2018
- [35] Shou-Ching Hsiao and Da-Yu Kao “The static analysis of WannaCry ransomware” In 2018 20th International Conference on Advanced Communication Technology (ICACT), 2018, pp. 153–158 DOI: 10.23919/ICACT.2018.8323680
- [36] Guohang Lu et al. “A Comprehensive Detection Approach of Wannacry: Principles, Rules and Experiments” In 2020 International Conference on Cyber-Enabled Distributed Computing and Knowledge Discovery (CyberC), 2020, pp. 41–49 DOI: 10.1109/CyberC49757.2020.00017
- [37] Da-Yu KAO, Shou-Ching HSIAO and Raylin TSO “Analyzing WannaCry Ransomware Considering the Weapons and Exploits” In 2019 21st International Conference on Advanced Communication Technology (ICACT), 2019, pp. 1098–1107 DOI: 10.23919/ICACT.2019.8702049
- [38] Qian Chen and Robert A. Bridges “Automated Behavioral Analysis of Malware: A Case Study of WannaCry Ransomware” In 2017 16th IEEE International Conference on Machine Learning and Applications (ICMLA), 2017, pp. 454–460 DOI: 10.1109/ICMLA.2017.0-119
- [39] Da-Yu Kao and Shou-Ching Hsiao “The dynamic analysis of WannaCry ransomware” In 2018 20th International Conference on Advanced Communication Technology (ICACT), 2018, pp. 1–1 DOI: 10.23919/ICACT.2018.8323681
- [40] Katja Hahn and INM Register “Robust static analysis of portable executable malware” In HTWK Leipzig 134, 2014
- [41] Pengsu Cheng, Lingyu Wang, Sushil Jajodia and Anoop Singhal “Aggregating CVSS base scores for semantics-rich network security metrics” In 2012 IEEE 31st Symposium on Reliable Distributed Systems, 2012, pp. 31–40 IEEE
- [42] Karen Scarfone and Peter Mell “An analysis of CVSS version 2 vulnerability scoring” In 2009 3rd International Symposium on Empirical Software Engineering and Measurement, 2009, pp. 516–525 IEEE
- [43] Atefeh Khazaei, Mohammad Ghasemzadeh and Vali Derhami “An automatic method for CVSS score prediction using vulnerabilities description” In Journal of Intelligent & Fuzzy Systems 30.1 IOS Press, 2016, pp. 89–96
- [44] Laurent Gallon and Jean Jacques Bascou “Using CVSS in attack graphs” In 2011 Sixth International Conference on Availability, Reliability and Security, 2011, pp. 59–66 IEEE
- [45] Pauli Virtanen et al. “SciPy 1.0: Fundamental Algorithms for Scientific Computing in Python” In Nature Methods 17, 2020, pp. 261–272 DOI: 10.1038/s41592-019-0686-2
- [46] Student “Probable error of a correlation coefficient” In Biometrika JSTOR, 1908, pp. 302–310
- [47] Charles J Kowalski “On the effects of non-normality on the distribution of the sample product-moment correlation coefficient” In Journal of the Royal Statistical Society: Series C (Applied Statistics) 21.1 Wiley Online Library, 1972, pp. 1–12
- [48] Jacob Benesty, Jingdong Chen, Yiteng Huang and Israel Cohen “Pearson correlation coefficient” In Noise reduction in speech processing Springer, 2009, pp. 1–4
- [49] Sergey Brin and Lawrence Page “The anatomy of a large-scale hypertextual web search engine” In Computer networks and ISDN systems 30.1-7 Elsevier, 1998, pp. 107–117 DOI: 10.1016/S0169-7552(98)00110-X
- [50] David F Gleich “PageRank beyond the Web” In siam REVIEW 57.3 SIAM, 2015, pp. 321–363 DOI: 10.1137/140976649
- [51] Aric Hagberg, Pieter Swart and Daniel S Chult “Exploring network structure, dynamics, and function using NetworkX”, 2008