Eigenvalues of the QCD Dirac matrix with improved staggered quarks in the continuum limit
Abstract
We calculate the eigenmodes of the Highly Improved Staggered Quark (HISQ) matrix near the chiral crossover transition in QCD with flavors with the aim to gain more insights into its temperature dependence. On performing the continuum extrapolation, we do not observe any gap opening up in the infrared part of the eigenvalue density of the QCD Dirac operator; instead we observe a peak. The existence of the peak and oscillations of the infrared eigenmodes can be understood in terms of an interacting ensemble of instantons. From the properties of the continuum extrapolated eigenspectrum we further show that the anomalous part of the chiral symmetry is not effectively restored simultaneously along with its non-singlet counterpart. We provide an explanation for this observation, further showing interesting connections between the anomalous restoration and the change in the infrared part of the eigenvalue distribution.
pacs:
12.38.Gc, 11.15.Ha, 11.30.Rd, 11.15.KcI Introduction
The eigenvalue spectrum of the quark Dirac operator contains valuable information about the fundamental properties of Quantum Chromodynamics (QCD). The chiral condensate which acts as an (pseudo) order parameter for the chiral (crossover) transition in QCD is related to the density of near-zero eigenvalues Banks and Casher (1980). In fact it was shown from very general considerations that the formation of the chiral condensate is related to the occurrence of small eigenvalues that scale proportional to the volume Leutwyler and Smilga (1992). The breaking of the non-singlet part of chiral symmetry, i.e., of QCD with physical quark masses at the crossover temperature MeV Bazavov et al. (2019a) can also be explained in terms of modifications in the deep infrared part of the eigenvalue density. The flavor-singlet part of the chiral symmetry on the other hand, is anomalous yet is believed to play an important role in determining the nature of the chiral phase transition Pisarski and Wilczek (1984); Butti et al. (2003); Pelissetto and Vicari (2013). The temperature dependence of the amount of breaking near the chiral crossover transition in QCD can be only determined using non-perturbative lattice techniques and is a topic of contemporary interest in lattice QCD; see, for e.g., Ref. Sharma (2018); Lombardo and Trunin (2020) for recent reviews. Whereas there are some very compelling evidence that show remains effectively broken in flavor QCD with physical quark mass Bazavov et al. (2012); Buchoff et al. (2014); Bhattacharya et al. (2014); Dick et al. (2015); Petreczky et al. (2016); Bazavov et al. (2019b); Ding et al. (2021), even when Kaczmarek et al. (2021), there are lattice studies which also favor an effective restoration at Cossu et al. (2013); Chiu (2014); Tomiya et al. (2017); Brandt et al. (2016); Aoki et al. (2021, 2022).
The eigenvalue spectrum of the QCD Dirac matrix also encodes within it some remarkable universal properties. It was shown that the route toward achieving the thermodynamic limit for the infrared modes of the Dirac operator is universal Shuryak and Verbaarschot (1993), for any number of light quark flavors. The existence of a non-zero chiral condensate leads to a sum rule involving the sum of inverse squares of these small eigenvalues Leutwyler and Smilga (1992). These sum rules are universal irrespective of the details of the nature and type of gauge interactions Shuryak and Verbaarschot (1993); Verbaarschot and Zahed (1993) and could be derived from chiral random matrix theory Verbaarschot (1994a). A good agreement was demonstrated for the distribution of the small eigenvalues and the spectral density of lattice QCD Dirac operator and chiral random matrix theory at zero temperature on small lattice volumes Berbenni-Bitsch et al. (1998). In fact universal correlations between higher order spectral functions in a random matrix theory has been derived Akemann et al. (1997), and its connection to QCD was discussed. At finite temperature the universal features of infrared eigenvalues can be also accounted for within a random matrix theory Jackson et al. (1997); Garcia-Garcia and Verbaarschot (2000); Akemann and Würfel (2021). Additionally the infrared eigenvalue spectrum of QCD has more subtle features. A near-zero peak of localized eigenvalues has been observed for finite lattices, mixing with but very different from the delocalized bulk modes whose spectral density follows random matrix statistics Sharma (2018); Giordano and Kovacs (2021). Whether or not such a feature survives in the continuum limit is yet to be ascertained. Previous studies of quark Dirac spectrum in an instanton liquid ensemble Verbaarschot (1994b); Garcia-Garcia and Verbaarschot (2000) at zero temperature have observed a similar peak-like feature.
With increasing temperature the localized modes start separating out from the random bulk modes leading to the opening up of a mobility edge Giordano and Kovacs (2021). The corresponding temperature where a finite mobility edge separates the bulk modes from the localized one was initially estimated from lattice studies to be identical to in dynamical Garcia-Garcia and Osborn (2007); Kovacs and Pittler (2010, 2012); Giordano et al. (2014); Ujfalusi et al. (2015); Giordano et al. (2017); Holicki et al. (2018); Cardinali et al. (2022); Kehr et al. (2023) as well as in quenched QCD Kovacs and Vig (2018); Vig and Kovacs (2020), reminiscent of an Anderson-like transition that is observed in disordered semi-metals Anderson (1958). However independent lattice studies do discuss another possible scenario where the opening of a finite mobility edge may occur at temperatures higher than Alexandru and Horváth (2022), with an intermediate phase consisting of scale-invariant infinitely extended infrared modes Alexandru and Horváth (2019, 2021) strongly interacting with the bulk modes leading to a singularity at the mobility edge.
Most of the previous lattice QCD studies were either performed in the quenched limit or with dynamical quarks but away from the physical point and for finite lattice spacings. On a finite lattice, the most often used lattice discretization, i.e., the staggered fermions only has a remnant of the continuum chiral symmetry group due to mixing of spin and flavor degrees of freedom. Furthermore the anomalous part of the chiral symmetry in the continuum is not realized exactly by the staggered/Wilson quarks and is expected to be recovered only in the continuum limit. We, for the first time study the properties of the eigenvalue spectrum of (highly) improved dynamical staggered Dirac operator in large volume lattices by carefully performing a continuum extrapolation. We show that the deep infrared spectrum of the QCD Dirac operator has indeed a peak of near-zero modes which survives in continuum. These are distinct from other infrared modes which have a linearly rising density and a quadratic level repulsion similar to a certain class of random matrix theories. These so-called bulk modes are delocalized in volume as compared with the near-zero modes, and they tend to distinctly disentangle from each other at a temperature , which is also where is effectively restored. In the subsequent sections we discuss our results and also provide a unified physical explanation of these phenomena we observe.
II Numerical Details
In this work we use the gauge configurations for flavor QCD with physical quark masses generated by the HotQCD collaboration using Highly Improved Staggered quark (HISQ) discretization for the fermions and tree-level Symanzik improved gauge action. These ensembles have been previously used to measure the equation of state of QCD both at zero and finite baryon density Bazavov et al. (2017, 2019a). The Goldstone pion mass is set to MeV, and the kaon mass is MeV for these configurations. We focus on five different temperatures, one below and others above . For most of these temperatures we consider three different lattice spacings corresponding to , the details of which are mentioned in Table 1. The number of spatial lattice sites was chosen to be such that the spatial volume in each case was about fm, which ensures that the system is close to the thermodynamic limit. We calculated the first eigenvalues of the massless HISQ Dirac matrix for respectively on these gauge ensembles using conjugate gradient method based algorithms. We have fixed the bin size for each for measuring the eigenvalue density and performed a jack-knife analysis to remove any auto-correlation effects among the data in the bins.
| (MeV) | ||||
|---|---|---|---|---|
| 145 | 6.285 | 48 | 12 | 1530 |
| 145 | 7.010 | 64 | 16 | 2860 |
| 162 | 6.423 | 32 | 8 | 250 |
| 162 | 6.825 | 48 | 12 | 1960 |
| 162 | 7.130 | 64 | 16 | 3390 |
| 166 | 6.445 | 32 | 8 | 400 |
| 166 | 6.850 | 48 | 12 | 2100 |
| 166 | 7.156 | 64 | 16 | 2190 |
| 171 | 6.474 | 32 | 8 | 280 |
| 171 | 6.880 | 48 | 12 | 1980 |
| 171 | 7.188 | 64 | 16 | 1040 |
| 176 | 6.500 | 32 | 8 | 240 |
| 176 | 6.910 | 48 | 12 | 330 |
III Results
III.1 General features of the eigenvalue spectrum of QCD using HISQ Dirac operator in continuum limit
In this section we study in detail the eigenvalue density of the quark Dirac operator in flavor QCD by performing a continuum extrapolation of the parameters characterizing the eigenspectrum calculated on the lattice with HISQ discretization.
At zero temperature it is known from chiral perturbation theory Smilga and Stern (1993) that the linearly rising part of the eigenvalue density, due to the so-called bulk modes, is expressed as
| (1) |
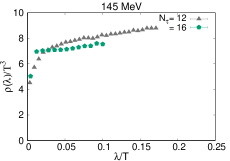
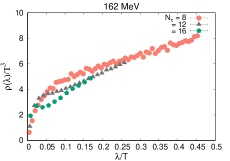
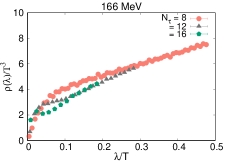
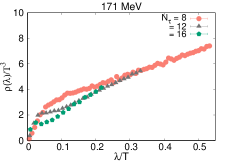
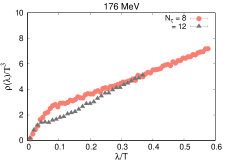
The intercept of bulk eigenvalue density gives the chiral condensate. The ratio of the slope and the intercept of the density as a function of should be proportional to the chiral condensate. We first focus on the intercept and the slope (linear in ) of the eigenvalue density at the lowest temperature MeV, shown in the top left panel of Fig. 1, and compare with the expectations from Eq. 1. At this temperature we could only obtain a continuum estimate of the slope and intercept as we have data for two lattice spacings. From the continuum estimate of the intercept we obtain a chiral condensate using Eq. 1. From the slope we could similarly extract the square and by substituting MeV the chiral condensate (normalized by ) to be which is consistent with the one extracted from the intercept. This demonstrates the consistency of our fit procedure. The value obtained here from the eigenvalue spectrum is also consistent with the value of obtained from the inversion of the HISQ Dirac operator on stochastic noise vectors and performing a continuum estimate using the data on a much larger set of HotQCD configurations Steinbrecher (2018). Thus we conclude here that the leading features of the eigenvalue density of QCD at MeV are indeed very well represented within chiral perturbation theory.
The bulk eigenvalue density in the chirally symmetric phase has been studied earlier in Ref. Aoki et al. (2012). Most generally, it can be expressed as a function of as
| (2) |
Here is the coefficient that characterizes the leading-order growth of the eigenvalue spectrum in the deep infrared and is its next-to leading order coefficient which eventually has a dependence predicted from perturbation theory. The intercept gives the the chiral condensate. The coefficients can in general be a function of the temperature and the light-quark mass .
The results of the eigenvalue density as a function of for are shown in Fig. 1. On the finest available lattice, we observe two distinct features in the eigenvalue spectrum, a peak of near-zero eigenvalues and the linearly rising part, due to the bulk modes, as previously mentioned. For , the near-zero and the bulk eigenvalues overlap strongly making it impossible to distinguish them apart. At higher temperatures, the bulk eigenvalues separate out from the deep-infrared part of the spectrum allowing for near-zero modes to be distinctly visible. Comparing the results of different lattice spacings, we observe the same trend at each temperature above , i.e., near-zero peak gets smeared with the bulk for coarser lattices and becomes more prominent in the continuum limit. This is thus a physical feature of the eigenspectrum and not a lattice artifact. In order to interpret its origin we recall that in the chiral random matrix theory (cRMT) at zero temperature, the scaled eigenvalue density of the Dirac operator for flavors and zero topological charge sector is distributed according to Akemann (2016),
| (3) |
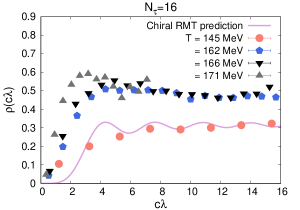
To compare our data with the above formula, we take , where is the spatial volume of the system, and the value of at finite temperature is obtained from Ref. Steinbrecher (2018) which uses the same HotQCD gauge configurations, a subset of which is used in this work. Further we also scale the eigenvalues such that the first moment of probability distribution for lowest eigenvalues for the data matches with the first moment of Eq. 4. A comparison of near zero modes for four different temperatures, MeV, is shown in Fig. 2. We observe a good agreement with cRMT for MeV, in particular, the initial few oscillations of the small eigenvalue density as a function of . Incidentally an agreement between Eq. 3 and the eigenvalue density from the instanton liquid model (ILM) at was observed in Verbaarschot (1997). However at finite temperature the oscillations in the eigenvalue density within ILM are smeared out over a length scale Garcia-Garcia and Verbaarschot (2000) which is qualitatively similar to what we observe for in Fig. 2.
Now focusing on the bulk modes, it was shown using chiral Ward identities that in the symmetry-restored phase, the sufficient condition for restoration evident from the degeneracy of up to six-point correlation functions in the scalar-pseudo-scalar sector are and . The perturbative growth in Eq. 2 can have a mass-independent coefficient which however does not lead to breaking. We verify whether indeed it is true even non-perturbatively by performing a fit to the bulk part i.e. all eigenvalues with . This ansatz neglects higher powers in which is well justified since we are in the deep infrared of the eigenspectrum, represented by eigenvalues out of a total million available on such lattice sizes. The results of the fit are discussed in Table 2. The extracted slope for each temperature , at three different values of then allows us to perform a continuum () extrapolation of this coefficient. We next study the dependence of this continuum extrapolated coefficient . The results of the fits are shown in Fig. 3. It is evident from the fit that it is more favorable that is proportional to (/d.o.f=) to leading order rather than is proportional to (/d.o.f=). From the fit we obtain the value of .
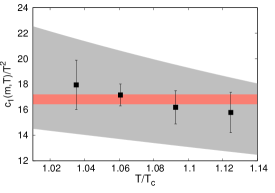
The finite result for the slope in the continuum limit, i.e., the -independent term in ensures that the part of the chiral symmetry will remain minimally broken in the chiral limit in the symmetry-restored phase as the maximum contribution to breaking comes from the near-zero eigenvalues, which we observe in the next section. Moreover the slope of the eigendensity for is distinctly different from the perturbative rise implying significant non-perturbative effects.
| [MeV] | ||||
|---|---|---|---|---|
| 145 | 12 | 0.1 | 9.0(5) | 7.30(7) |
| 145 | 16 | 0.05 | 9(1) | 6.67(9) |
| 162 | 8 | 0.2 | 8.8(3) | 4.1(1) |
| 162 | 12 | 0.15 | 13.2(2) | 2.69(5) |
| 162 | 16 | 0.1 | 17.5(5) | 1.93(7) |
| 166 | 8 | 0.2 | 8.9(1) | 3.31(5) |
| 166 | 12 | 0.15 | 13.3(3) | 1.92(6) |
| 166 | 16 | 0.1 | 16.6(8) | 1.4(1) |
| 171 | 8 | 0.2 | 9.3(1) | 2.38(5) |
| 171 | 12 | 0.15 | 12.9(1) | 1.19(3) |
| 171 | 16 | 0.1 | 17.0(5) | 0.45(8) |
| 176 | 8 | 0.2 | 9.5(1) | 1.67(4) |
| 176 | 12 | 0.15 | 13.0(2) | 0.36(6) |
III.2 The fate of breaking in the continuum limit
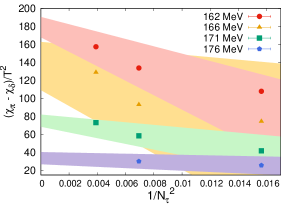
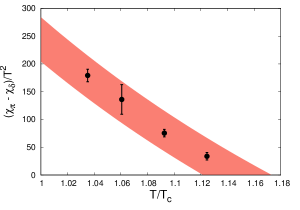
Since the flavor singlet part of the chiral symmetry is anomalous it has no corresponding order parameter. Hence to measure whether this singlet part of the chiral symmetry is simultaneously (and effectively) restored along with the non-singlet part, it has been suggested Shuryak (1994) to look at the degeneracies of the integrated correlators of mesons i.e., . In the continuum, the integrated meson correlators are related to each other through the following relations, and . These integrated meson correlators are defined as , , and . We measure at the four different temperatures above , and perform a continuum extrapolation at each temperature, the results of which are shown in Fig. 4. For the highest temperature, we have only two data points available corresponding to for performing the continuum extrapolation. We hence assigned and error to the values for the slope and the intercept respectively, similar to that obtained from a fit to the MeV data. This observable receives 99% contribution from the near-zero eigenvalues for . Performing continuum estimates with only two data points corresponding to finer lattice sizes at each temperature, gives a higher intercept than the corresponding extrapolation considering all three values. Hence the finiteness of this observable is quite robust and we conclude that does not get effectively restored at .
Motivated from the fact that the major contribution to comes from the near-zero modes, we expect a dependence to this quantity if the corresponding eigenvalue density can be characterized as a well-defined peak. Furthermore from the chiral perturbation theory at finite temperature one expects a similar dependence Bonati et al. (2016) near . We thus fit the continuum extrapolated values of at each temperature , i.e., the intercept of the fits shown in Fig. 4 to the ansatz . After performing the fit, shown in Fig. 5 we extract the temperature beyond which this -breaking observable drops to zero.
Earlier analytic works based on the properties of integrated two-point meson correlators argued that the breaking comes from the eigenmodes of the Dirac operator at Lee and Hatsuda (1996) or close to zero Cohen (1996). Whereas exact zero modes do not contribute in the thermodynamic limit, the density of near-zero modes at was expected to be zero Cohen (1996) in the chiral symmetry-restored phase of QCD, whereas we observe a robust presence of the near-zero modes in the continuum limit which dominantly contributes to breaking for .
We next compare our result with the earlier observation of (effective) restoration temperature of MeV obtained from the continuum extrapolated results for the integrated screening correlators in flavor QCD using HISQ discretization Bazavov et al. (2019b) with heavier than physical light quark mass, corresponding to MeV. The corresponding pseudo-critical temperature is also higher by MeV; hence the restoration temperature comes out to be around which agrees with us within the error bar. Furthermore a recent work Ding et al. (2021) has reported breaking of due to a feature in the eigenvalue spectrum at about which survives even in the chiral limit. We note here that breaking due to this specific feature of the Dirac spectrum is expected to survive even at asymptotically high temperatures where the QCD vacuum can be explained in terms of a dilute gas of instantons Dick et al. (2015); Petreczky et al. (2016). We however discuss here how a non-trivial breaking of the part of chiral symmetry can arise due to features in the infrared part of the eigenvalue spectrum unlike the dilute instanton gas regime and show that beyond such a contribution gets effectively restored which then may transition into the temperature regime studied in Ref. Ding et al. (2021). We next verify that the chiral Ward identities are satisfied by the HISQ action.
III.3 Verifying the chiral Ward identities
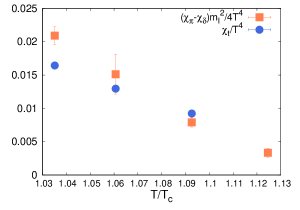
In the chiral symmetry restored phase, and hence one obtaines . Using chiral Ward identities it is known that where is the topological susceptibility of QCD. This allows one to relate the breaking parameter to the topological susceptibility through the relation . A comparison of these two observables is shown in Fig. 6. From the figure it is evident that for , when chiral symmetry is effectively restored, the two quantities agree with each other within errors. This is particularly interesting since for staggered quarks, even though the chiral and taste symmetries are intermixed at finite lattice spacing, the symmetries of QCD and related chiral Ward identities are recovered in the continuum limit.
III.4 Distribution of the lowest eigenvalue at finite temperature
The probability distribution of the lowest eigenvalue of the QCD Dirac operator has inherent information about the microscopic degrees of freedom. For a chiral random matrix ensemble for (at zero temperature) the lowest eigenvalue is distributed according to Akemann (2016)
| (4) |
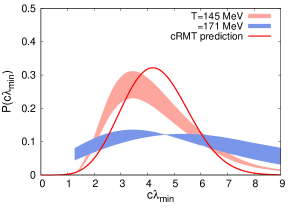
At the lowest temperature MeV, we calculate the probability distribution of the scaled lowest eigenvalue at different lattice spacings and perform a continuum estimate of the distributions, for which we have extracted the lowest eigenvalue from each configuration for for MeV and for MeV and later rescaled to the dimensionless quantity , where the value of at finite temperature is obtained from Ref. Steinbrecher (2018). Keeping the bin size constant we obtained the probability distribution of for each and then performed a spline interpolation by taking appropriate weights proportional to the errors for each data point in order to have a smoother interpolating curve. Next we performed a continuum extrapolation at each value of of the interpolating function with the ansatz . We assigned a error for MeV, as we only had two points while performing the continuum extrapolation. In order to compare the probability distribution of the lowest eigenvalue for both the temperatures with Eq. 4 we have to match their first moments with the cRMT distribution. We have calculated the first moment for Eq. 4 and found the result to be . Next we have scaled the and the probability distribution for the lowest eigenvalue obtained at both these temperatures from our calculations in flavor QCD such that the first moment is exactly and the area under the curve is unity. The probability distribution of the scaled lowest eigenvalue is shown in Fig. 7. The continuum extrapolation of the probability distribution at MeV shown as the orange band is close to the probability distribution of a chiral Gaussian unitary random matrix ensemble. In contrast, we also plot the probability distribution of the scaled lowest eigenvalue at MeV whose continuum extrapolation is shown as a blue band in Fig. 7. It is evident that the lowest eigenvalue which is a part of the near-zero peak follows a very different statistics rather than known from a chiral RMT.
III.5 The level spacing distribution for bulk modes
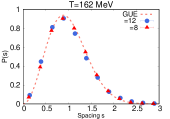
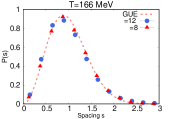
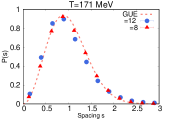
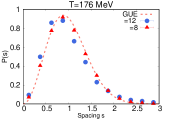
In order to understand the properties of bulk modes we look at their level spacing distribution. To study the universal properties of the eigenvalue level spacing fluctuations one has to remove the system dependent mean. This is done by a method called unfolding. Let represent eigenvalues in the ascending sequence for any particular gauge configuration. The average density of the eigenvalues in the sequence i.e. the reciprocal of the average spacing as a function of is represented as . The eigenvalue sequence can then be unfolded using the average level-staircase function, which tells us how many eigenvalues in this sequence are less than on an average. Here labels the eigenvalue beyond which all the higher eigenvalues are bulk modes and below which are the near-zero modes. The unfolded sequence is labeled by , where the index labels the original eigenvalue whose unfolding is performed. When appropriately normalized, the average spacing between the unfolded eigenvalues equals unity. The nearest neighbor spacing distribution is constructed by calculating the differences between consecutive unfolded eigenvalues and organizing them into histogram bins. This gives us a picture of how the eigenvalue spacings fluctuate about the average which we have shown in Fig. 8 for four different temperatures MeV and at each temperature, for the two different lattice sizes . We then compare the nearest neighbor spacing distributions to the Wigner surmise for the Gaussian unitary ensemble (GUE) given by shown as dotted lines in Fig. 8. It is evident that the level repulsion between the bulk modes for small is quadratic similar to that of random matrices belonging to the GUE. We see however that as the temperature increases, the agreement to GUE with the data for is not so good, whereas the low part agrees very well. This occurs due to the contamination of the bulk modes, which are more closely spaced than the near-zero modes which start to build up forming a peaklike structure in the infrared part of the eigenvalue spectrum. For the lattices which has a clear well-defined peak of near-zero modes at MeV, the contamination with the bulk modes is expected to be even more severe. As expected the comparison of the tail of the spacing distribution of the data to the GUE prediction produces not-so-good agreement. In order to account for the long tail of the spacing distribution we fit it to a distribution which shows strong quadratic level repulsion at small values of but falls off slowly at large values of parametrized by a fit parameter . After performing the fit of the level separation with this ansatz, we obtain the value of for temperatures MeV respectively. The lattice data now do agree to this new fit ansatz reasonably well for at all temperatures above , which is evident in Fig. 9.
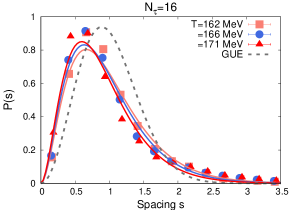
This is a generic feature of the eigenvalue spacing distribution of a strongly disordered system Basko et al. (2006) whose bulk eigenmodes in the center of the band follows a similar behavior as RMTs except for the tails of the distribution due to contamination with the localized states. We will explain this feature in more detail in the next section.
III.6 Separating the near-zero from the bulk eigenvalues of the QCD Dirac spectrum
Having shown the distinct features of near-zero and bulk modes, the next question we ask is whether the near-zero modes which arise due to instanton interactions can distinctly disentangle out from the delocalized bulk modes. The QCD medium above consists of quarks interacting with each other as well residing in a disorder potential very similar to an interacting electron system in a background random potential studied in detail in Ref. Basko et al. (2006). Such systems have a mixing between the localized and delocalized many-body states which is in contrast to the traditional Anderson model, consisting of non-interacting electrons in the presence of a random disorder. In the Anderson model, one-electron states with the same energy but with different localization properties cannot co-exist in three or more spatial dimensions, . There exist bands of localized and extended states, and a unique energy separating two such bands for which is termed as a mobility edge. The QCD medium above however cannot be understood through a conventional Anderson model; it has far more interesting properties, like the possibility of the existence of a scale-invariant infrared phase above discussed in the recent literature Alexandru and Horváth (2021); Kehr et al. (2023). In fact we do observe a mixing between the localized states with the bulk spectrum of the QCD Dirac operator in the level spacing distribution data as shown in Fig. 9.
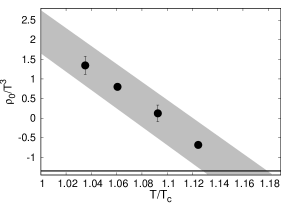
In order to estimate the temperature when the bulk modes separate out from the deep-infrared peak of eigenvalues, we first estimate the typical spread of the near-zero peak visible in the eigenvalue density plots corresponding to in Fig. 1. Recall that we have already estimated the slope and the intercept of the bulk eigenvalue density, using which we subtract the bulk mode contribution from the total eigenvalue spectrum for the data at each temperature. The near-zero peak which we get after subtracting the bulk modes has a typical spread which we estimate to be for all the temperatures above . Next, using the fact that the bulk modes have a linear-in- dependence with a slope in the continuum and the near-zero and bulk modes will separate out at a particular temperature, leading to the density to drop to zero at , we estimate the value of the bulk intercept (corresponding to ) in the continuum limit. We then take the values of the intercept of bulk mode density for all from Table 2 and perform a continuum extrapolation with an ansatz . The continuum values of the quantity for , so-obtained after the fit are shown in Fig. 10. At the highest temperature MeV, a error is assigned to the data point since we could perform a continuum estimate, with data available only for two values. Next, fitting the continuum extrapolated data for as a function of temperature with a fit ansatz we obtain the fit parameters to be and respectively. After obtaining this parametric dependence of the continuum estimates of the intercept as a function of temperature, we can now extract the temperature where the value of the intercept , i.e., when the near-zero modes distinctly emerge out from the bulk spectrum. The extracted temperature comes out to be . This is within the temperature range when the part of the chiral symmetry is effectively restored.
IV Why is effectively restored at temperatures above ?
In order to interpret these results, one could visualize quarks as a many-body state moving in the background of an interacting ensemble of instantons, where the strength of the interactions changes as a function of temperature. At the microscopic level it is conjectured that the instantons remain strongly correlated below , subsequently transitioning to a liquid-like phase with a finite but weaker correlation length Schäfer and Shuryak (1998) just above , and eventually to a gas-like phase around Petreczky et al. (2016); Ding et al. (2021). Below the intercept of the infrared eigenvalue density quantifies the chiral condensate which corresponds to the breaking of the non-singlet part of the chiral symmetry. Owing to very strong correlations the microscopic details of the interactions are lost and the eigenvalues repel strongly similar to random matrices of a GUE. As the temperature is increased, at MeV, the near-zero eigenvalues start to become prominent. These eventually separate from the bulk at . Earlier studies have observed screening of inter-instanton interactions and build-up of local pockets of Polyakov loop fluctuations Bruckmann et al. (2011); Holicki et al. (2018); Baranka and Giordano (2022) above such temperatures. This is also the region where the constituent dyons of the closely-spaced instantons interact semi-classically and thus start to become detectable Bornyakov et al. (2016); Larsen et al. (2019, 2020, 2022).
Incidentally this suppression of long range instanton interactions also weakens the strength of breaking, allowing for its effective restoration at . Lattice studies Amato et al. (2013); Aarts et al. (2015) have reported a jump in the electrical conductivity around this temperature. Similar phenomena have also been reported in many-electron systems Basko et al. (2006) in a disordered potential where the interplay between disorder and interactions causes a separation between the localized and delocalized states leading to a jump in the electrical conductivity from near-zero to a finite value.
V Conclusions
In this work we have addressed a long-standing question of whether the flavor singlet subgroup of the chiral symmetry gets effectively restored simultaneously with the non-singlet part for QCD with two light quark flavors at . The effective restoration of the anomalous symmetry is a non-perturbative phenomenon driven by the deep infrared part of the QCD Dirac eigenvalue spectrum. By carefully performing the continuum extrapolation of the staggered Dirac spectrum on the lattice and studying in detail its properties, we explicitly demonstrate that remains effectively broken in the chirally symmetric phase () for . We also provide arguments for why this conclusion should remain unchanged even in the chiral limit.
With the increase in temperature the strength of interactions between the instantons starts to weaken due to which the deep infrared peak of the spectrum is separated out from the bulk modes, which happens at around . The tunneling probability due to instantons also decreases with increasing temperature which results in lowering of the height of the near-zero peak of eigenvalue density. We show for the first time that both these phenomena are possibly the reason behind the restoration, which also surprisingly happens to be around the same temperature. Observations of such rich interplay of phenomena in QCD matter above should be quite robust, since these are made after performing a continuum extrapolation. It will be interesting to observe further finer details of chiral transition in the massless limit with QCD Dirac operators which have exact chiral symmetry on the lattice.
All data from our calculations, presented in the figures of this paper, can be found in Ref. DOI .
Acknowledgements The authors acknowledge support by the Deutsche Forschungsgemeinschaft (DFG, German Research Foundation) through the CRC-TR 211 ’Strong-interaction matter under extreme conditions’– Project no. 315477589 – TRR 211. S.S. acknowledges support by the Department of Science and Technology, Government of India through a Ramanujan Fellowship. The numerical computations in this work were performed on the GPU cluster at Bielefeld University. We thank the Bielefeld HPC.NRW team for their support. We thank the HotQCD Collaboration, specially Christian Schmidt for sharing the gauge configurations and software with us. We acknowledge the contribution of Hiroshi Ohno who was involved during the early stages of the project. S.S. is grateful to Frithjof Karsch for helpful discussions and his kind hospitality when this work was finalized. We also thank Gernot Akemann for his very helpful guidance and Matteo Giordano for his suggestions on the first draft. A part of this work is based on the MILC Collaboration’s public lattice gauge theory code MIL .
References
- Banks and Casher (1980) T. Banks and A. Casher, Nucl. Phys. B 169, 103 (1980).
- Leutwyler and Smilga (1992) H. Leutwyler and A. V. Smilga, Phys. Rev. D 46, 5607 (1992).
- Bazavov et al. (2019a) A. Bazavov et al. (HotQCD), Phys. Lett. B 795, 15 (2019a), eprint 1812.08235.
- Pisarski and Wilczek (1984) R. D. Pisarski and F. Wilczek, Phys. Rev. D 29, 338 (1984).
- Butti et al. (2003) A. Butti, A. Pelissetto, and E. Vicari, JHEP 08, 029 (2003), eprint hep-ph/0307036.
- Pelissetto and Vicari (2013) A. Pelissetto and E. Vicari, Phys. Rev. D 88, 105018 (2013), eprint 1309.5446.
- Sharma (2018) S. Sharma, PoS CPOD2017, 086 (2018).
- Lombardo and Trunin (2020) M. P. Lombardo and A. Trunin, Int. J. Mod. Phys. A 35, 2030010 (2020), eprint 2005.06547.
- Bazavov et al. (2012) A. Bazavov et al. (HotQCD), Phys. Rev. D 86, 094503 (2012), eprint 1205.3535.
- Buchoff et al. (2014) M. I. Buchoff et al., Phys. Rev. D 89, 054514 (2014), eprint 1309.4149.
- Bhattacharya et al. (2014) T. Bhattacharya et al., Phys. Rev. Lett. 113, 082001 (2014), eprint 1402.5175.
- Dick et al. (2015) V. Dick, F. Karsch, E. Laermann, S. Mukherjee, and S. Sharma, Phys. Rev. D 91, 094504 (2015), eprint 1502.06190.
- Petreczky et al. (2016) P. Petreczky, H.-P. Schadler, and S. Sharma, Phys. Lett. B 762, 498 (2016), eprint 1606.03145.
- Bazavov et al. (2019b) A. Bazavov et al., Phys. Rev. D 100, 094510 (2019b), eprint 1908.09552.
- Ding et al. (2021) H. T. Ding, S. T. Li, S. Mukherjee, A. Tomiya, X. D. Wang, and Y. Zhang, Phys. Rev. Lett. 126, 082001 (2021), eprint 2010.14836.
- Kaczmarek et al. (2021) O. Kaczmarek, L. Mazur, and S. Sharma, Phys. Rev. D 104, 094518 (2021), eprint 2102.06136.
- Cossu et al. (2013) G. Cossu, S. Aoki, H. Fukaya, S. Hashimoto, T. Kaneko, H. Matsufuru, and J.-I. Noaki, Phys. Rev. D 87, 114514 (2013), [Erratum: Phys.Rev.D 88, 019901 (2013)], eprint 1304.6145.
- Chiu (2014) T.-W. Chiu, PoS LATTICE 2013, 165 (2014).
- Tomiya et al. (2017) A. Tomiya, G. Cossu, S. Aoki, H. Fukaya, S. Hashimoto, T. Kaneko, and J. Noaki, Phys. Rev. D 96, 034509 (2017), [Addendum: Phys.Rev.D 96, 079902 (2017)], eprint 1612.01908.
- Brandt et al. (2016) B. B. Brandt, A. Francis, H. B. Meyer, O. Philipsen, D. Robaina, and H. Wittig, JHEP 12, 158 (2016), eprint 1608.06882.
- Aoki et al. (2021) S. Aoki, Y. Aoki, G. Cossu, H. Fukaya, S. Hashimoto, T. Kaneko, C. Rohrhofer, and K. Suzuki (JLQCD), Phys. Rev. D 103, 074506 (2021), eprint 2011.01499.
- Aoki et al. (2022) S. Aoki, Y. Aoki, H. Fukaya, S. Hashimoto, C. Rohrhofer, and K. Suzuki (JLQCD), PTEP 2022, 023B05 (2022), eprint 2103.05954.
- Shuryak and Verbaarschot (1993) E. V. Shuryak and J. J. M. Verbaarschot, Nucl. Phys. A 560, 306 (1993), eprint hep-th/9212088.
- Verbaarschot and Zahed (1993) J. J. M. Verbaarschot and I. Zahed, Phys. Rev. Lett. 70, 3852 (1993), eprint hep-th/9303012.
- Verbaarschot (1994a) J. J. M. Verbaarschot, Phys. Rev. Lett. 72, 2531 (1994a), eprint hep-th/9401059.
- Berbenni-Bitsch et al. (1998) M. E. Berbenni-Bitsch, S. Meyer, A. Schafer, J. J. M. Verbaarschot, and T. Wettig, Phys. Rev. Lett. 80, 1146 (1998), eprint hep-lat/9704018.
- Akemann et al. (1997) G. Akemann, P. H. Damgaard, U. Magnea, and S. Nishigaki, Nucl. Phys. B 487, 721 (1997), eprint hep-th/9609174.
- Jackson et al. (1997) A. D. Jackson, M. K. Sener, and J. J. M. Verbaarschot, Nucl. Phys. B 506, 612 (1997), eprint hep-th/9704056.
- Garcia-Garcia and Verbaarschot (2000) A. M. Garcia-Garcia and J. J. M. Verbaarschot, Nucl. Phys. B 586, 668 (2000), eprint hep-th/0003159.
- Akemann and Würfel (2021) G. Akemann and T. R. Würfel, JHEP 12, 128 (2021), eprint 2110.03617.
- Giordano and Kovacs (2021) M. Giordano and T. G. Kovacs, Universe 7, 194 (2021), eprint 2104.14388.
- Verbaarschot (1994b) J. J. M. Verbaarschot, Nucl. Phys. B 427, 534 (1994b), eprint hep-lat/9402006.
- Garcia-Garcia and Osborn (2007) A. M. Garcia-Garcia and J. C. Osborn, Phys. Rev. D 75, 034503 (2007), eprint hep-lat/0611019.
- Kovacs and Pittler (2010) T. G. Kovacs and F. Pittler, Phys. Rev. Lett. 105, 192001 (2010), eprint 1006.1205.
- Kovacs and Pittler (2012) T. G. Kovacs and F. Pittler, Phys. Rev. D 86, 114515 (2012), eprint 1208.3475.
- Giordano et al. (2014) M. Giordano, T. G. Kovacs, and F. Pittler, Phys. Rev. Lett. 112, 102002 (2014), eprint 1312.1179.
- Ujfalusi et al. (2015) L. Ujfalusi, M. Giordano, F. Pittler, T. G. Kovács, and I. Varga, Phys. Rev. D 92, 094513 (2015), eprint 1507.02162.
- Giordano et al. (2017) M. Giordano, S. D. Katz, T. G. Kovacs, and F. Pittler, JHEP 02, 055 (2017), eprint 1611.03284.
- Holicki et al. (2018) L. Holicki, E.-M. Ilgenfritz, and L. von Smekal, PoS LATTICE2018, 180 (2018), eprint 1810.01130.
- Cardinali et al. (2022) M. Cardinali, M. D’Elia, F. Garosi, and M. Giordano, Phys. Rev. D 105, 014506 (2022), eprint 2110.10029.
- Kehr et al. (2023) R. Kehr, D. Smith, and L. von Smekal (2023), eprint 2304.13617.
- Kovacs and Vig (2018) T. G. Kovacs and R. A. Vig, Phys. Rev. D 97, 014502 (2018), eprint 1706.03562.
- Vig and Kovacs (2020) R. A. Vig and T. G. Kovacs, Phys. Rev. D 101, 094511 (2020), eprint 2001.06872.
- Anderson (1958) P. W. Anderson, Phys. Rev. 109, 1492 (1958).
- Alexandru and Horváth (2022) A. Alexandru and I. Horváth, Phys. Lett. B 833, 137370 (2022), eprint 2110.04833.
- Alexandru and Horváth (2019) A. Alexandru and I. Horváth, Phys. Rev. D 100, 094507 (2019), eprint 1906.08047.
- Alexandru and Horváth (2021) A. Alexandru and I. Horváth, Phys. Rev. Lett. 127, 052303 (2021), eprint 2103.05607.
- Bazavov et al. (2017) A. Bazavov et al., Phys. Rev. D 95, 054504 (2017), eprint 1701.04325.
- Smilga and Stern (1993) A. V. Smilga and J. Stern, Phys. Lett. B 318, 531 (1993).
- Steinbrecher (2018) P. Steinbrecher, Ph.D. thesis, U. Bielefeld (main) (2018).
- Aoki et al. (2012) S. Aoki, H. Fukaya, and Y. Taniguchi, Phys. Rev. D 86, 114512 (2012), eprint 1209.2061.
- Akemann (2016) G. Akemann (2016), eprint 1603.06011.
- Verbaarschot (1997) J. J. M. Verbaarschot, Nucl. Phys. B Proc. Suppl. 53, 88 (1997), eprint hep-lat/9607086.
- Shuryak (1994) E. V. Shuryak, Comments Nucl. Part. Phys. 21, 235 (1994), eprint hep-ph/9310253.
- Bonati et al. (2016) C. Bonati, M. D’Elia, M. Mariti, G. Martinelli, M. Mesiti, F. Negro, F. Sanfilippo, and G. Villadoro, JHEP 03, 155 (2016), eprint 1512.06746.
- Lee and Hatsuda (1996) S. H. Lee and T. Hatsuda, Phys. Rev. D 54, R1871 (1996), eprint hep-ph/9601373.
- Cohen (1996) T. D. Cohen, Phys. Rev. D 54, R1867 (1996), eprint hep-ph/9601216.
- Mazur (2021) L. Mazur, Ph.D. thesis, Bielefeld U. (2021).
- Basko et al. (2006) D. Basko, I. Aleiner, and B. Altshuler, Annals of Physics 321, 1126 (2006), ISSN 0003-4916, URL https://www.sciencedirect.com/science/article/pii/S0003491605002630.
- Schäfer and Shuryak (1998) T. Schäfer and E. V. Shuryak, Rev. Mod. Phys. 70, 323 (1998), eprint hep-ph/9610451.
- Bruckmann et al. (2011) F. Bruckmann, T. G. Kovacs, and S. Schierenberg, Phys. Rev. D 84, 034505 (2011), eprint 1105.5336.
- Baranka and Giordano (2022) G. Baranka and M. Giordano (2022), eprint 2210.00840.
- Bornyakov et al. (2016) V. G. Bornyakov, E. M. Ilgenfritz, B. V. Martemyanov, and M. Müller-Preussker, Phys. Rev. D 93, 074508 (2016), eprint 1512.03217.
- Larsen et al. (2019) R. N. Larsen, S. Sharma, and E. Shuryak, Phys. Lett. B 794, 14 (2019), eprint 1811.07914.
- Larsen et al. (2020) R. N. Larsen, S. Sharma, and E. Shuryak, Phys. Rev. D 102, 034501 (2020), eprint 1912.09141.
- Larsen et al. (2022) R. N. Larsen, S. Sharma, and E. Shuryak, Phys. Rev. D 105, L071501 (2022), eprint 2112.04537.
- Amato et al. (2013) A. Amato, G. Aarts, C. Allton, P. Giudice, S. Hands, and J.-I. Skullerud, Phys. Rev. Lett. 111, 172001 (2013), eprint 1307.6763.
- Aarts et al. (2015) G. Aarts, C. Allton, A. Amato, P. Giudice, S. Hands, and J.-I. Skullerud, JHEP 02, 186 (2015), eprint 1412.6411.
- (69) https://doi.org/10.4119/unibi/2983780.
- (70) http://physics.utah.edu/~detar/milc.html.