Ananke: A Python Package For Causal Inference Using Graphical Models
Abstract
We implement Ananke: an object-oriented Python package for causal inference with graphical models. At the top of our inheritance structure is an easily extensible Graph class that provides an interface to several broadly useful graph-based algorithms and methods for visualization. We use best practices of object-oriented programming to implement subclasses of the Graph superclass that correspond to types of causal graphs that are popular in the current literature. This includes directed acyclic graphs for modeling causally sufficient systems, acyclic directed mixed graphs for modeling unmeasured confounding, and chain graphs for modeling data dependence and interference. Within these subclasses, we implement specialized algorithms for common statistical and causal modeling tasks, such as separation criteria for reading conditional independence, nonparametric identification, and parametric and semiparametric estimation of model parameters. Here, we present a broad overview of the package and example usage for a problem with unmeasured confounding. Up to date documentation is available at https://ananke.readthedocs.io/en/latest/.
Keywords: causal graphical models, causal identification, semiparametric estimation
1 Introduction
Causal inference is a pipeline comprised of many steps – specification of a causal model, identification of the desired causal parameter under assumptions of this model, estimation of the parameter from data based on the identifying functional, and robustness checks via sensitivity analysis and uncertainty quantification. Any of these steps may be complicated by unmeasured confounding, data dependence, and missing data. In Ananke, we implement methods that span all of these steps, including nonparametric identification and semiparametric estimation strategies, to provide analysts a unifying interface that allows them to set up end-to-end pipelines that exhibit robustness to the aforementioned complications.
In particular, we adopt an object-oriented paradigm to implement graph-based causal inference methods. We build an inheritance structure spanning causal graphical models that use any combination of directed (), bidirected (), and undirected () edges. We hope that due to its object-oriented nature and easily accessible Python implementation Ananke will improve the accessibility of many graph-based causal inference methods, and allow interested users to easily extend and build on its current infrastructure.
Related work: The doWhy package and DAGitty aim to provide a unifying interface for distinct steps in the causal inference pipeline. However, their estimation capabilities are largely limited to settings without unmeasured confounders or selection bias. In the case of doWhy, the causal graph interface is still under active development with plans to interface with Ananke rather than build one from scratch (personal communication with developers.) Other existing packages emphasize a single step in the pipeline. TETRAD and its Python port causal-learn (Scheines et al., 1998), pcalg (Kalisch et al., 2012), and cdt (Kalainathan et al., 2020) focus on graph representation and model selection; causaleffect focuses on nonparametric identification; npcausal (Kennedy, 2021), zEpid (Zevich, 2018), tmle3 (Coyle, 2021), and DoubleML (Bach et al., 2022) focus on semiparametric estimation. Other standalone packages exist as appendices to papers, and in certain cases we reimplement these algorithms in Ananke, e.g., the maximum likelihood algorithms in Evans (2013) and Drton et al. (2009). The principle advantage of Ananke over peers is that it offers a unified and easily extended interface for causal inference in a single package, with an active community.
2 Overview of Ananke’s Graph Inheritance Structure
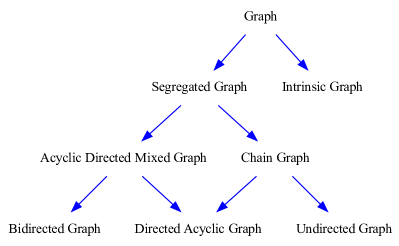
An overview of graphical models in Ananke and their inheritance structure is shown in Fig. 1. The Graph class currently supports the creation of graphs , where denotes a set of vertices and denote sets of directed (), bidirected , and undirected respectively. Within this class we implement methods and algorithms that are broadly applicable to any subclass: simple methods involving addition and deletion of edges, finding a subgraph comprised of only vertices in (and associated edges), and computing genealogical sets of a vertex, such as its ancestors, descendants, and siblings. We also implement a lightweight draw method using a Python interface to graphviz (Ellson et al., 2001; Hagberg et al., 2022) for visualizing any instance of the class or subclasses of it – all figures in this paper are produced using this functionality. The rest of the inheritance structure is based on the types of edges each graph class contains. At the lowest levels are graphs only containing a single edge type: Directed acyclic graphs (DAGs) (only edges) are the most popular type of causal graph (Robins, 1986; Spirtes et al., 2000; Pearl, 2009); Bidirected graphs (only edges) are used to represent marginal correlations and are popular in genomics (Chaudhuri et al., 2007; Cox and Wermuth, 2014); Undirected graphs (only edges) can be used to encode feedback relationships (Lauritzen, 1996). Next, we have graphs containing a mixture of edges types: Acyclic directed mixed graphs (ADMGs) model systems with causal influence (via edges) and correlation due to unmeasured confounding (via edges) (Wright, 1921; Verma and Pearl, 1990); Chain graphs model causal influence (via edges) as well as non-iid phenomena such as contagion, feedback, and symmetric relationships (via edges) (Lauritzen and Richardson, 2002; Ogburn et al., 2020; Bhattacharya et al., 2019a); Segregated graphs consisting of all three kinds of edges are capable of modeling all three mechanisms discussed above (Shpitser, 2015). We note that intrinsic graphs shown in the hierarchy of Fig. 1 are not causal graphical models, but rather a graphical representation created by us to efficiently compute all statistical kernels required to parameterize a hidden variable causal model – a necessary step for estimation discussed in Section 3. This illustrates additional use cases of our graph inheritance structure for intermediate tasks. As another example, we use our chain graph implementation to encode equivalence classes of causal DAGs – different models that imply the same restrictions on the observed data distribution – known as Complete Partially Directed Acyclic Graphs (CPDAGs). This allows Ananke to easily interface with or extend causal discovery algorithms that output such objects, e.g., implementations of greedy equivalence search or the PC algorithm in the causal-learn package (Zhang et al., 2022).
3 Data Analysis in Ananke
To illustrate usage of Ananke we step through a hypothetical analysis for assessing the effect of smoking on diabetes using a teaching dataset derived111The teaching extract of the Framingham Heart Study can be requested from https://biolincc.nhlbi.nih.gov/teaching/. from the Framingham Heart Study (Kannel and Gordon, 1968). We start by encoding substantive assumptions using an ADMG shown in Fig. 2 along with the Ananke commands used to create and visualize it.
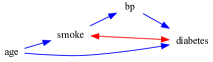
An ADMG can imply certain testable independence statements (amongst other general constraints) that can be read via m-separation (Richardson, 2003). For example, we can verify that age is m-separated from bp given smoke implying .
An analyst may verify whether the data supports such assumptions using any standard conditional independence test. Assuming Fig. 2 is correct, the next step is to apply identification theory to determine whether the desired causal effect can be expressed as a function of observed data. Applying Ananke’s implementation of a sound and complete algorithm for identification in presence of unmeasured confounding (Richardson et al., 2017) gives:
That is, the counterfactual distribution , and hence the effect, is indeed identified. Interpreting the output based on Richardson et al. (2017) gives
While the focus of this analysis is on identification under unmeasured confounding, Ananke also implements identification algorithms for missing data (Bhattacharya et al., 2019b; Nabi et al., 2020), selection bias, and data fusion (Lee et al., 2020; Lee and Shpitser, 2020). After identification, we may choose from a variety of estimation strategies offered in Ananke.
3.1 Linear Gaussian Structural Equation Models
One possible choice is to assume a linear structural equation model with correlated errors (Wright, 1934). In Ananke, we implement the iterative algorithm described in Drton et al. (2009) to obtain maximum likelihood estimates for all edge coefficients; causal effects are then computed via path analysis. Applying this to standardized Framingham data gives:
![[Uncaptioned image]](/html/2301.11477/assets/x3.png)
3.2 Möbius Parameterization for Discrete Data
An alternative is to use the Möbius parameterization of the observed data likelihood, which assumes all observed variables are discrete (Evans and Richardson, 2012). We implement a coordinate descent algorithm to compute maximum likelihood estimates for the Möbius parameters (which may be variationally dependent in general.) Using binary versions of variables in the dataset, we obtain the following result for the average causal effect.
3.3 Semiparametric Estimation of Causal Effects
If the effect is identified, Ananke lists several semiparametric estimation strategies, proposed by Bhattacharya et al. (2022), and suggests the best one according to semiparametric efficiency theory. The implementation only requires specification of the ADMG, treatment, and outcome. Using Ananke’s suggestion of efficient augmented primal IPW estimator gives:
Acknowledgments
We thank Preethi Prakash and Ranjani Srinivasan for contributions to Ananke, and Carson Kurtz for assisting R.B. in testing code.
References
- Bach et al. (2022) Philipp Bach, Victor Chernozhukov, Malte S. Kurz, and Martin Spindler. DoubleML – An object-oriented implementation of double machine learning in Python. Journal of Machine Learning Research, 23(53):1–6, 2022. URL http://jmlr.org/papers/v23/21-0862.html.
- Bhattacharya et al. (2019a) Rohit Bhattacharya, Daniel Malinsky, and Ilya Shpitser. Causal inference under interference and network uncertainty. In Proceedings of the 35th Conference on Uncertainty in Artificial Intelligence. AUAI Press, 2019a.
- Bhattacharya et al. (2019b) Rohit Bhattacharya, Razieh Nabi, Ilya Shpitser, and James M. Robins. Identification in missing data models represented by directed acyclic graphs. In Proceedings of the 35th Conference on Uncertainty in Artificial Intelligence. AUAI Press, 2019b.
- Bhattacharya et al. (2022) Rohit Bhattacharya, Razieh Nabi, and Ilya Shpitser. Semiparametric inference for causal effects in graphical models with hidden variables. Journal of Machine Learning Research, 23:1–76, 2022.
- Chaudhuri et al. (2007) Sanjay Chaudhuri, Mathias Drton, and Thomas S Richardson. Estimation of a covariance matrix with zeros. Biometrika, 94(1):199–216, 2007.
- Cox and Wermuth (2014) David Roxbee Cox and Nanny Wermuth. Multivariate dependencies: Models, analysis and interpretation. Chapman and Hall/CRC, 2014.
- Coyle (2021) Jeremy R Coyle. tmle3: The extensible TMLE framework. https://github.com/tlverse/tmle3, 2021. URL https://doi.org/10.5281/zenodo.4603358. R package version 0.2.0.
- Drton et al. (2009) Mathias Drton, Michael Eichler, and Thomas S. Richardson. Computing maximum likelihood estimates in recursive linear models with correlated errors. Journal of Machine Learning Research, 10(10), 2009.
- Ellson et al. (2001) John Ellson, Emden Gansner, Lefteris Koutsofios, Stephen C North, and Gordon Woodhull. Graphviz—open source graph drawing tools. In International Symposium on Graph Drawing, pages 483–484. Springer, 2001.
- Evans (2013) Robin J Evans. ADMGs. https://www.stats.ox.ac.uk/~evans/software.htm, 2013.
- Evans and Richardson (2012) Robin J. Evans and Thomas S. Richardson. Maximum likelihood fitting of acyclic directed mixed graphs to binary data. 2012. URL http://arxiv.org/abs/1203.3479.
- Hagberg et al. (2022) Aric Hagberg, Dan Schult, and Manos Renieris. Pygraphviz. 2022. URL https://github.com/pygraphviz/pygraphviz.
- Kalainathan et al. (2020) Diviyan Kalainathan, Olivier Goudet, and Ritik Dutta. Causal discovery toolbox: Uncovering causal relationships in python. Journal of Machine Learning Research, 21(37):1–5, 2020.
- Kalisch et al. (2012) Markus Kalisch, Martin Mächler, Diego Colombo, Marloes H. Maathuis, and Peter Bühlmann. Causal inference using graphical models with the R package pcalg. Journal of Statistical Software, 47:1–26, 2012.
- Kannel and Gordon (1968) William B. Kannel and Tavia Gordon. The Framingham Study: an epidemiological investigation of cardiovascular disease. Number 9-13. Department of Health, Education, and Welfare, 1968.
- Kennedy (2021) Ed Kennedy. npcausal: Nonparametric causal inference methods. https://github.com/ehkennedy/npcausal, 2021.
- Lauritzen (1996) Steffen L. Lauritzen. Graphical Models. Oxford, U.K.: Clarendon, 1996.
- Lauritzen and Richardson (2002) Steffen L. Lauritzen and Thomas S. Richardson. Chain graph models and their causal interpretations. Journal of the Royal Statistical Society: Series B (Statistical Methodology), 64(3):321–348, 2002.
- Lee and Shpitser (2020) Jaron J. R. Lee and Ilya Shpitser. Identification methods with arbitrary interventional distributions as inputs. arXiv preprint arXiv:2004.01157, 2020.
- Lee et al. (2020) Sanghack Lee, Juan D Correa, and Elias Bareinboim. General identifiability with arbitrary surrogate experiments. In Uncertainty in artificial intelligence, pages 389–398. PMLR, 2020.
- Nabi et al. (2020) Razieh Nabi, Rohit Bhattacharya, and Ilya Shpitser. Full law identification in graphical models of missing data: completeness results. In International Conference on Machine Learning, pages 7153–7163. PMLR, 2020.
- Ogburn et al. (2020) Elizabeth L. Ogburn, Ilya Shpitser, and Youjin Lee. Causal inference, social networks and chain graphs. Journal of the Royal Statistical Society: Series A (Statistics in Society), 183(4):1659–1676, 2020.
- Pearl (2009) Judea Pearl. Causality. Cambridge University Press, 2009.
- Richardson (2003) Thomas S. Richardson. Markov properties for acyclic directed mixed graphs. Scandinavian Journal of Statistics, 30(1):145–157, 2003.
- Richardson et al. (2017) Thomas S. Richardson, Robin J. Evans, James M. Robins, and Ilya Shpitser. Nested Markov properties for acyclic directed mixed graphs, 2017. Working paper.
- Robins (1986) James M. Robins. A new approach to causal inference in mortality studies with a sustained exposure period – application to control of the healthy worker survivor effect. Mathematical Modelling, 7(9-12):1393–1512, 1986.
- Scheines et al. (1998) Richard Scheines, Peter Spirtes, Clark Glymour, Christopher Meek, and Thomas Richardson. The tetrad project: Constraint based aids to causal model specification. Multivariate Behavioral Research, 33(1):65–117, 1998.
- Shpitser (2015) Ilya Shpitser. Segregated graphs and marginals of chain graph models. In Advances in Neural Information Processing Systems, pages 1720–1728, 2015.
- Spirtes et al. (2000) Peter L. Spirtes, Clark N. Glymour, and Richard Scheines. Causation, Prediction, and Search. MIT press, 2000.
- Verma and Pearl (1990) Thomas Verma and Judea Pearl. Equivalence and synthesis of causal models. In Proceedings of the 6th Annual Conference on Uncertainty in Artificial Intelligence, 1990.
- Wright (1921) Sewall Wright. Correlation and causation. Journal of Agricultural Research, 20:557–580, 1921.
- Wright (1934) Sewall Wright. The method of path coefficients. Annals of Mathematical Statistics, 5(3):161–215, 1934.
- Zevich (2018) Paul Zevich. zEpid: An epidemiology analysis toolkit. https://github.com/pzivich/zepid/, 2018. Python package.
- Zhang et al. (2022) Kun Zhang, Joseph Ramsey, Mingming Gong, Ruichu Cai, Shohei Shimizu, Peter Spirtes, Clark Glymour, et al. causal-learn: Causal Discovery for Python. https://github.com/cmu-phil/causal-learn, 2022.