Strong Variability in AzV 493, an Extreme Oe-Type Star in the SMC
Abstract
We present 18 years of OGLE photometry together with spectra obtained over 12 years, revealing that the early Oe star AzV 493 shows strong photometric ( mag) and spectroscopic variability with a dominant, 14.6-year pattern and 40-day oscillations. We estimate stellar parameters K, , , and sin km s-1. Direct spectroscopic evidence shows episodes of both gas ejection and infall. There is no X-ray detection, and it is likely a runaway star. AzV 493 may have an unseen companion on a highly eccentric () orbit. We propose that close interaction at periastron excites ejection of the decretion disk, whose variable emission-line spectrum suggests separate inner and outer components, with an optically thick outer component obscuring both the stellar photosphere and the emission-line spectrum of the inner disk at early phases in the photometric cycle. It is plausible that AzV 493’s mass and rotation have been enhanced by binary interaction followed by the core-collapse supernova explosion of the companion, which now could be either a black hole or neutron star. This system in the Small Magellanic Cloud can potentially shed light on OBe decretion disk formation and evolution, massive binary evolution, and compact binary progenitors.
1 Introduction
Binary interactions are now understood to be a fundamental component of massive star evolution, and they are the progenitors of a wide variety of energetic phenomena including high-mass X-ray binaries (HMXBs), ultra-luminous X-ray sources (ULXs), stripped-envelope core-collapse supernovae (SNe), and gravitational wave events. A consensus is emerging that classical OBe stars appear to originate from close massive binary systems, wherein they have spun up through mass and angular momentum transfer from their mass donors (e.g, Pols et al. 1991; Vinciguerra et al. 2020; Bodensteiner et al. 2020, see also Rivinius et al. 2013 for a review). When donor stars subsequently explode as supernovae, resulting post-explosion bound binaries are more likely to be eccentric, since they result from tight binaries (e.g., Brandt & Podsiadlowski, 1995; Tauris & Takens, 1998; Renzo et al., 2019). Thus, a substantial subset of classical OBe stars are likely to have eccentric orbits. In this paper, we present photometric and spectrocopic time-series data showing that the star AzV 493 exhibits dramatic variability and may be an eccentric binary system.
AzV 493 (Azzopardi et al., 1975) or [M2002]SMC-77616 (Massey, 2002) was identified as an extreme, classical Oe star by Golden-Marx et al. (2016). In that work, it was found to be the earliest classical Oe star in our sample of field OB stars in the Small Magellanic Cloud (SMC), based on a spectrum obtained in 2009 that shows double-peaked emission, not only in the Balmer lines, but also in He i and He ii , the latter feature being rarely observed in other Oe stars (Conti & Leep, 1974). Specifically, it is classified as an Ope star, indicating that the He i absorption lines show infilled emission (Sota et al., 2011).
As an extreme object, AzV 493 offers unique opportunities to study massive binary evolution and decretion disk formation, structure, and dynamics. Section 2 presents the unusual light curve and periodicity, and Section 3 presents our multi-epoch spectroscopy with resulting derived stellar parameters and individual spectral features. We then present two possible models for the AzV 493 system in Sections 4 and 5, one based on ejection of an optically thick disk near periastron; and another based on disk growth and disruption. Section 6 discusses the likely binary origin of the system, and Section 7 summarizes our findings.
2 Photometric light curve
2.1 Long-term light curve
The and -band light curves of AzV 493 from the OGLE Project (Udalski et al., 2008, 2015) are presented in Figure 1. The -band shows a short eruption with the peak of the light curve on MJD 52212, followed by an abrupt decline of approximately 1.2 mag, to a minimum on MJD 52303 in early 2002. After this, the star eventually recovers its original luminosity. Another photometric minimum is seen in 2016 on MJD 57626, followed by the same brightening pattern. The gray symbols in Figure 1 show the -band photometry from the 2016 cycle overplotted on the data from 2002 cycle. This shows that the minimum luminosity and subsequent increase are quantitatively identical, although the photometry immediately preceding the minimum differs. Cross-correlating these segments yields a long-cycle period of 5311 days (14.55 years). There is no evidence of a similar eruption preceding the minimum in the 2016 cycle on the same 91-day timescale, although the photometry is incomplete in this range.
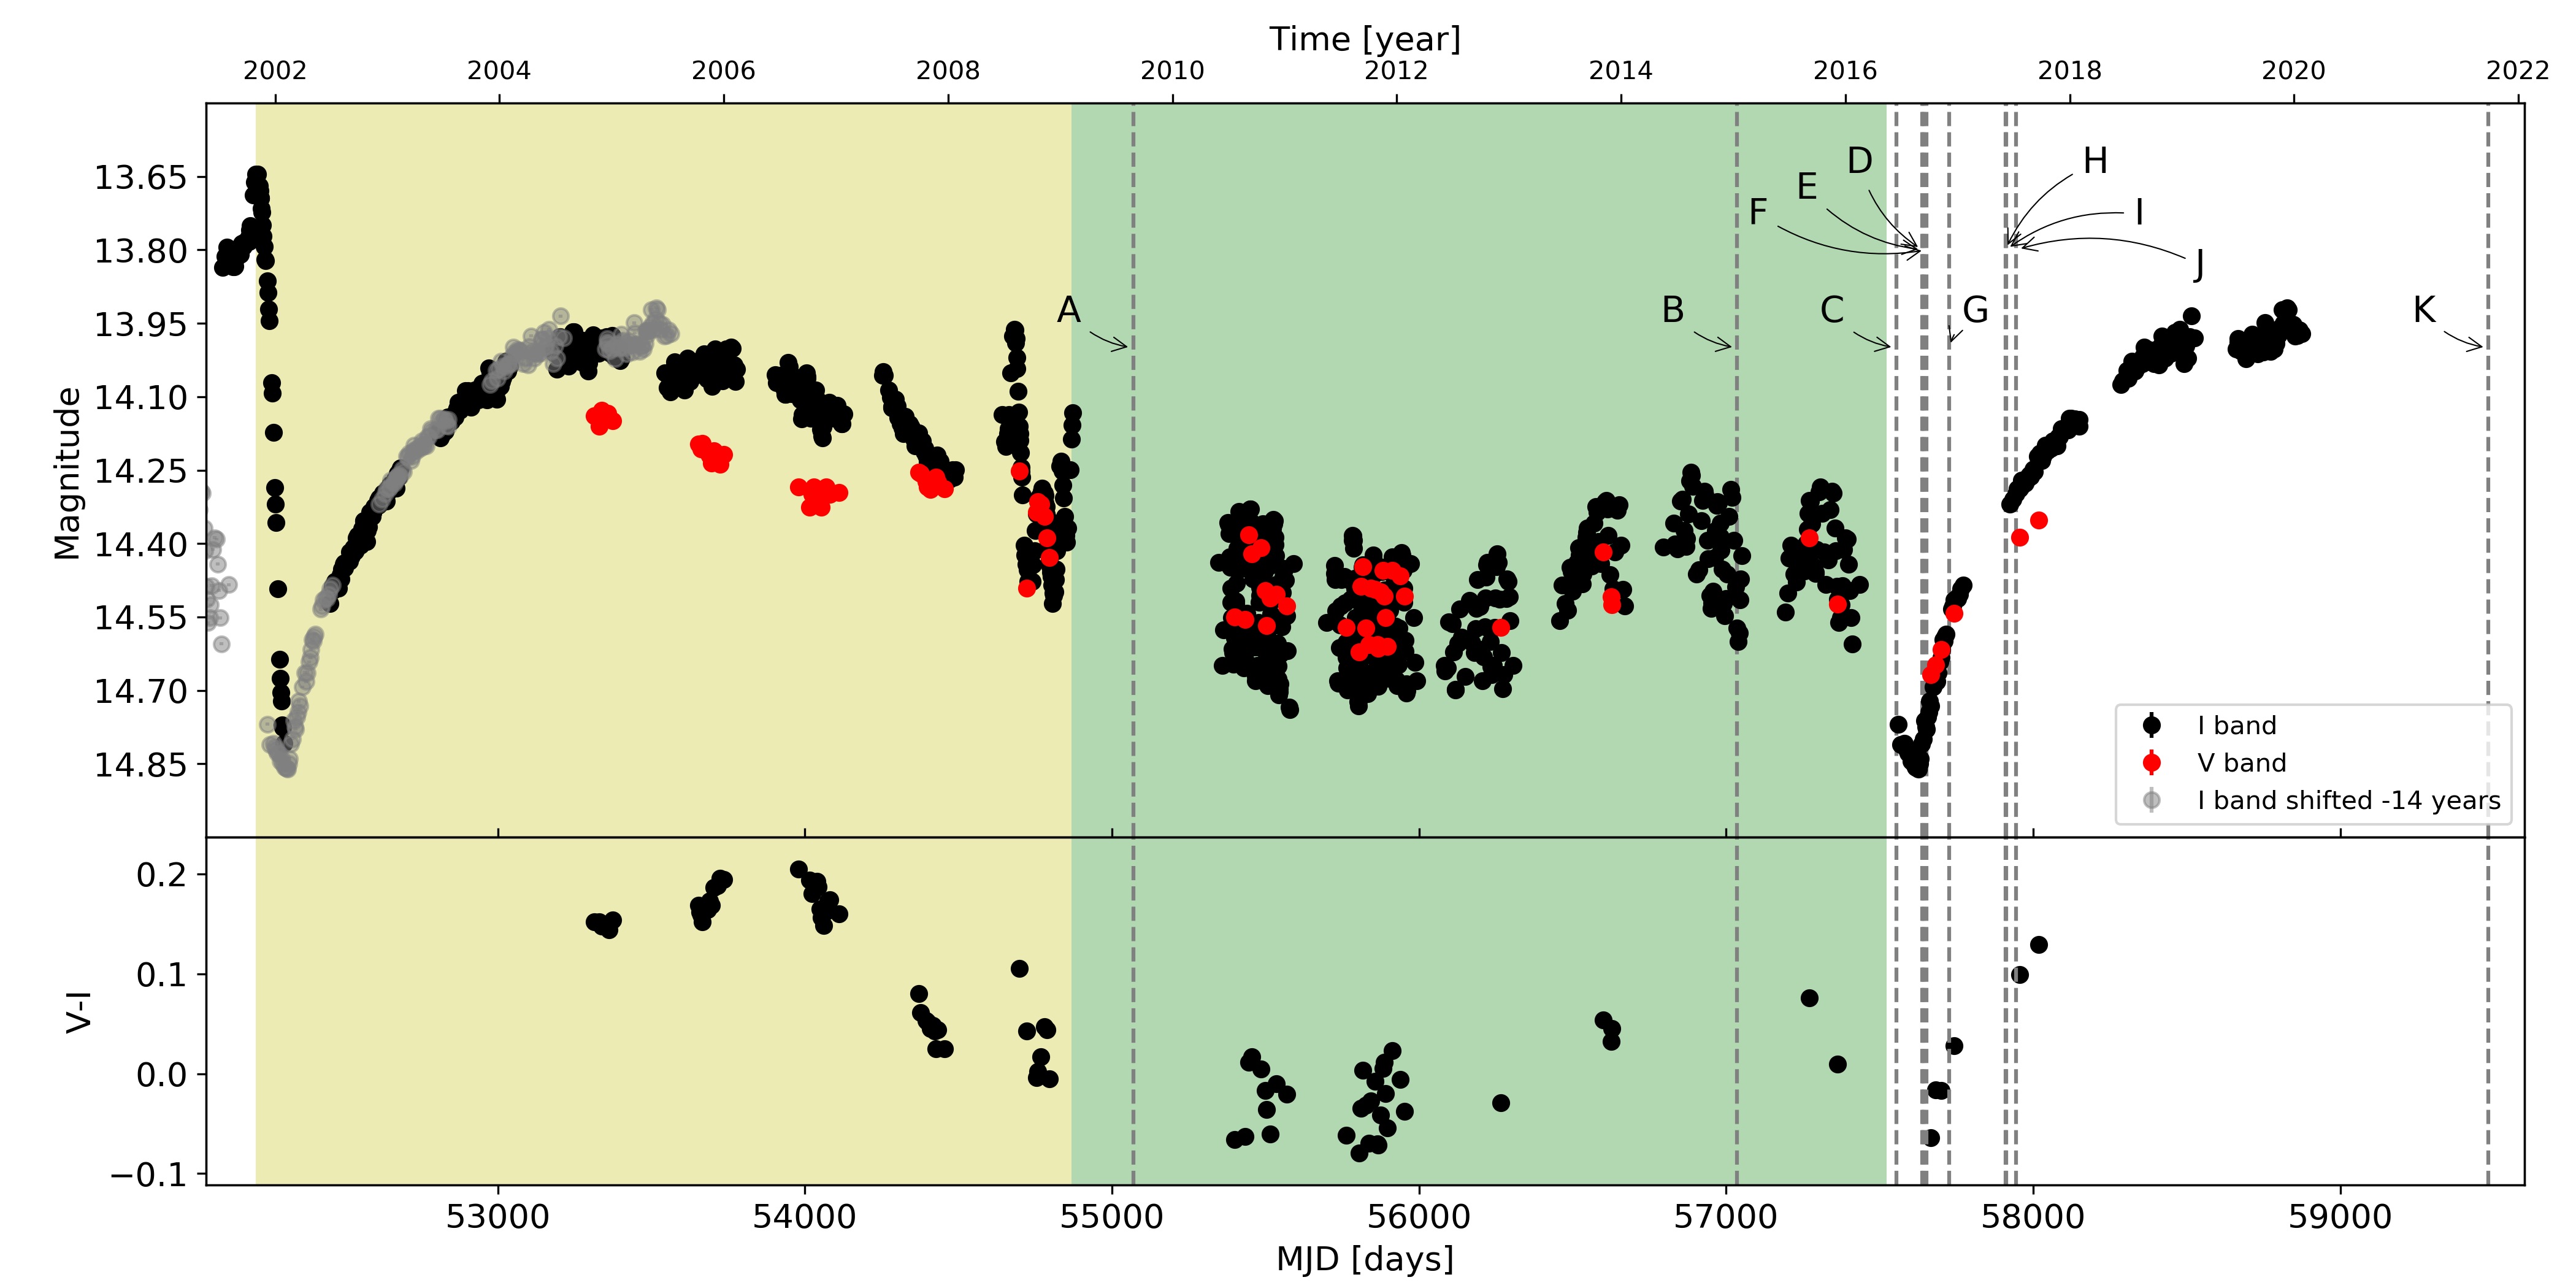
After the minimum, the brightness increases and then starts to gradually decrease again, over a period of several years. Approximately in 2008, AzV 493 appears to go into a multiple outburst event. After this, the light curve drastically changes, showing a multi-mode pulsation behavior that evolves with time (Section 2.2). The pulsation ends with another 0.2 – 0.3 mag drop, followed by a steady increase, repeating the light curve cycle that started in 2002, 14.55 years before.
2.2 Photometric Oscillations
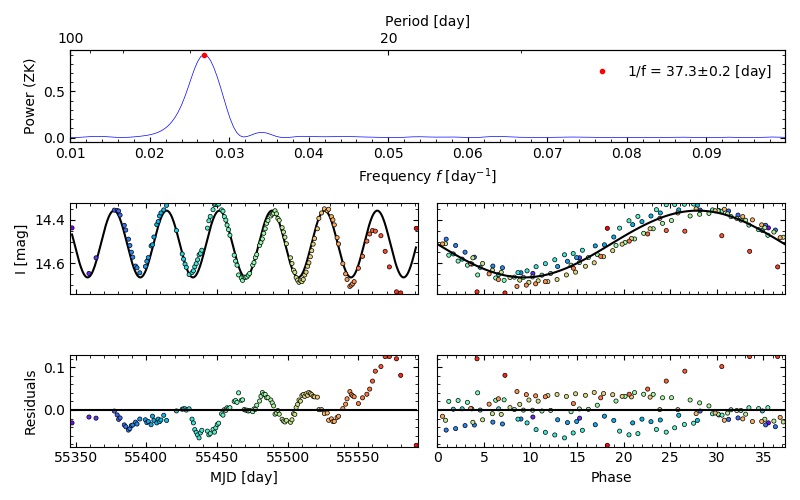
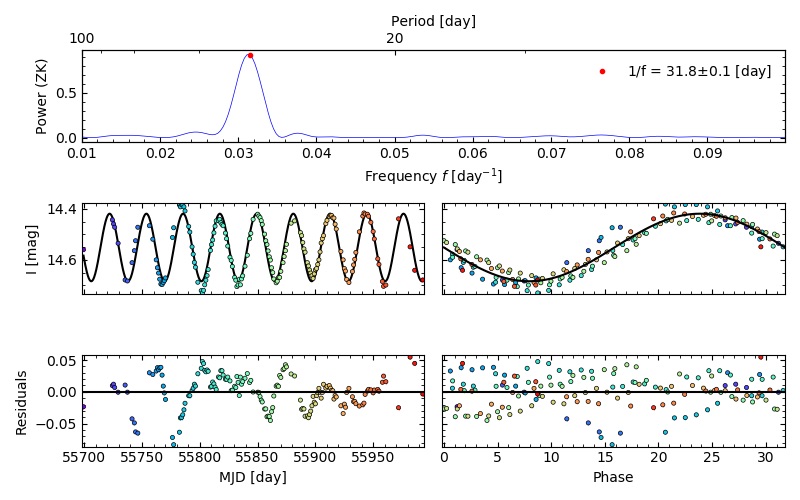
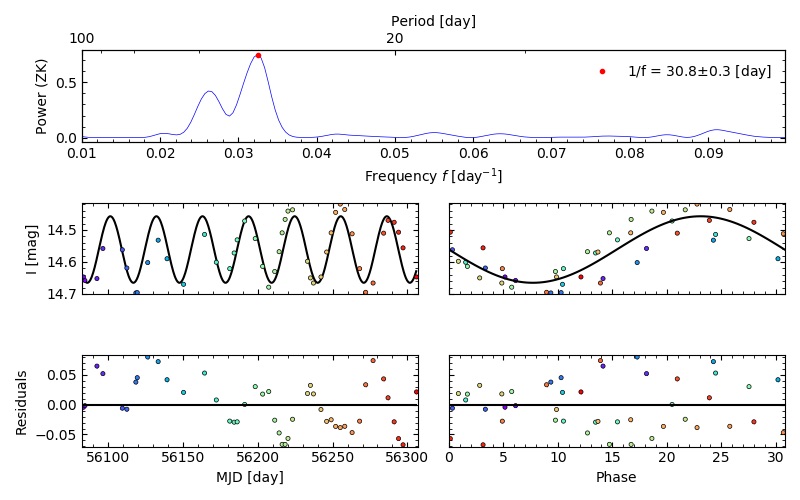
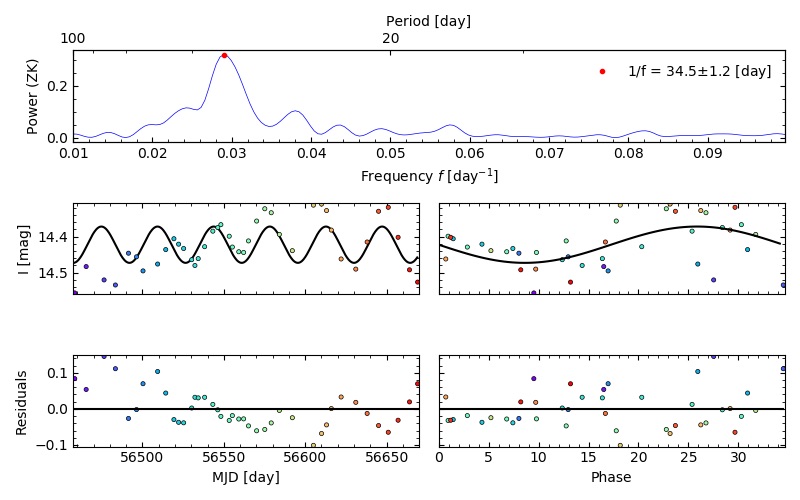
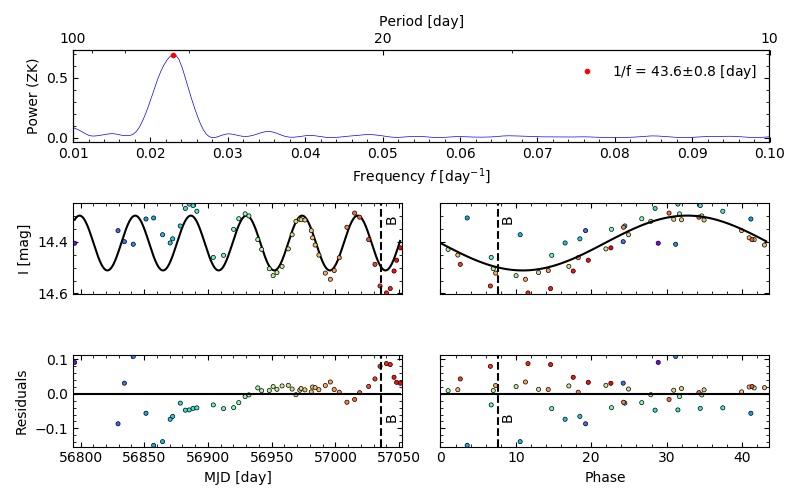
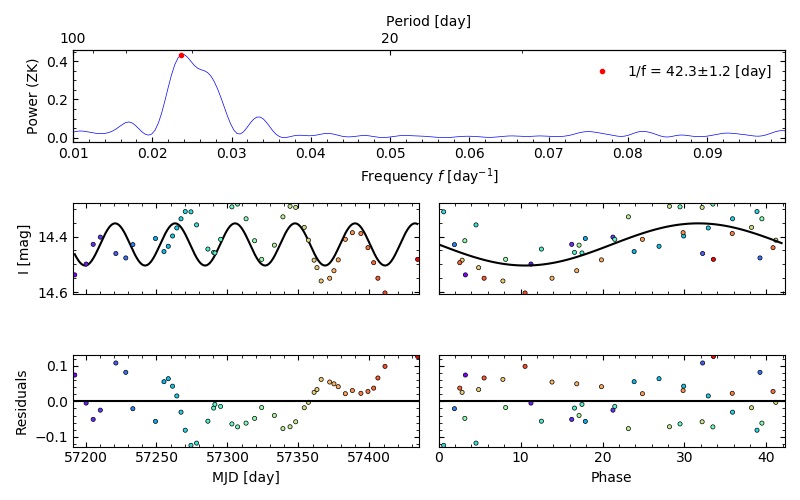
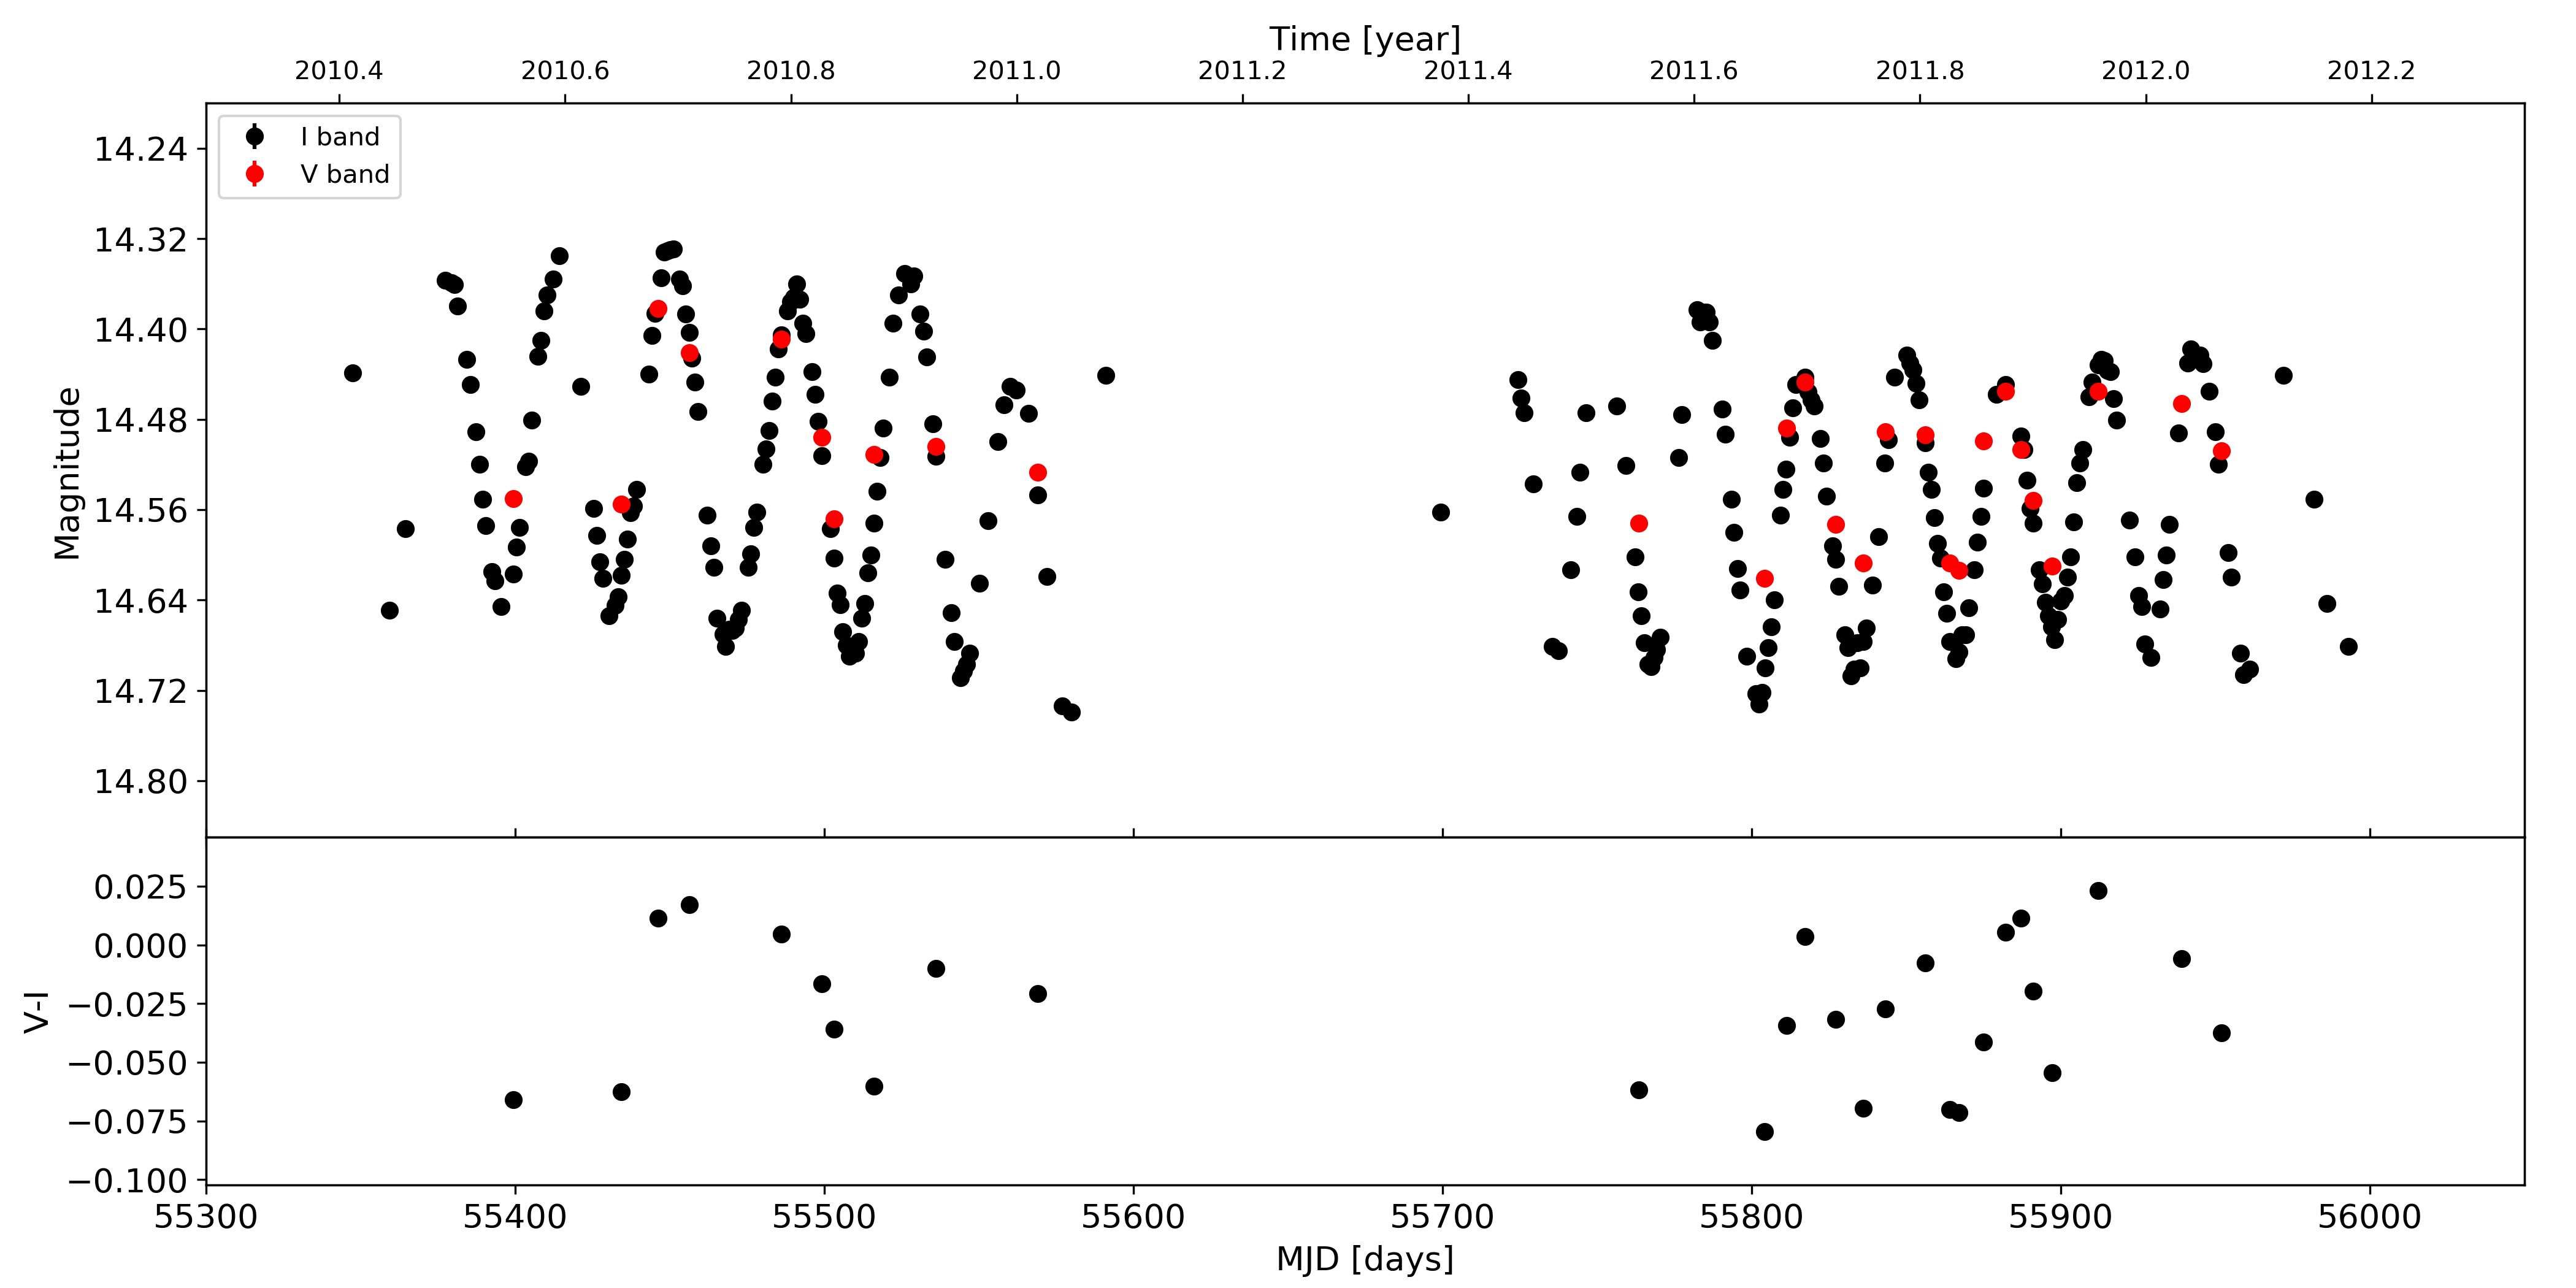
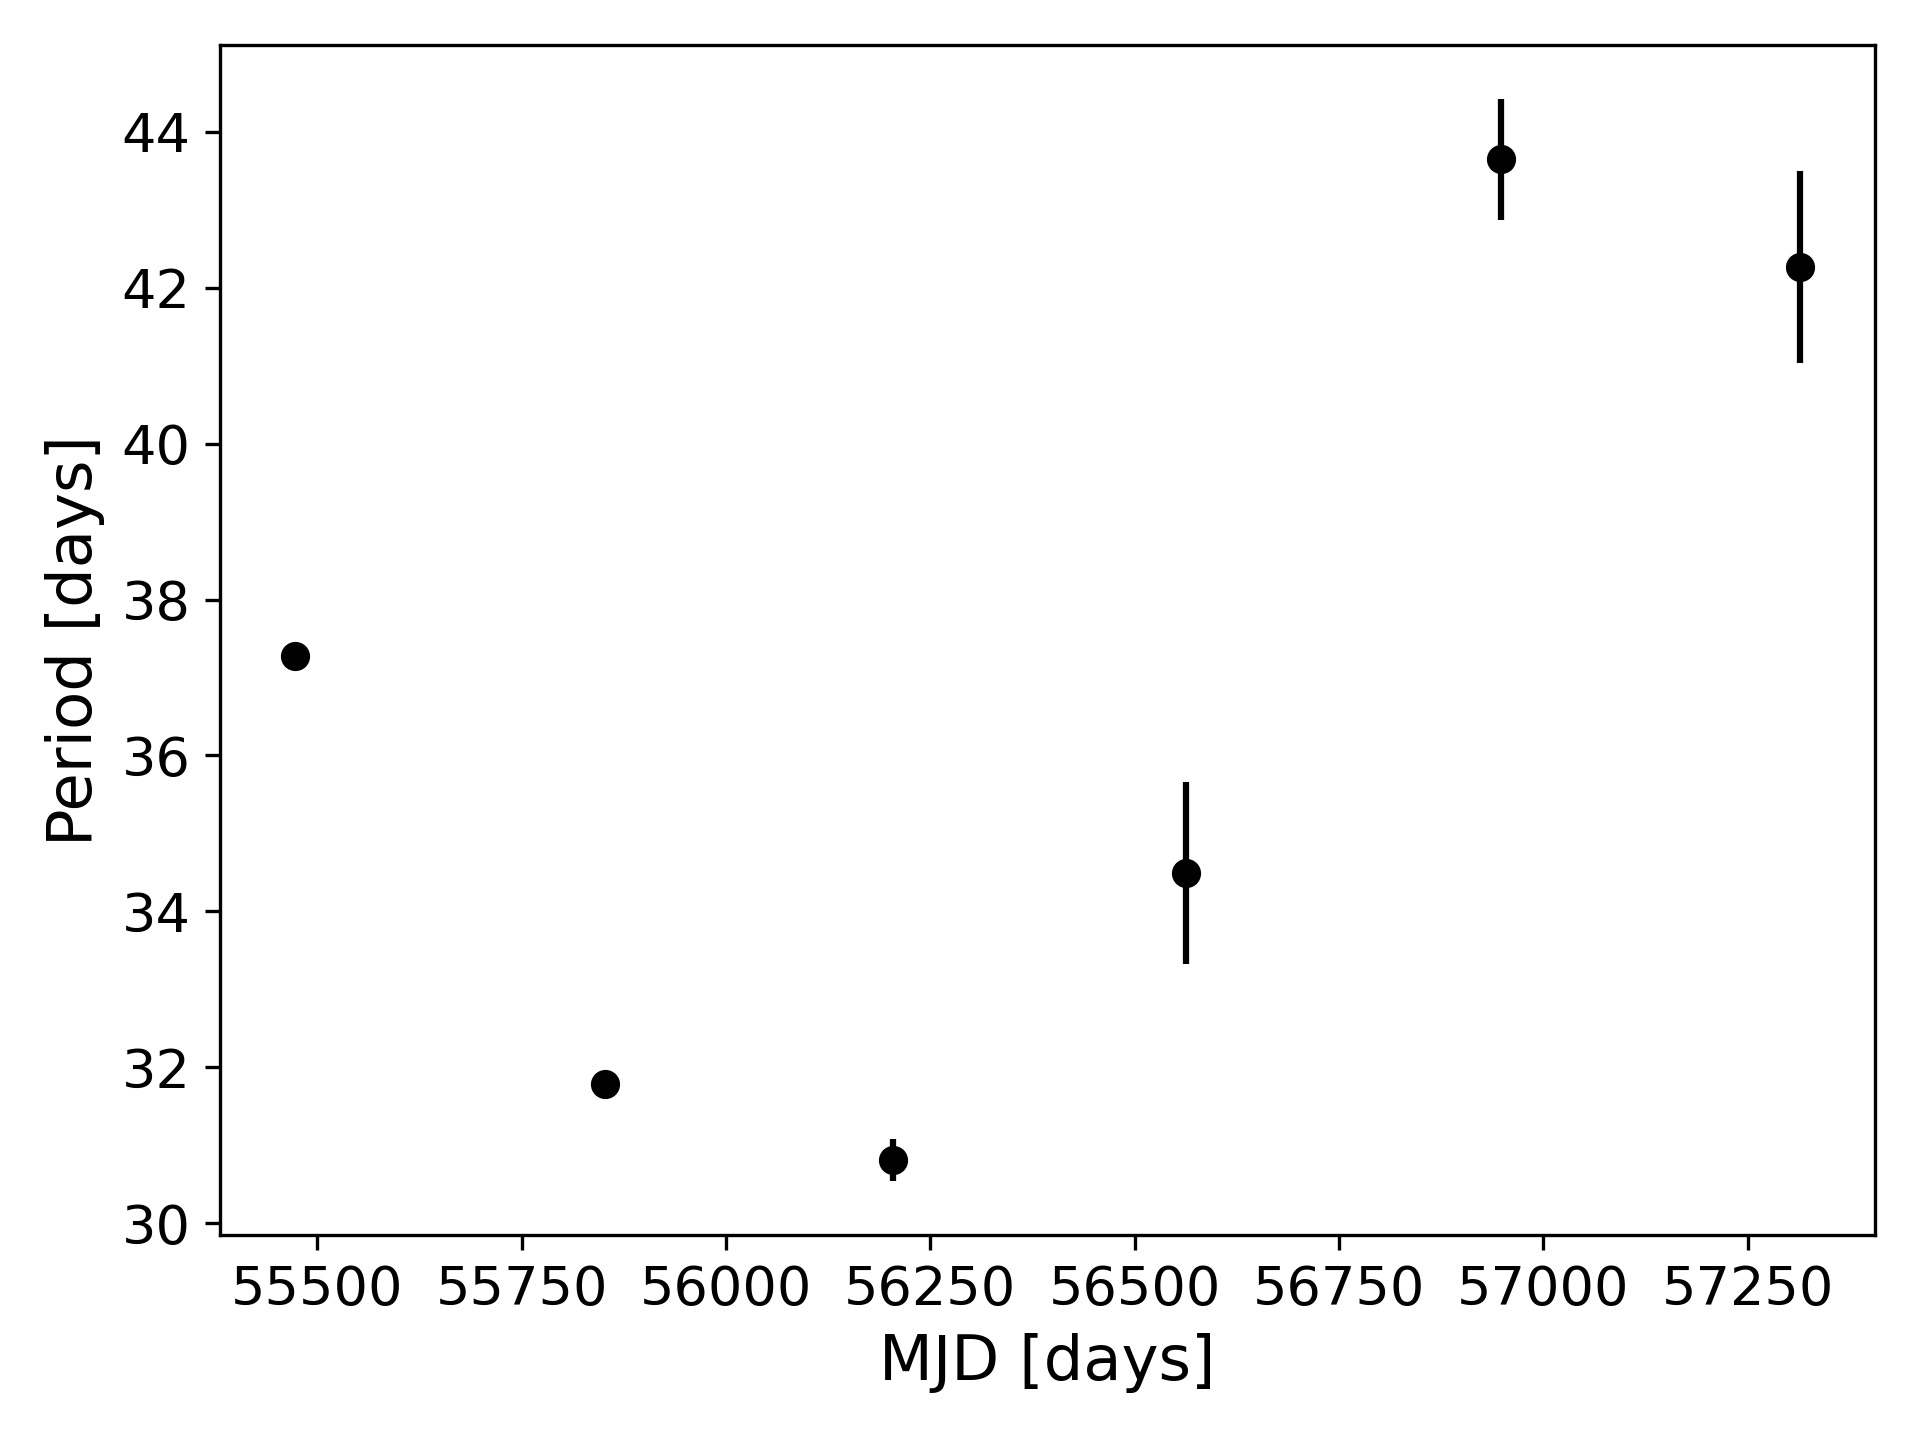
Figure 2 shows short-term variability on the order of 30 – 45 days. We quantify the evolution of these oscillations seen in the -band light curve using Generalized Lomb-Scargle periodograms (Zechmeister & Kürster, 2009) for the six contiguous OGLE datasets from 2010 – 2016 (Figure 1). The individual fits to these six ranges are shown in Appendix A. Comparison of the periods shown in Figure 3 with the light curve (Figure 1) shows that they qualitatively appear to correlate with stellar brightness.
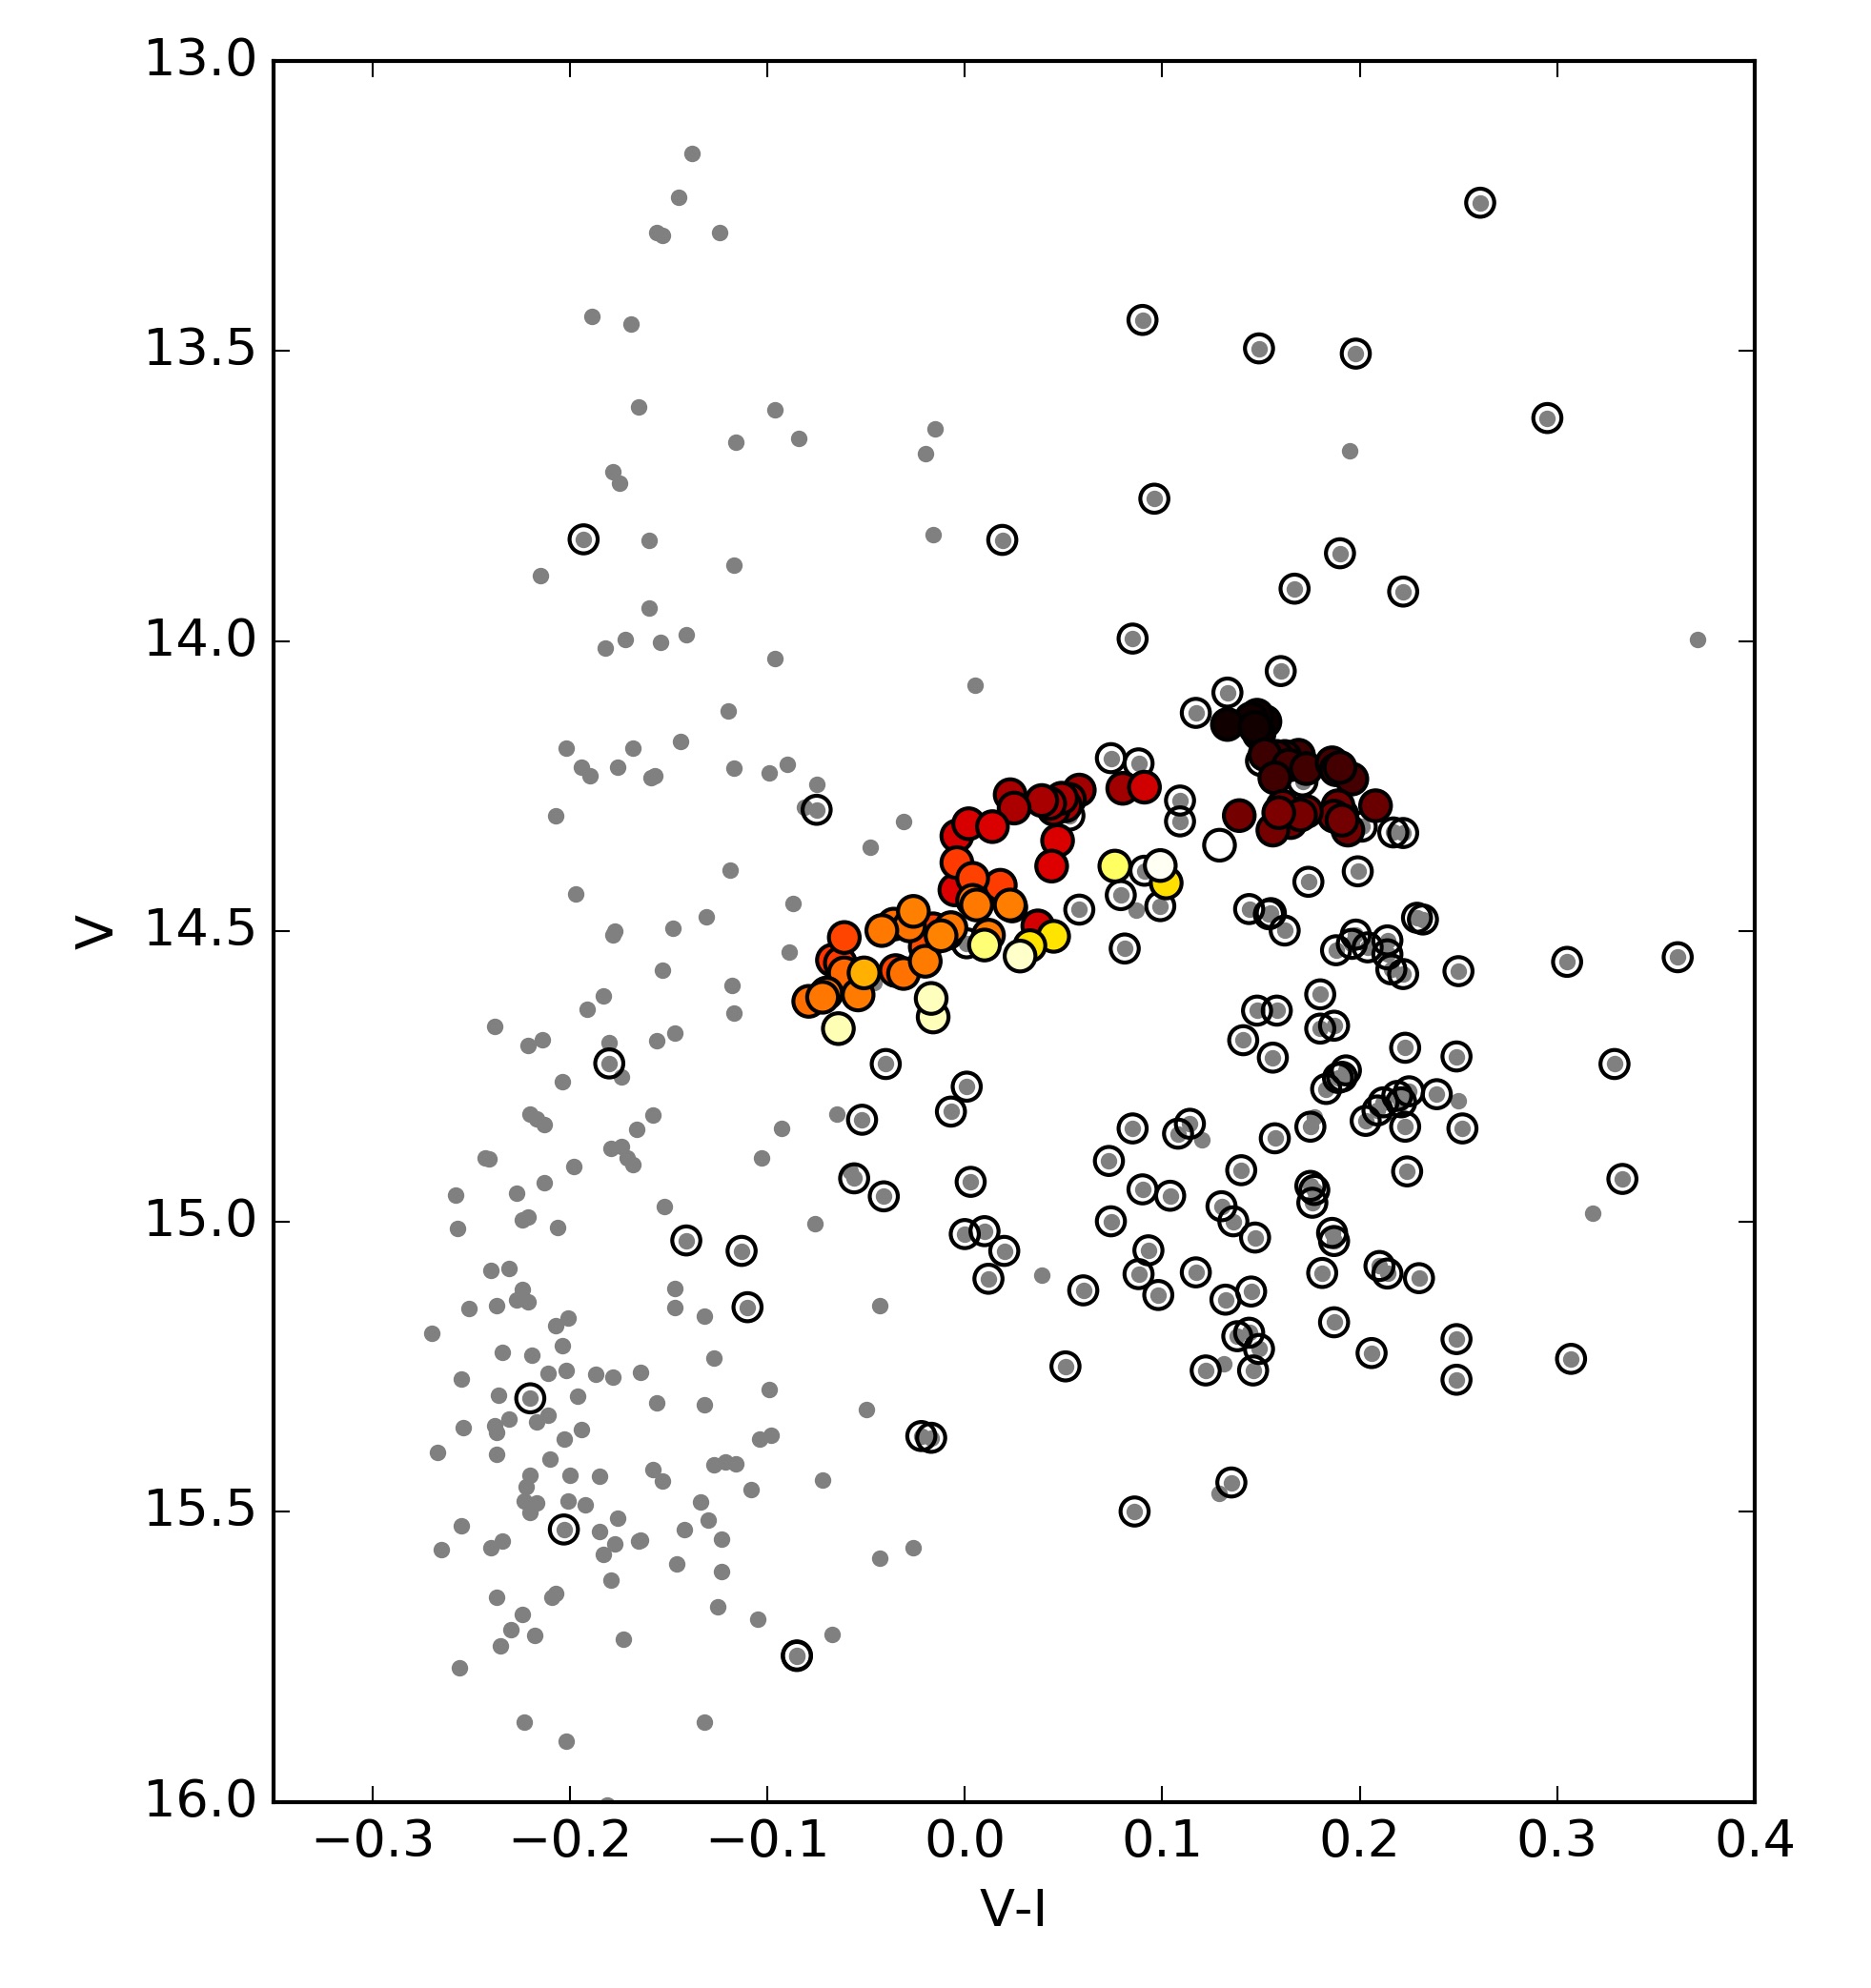
The OGLE survey provides -band magnitudes for a subset of the survey epochs, which are shown in red in Figure 1. Figure 4 displays the color-magnitude diagram (CMD) in vs for those days where both bands were observed. Figure 4a compares AzV 493’s color variations with data for the remainder of the RIOTS4 sample stars (Lamb et al., 2016). The latter correspond to single-epoch photometry from the OGLE catalog of Poleski et al. (2012). Those stars classified as OBe stars by Lamb et al. (2016) are marked in the plot. The blue plume of non-emission-line stars is clearly separated from the cloud of OBe stars at redder colors in the CMD, a phenomenon already known from different photometric bands (e.g., Bonanos et al., 2010; Castro et al., 2018). The color variation of AzV 493 spans almost the entire range of colors covered by the emission-line stars.
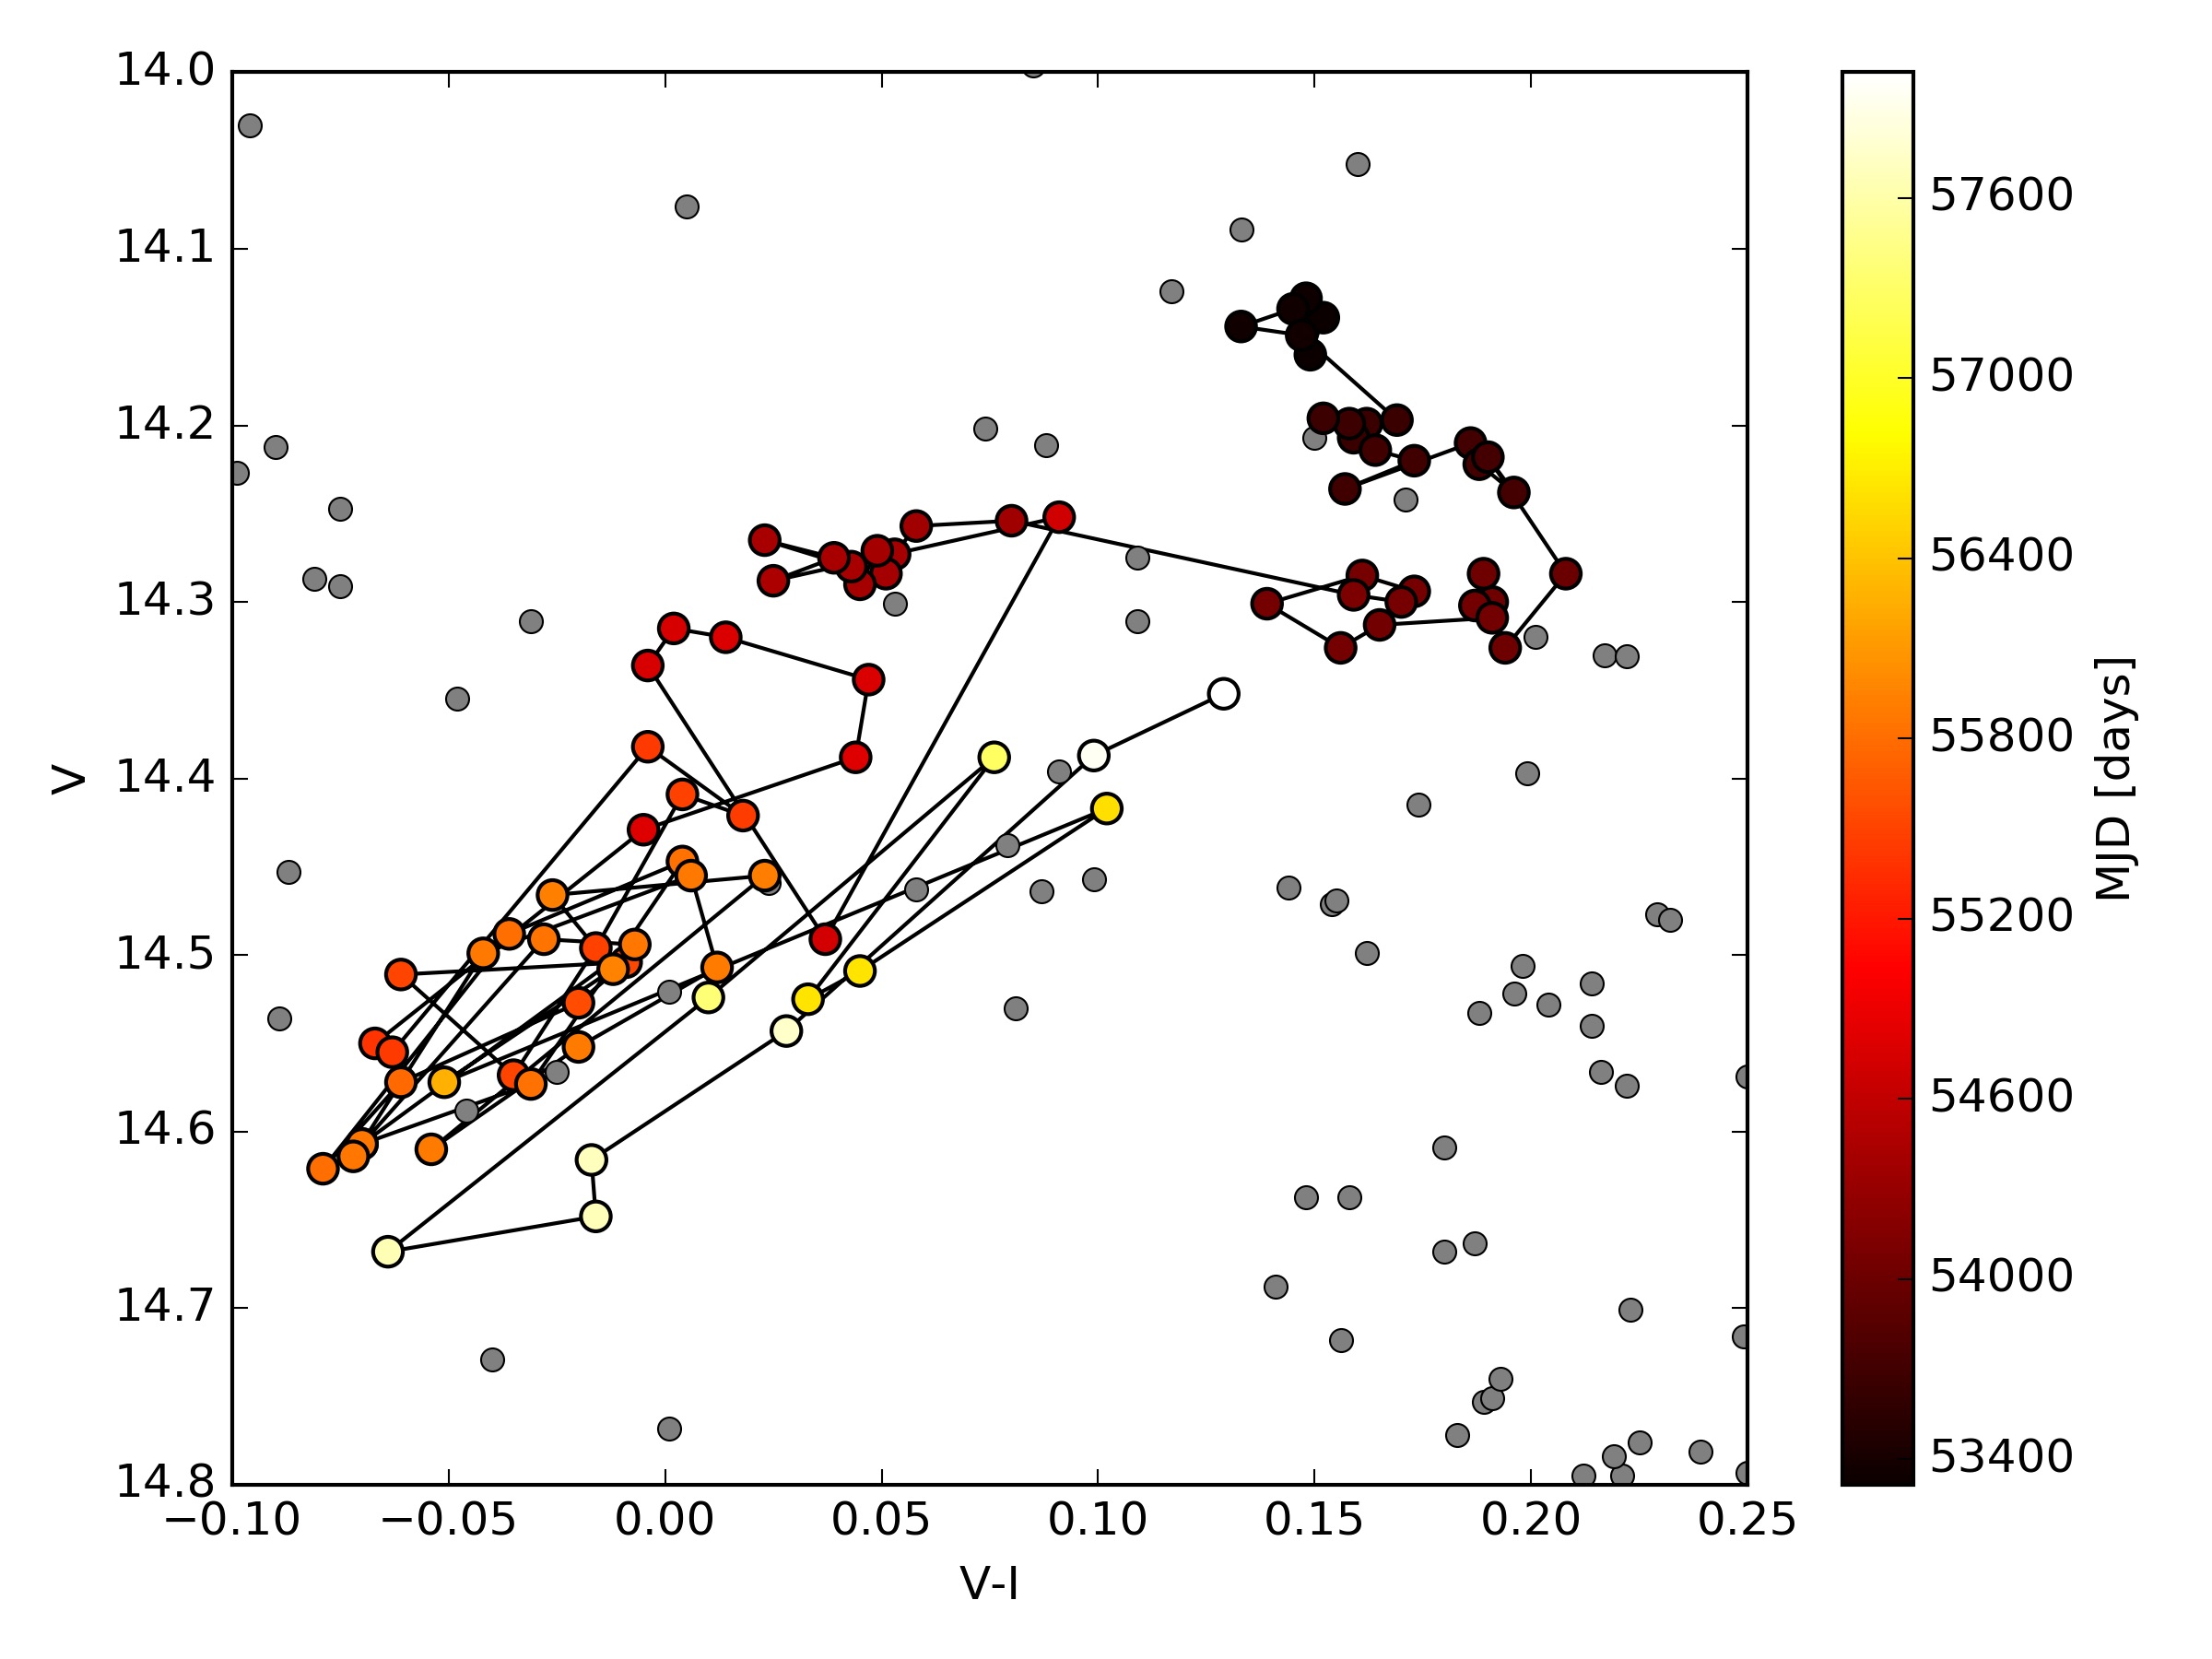
Figure 4b shows a zoom in the CMD with the path of AzV 493 traced out. The star appears red during the broad peak of the light curve around 2006 (Figure 1), and then moves to bluer colors reaching the bluest color during the pulsation phase. Approximately in 2017, when the light curve is brightening after the minimum, AzV 493 shows redder colors again, moving to the original position observed in 2005 with .
Similar, semi-periodic variability with timescales on the order of weeks to months is seen in many other OBe stars, and their origin is unknown (e.g., Labadie-Bartz et al., 2017). Proposed explanations include forms of non-radial pulsations of the star and transitory or orbiting density enhancements in the disk, which may be the most likely scenario. The associated cyclical variation in the CMD (Figure 4) is also consistent with some kind of stellar radial pulsation. This is supported by the correlation between period and luminosity (cf. Figures 3 and 4). In that case, the relatively long period implies that they could be an induced gravity mode or pulsational instability. However, there are many other possible explanations, perhaps including interactions with another star in a close orbit. We note that de Wit et al. (2006, see also ) reported similar loop-like excursions in the CMD of other OBe stars, and ascribed the anti-clockwise variation to the formation and dissipation of the circumstellar decretion disks in those objects.
2.3 Light curve period
It is possible that the multiple-outburst event in 2008 – 2009 may represent another periastron. Figure 1 shows the 5311-day cycle initiated at the light-curve peak at MJD 52212 instead of at the minima. We see that the mid-cycle occurs during this multiple-outburst event, although due to the OGLE observing cadence, it is unclear whether it occurs near the end or near the middle. In Section 3 below, we show that the spectrum obtained around this time, Epoch A (Figure 1), shows an unusually strong emission-line spectrum, consistent with maximum disk activation and flaring. However, the light curve does not repeat the cycle minimum seen in 2002 and 2016, and OBe stars are known to show temporary outbursts of activity (e.g., Labadie-Bartz et al., 2017; Baade et al., 2018).
Thus, it is not clear whether 2008 – 2009 corresponds to the mid-cycle or not. The light curve does not repeat regularly in detail, and we caution that the period, if the system is a binary, is uncertain. Assuming that there is indeed a fundamental physical period, the same phases may not all generate the same observational signatures, which may depend on other factors such as disk orientation and/or varying physical processes. In what follows, we adopt a system period of 5311 (2656) days, or 14.55 (7.28) years, where the values in parentheses allow for the possibility that the period may be half of the long cycle.
3 Spectroscopy
| Epoch | Date [UTC] | MJD | S/N | Wavelength | PhaseaaPhase relative to the light curve peak at MJD 52212 (54868), adopting a period of 5311 (2655.5) days. | RV | bbH peak separation obtained by fitting two gaussians with fixed width of 2 Å (). | Instrument | |
|---|---|---|---|---|---|---|---|---|---|
| Range [Å] | (km s-1) | (km s-1) | |||||||
| A | 2009-08-26T01:43:36.0 | 55069.071944 | 140 | 3000 | 3825–5422 | 0.538 (0.076) | 279 | IMACS | |
| B | 2015-01-14T02:12:03.0 | 57036.091701 | 120 | 28000 | 3362–9397 | 0.908 (0.817) | (213)ccEpoch B does not show a double-peaked profile (see Figure 7 and Section 3.4); the value for assumes that two components exist, as they do for other epochs. | MIKE | |
| C | 2016-06-15T07:47:54.3 | 57554.324935 | 130 | 3000 | 3879–5479 | 0.006 (0.012) | 346 | IMACS | |
| D | 2016-09-08T01:42:08.0 | 57639.070926 | 60 | 28000 | 4079–4466 | 0.022 (0.044) | M2FS | ||
| E | 2016-09-11T02:49:33.0 | 57642.117743 | 90 | 28000 | 4080–4465 | 0.022 (0.045) | M2FS | ||
| F | 2016-09-22T05:36:51.0 | 57653.233924 | 150 | 28000 | 3538–9397 | 0.024 (0.049) | 334 | MIKE | |
| G | 2016-12-04T04:09:41.5 | 57726.173397 | 110 | 3000 | 3862–5458 | 0.038 (0.076) | 319 | IMACS | |
| H | 2017-06-05T06:35:11.2 | 57909.274435 | 50 | 3000 | 3871–5471 | 0.073 (0.145) | 322 | IMACS | |
| I | 2017-06-07T08:08:18.9 | 57911.339108 | 130 | 1300 | 3900–8000 | 0.073 (0.146) | 295 | IMACSddfootnotemark: | |
| J | 2017-07-10T09:05:00.5 | 57944.378478 | 190 | 3000 | 3854–5468 | 0.079 (0.159) | 303 | IMACS | |
| K | 2021-09-25T07:38:18.0 | 59482.318264 | 210 | 28000 | 3362–9397 | 0.369 (0.738) | 289 | MIKE |
Epoch I was observed with the f/2 camera while the other IMACS observations were obtained with the f/4 camera.
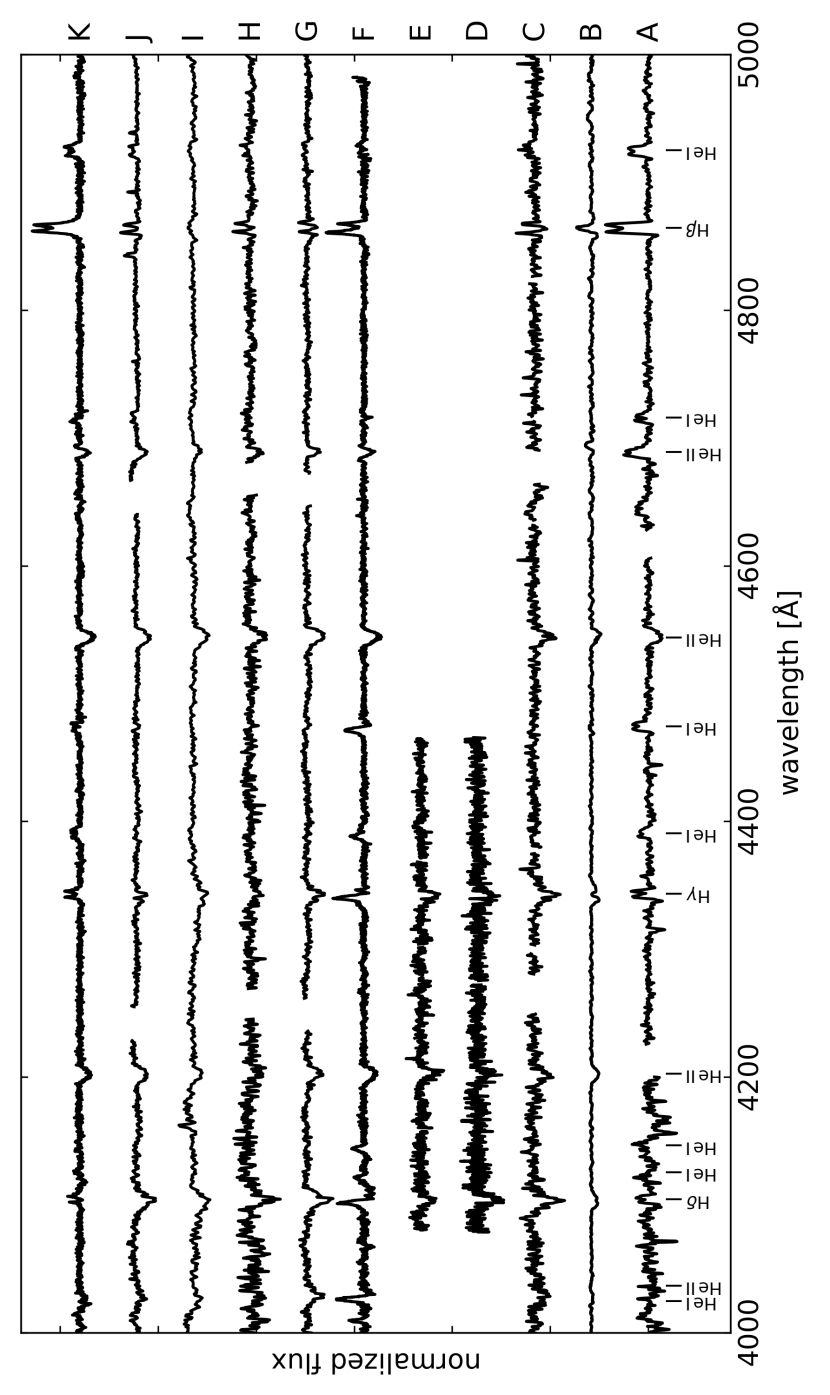
Spectroscopic observations of AzV 493 were obtained in the course of the RIOTS4 spectroscopic survey of field OB stars in the SMC (Lamb et al., 2016), and follow-up radial velocity monitoring of the SMC Wing region (Vargas-Salazar et al. 2023, in preparation). The observations were carried out using the Magellan telescopes at Las Campanas, Chile. Three different spectrographs were used: IMACS (Bigelow & Dressler, 2003), MIKE (Bernstein et al., 2003) and M2FS (Mateo et al., 2012). Table 1 gives details of our spectroscopic observations, including the modified Julian day (MJD), signal-to-noise, spectral resolution, spectral range, phase in the light curve cycle, radial velocity, H peak separation (Section 3.2), and instrument used. Figure 5 displays the 11 spectra in chronological sequence, labeled A – K as shown.
IMACS was operated by default in multi-slit mode with the f/4 camera and 1200 lines/mm grating, which provides a resolving power of and a wavelength coverage spanning 3800 – 5200 Å. One observation (Epoch I) was observed with the f/2 camera, resulting in lower resolution (Table 1). The reduction was performed using the cosmos pipeline111http://code.obs.carnegiescience.edu/cosmos.. MIKE data were obtained using a 1 slit width for a spectral resolution of , covering the wavelength range 3600 – 10000 Å. The spectra were processed with the the Carnegie Python (CarPy222http://code.obs.carnegiescience.edu/mike) pipeline software (Kelson et al., 2000; Kelson, 2003), except for Epoch B, which was extracted using IRAF333IRAF was distributed by the National Optical Astronomy Observatory, which was managed by the Association of Universities for Research in Astronomy (AURA) under a cooperative agreement with the National Science Foundation.. M2FS data were observed using a custom filter yielding 4080 – 4470 Å wavelength coverage at . The data were processed following the standard steps in fiber spectroscopic reduction using IRAF/PyRAF tasks implemented within python and designed for this instrument (see Walker et al. 2015).
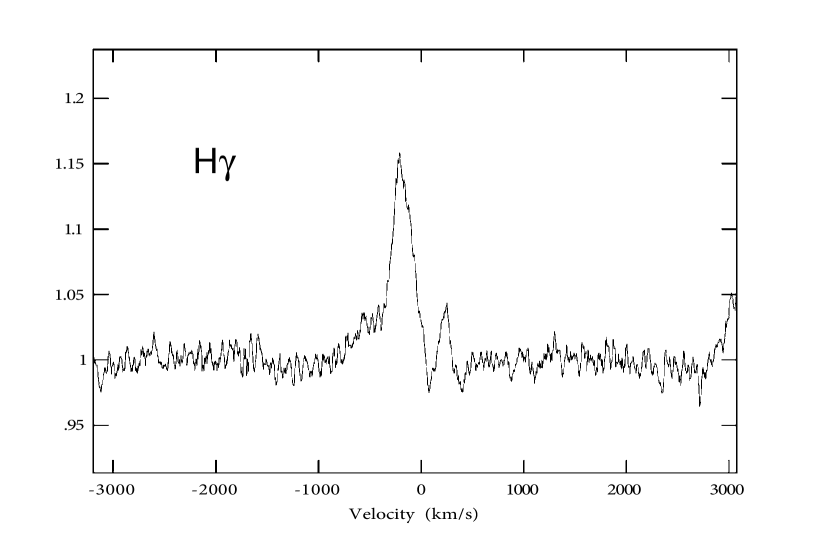
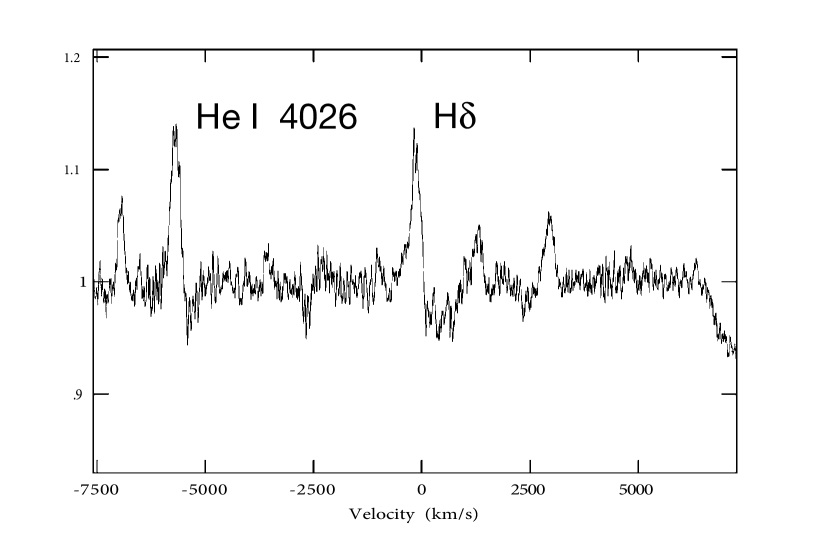
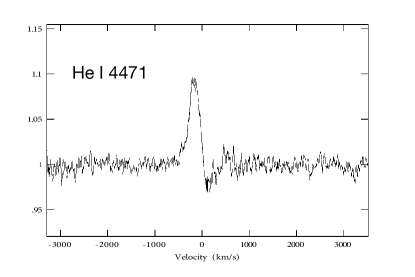
Figure 5 shows strong variability in the spectrum of AzV 493. The weaker epochs show a typical OBe spectrum, with only H showing double-peaked emission, and H and H absorption features showing evidence of infill; whereas Epochs A, B, and K show stronger emission-line spectra, with H and He i often in emission. Epoch F shows strong, high-order Balmer emission and inverse P-Cygni features. These epochs will be discussed in Sections 3.3 – 3.4.
3.1 Stellar fundamental parameters
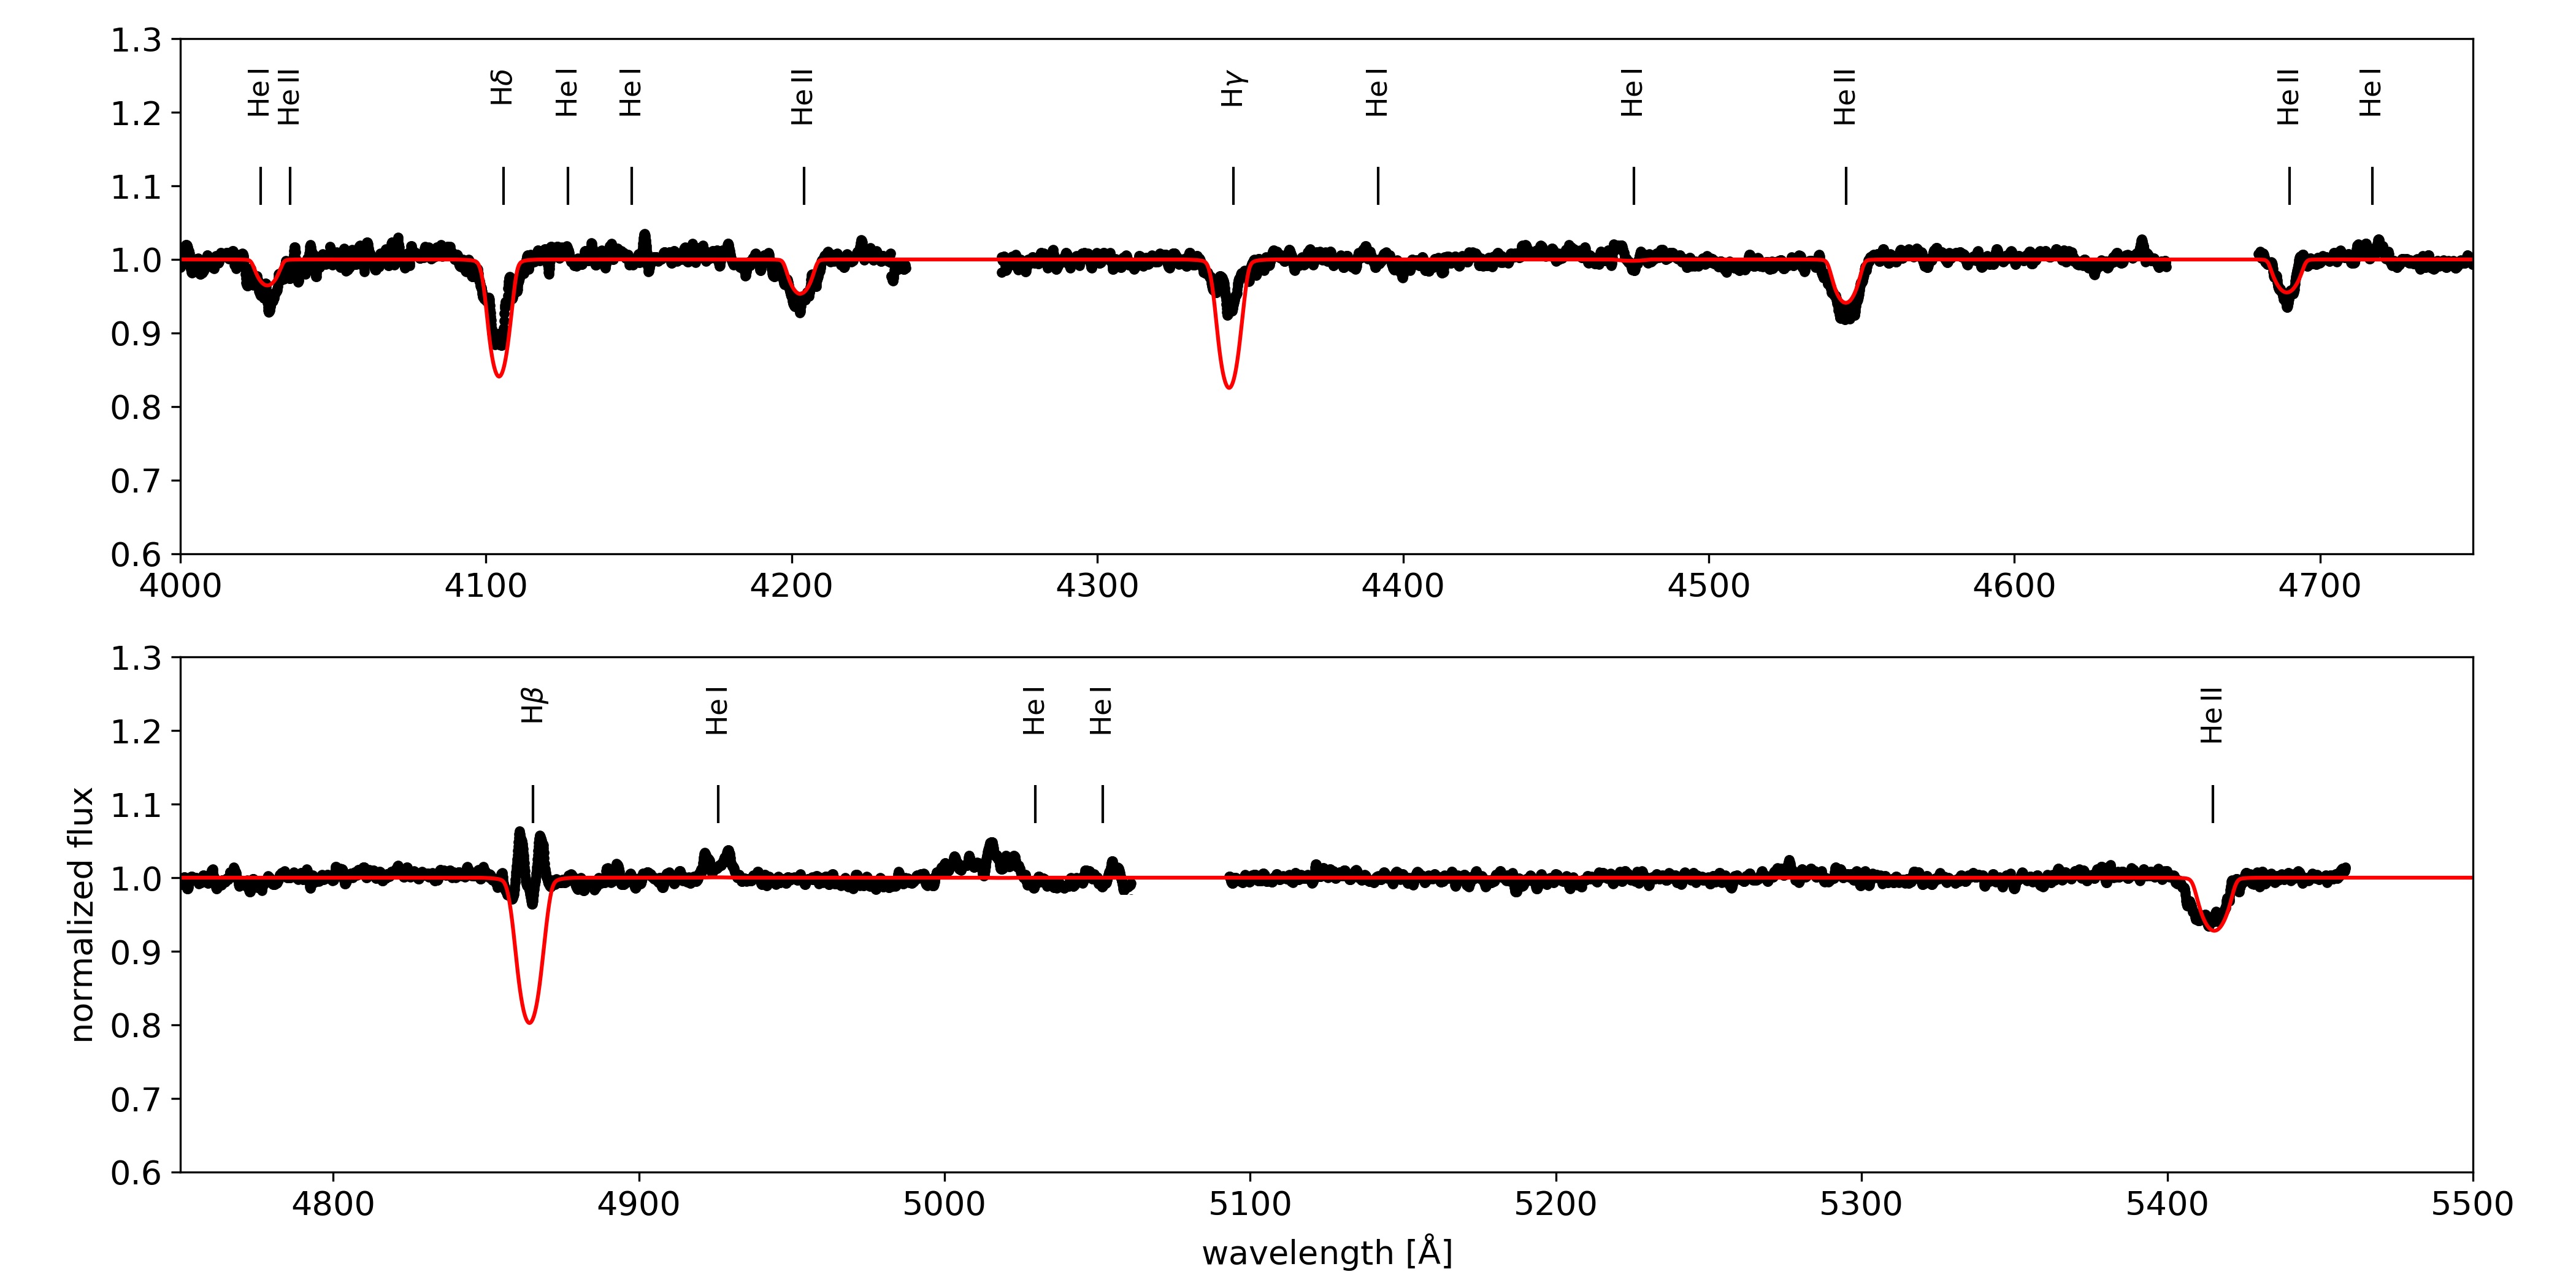
The photospheric He ii lines 4200, 4541, and 5411 lines at all epochs confirm the early O spectral type assigned by Golden-Marx et al. (2016). To improve S/N in the He ii absorption line, we combine epochs C, G, H and J, which are all IMACS spectra obtained in 2016 – 2017. We use this composite spectrum to estimate the projected rotational velocity () using the iacob-broad code (Simón-Díaz & Herrero, 2014, 2007). We obtain km s-1. As discussed in Section 4, the angle of inclination is likely high, based on the amount of obscuration from the disk, and so the rotational velocity might be .
The combined spectrum was modelled using the stellar atmosphere code fastwind (Santolaya-Rey et al., 1997; Puls et al., 2005; Rivero González et al., 2012), using the same technique and stellar grid described in Castro et al. (2018). The cores of the Balmer lines are omitted from the fit to ameliorate contamination from disk emission. Our best model yields effective temperature K and surface gravity dex, which reproduce the main He i and He ii lines (Figure 6). Since He i photospheric features are not detected, this may be a lower limit. The derived temperature is consistent with an O3-5 spectral type (Martins & Palacios, 2021), matching the early O-type classification of AzV 493 (Lamb et al., 2016). However, we caution that the wings of the Balmer lines, which are the main spectroscopic anchors for deriving the surface gravity, may be affected by the circumstellar emission, resulting in an underestimate of , as found for OBe stars by Castro et al. (2018).
The stellar luminosity was calculated using the optical and IR photometry for AzV 493 (Massey, 2002; Skrutskie et al., 2006), adopting a distance to the SMC of 62.1 kpc (Graczyk et al., 2014) and the synthetic fastwind spectral energy distribution (SED) derived above. We explored the extinction curves published by Fitzpatrick & Massa (2007) until the observed photometry was reproduced by the fastwind synthetic SED. We obtain a luminosity and radius , in agreement with the expected values for an early O-type star of luminosity class III – V (e.g. Martins et al., 2005). We compare the position of AzV 493 in the Hertzsprung–Russell diagram with the rotating evolutionary tracks by Brott et al. (2011) for SMC metallicity. Based on the and and their respective uncertainties, we estimate that the stellar mass is . If the observed luminosity is overestimated by the inferred , or includes a contribution from a non-compact binary companion and/or the disk continuum, then the stellar mass may be somewhat overestimated; for reference, a factor of two overestimate in luminosity implies .
3.2 H emission-line profile
Variability in the emission lines is a common characteristic of the Be phenomenon (e.g., Rivinius et al., 2013; Richardson et al., 2021). One effect is the violet-to-red (V/R) variations, which are cycles that can last weeks or decades. The V/R variations describe changes in the dominant peak strength for double-peaked emission lines observed in some stars. These cycles are attributed to variation in the morphology and density of the circumstellar disks (Poeckert, 1982; Okazaki, 1991).
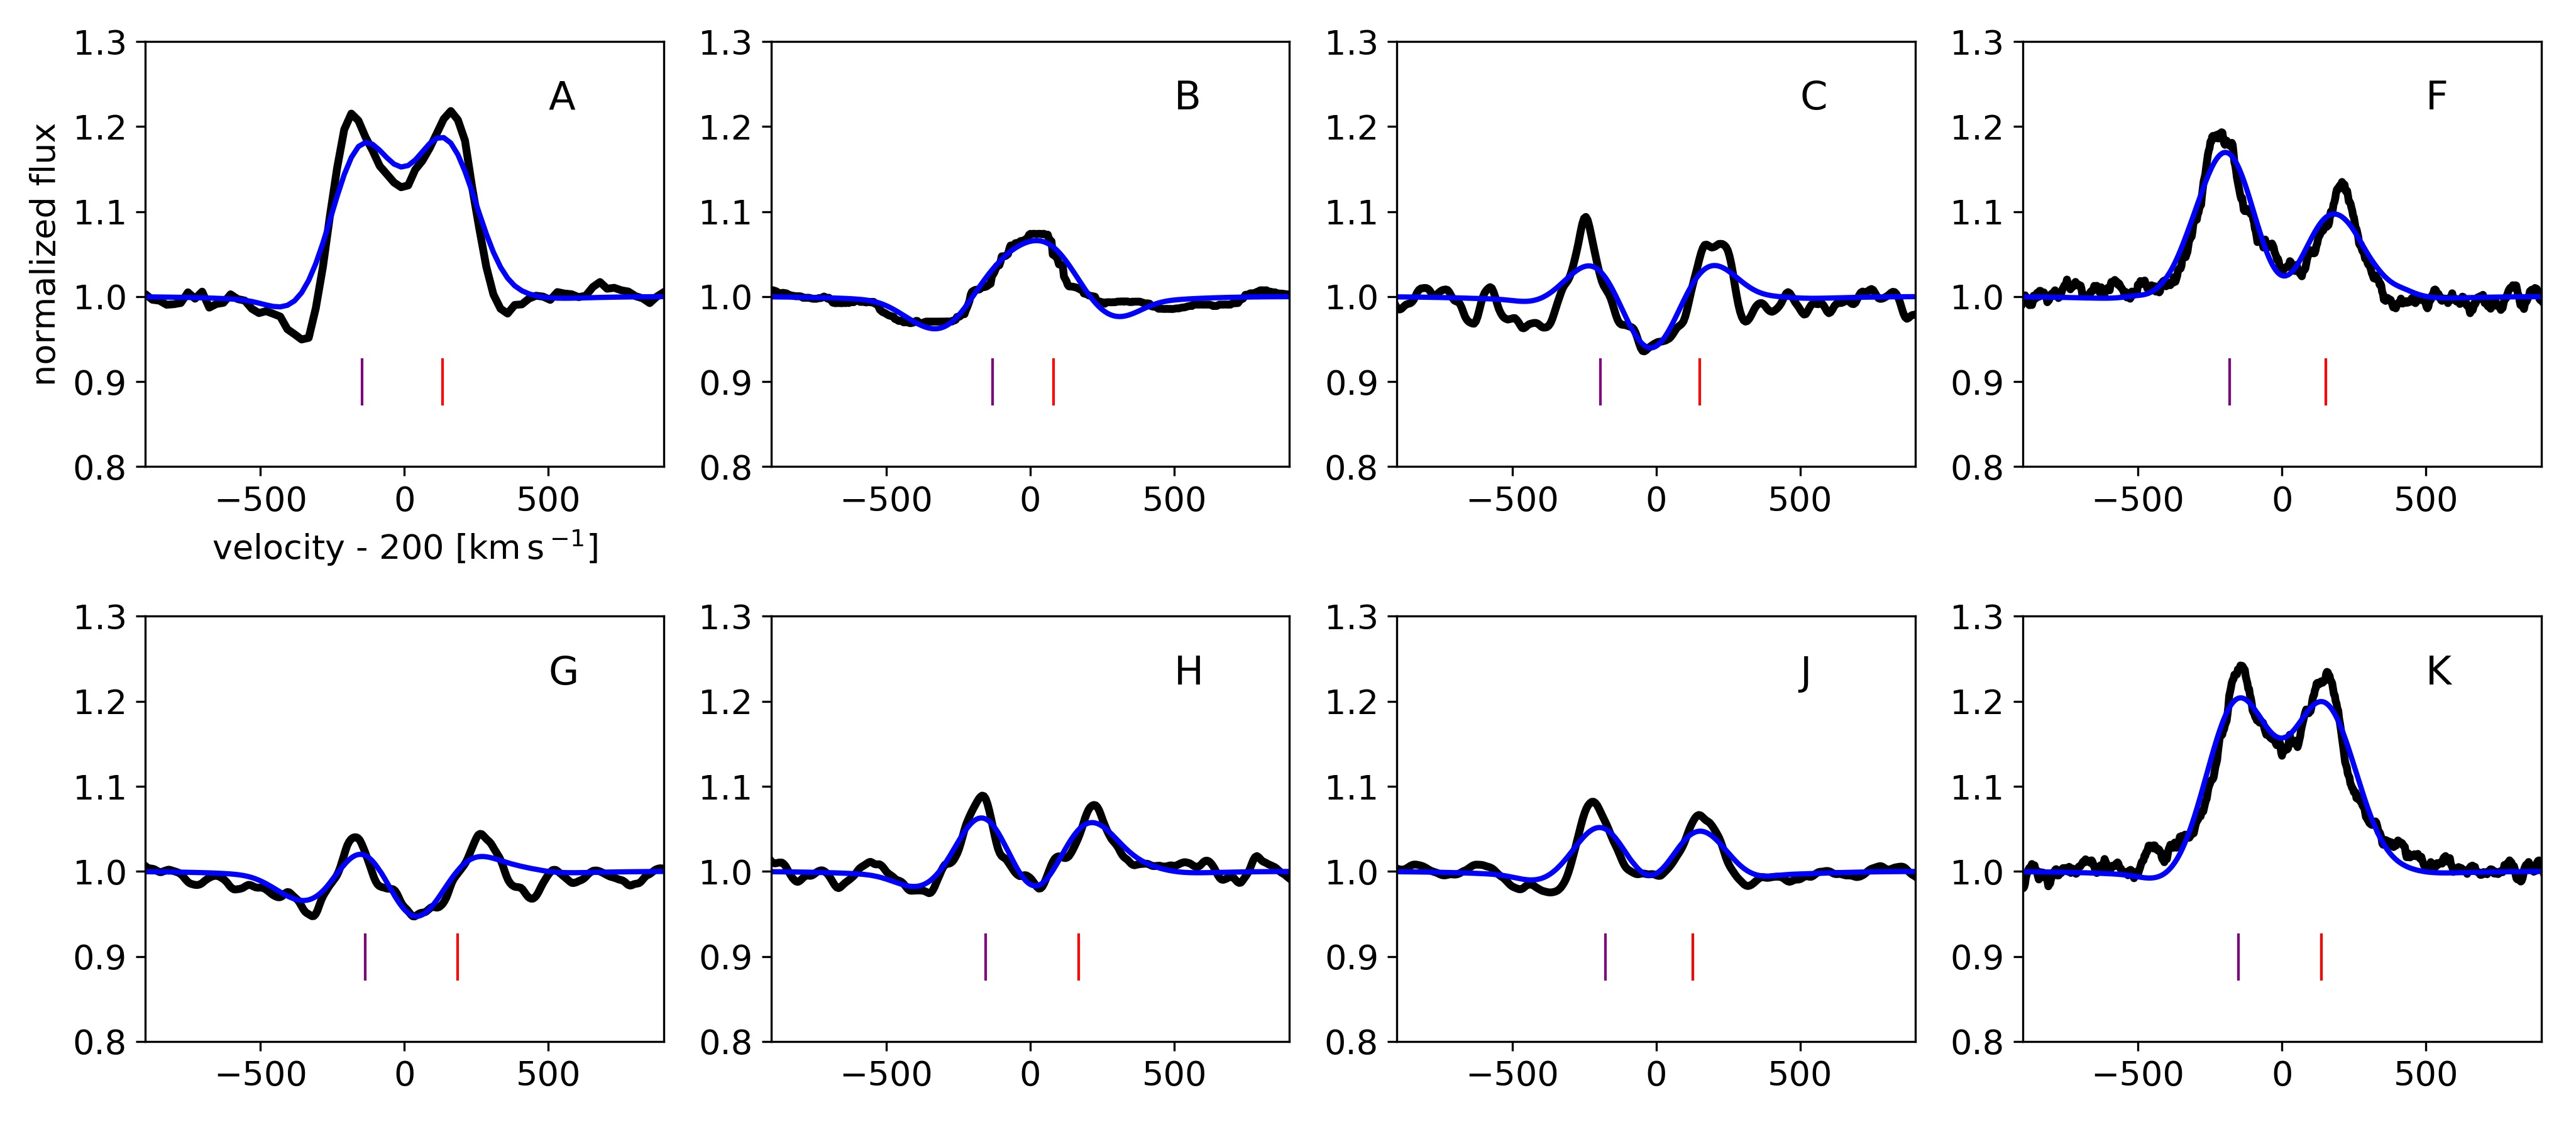
Figure 7 shows H profiles in the spectroscopic epochs where this line is available, and Gaussian models used to disentangle the V and R components. The two peaks are clearly resolved in all our observations of H, except for Epoch B, which instead shows a P-Cygni profile (Figures 5, 7; see Section 3.4). Table 1 gives the peak separations fitted in Figure 7. The V peak is usually more prominent than R. There may be a long-timescale V/R cycle, but further spectroscopic monitoring is needed to determine whether V/R indeed oscillates, or whether there is any trend in with phase.
3.3 Epochs A and K: Evidence of disk evolution
Epoch A is observed at a phase of 0.54 (0.08), soon after the apparent eruption event in 2009 (Figure 1, Table 1). This spectrum shows the strongest helium line emission (Figure 5), although we have no other spectroscopic observations within several years of this data point. Only photospheric He ii is seen in absorption in this spectrum; the H i and He i lines are all in emission or filled in. Moreover, He ii 4686 is also in emission, which prompted Golden-Marx et al. (2016), to identify this spectrum as the hottest-known observation of the OBe phenomenon. Nebular He ii is only generated by the very hottest O stars (e.g., Martins & Palacios, 2021).
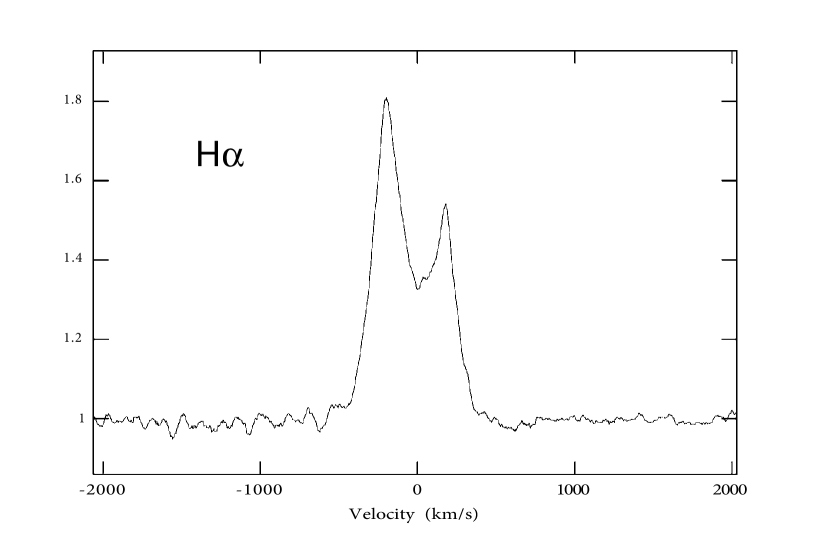
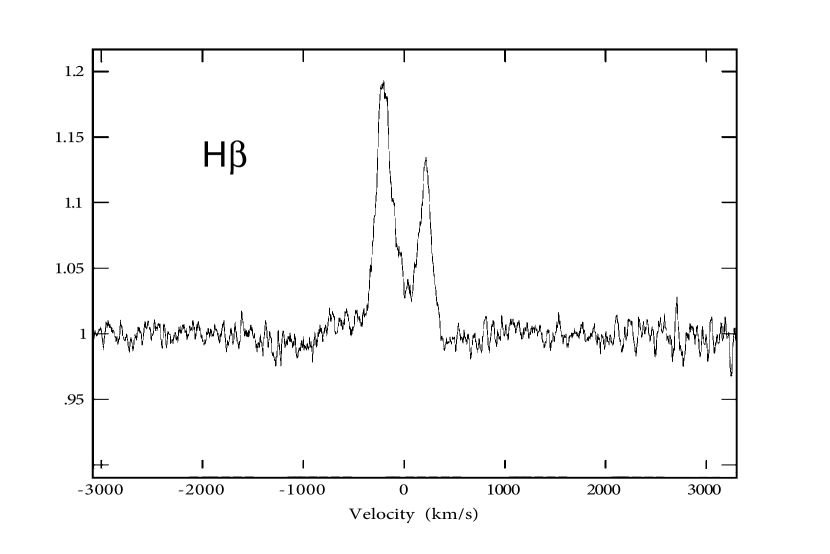
All of the emission lines in Epoch A are double peaked. H and H show larger peak separations than the He i and He ii emission lines. For a Keplerian disk, this would imply that the higher-temperature species is dominated by larger radii than the H and H emission. Figure 5 shows that the emission is slightly redshifted relative to the photospheric Balmer absorption.
Epoch K, observed at phase 0.37 (0.74) (Figure 5; Table 1) shows the opposite relation between ionization and disk radius. Here, the He i lines have larger peak separations than H, implying that the hotter species dominates at smaller radii, unlike Epoch A. We also see that the H and H line profiles show high-velocity wings that are not observed at other epochs, consistent with high-velocity gas at smaller orbital radii. Epoch K is similar in emission-line strength to Epoch A and shows He i in emission, but He ii 4686 is in absorption in this observation, as it is in all the other observations of this line.
3.4 Epochs B and F: Gas Outflow and Infall
Epoch B shows P-Cygni emission-line profiles in H and H (Figures 5, 7), suggesting an outflow episode. This is also the only spectrum obtained during the period where the strong pulsations dominate the flux (Figure 1), and it is observed at the latest phase, 0.91 (0.82). Figure 13 shows that the observation coincides with a local minimum in the light curve. Thus the P-Cygni features could suggest that the pulsations may be directly linked to mass ejection, since it coincides with the star reaching its smallest radius.
The spectrum of Epoch F is dramatically different from most of the other spectra (Figure 5). It shows strong, asymmetric Balmer and He i emission that show remarkable, inverse P-Cygni line profiles, with red-shifted absorption and blue-shifted emission. Figure 8 shows the line profiles relative to the systemic velocity of the He ii photospheric lines. Such observations are usually interpreted as infall of matter (e.g., Hartmann et al., 2016), which appears to imply a re-absorption of decretion disk material. The free-fall velocity at the stellar surface for our adopted stellar parameters (Section 3.1) is , which is consistent with the red edge of the absorption trough seen in H and He i . The Balmer emission-line intensities do not follow the Balmer decrement and are almost uniform (Figures 6 and 8), indicating optically thick emission. This suggests that the infalling material is also likely dense, and thus has high emissivity.
Although Epochs D and E are taken only 14 and 11 days before Epoch F, respectively, Epochs D and E show most lines in absorption with no sign of these features. Similarly, Epoch G is obtained only 73 days after Epoch F, and also shows primarily an absorption spectrum. Thus, this infall episode corresponds to a short-lived event, which we fortuitously captured with this MIKE observation. In the spectra observed before and after Epoch F, the Balmer emission, which presumably originates from the disk, does not seem substantially different in intensity. This suggests that the reabsorbed material corresponds to a negligible fraction of the disk mass. The timing of Epoch F is at a very early phase, 0.024 (0.05), only 27 days after the light curve minimum on MJD 57626. There is no significant feature in the photometry near the time of Epoch F, and the light curve is gradually brightening during this phase. This similarly implies that the continuum luminosity is dominated by the star and/or disk sources unrelated to the P-Cygni event.
4 Disk Ejection Scenario
The distinctive shape of the light curve seen in 2002 – 2004, and again in 2016 – 2018, showing a strong drop in brightness followed by gradual increase (Figure 1), is seen in some other emission-line stars (Rivinius et al., 2013). We suggest that this may be due to the repeated ejection of an optically thick circumstellar decretion disk, perhaps related to interaction with a binary companion. The exact reproduction of this part of the light curve across two cycles, starting with a 1.2-magnitude drop in brightness, suggests a geometric extinction effect caused by an optically thick disk. This event’s pattern in photometry and H line profile is consistent with a disk ejection outburst, similar to, e.g., HD 38708 (Labadie-Bartz et al., 2017).
Assuming that an optically thick disk is indeed expelled to generate the deep light-curve mimima () in 2002 and 2016, we can estimate the geometric obscuration by considering the maximum flux following these minima, which peaks around . The difference of 0.85 mag corresponds to reduction in flux by a factor of , or over half, assuming that all of this difference is due to obscuration. This suggests not only a fairly high angle of inclination, but also a thick, or in particular, a geometrically flared disk, which is consistent with spectroscopic evidence (Section 3.3).
In this model, most of the emission lines originate from an inner disk region that experiences variable obscuration to our line of sight from a thicker outer disk or torus. The weaker spectroscopic epochs in Figure 5 with the typical OBe spectrum are the most obscured, while Epochs A, B, and K are less obscured and therefore show stronger emission-line spectra. Epoch C is observed in 2016 at a phase of 0.01 (0.01), and thus near the same phase as the light curve peak in late 2001 (2009) (Figure 1; Table 1). However, as noted above (Section 2.1), although the light curve repeats the disk ejection pattern, there is no evidence of a corresponding peak preceding this sequence on the same timescale as that in 2002. The Epoch C H profile (Figure 7) is consistent with the optically thick disk already having formed. Epochs D and E, observed immediately after this minimum, are similarly unremarkable, although they cover a much shorter spectral range. Since we see that a putative disk ejection apparently occurred in 2016, it may be that the system has precessed such that an associated photometric outburst is obscured by the ejection process.
The emission lines in Epoch A are dominated by higher temperature species at larger radii, whereas Epoch K shows the opposite effect (Section 3.3). Epoch A is consistent with very dense, optically thick disks that have extended vertical flaring, as shown in models by, e.g., Sigut et al. (2009), where the emission, including from harder radiation, is dominated by this outer region. In contrast, the disk geometry at Epoch K is dominated by high-density gas near the center and no flaring, thus differing significantly from Epoch A. Epoch A is observed at a phase of 0.54 (0.08), and Epoch K shows the system at a phase of 0.37 (0.74; Table 1, Figure 1). This suggests that the disk changes between having a large, flared outer region at Epoch A that contributes significantly to the emission, and a configuration where flaring is insignificant and emission is dominated by a dense central region at Epoch K, perhaps also reaccreting material onto the star. The existence of two different components dominated by inner and outer regions, respectively, could also be due to disk tearing, resulting in an inner disk and outer, expanding annulus with different inclinations (Suffak et al., 2022; Marr et al., 2022).
The decreasing H peak separations seen from Epoch C (346 km s-1) to Epoch J (303 km s-1) and to Epoch K (289 km s-1; Table 1) suggest that the emission is weighted toward increasing radii over this period, which is consistent with the inner disk dissipating or forming an annular disk with an expanding inner radius. However, this scenario does not explain the strong line emission in Epochs A and K (Figure 5), which have the minimum H peak separations. If the inner radius is indeed expanding, then the emitting region either must become dense, or the disk must precess to lower inclination angles to reveal stronger line emission. The latter could also contribute to a model in which the decreasing peak separation is due to decreasing obscuration of the disk, allowing emission at larger radii to dominate. This is consistent with the system’s increasing brightness over this period (Figure 1). The extinction may result from the outer component, or optically thick torus or flare in the disk which either precesses or dissipates. However, we caution that such a fast precession rate may not be feasible. Moreover, if the long-term photometric cycle is due to precession, the light curve should be symmetric around the minima, whereas the observed strong, sudden drops (Figure 1) are difficult to explain with such a model.
The outflow and inflow episodes described in Section 3.4 apparently are not significant in mass relative to the entire disk. If the minima of the 14-year light curve indeed correspond to the bulk of disk ejection, followed by gradual disk dissipation, then the mass ejection associated with the P-Cygni features in Epoch B are not likely to be a dominant source of disk material. However, we note that pulsations have been suggested to be important in replenishing the disk in other OBe systems (e.g., Baade et al., 2016, 2018).
The timing of Epoch F is 27 days after the light curve minimum on MJD 57626. Although there are 3 other intermediate spectroscopic epochs between the putative disk ejection and Epoch F, this still takes place during what we assume is the heavily obscured phase in the light curve. The lack of any photometric event near the appearance of inverse P-Cygni features in epoch F suggests that the reabsorbed material is an insignificant portion of the disk material. The disk is therefore substantial and can plausibly provide material that may fall back to the star. This is consistent with the optically thick conditions indicated by the Balmer decrement in Epoch F.
Thus, this model is driven by repeated ejection of a flared, optically thick disk whose outer region gradually dissipates, revealing the inner, line-emitting region. A flared disk is most clearly implied by the ionization and emission-line peak separation in Epoch A (Section 3.3), and is also consistent with a maximum geometric obscuration that may be % implied by this model. The spectroscopic variation could also be caused by disk tearing or precession of the system. The decreasing trend in H peak separations with increasing flux suggests that more light from larger radii can be seen (Section 3.2). Additionally, the high-amplitude, semi-regular pulsations with the month-long period become visible at low extinction (Figure 1). Other photometric and spectral variations may be due to contributions from the inner disk’s radial expansion, reabsorption, or evaporation/ionization, and possible geometric distortion or warping of the disk system.
5 Disk Growth Scenario
However, some observations seem inconsistent with a disk ejection model. For example, the system is bluest when faintest (Figure 1), contrary to expectations for reddening. As noted above, the strong emission-line spectra at Epochs A and K seem inconsistent with a dissipating inner disk scenario implied by the trend in . If the long-period cycle is attributed to disk precession, it would require an additional mechanism to explain the assymmetric light curve, and also a third, external massive star that is not seen, to torque the disk. Thus, alternative models for the AzV 493 system should also be considered.
Some other Be stars such as Sco (Suffak et al., 2020) and CMa (Ghoreyshi et al., 2018) show long-term photometric variability in which the increasing flux is due to contributions from a growing disk, while the minima represent episodes of disk destruction by the secondary at periastron. Such a model is therefore opposite to the one presented above. In this alternative scenario, the light curve minima of AzV 493 in 2002 and 2016 (Figure 1) correspond to episodes with the lowest disk contribution. The disk then grows and brightens, recovering its full size around 2005. In this case, the decreasing trend in H peak separation with increasing flux is simply due to the disk growth itself. This scenario is consistent with the blue color at the light curve minimum in 2016 (Figure 1), and the weak emission-line spectra near the 2016 minimum (epochs C – J; Figure 5).
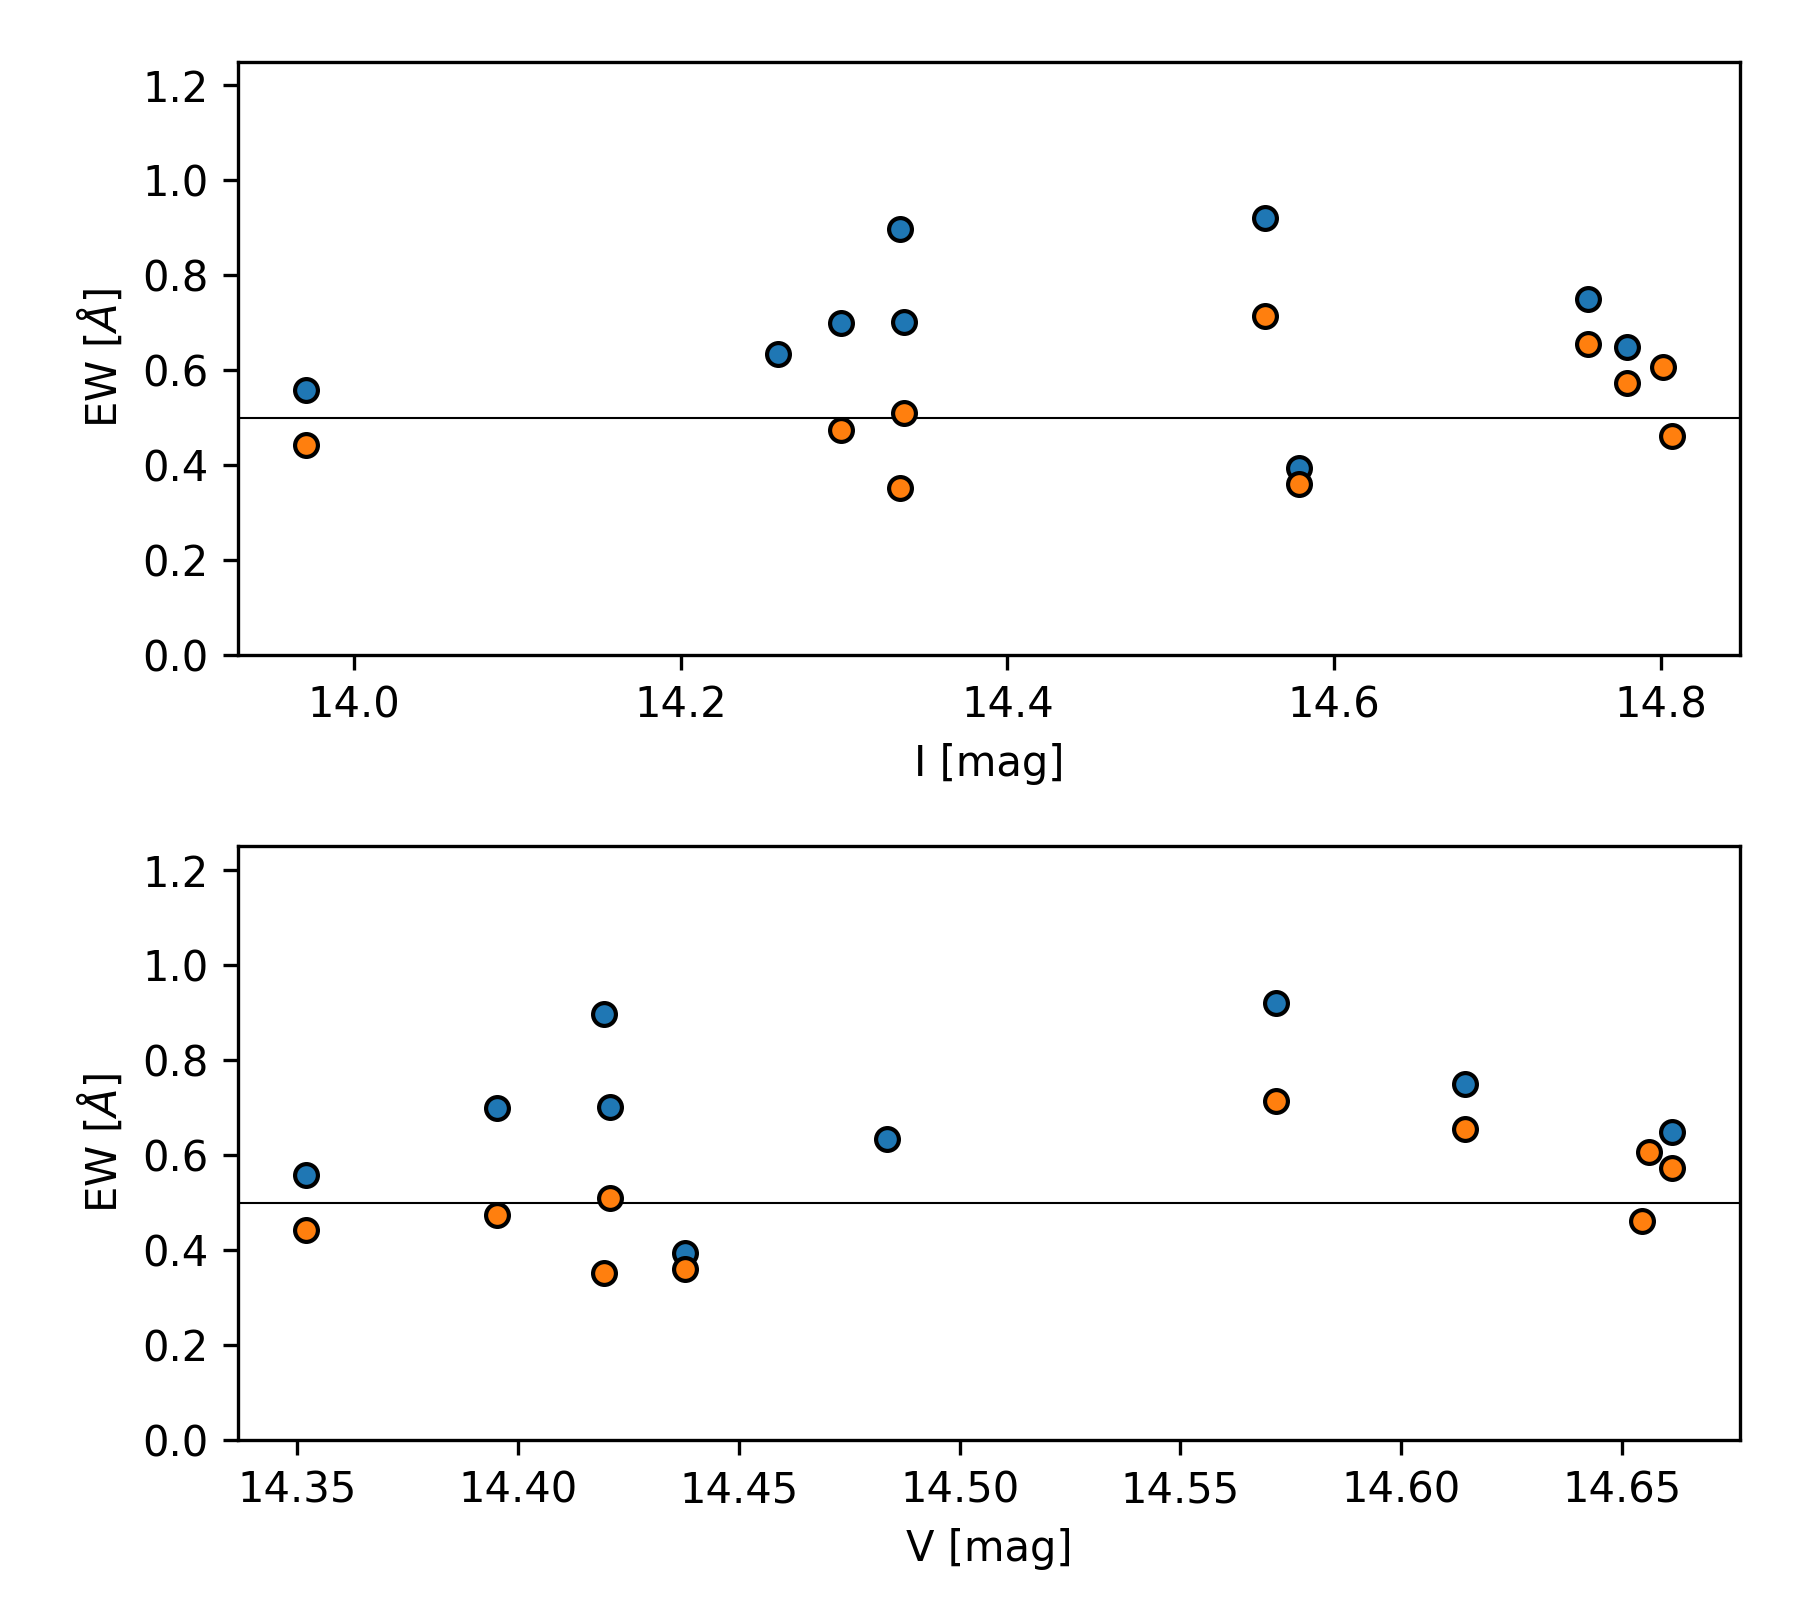
If the disk is responsible for the factor of 2.2 increase in flux, then the equivalent width (EW) of stellar absorption features should decrease proportionately. Figure 9 shows the EW of He ii and as a function of and magnitude. A slight trend is indeed apparent, although not as large as a factor of two in amplitude. These lines are in the -band, and thus not in the range of our photometry. Figure 1 shows that the amplitude of the photometric variations may be smaller at bluer wavelengths, although with the given -band sampling it is not entirely clear. It may be challenging for the alternative model to produce and maintain the viscous disk necessary to generate continuum luminosities that compete with those of the star, given the harsh circumstellar environment of an extreme, early-type O-star.
The extinction-dominated model is supported by the lack of correlation between the strength of the emission-line spectrum and photometric flux from the system. There is no significant variation between spectral Epochs C – J (Figure 5), which should correspond to the period of strong disk growth in this model, whereas the obscuration-dominated model implies dissipation (Section 3.3). The one exception showing spectral variation, Epoch F, has P-Cygni emission and stronger emission-line features, yet it is photometrically unremarkable (Section 3.4). Another issue is that the photometric minimum corresponds to the bluest color (Figure 1), which is more consistent with the alternative model. However, the star itself may be changing substantially in magnitude and color. Blueing is also caused by scattering in high-extinction conditions, as seen in the UXOR class of Herbig Ae stars (Natta & Whitney, 2000).
The overall shape of the light curve for AzV 493 is rather different from those of Sco and CMa, which show extended minima with more top-hat-like light curves (Ghoreyshi et al., 2018; Suffak et al., 2020). In contrast, AzV 493 shows sharp minima (Figure 1), implying very rapid disk destruction and immediate, regular regrowth in the alternative model. It seems hard to explain such sudden dissipation of a several-AU dense, viscous disk by a neutron star or black hole (Section 6) during the brief periastron passage. Moreover, the exact reproduction of the photometric cycle’s initial segment (Section 2.1) is unusual and may be harder to explain with a disk-growth model.
Overall, the fundamental nature of the light curve and disk evolution remain unclear. Tailored modeling of this system and further multimode observational monitoring is needed to clarify the relationship between the decretion disk and interaction with a secondary star.
6 An Extreme Interacting Binary
The fast surface rotation for this evolved O star is a natural signature of accretion during a mass transfer event (e.g., Packet, 1981; Cantiello et al., 2007; Renzo & Götberg, 2021), consistent with an interacting binary scenario. If the disk is induced by a periastron passage of an undetected companion, then this may imply a long, 14.6 (7.3)-year period, and hence a large and highly eccentric orbit. For the AzV 493 stellar parameters obtained in Section 3.1, a neutron star companion of mass would require (0.93) and apastron of (27) AU for a typical OBe star periastron distance of 40. These orbital parameters are similar to those of the Be star Sco (e.g., Che et al., 2012). The unseen companion could also be a somewhat more massive main-sequence or stripped star, or a black hole. The eccentricity may be lower, but if a binary companion is responsible for disk ejection, then periastron must be small and the eccentricity high. The nominal periastron value used here would likely be an upper limit, since Sco showed no disk ejection at periastron (Che et al., 2012).
6.1 Neutron star or black hole?
Thus, if a binary companion excites disk ejection or is otherwise responsible for the observed properties of AzV 493, then it is probably an eccentric system, and the most likely explanation for such an orbit is that the companion has already experienced core collapse, receiving a strong kick. Large natal kicks are routinely invoked in core-collapse events that form neutron stars (e.g., Arzoumanian et al., 2002; Podsiadlowski et al., 2004; Verbunt et al., 2017; Janka, 2017). Natal kicks during black hole formation are still highly debated (e.g., Dray et al., 2005; Janka, 2013; Mandel, 2016; Repetto et al., 2017; Atri et al., 2019; Renzo et al., 2019; Callister et al., 2020), but not excluded. Assuming a large kick, Brandt & Podsiadlowski (1995) found a broad correlation between eccentricity and orbital period of binaries surviving the first core-collapse. This is in agreement with the high and long period we find for AzV 493.
The present-day mass of AzV 493 can be used to constrain the nature of a putative compact object. Assuming a flat distribution in initial mass ratio, the average initial binary mass ratio (e.g., Moe & Di Stefano, 2017). Without any accretion during mass transfer, the present-day mass of AzV 493, , would suggest , which at SMC metallicity implies that the compact object should be a black hole (e.g., Sukhbold et al., 2016; Couch et al., 2020; Zapartas et al., 2021). In this case, however, the rapid rotation of AzV 493 would need to be primordial.
Instead, it is more likely that mass transfer has occurred, in which case is likely to be quite different, depending on the mass transfer efficiency. A mass transfer phase during the donor’s main sequence (Case A) is expected to be slower and more conservative, possibly causing significant mass growth of the accretor without extreme chemical pollution. This scenario has been invoked to explain the formation of low-mass compact objects in very young regions (Belczynski et al., 2008), and in particular, the origin of very massive companions (van der Meij et al., 2021), such as we have for AzV 493. In this case, the zero-age-main-sequence (ZAMS) mass of for the adopted , also accounting for the final donor core mass. However, mass transfer is far more likely to occur after the donor main sequence (Case B), due to the star’s expansion (e.g., van den Heuvel, 1969). It then takes place rapidly, on the thermal or He core-burning nuclear timescale (Klencki et al., 2022), and system mass loss is far more likely, implying a higher ZAMS mass for .
Although post-SN outcomes are stochastic, black hole production is expected to dominate for progenitors with initial masses . This nominal threshold ZAMS mass is expected to decrease for lower metallicity (e.g., Zhang et al., 2008; O’Connor & Ott, 2011; Sukhbold et al., 2016), which in principle enhances the likelihood that the compact object should be a black hole. The high eccentricity in AzV 493 strongly suggests that a SN occurred. While this implies that the companion is more likely to be a neutron star, black holes can form from fall-back if the SN is insufficient to unbind the ejecta, which is more likely to happen at low metallicity (e.g., Zhang et al., 2008). There are multiple mechanisms to produce core-collapse black holes, and if mass-loss occurs, a SN and/or kick to the system may result (e.g., Janka, 2013). We note that is a range that has been extensively simulated and where explodability and fallback are uncertain (e.g., O’Connor & Ott, 2011; Sukhbold et al., 2016; Janka, 2013; Zhang et al., 2008). Establishing that a neutron star or black hole resulted from this ZAMS range, with some kind of kick, would provide an important empirical reference for theoretical models of the explosion and the binary interactions preceding it.
Follow-up observations at subsequent periastra could more firmly establish whether AzV 493 has a companion, and whether it is a black hole vs a neutron star. A 74.33 ksec Chandra/HRC observation on 2012 February 12 (MJD 55969) of a field including AzV 493 (ObsID 14054) shows no detection. Given the tiny orbital interval during which the two stars interact, no significant accretion onto the compact object is expected, explaining why the system is not a known high-mass X-ray binary. However, well-timed X-ray observations near periastron may be able to catch a brief flare event.
6.2 Radial Velocities
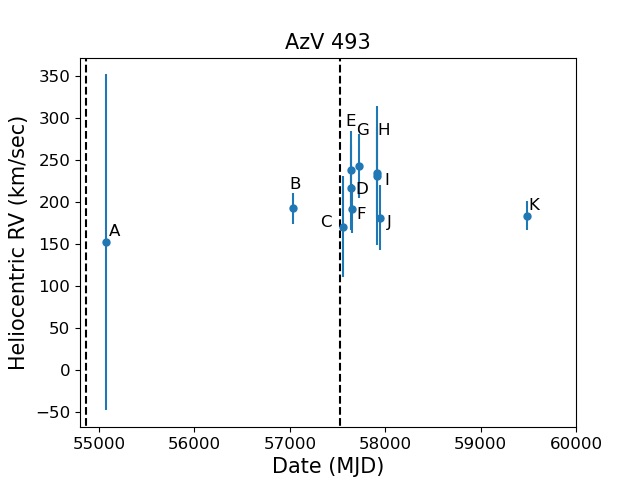
We also measure the radial velocity (RV) for the obtained spectra to search for evidence of a companion. This is challenging, since AzV 493 is a luminous, fast-rotating, early-type O-star, with few photospheric features, several of which are often in emission. We carried out cross-correlations against the FASTWIND model spectra for the entire observed spectral range using the iSpec code (Blanco-Cuaresma et al., 2014), as well as determinations based on cross-correlations against PoWR model spectra (Hainich et al., 2019) for only the He ii lines (, lines, and ), which are the only clean features appearing in all epochs. The latter are carried out with the Markov Chain Monte Carlo code of Becker et al. (2015), and since they yield better results, we adopt these RV measurements (Table 1).
We find that the mean systemic radial velocity is km s-1, weighted inversely by the errors. We caution that the quoted standard error on this value underestimates the uncertainty if there is true variation. Given the difficulty of these measurements, with median error on individual epochs of 46 km s-1, it is difficult to evaluate any variability (Figure 10). There is possible evidence for very short-term RV variations; however, the data are ambiguous.
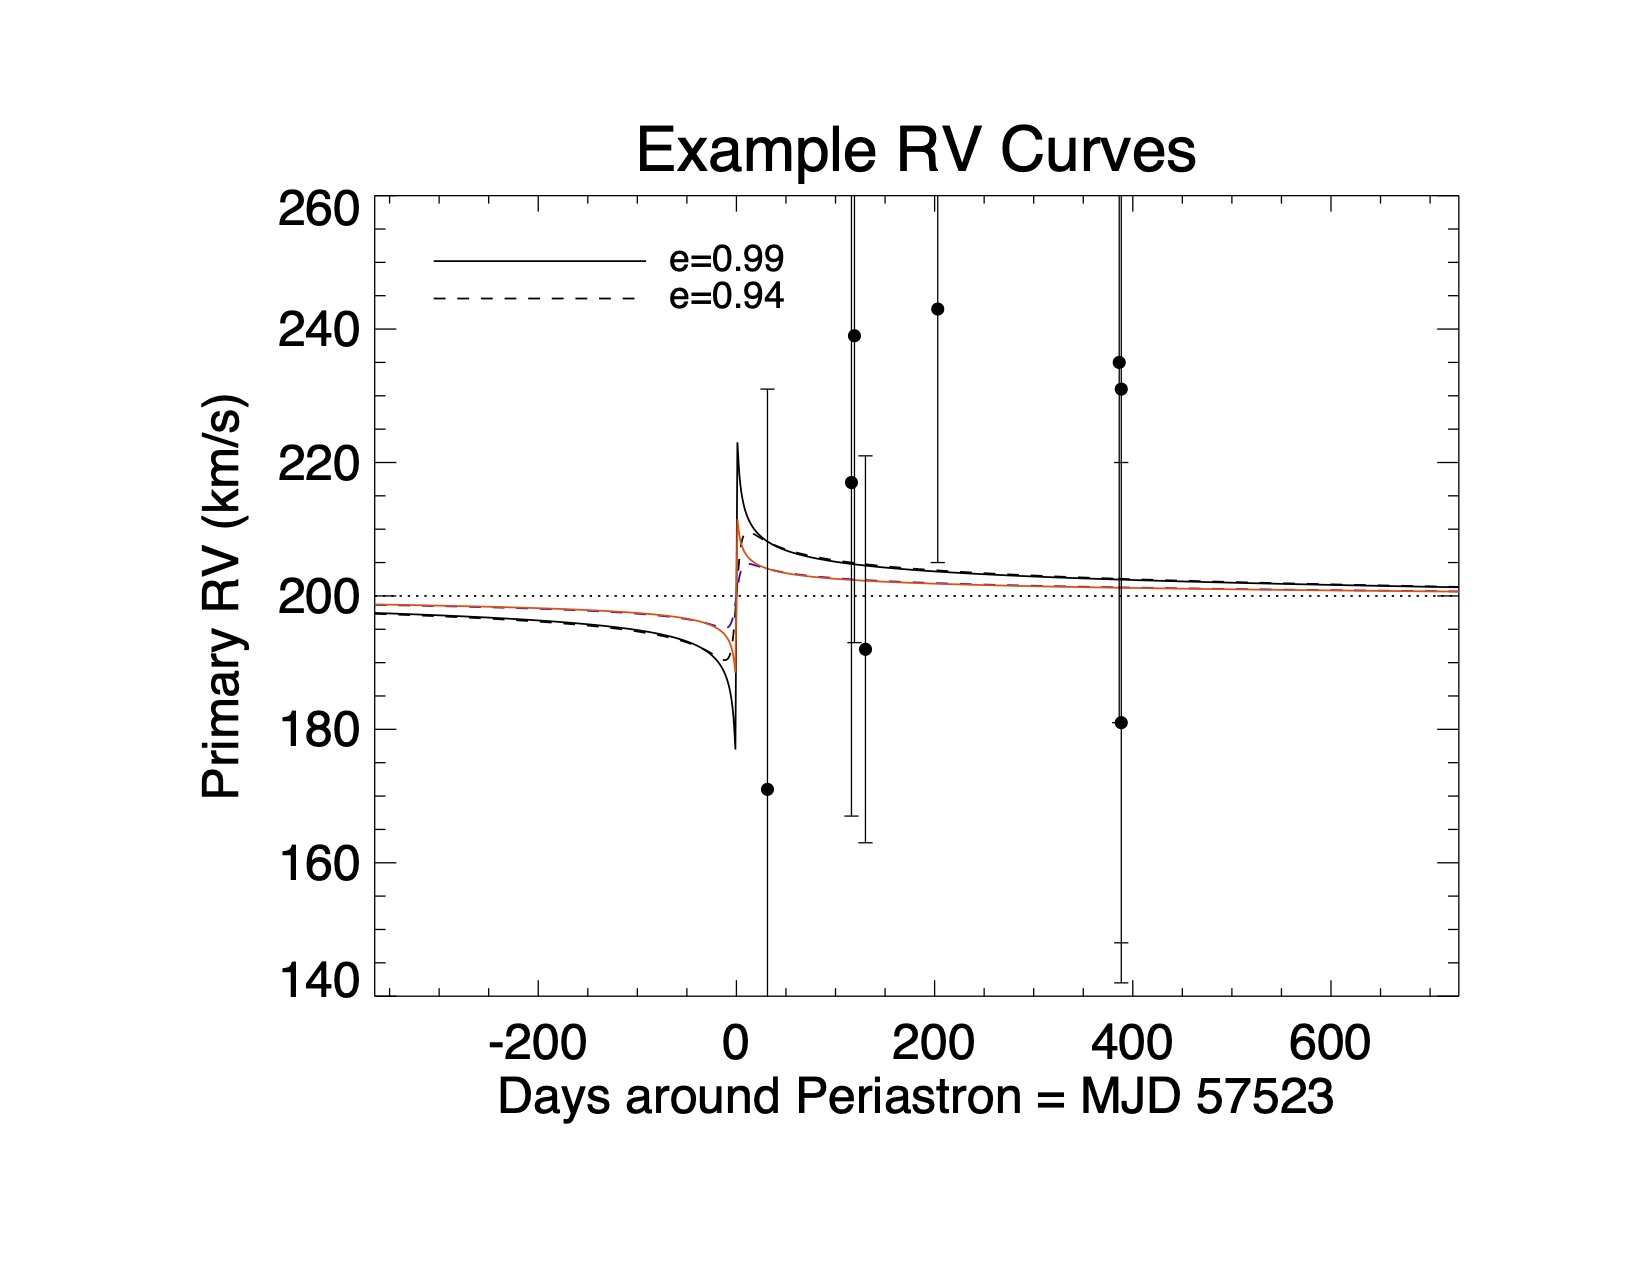
We compute RV models for a possible periastron suggested in Section 2.3 at MJD 57523, which is near the second minimum in the light curve (Figure 1). For this 7.3-year period, and the above, nominal periastron distance of , the eccentricity and apastron AU. For this scenario, Figure 10 demonstrates that the RV signature of a neutron-star companion at periastron is very brief, on the order of 0.01 in orbital phase, and moreover, the observational uncertainties are larger than the expected amplitude. This is the case even for . Thus, our existing RV measurements do not strongly constrain whether MJD 57523 corresponds to a periastron, nor the existence and properties of a companion,
6.3 Proper Motion
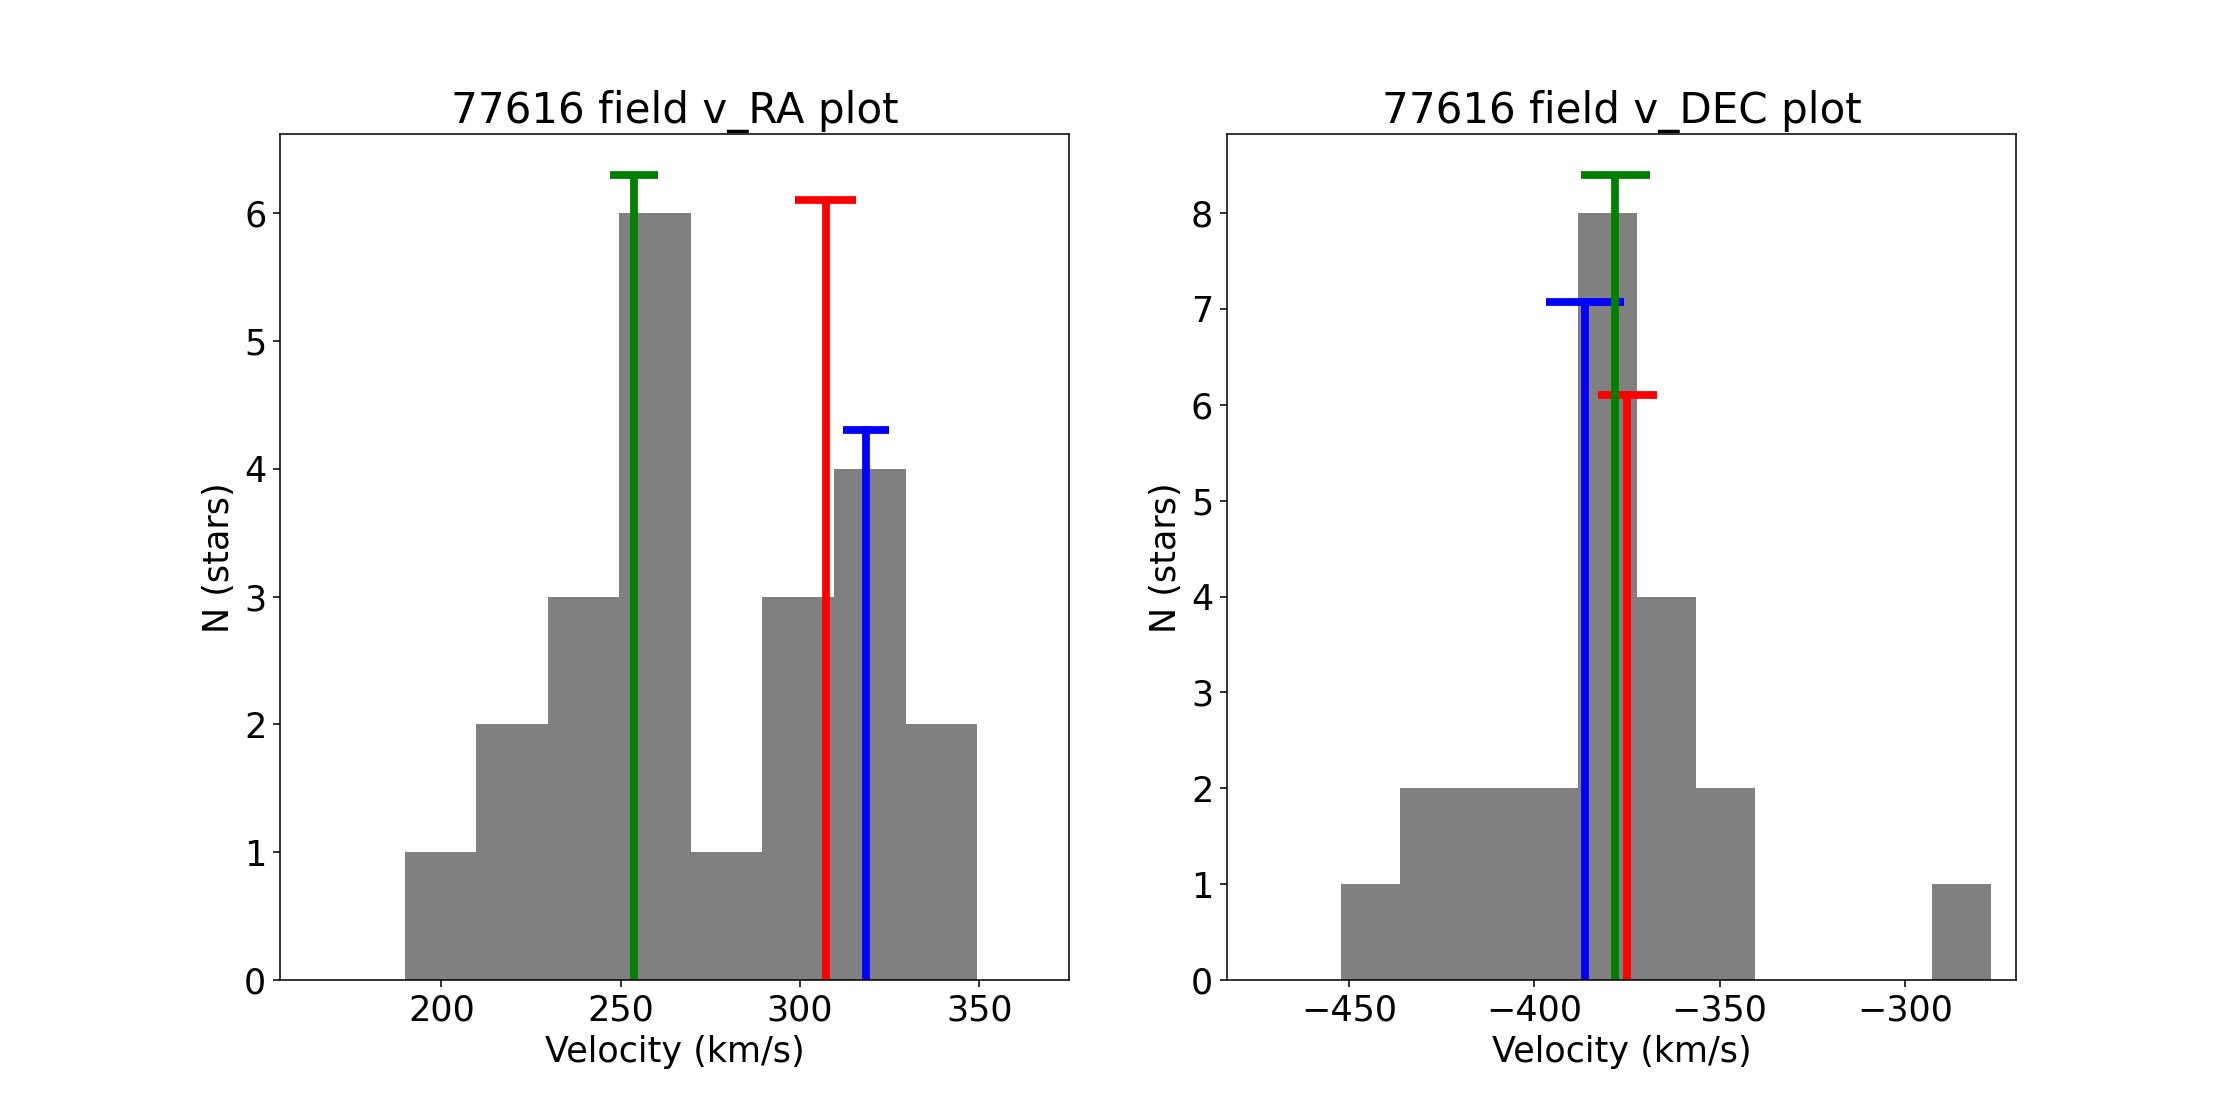
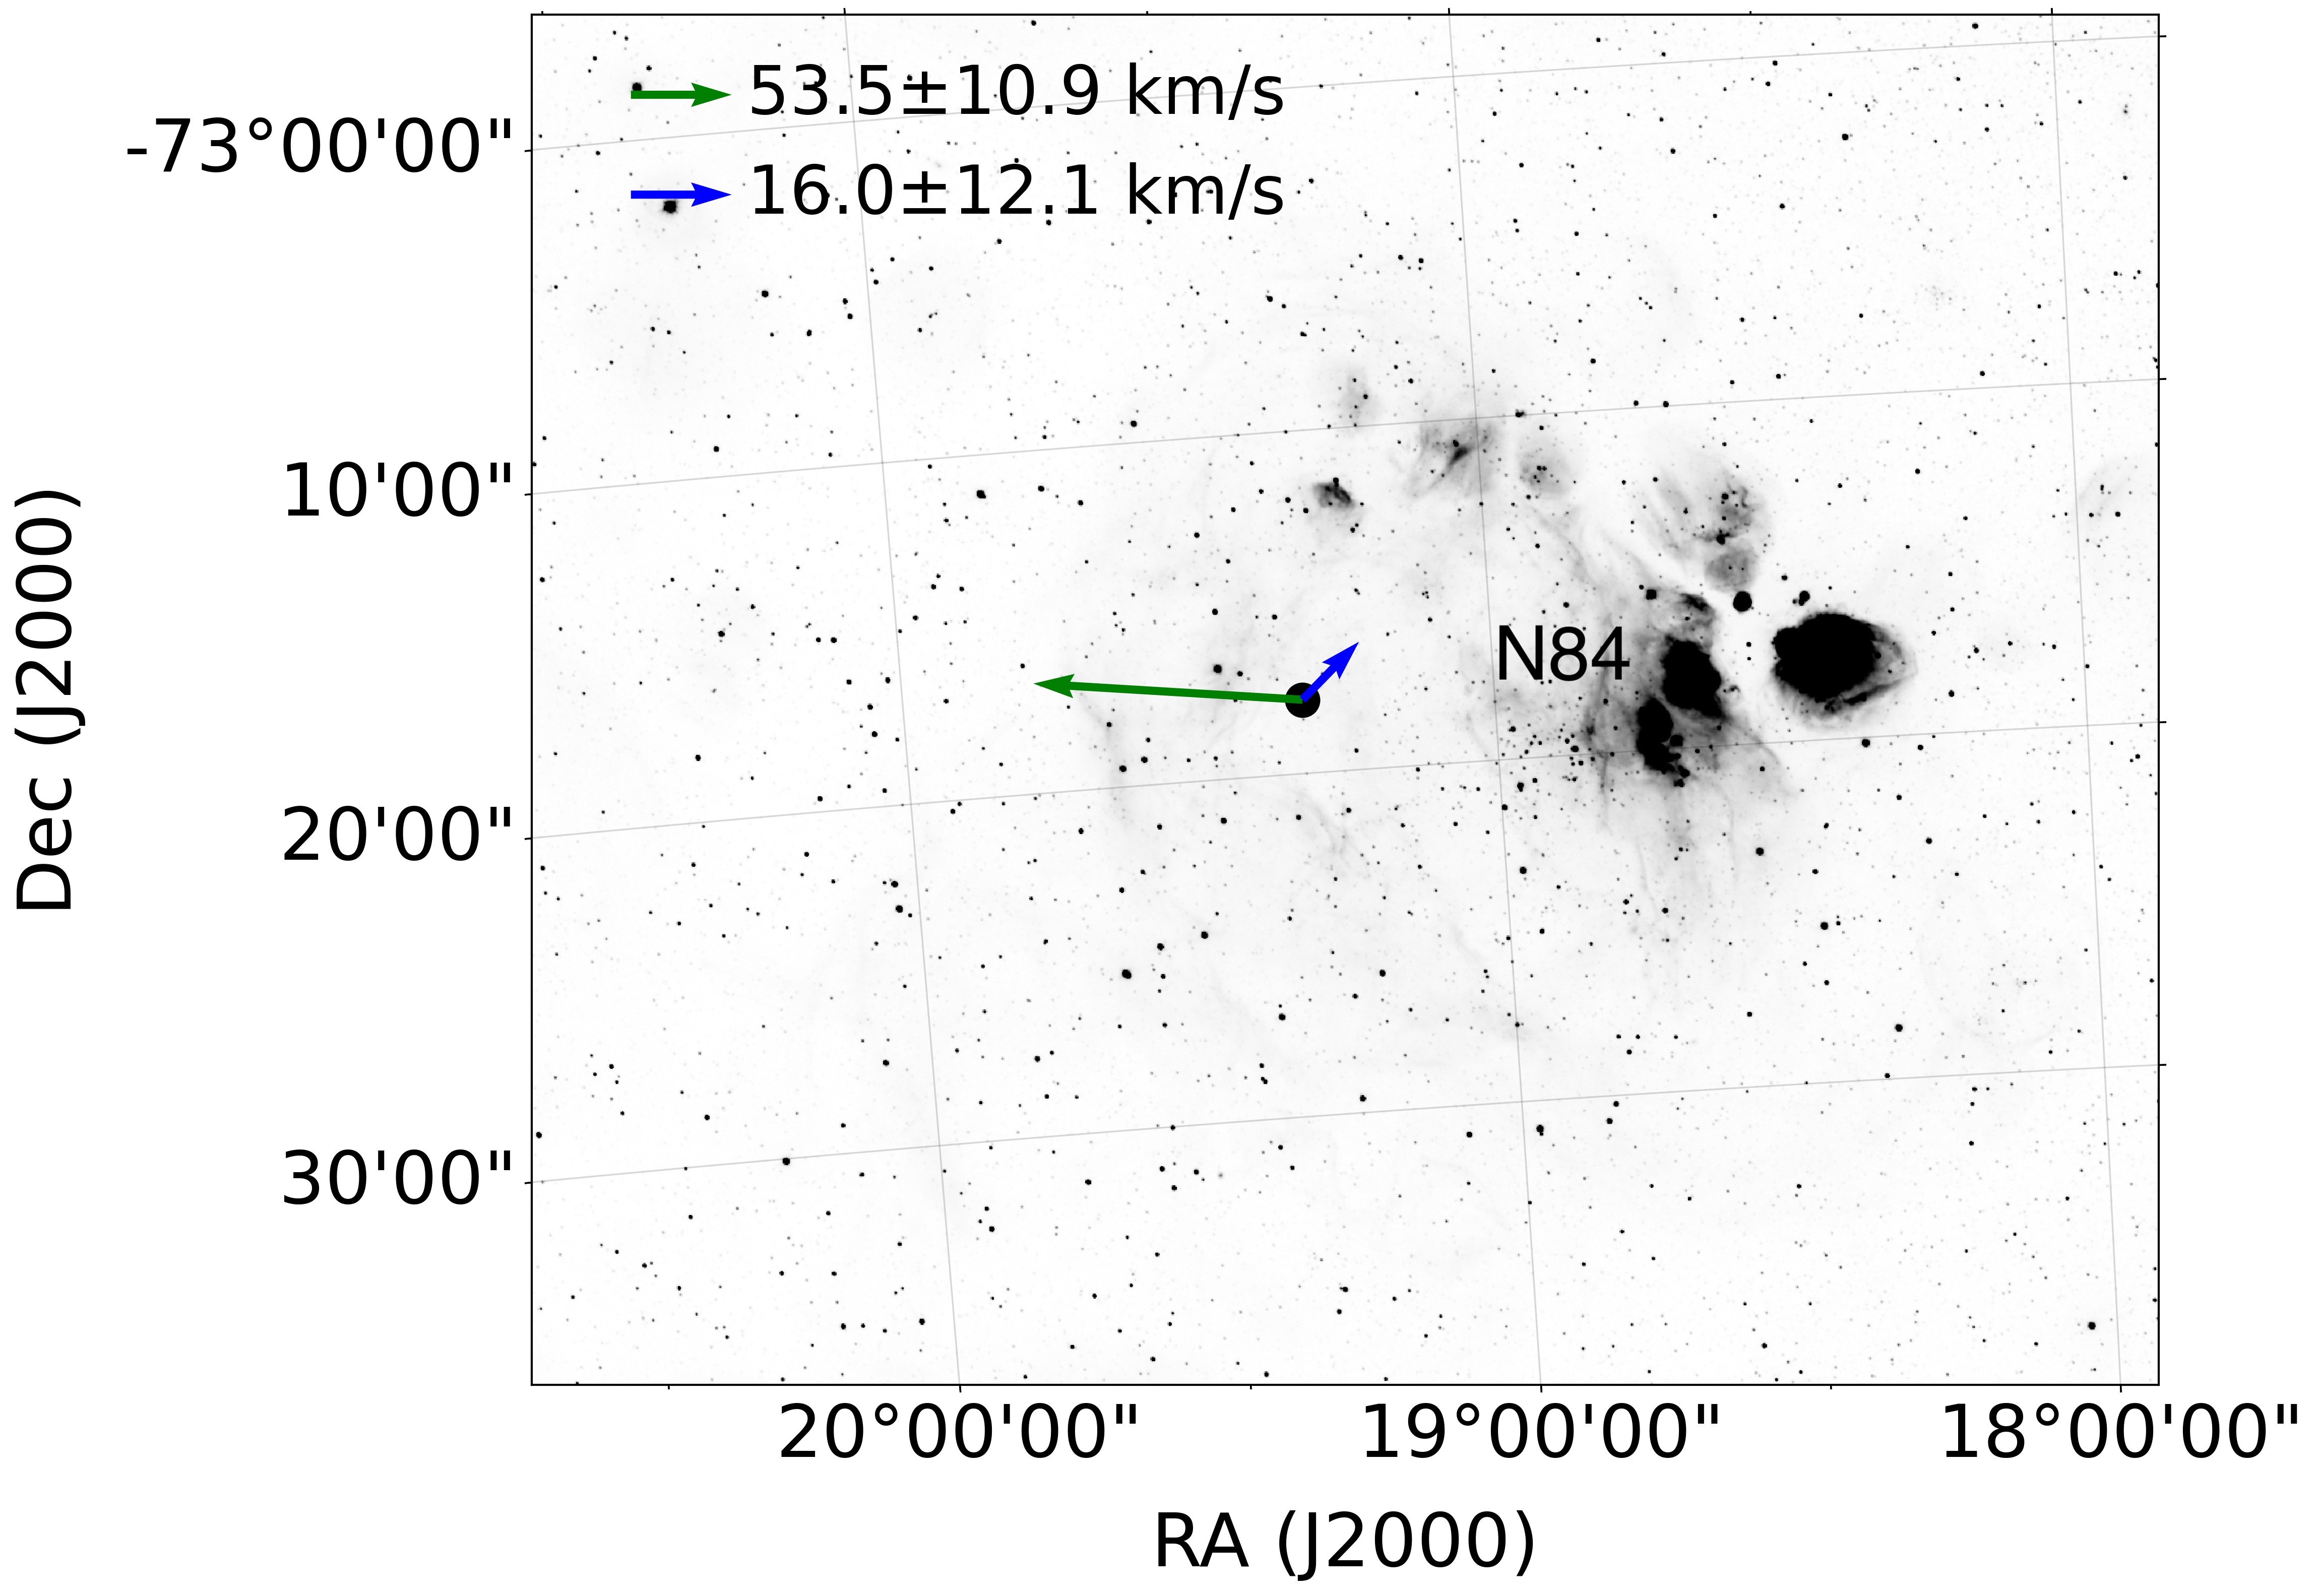
A post-SN bound system can be expected to have been accelerated from its original rest frame. Relative to the blue stars from Massey (2002) within a 5 radius, the Gaia EDR3 (Gaia Collaboration et al., 2021) residual proper motions of AzV 493 show two potential velocity vectors. Figure 11 provides the velocity histograms of these local field stars, showing strong bimodality in the R.A. components. These define two possible local velocity fields implying R.A. and Dec residual velocity for AzV 493 of either ; or . These yield total projected transverse velocities of or .
Figure 12 shows a wide-field view of the surrounding environment, with the two possible proper motion vectors superposed. We see that the nearest massive star-forming region is the N84 complex (Henize, 1956) about or pc to the west. If the velocity measurements are correct, the faster, east-bound velocity is consistent with AzV 493 originating in N84 and traveling for Myr. The lifetime itself of a 50 star with sin is about 5 Myr (Brott et al., 2011), and for a SN ejection, its travel time would only be the post-SN lifetime. However, since the star presumably acquired its total mass and spin later in life, the system may have been ejected earlier by dynamical processes as a tight, non-compact binary. If so, it would have been reaccelerated by the SN explosion, therefore implying that it may be a two-step ejection (Pflamm-Altenburg & Kroupa, 2010). Supernova accelerations are typically weaker than dynamical ejections (e.g., Renzo et al., 2019), and so the dominant velocity component could still be due to a dynamical ejection from N84. A dynamically active past in a dense stellar environment of N84 may also help to explain the eccentricity (e.g., Simón-Díaz et al., 2015), although it would seem unlikely that the system could maintain its highly eccentric configuration for 5 Myr. On the other hand, we note that the inferred runaway velocity, orbital eccentricity, and period are still consistent with being due solely to SN acceleration (e.g., Brandt & Podsiadlowski, 1995). Thus, in order to explain both the long travel time and high eccentricity, the most plausible scenario may be the two-step ejection.
There is also a small possibility that the slow, alternative proper motion vector (Figure 12) is correct. However, this would mean that the AzV 493 system formed in isolation since there is no corresponding young cluster whence it could have originated (Figure 11). Vargas-Salazar et al. (2020) find that % of OB stars, if any, formed in the field, and this is especially unlikely for AzV 493, given its high mass. We caution that the velocity errors do not include unknown systematic errors, and so these measurements need to be confirmed. Thus, although AzV 493 indeed appears to be a runaway star, this does not provide especially useful information to constrain its binary interaction history.
6.4 Similar systems
A comprehensive study by Marr et al. (2022) shows that the B8 Vpe star Pleione (HD 23862) has a light curve with a similar long-term pattern of slow growth with sudden drops, and similar variations in the Balmer emission-line profiles. It is a triple system with a close companion on a 218-day orbit (Katahira et al., 1996; Nemravová et al., 2010). Marr et al. (2022) suggest that the photometric drops correspond to the decretion disk tearing into two components, where one remains aligned with the star’s equatorial plane and the other is misaligned due to tidal torque from the close companion. Pleione’s long-term photometric cycle is 34 years, similar in magnitude to that of AzV 493. Nemravová et al. (2010) find that the close companion is on an eccentric orbit with .
AzV 493’s initial peak brightness and subsequent drop in 2001 (Figure 1) qualitatively resemble the photometric pattern characteristic of heartbeat stars. These are a rare class of interacting binary systems with high eccentricities such that the periastron passage tidally induces regular photometric outbursts. However, the observed pattern in AzV 493 cannot be induced by this type of tidal interaction; preliminary simulations using new capabilities in the GYRE stellar oscillation code (Sun et al., 2023) suggest that the combined amplitude and width of the periastron pulse cannot be reproduced by eccentric tidal models. Nevertheless, given that AzV 493 seems likely to be a massive eccentric binary system, massive heartbeat stars thus share some similarities with this object if a companion indeed interacts with the primary and/or its disk. Examples include the non-Be binary system Ori (O9 III B1 III/IV), which has orbital period 29 d and eccentricity , as determined by Pablo et al. (2017). They find that the two components have masses of 23.2 and 13.4 , respectively, generating tidally excited oscillations with periods on the order of day. MACHO 80.7443.1718 is another heartbeat system with two stars of type B0 Iae and O9.5 V and masses of 35 and 16 , respectively (Jayasinghe et al., 2021).
The B0.5 Ve star Sco is has a B2 V star companion in an eccentric () orbit with period 10.7 years (e.g., Tango et al., 2009; Tycner et al., 2011). The two components have masses of 13.9 and 6 (Che et al., 2012). This system shows a long-term photometric cycle somewhat similar to that of AzV 493, although much more poorly defined. There is no obvious link between the disk properties and binary interaction (Suffak et al., 2020; Che et al., 2012), but the long-term photometry has a timescale similar to that of the orbital period.
H 1145–619 is a Be X-ray binary whose primary is a B0.2e III star estimated to be 18.5 (Alfonso-Garzón et al., 2017), and the secondary is an X-ray pulsar. As shown by Alfonso-Garzón et al. (2017), H 1145–619 has a light curve with a -year cycle together with unexplained multiple modes of much shorter periods ( year), qualitatively similar to what we see for AzV 493, which has a long cycle of 14.6 (7.3) years and short oscillations of days. While it remains unclear whether the light curves of H 1145–619 and AzV 493 have fundamental similarities, both stars are massive OBe stars. If they are related, the fact that H 1145–619 has a confirmed compact binary companion may suggest that the unusual variability of AzV 493 may have a similar origin.
These objects provide a context for AzV 493 that supports this object being a member of this broad class of binary, massive OBe systems with high eccentricities. At 50 , AzV 493 is more massive than any of these similar objects. It is also one of the earliest O stars in the SMC, since there is no photospheric He i. Thus, AzV 493 may be the most extreme such object known, in terms of its mass and effective temperature. Its variability amplitudes are also among the largest known.
We note that, based on only the Epoch A spectrum (Figure 5), Golden-Marx et al. (2016) suggested that AzV 493 is a normal, but extremely early, classical Oe star. Given the strong spectroscopic and photometric variability, the nature of this spectrum may be somewhat different than inferred in that work, and the origin of the strong line emission seen in this particular spectrum is unclear (Section 3.3). Still, its status as a post-SN binary where the observed star was likely spun up by mass transfer from the compact object progenitor, is consistent with the origin of classical OBe stars. Indeed, given that most of the massive OBe stars are post-SN systems (e.g., Dallas & Oey, 2022; Dorigo Jones et al., 2020), we can expect that more of them are likely to be high-eccentricity, compact-object binaries.
6.5 Alternative Companion Scenarios
We now consider alternative scenarios for a putative binary component. First, such a companion might be an unexploded former donor in an interacting binary. In this case, it could be a stripped star (e.g., Schootemeijer et al., 2018; Götberg et al., 2017), which can be elusive to detect. Wang et al. (2021) identified hot, stripped star companions to Be stars based on FUV spectral cross-correlations; however, the extremely hot temperature of AzV 493, which is commensurate with the hottest O stars, poses a serious challenge for this method. If the observed star has previously experienced accretion from binary mass transfer, then its surface might be He- and N-enriched (e.g., Blaauw, 1993; Renzo & Götberg, 2021), although whether this occurs depends on the accretion efficiency and mixing processes in the accretor’s envelope. Since early O stars have few metal lines, it is again difficult to evaluate any enrichment, especially in a fast rotator like AzV 493. There is no immediate evidence for any unusual abundances in this star. Moreover, a non-degenerate companion does not naturally explain the high observed eccentricity, which would then have to be primordial, avoiding tidal dissipation, or of dynamical origin.
Alternatively, the high rotation rate and variability of AzV 493 might be caused by a non-standard internal structure of the star because of a merger. These are common among massive stars, occurring in of isolated massive binaries (Renzo et al., 2019), with an even higher rate if accounting for the presence of further companions (e.g. Toonen et al., 2020). For example, Car has been suggested to originate from a merger in a hierarchical triple system, resulting in a present-day eccentric binary (e.g., Hirai et al., 2021). However, Car is a luminous blue variable star and has other substantial differences from AzV 493.
Yet another possibility is that AzV 493 might be a triple system with a third, also invisible, star on a shorter-period orbit. This speculative scenario might help to explain how the strong, 40-day pulsations are maintained (Section 2.2). It also might help explain the apparently sporadic ejection and accretion events seen in Epochs B and F (Section 3.4). Such a system would be unstable, but the brief interaction phase with the secondary may enhance its longevity. We note that the system is unlikely to be a triple in which the third star has an even larger orbit than the secondary. Although high orbital eccentricities can be produced by Kozai-Lidov cycles in such a system, this high-eccentricity phase of the cycle is short in duration. Thus, such extreme eccentricity may require a triple or higher-order multiple-star interaction in the system’s birth cluster, and may be linked to a dynamical ejection of AzV 493 into the field. Overall, however, it is challenging to explain AzV 493 in terms of a triple-star scenario. Unfortunately, RV monitoring is complicated due to the technical difficulty and possible presence of varying stellar pulsations, so it will be hard to evaluate whether the system consists of more than two stars.
7 Summary
We present 18 years of OGLE Project photometric data and spectroscopic data over 12 years, revealing the remarkable variability of AzV 493. This is perhaps the earliest known classical Oe star, with K, , and . These parameters imply a mass of . The dominant photometric pattern is reproduced after 14.6 years. There are also large, semi-regular -day pulsations of unknown origin, as well as other structure in the light curve. It is not a known HMXB. The observed sin km s-1, with a high inferred , suggesting a rotational velocity of km s-1. The system is pc from the nearest massive star-forming complex and its proper motion shows that it is likely a runaway star from that region, with a transverse velocity of km s-1, possibly having experienced two-step acceleration.
Altogether, the data suggest that this object is likely an eccentric, interacting binary system with an undetected compact companion. If so, the orbital period could correspond to the 14.6 (7.3)-year period, implying a high eccentricity of at least (0.93) and apastron (28) AU. If this binary scenario is correct, AzV 493 would be among the most extreme systems known, in terms of its early spectral type, high mass, and extreme eccentricity.
In our favored model, an optically thick decretion disk is regularly ejected, likely by a periastron encounter. A two-component disk system forms, with the outer region responsible for the 0.85-magnitude drop in -band flux, while the inner disk is the origin of most of the observed emission-line spectrum. The spectra appear to show varying relative contributions from the inner and outer regions, consistent with the optically thick outer region dissipating over the cycle. The outer region may correspond to a flared disk, torus, or possibly, a separate inclined annulus formed by tearing from the inner disk. We see direct spectroscopic evidence for episodes of both matter ejection and infalling reabsorption of dense disk material onto the star. The lack of exact regularity of photometric and spectroscopic variations in the cycle implies that the geometry and/or mechanics of the disk ejection may vary. An alternative, opposite model seen in some Be stars, in which the brightness increases due to contribution from growing disk emission (e.g., Suffak et al., 2020; Ghoreyshi et al., 2018), should also be considered.
If AzV 493 indeed has a highly eccentric orbit, it would suggest that the system experienced a strong SN kick, implying that the unseen companion is a neutron star or black hole. The high sin also suggests that mass transfer occurred before this event. For conservative, Case A mass transfer, the progenitor donor’s ZAMS mass would be for a typical , and larger for non-conservative Case B mass transfer. This mass range is well within that suggested by models to produce black holes, although the occurrence of strong natal kicks in cases of black hole formation is less clear. Alternatively, the donor could be a stripped star; however, this scenario cannot explain the extreme eccentricity, which would have to be dynamical or primordial. The system could also be a merger, but the eruptions and long-term pulsations seem less consistent with this scenario. AzV 493 could possibly be a triple system, which might explain how the strong photometric oscillations are maintained (Section 6.5).
Establishing the existence and nature of the unseen companion(s) can provide important constraints on binary evolution, core explodability, and the origin of compact binaries. AzV 493 may offer an opportunity to directly observe the relationship between the binary companion’s dynamical interaction and the disk ejection. Since many classical OBe stars are massive, post-SN objects, it suggests a likely link between OBe stars and massive, eccentric systems. Further study of this fascinating object can more definitively confirm its status and exploit the opportunities it offers to learn about massive binary evolution and disk ejection.
References
- Alfonso-Garzón et al. (2017) Alfonso-Garzón, J., Fabregat, J., Reig, P., et al. 2017, A&A, 607, A52
- Arzoumanian et al. (2002) Arzoumanian, Z., Chernoff, D. F., & Cordes, J. M. 2002, ApJ, 568, 289
- Astropy Collaboration et al. (2013) Astropy Collaboration, Robitaille, T. P., Tollerud, E. J., et al. 2013, A&A, 558, A33
- Atri et al. (2019) Atri, P., Miller-Jones, J. C. A., Bahramian, A., et al. 2019, MNRAS, 489, 3116
- Azzopardi et al. (1975) Azzopardi, M., Vigneau, J., & Macquet, M. 1975, A&AS, 22, 285
- Baade et al. (2016) Baade, D., Rivinius, T., Pigulski, A., et al. 2016, A&A, 588, A56
- Baade et al. (2018) Baade, D., Pigulski, A., Rivinius, T., et al. 2018, A&A, 610, A70
- Becker et al. (2015) Becker, J. C., Johnson, J. A., Vanderburg, A., & Morton, T. D. 2015, ApJS, 217, 29
- Belczynski et al. (2008) Belczynski, K., Kalogera, V., Rasio, F. A., et al. 2008, ApJS, 174, 223
- Bernstein et al. (2003) Bernstein, R., Shectman, S. A., Gunnels, S. M., Mochnacki, S., & Athey, A. E. 2003, in Instrument Design and Performance for Optical/Infrared Ground-based Telescopes. Edited by Iye, Masanori; Moorwood, Alan F. M. Proceedings of the SPIE, Volume 4841, pp. 1694-1704 (2003)., Vol. 4841, 1694–1704
- Bigelow & Dressler (2003) Bigelow, B. C., & Dressler, A. M. 2003, in Instrument Design and Performance for Optical/Infrared Ground-based Telescopes. Edited by Iye, Masanori; Moorwood, Alan F. M. Proceedings of the SPIE, Volume 4841, pp. 1727-1738 (2003)., Vol. 4841, 1727–1738
- Blaauw (1993) Blaauw, A. 1993, in Astronomical Society of the Pacific Conference Series, Vol. 35, Massive Stars: Their Lives in the Interstellar Medium, ed. J. P. Cassinelli & E. B. Churchwell, 207
- Blanco-Cuaresma et al. (2014) Blanco-Cuaresma, S., Soubiran, C., Heiter, U., & Jofré, P. 2014, A&A, 569, A111
- Bodensteiner et al. (2020) Bodensteiner, J., Shenar, T., & Sana, H. 2020, A&A, 641, A42
- Bonanos et al. (2010) Bonanos, A. Z., Lennon, D. J., Köhlinger, F., et al. 2010, AJ, 140, 416
- Brandt & Podsiadlowski (1995) Brandt, N., & Podsiadlowski, P. 1995, MNRAS, 274, 461
- Brott et al. (2011) Brott, I., de Mink, S. E., Cantiello, M., et al. 2011, A&A, 530, A115
- Callister et al. (2020) Callister, T. A., Farr, W. M., & Renzo, M. 2020, arXiv e-prints, arXiv:2011.09570
- Cantiello et al. (2007) Cantiello, M., Yoon, S., Langer, N., & Livio, M. 2007, A&A, 465, L29
- Castro et al. (2018) Castro, N., Oey, M. S., Fossati, L., & Langer, N. 2018, ApJ, 868, 57
- Che et al. (2012) Che, X., Monnier, J. D., Tycner, C., et al. 2012, ApJ, 757, 29
- Conti & Leep (1974) Conti, P. S., & Leep, E. M. 1974, ApJ, 193, 113
- Couch et al. (2020) Couch, S. M., Warren, M. L., & O’Connor, E. P. 2020, ApJ, 890, 127
- Dallas & Oey (2022) Dallas, M. M., & Oey, M. S. 2022, ApJ, in press
- de Wit et al. (2006) de Wit, W. J., Lamers, H. J. G. L. M., Marquette, J. B., & Beaulieu, J. P. 2006, A&A, 456, 1027
- Dorigo Jones et al. (2020) Dorigo Jones, J., Oey, M. S., Paggeot, K., Castro, N., & Moe, M. 2020, ApJ, 903, 43
- Dray et al. (2005) Dray, L. M., Dale, J. E., Beer, M. E., Napiwotzki, R., & King, A. R. 2005, MNRAS, 364, 59
- Fitzpatrick & Massa (2007) Fitzpatrick, E. L., & Massa, D. 2007, ApJ, 663, 320
- Gaia Collaboration et al. (2021) Gaia Collaboration, Brown, A. G. A., Vallenari, A., et al. 2021, A&A, 649, A1
- Ghoreyshi et al. (2018) Ghoreyshi, M. R., Carciofi, A. C., Rímulo, L. R., et al. 2018, MNRAS, 479, 2214
- Golden-Marx et al. (2016) Golden-Marx, J. B., Oey, M. S., Lamb, J. B., Graus, A. S., & White, A. S. 2016, ApJ, 819, 55
- Götberg et al. (2017) Götberg, Y., de Mink, S. E., & Groh, J. H. 2017, A&A, 608, A11
- Graczyk et al. (2014) Graczyk, D., Pietrzyński, G., Thompson, I. B., et al. 2014, ApJ, 780, 59
- Hainich et al. (2019) Hainich, R., Ramachandran, V., Shenar, T., et al. 2019, A&A, 621, A85
- Hartmann et al. (2016) Hartmann, L., Herczeg, G., & Calvet, N. 2016, ARA&A, 54, 135
- Henize (1956) Henize, K. G. 1956, ApJS, 2, 315
- Hirai et al. (2021) Hirai, R., Podsiadlowski, P., Owocki, S. P., Schneider, F. R. N., & Smith, N. 2021, MNRAS, 503, 4276
- Janka (2013) Janka, H.-T. 2013, MNRAS, 434, 1355
- Janka (2017) —. 2017, ApJ, 837, 84
- Jayasinghe et al. (2021) Jayasinghe, T., Kochanek, C. S., Strader, J., et al. 2021, MNRAS, 506, 4083
- Katahira et al. (1996) Katahira, J.-I., Hirata, R., Ito, M., et al. 1996, PASJ, 48, 317
- Kelson (2003) Kelson, D. D. 2003, Publications of the Astronomical Society of the Pacific, 115, 688
- Kelson et al. (2000) Kelson, D. D., Illingworth, G. D., van Dokkum, P. G., & Franx, M. 2000, ApJ, 531, 159
- Klencki et al. (2022) Klencki, J., Istrate, A., Nelemans, G., & Pols, O. 2022, A&A, 662, A56
- Labadie-Bartz et al. (2017) Labadie-Bartz, J., Pepper, J., McSwain, M. V., et al. 2017, AJ, 153, 252
- Lamb et al. (2016) Lamb, J. B., Oey, M. S., Segura-Cox, D. M., et al. 2016, ApJ, 817, 113
- Mandel (2016) Mandel, I. 2016, MNRAS, 456, 578
- Marr et al. (2022) Marr, K. C., Jones, C. E., Tycner, C., Carciofi, A. C., & Silva, A. C. F. 2022, ApJ, 928, 145
- Martins & Palacios (2021) Martins, F., & Palacios, A. 2021, A&A, 645, A67
- Martins et al. (2005) Martins, F., Schaerer, D., & Hillier, D. J. 2005, A&A, 436, 1049
- Massey (2002) Massey, P. 2002, The Astrophysical Journal Supplement Series, 141, 81
- Mateo et al. (2012) Mateo, M., Bailey, J. I., Crane, J., et al. 2012, in Proceedings of the SPIE, Volume 8446, id. 84464Y 19 pp. (2012)., Vol. 8446, 84464Y
- Moe & Di Stefano (2017) Moe, M., & Di Stefano, R. 2017, ApJS, 230, 15
- Natta & Whitney (2000) Natta, A., & Whitney, B. A. 2000, A&A, 364, 633
- Nemravová et al. (2010) Nemravová, J., Harmanec, P., Kubát, J., et al. 2010, A&A, 516, A80
- O’Connor & Ott (2011) O’Connor, E., & Ott, C. D. 2011, ApJ, 730, 70
- Okazaki (1991) Okazaki, A. T. 1991, Publications of the Astronomical Society of Japan, 43, 75
- Pablo et al. (2017) Pablo, H., Richardson, N. D., Fuller, J., et al. 2017, MNRAS, 467, 2494
- Packet (1981) Packet, W. 1981, A&A, 102, 17
- Pflamm-Altenburg & Kroupa (2010) Pflamm-Altenburg, J., & Kroupa, P. 2010, MNRAS, 404, 1564
- Podsiadlowski et al. (2004) Podsiadlowski, P., Langer, N., Poelarends, A. J. T., et al. 2004, ApJ, 612, 1044
- Poeckert (1982) Poeckert, R. 1982, in Be Stars, Vol. 98, 453–477
- Poleski et al. (2012) Poleski, R., Soszyński, I., Udalski, A., et al. 2012, Acta Astron., 62, 1
- Pols et al. (1991) Pols, O. R., Cote, J., Waters, L. B. F. M., & Heise, J. 1991, A&A, 241, 419
- Puls et al. (2005) Puls, J., Urbaneja, M. A., Venero, R., et al. 2005, A&A, 435, 669
- Renzo & Götberg (2021) Renzo, M., & Götberg, Y. 2021, arXiv e-prints, arXiv:2107.10933
- Renzo et al. (2019) Renzo, M., Zapartas, E., de Mink, S. E., et al. 2019, A&A, 624, A66
- Repetto et al. (2017) Repetto, S., Igoshev, A. P., & Nelemans, G. 2017, MNRAS, 467, 298
- Richardson et al. (2021) Richardson, N. D., Thizy, O., Bjorkman, J. E., et al. 2021, arXiv e-prints, arXiv:2109.11026
- Rivero González et al. (2012) Rivero González, J. G., Puls, J., Massey, P., & Najarro, F. 2012, A&A, 543, A95
- Rivinius et al. (2013) Rivinius, T., Carciofi, A. C., & Martayan, C. 2013, Astronomy and Astrophysics Review, 21, 69
- Santolaya-Rey et al. (1997) Santolaya-Rey, A. E., Puls, J., & Herrero, A. 1997, A&A, 323, 488
- Schootemeijer et al. (2018) Schootemeijer, A., Götberg, Y., de Mink, S. E., Gies, D., & Zapartas, E. 2018, A&A, 615, A30
- Sigut et al. (2009) Sigut, T. A. A., McGill, M. A., & Jones, C. E. 2009, ApJ, 699, 1973
- Simón-Díaz & Herrero (2007) Simón-Díaz, S., & Herrero, A. 2007, A&A, 468, 1063
- Simón-Díaz & Herrero (2014) —. 2014, A&A, 562, A135
- Simón-Díaz et al. (2015) Simón-Díaz, S., Caballero, J. A., Lorenzo, J., et al. 2015, ApJ, 799, 169
- Skrutskie et al. (2006) Skrutskie, M. F., Cutri, R. M., Stiening, R., et al. 2006, AJ, 131, 1163
- Smith et al. (2005) Smith, R. C., Points, S. D., Chu, Y. H., et al. 2005, in American Astronomical Society Meeting Abstracts, Vol. 207, American Astronomical Society Meeting Abstracts, 25.07
- Sota et al. (2011) Sota, A., Maíz Apellániz, J., Walborn, N. R., et al. 2011, ApJS, 193, 24
- Suffak et al. (2022) Suffak, M., Jones, C. E., & Carciofi, A. C. 2022, MNRAS, 509, 931
- Suffak et al. (2020) Suffak, M. W., Jones, C. E., Tycner, C., et al. 2020, ApJ, 890, 86
- Sukhbold et al. (2016) Sukhbold, T., Ertl, T., Woosley, S. E., Brown, J. M., & Janka, H.-T. 2016, ApJ, 821, 38
- Sun et al. (2023) Sun, M., Townsend, R. H. D., & Guo, Z. 2023, arXiv e-prints, arXiv:2301.06599
- Tango et al. (2009) Tango, W. J., Davis, J., Jacob, A. P., et al. 2009, MNRAS, 396, 842
- Tauris & Takens (1998) Tauris, T. M., & Takens, R. J. 1998, A&A, 330, 1047
- Toonen et al. (2020) Toonen, S., Portegies Zwart, S., Hamers, A. S., & Bandopadhyay, D. 2020, A&A, 640, A16
- Tycner et al. (2011) Tycner, C., Ames, A., Zavala, R. T., et al. 2011, ApJ, 729, L5
- Udalski et al. (2008) Udalski, A., Szymanski, M. K., Soszynski, I., & Poleski, R. 2008, Acta Astron., 58, 69
- Udalski et al. (2015) Udalski, A., Szymański, M. K., & Szymański, G. 2015, Acta Astron., 65, 1
- van den Heuvel (1969) van den Heuvel, E. P. J. 1969, AJ, 74, 1095
- van der Meij et al. (2021) van der Meij, V., Guo, D., Kaper, L., & Renzo, M. 2021, arXiv e-prints, arXiv:2108.12918
- Vargas-Salazar et al. (2020) Vargas-Salazar, I., Oey, M. S., Barnes, J. R., et al. 2020, ApJ, 903, 42
- Verbunt et al. (2017) Verbunt, F., Igoshev, A., & Cator, E. 2017, A&A, 608, A57
- Vinciguerra et al. (2020) Vinciguerra, S., Neijssel, C. J., Vigna-Gómez, A., et al. 2020, MNRAS, 498, 4705
- Walker et al. (2015) Walker, M. G., Mateo, M., Olszewski, E. W., et al. 2015, ApJ, 808, 108
- Wang et al. (2021) Wang, L., Gies, D. R., Peters, G. J., et al. 2021, AJ, 161, 248
- Zapartas et al. (2021) Zapartas, E., Renzo, M., Fragos, T., et al. 2021, arXiv e-prints, arXiv:2106.05228
- Zechmeister & Kürster (2009) Zechmeister, M., & Kürster, M. 2009, A&A, 496, 577
- Zhang et al. (2008) Zhang, W., Woosley, S. E., & Heger, A. 2008, ApJ, 679, 639
Appendix A Generalized Lomb-Scargle periodograms
Figure 13 shows the individual generalized Lomb-Scargle periodograms (Zechmeister & Kürster, 2009) and ancillary information for the six, roughly contiguous, OGLE datasets during 2010 – 2016 (Section 2.2).