JWST Discovery of Dust Reservoirs in Nearby Type IIP Supernovae 2004et and 2017eaw
Abstract
Supernova (SN) explosions have been sought for decades as a possible source of dust in the Universe, providing the seeds of galaxies, stars, and planetary systems. SN 1987A offers one of the most promising examples of significant SN dust formation, but until the James Webb Space Telescope (JWST), instruments have traditionally lacked the sensitivity at both late times ( yr post-explosion) and longer wavelengths (i.e., m) to detect analogous dust reservoirs. Here we present JWST/MIRI observations of two historic Type IIP SNe, 2004et and SN 2017eaw, at nearly 18 yr and 5 yr post-explosion, respectively. We fit the spectral energy distributions as functions of dust mass and temperature, from which we are able to constrain the dust geometry, origin, and heating mechanism. We place a 90% confidence lower limit on the dust masses for SNe 2004et and 2017eaw of and M⊙, respectively. More dust may exist at even colder temperatures or may be obscured by high optical depths. We conclude dust formation in the ejecta to be the most plausible and consistent scenario. The observed dust is radiatively heated to –150 K by ongoing shock interaction with the circumstellar medium. Regardless of the best fit or heating mechanism adopted, the inferred dust mass for SN 2004et is the second highest (next to SN 1987A) inferred dust mass in extragalactic SNe thus far, promoting the prospect of SNe as potential significant sources of dust in the Universe.
keywords:
supernovae: general - supernovae: individual: SN 2004et, SN 2017eaw - infrared: general - transients: supernovae1 Introduction
The source of the large amounts of dust observed in high-redshift galaxies remains uncertain (Maiolino et al., 2004). For over 50 yr, core-collapse supernovae (CCSNe) have been considered as possible sources of dust (Cernuschi & Codina, 1967; Hoyle & Wickramasinghe, 1970). Type II-P supernovae (SNe IIP), in particular, are likely candidates since they account for % of all SNe II, and are plentiful enough that they could account for the observed dust at high redshifts (e.g., see Schneider et al., 2004; Dwek et al., 2007; Nozawa et al., 2008; Gall et al., 2011, and references therein). Models of expanding SN IIP ejecta succeed in condensing out sufficient quantities (0.1–1 M⊙; Todini & Ferrara 2001; Nozawa et al. 2003; Cherchneff & Dwek 2009; Sarangi & Cherchneff 2015; Sluder et al. 2018; Sarangi et al. 2018).
A number of SNe of different subclasses were observed by the Spitzer Space Telescope (hereafter Spitzer), but measured dust masses were often too small to explain the amount of dust at high redshifts. Only a handful of nearby SNe II, let alone SNe IIP, have shown direct observational evidence for dust condensation, and these examples all yielded 2–3 orders of magnitude ( M⊙) less dust than predicted by the above models (e.g., Gerardy et al., 2002; Pozzo et al., 2004; Sugerman et al., 2006; Meikle et al., 2007, 2011; Andrews et al., 2010, 2011; Fabbri et al., 2011; Szalai et al., 2011). Renewed interest in SN dust began with several important advances: (i) the far-infrared/submm/mm detection of a large amount of cold dust in SN 1987A (Matsuura et al., 2011; Indebetouw et al., 2014; Bevan & Barlow, 2016), (ii) the detection of large quantities of dust in some Galactic SNRs (e.g., Owen & Barlow, 2015; Temim et al., 2017; De Looze et al., 2017; Priestley et al., 2020), (iii) large dust masses ( M⊙) inferred from optical line profile asymmetries (Bevan & Barlow, 2016; Bevan et al., 2017, 2019) and (iii) the identification of isotopic anomalies in meteorites (e.g., Clayton & Nittler, 2004).
Despite these promising discoveries, large dust reservoirs have not yet been directly observed at mid-IR wavelengths in extragalactic SNe, which could be due to a number of reasons. New dust condenses at high temperatures, but its temperature decreases rapidly with the expansion of the ejecta and the decay of internal radioactive heating sources. Consequently, the reservoirs of warm and cold (i.e., not hot) dust may only become detectable at longer wavelengths (Wesson et al., 2015). Spitzer was limited in its sensitivity at these wavelengths during the Cold Mission, which ended in 2008. After that point, Spitzer had access to only 3.6 and 4.5 m imaging. Furthermore, the timeline of dust growth is quite uncertain. Gall et al. (2014) suggest that accelerated dust growth does not begin until yr after explosion. However, Dwek et al. (2019) argue that the dust mostly forms at earlier epochs ( yr) but is largely obscured due to optical-depth effects until the ejecta expand sufficiently and become optically thin at later epochs. The Spitzer observations could probe only the warmer dust components ( K) and/or earlier epochs ( yr). For the first time, JWST’s Mid-Infrared Instrument (MIRI) offers the possibility to probe cooler dust growth in extragalactic SNe (e.g., Hosseinzadeh et al., 2022).
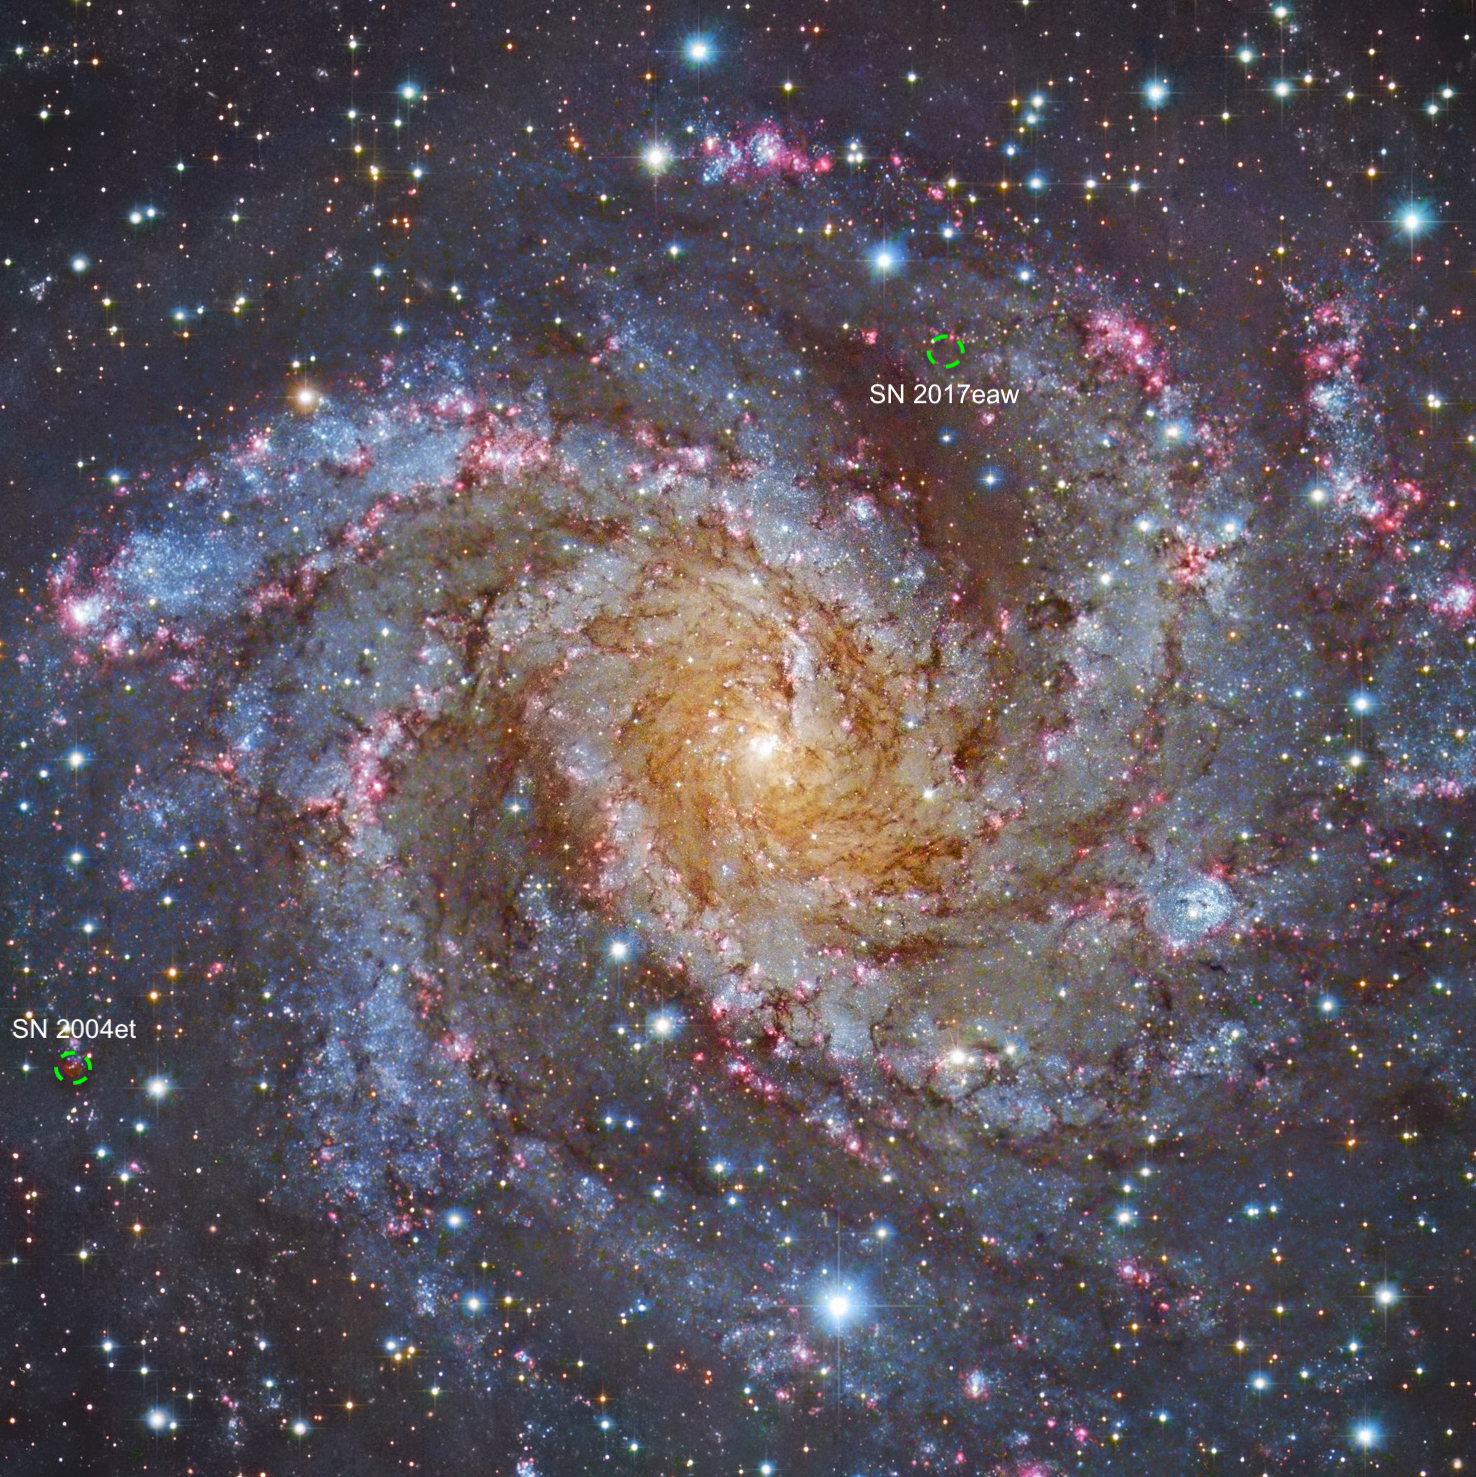
Here we present MIRI imaging observations of two SNe IIP, 2004et and 2017eaw, as part of JWST GO-2666 (PI O. Fox). SN 2004et was discovered by S. Moretti on 2004 September 27 UT (Zwitter et al., 2004) and SN 2017eaw was discovered on 2017 May 14.24 UT (Wiggins, 2017; Dong & Stanek, 2017). Both SNe located in the nearby, face-on spiral galaxy NGC 6946, which has produced around a dozen known SNe and other luminous transients (including SNe IIP 1948B, 2002hh, the Type IIL SN 1980K, and the “SN impostor" SN 2008S). While they appeared on opposite sides of the host galaxy, both photometric and spectral evolution of SNe 2004et and SN 2017eaw seem to be quite similar and correspond well to those of “normal” SN IIP explosions; however, SN 2004et was a bit more luminous than SN 2017eaw (they reached a peak magnitude of 12.6 and 12.8, respectively; see, e.g., Sahu et al., 2006; Maguire et al., 2010; Tsvetkov et al., 2018; Van Dyk et al., 2019; Szalai et al., 2019; Buta & Keel, 2019).
The search for potential progenitors of both SNe in archival imaging started right after their discoveries. For SN 2004et, Li et al. (2005) identified a yellow supergiant on Canada-France-Hawaii Telescope images. Later, Crockett et al. (2011) showed that this source was still visible years after explosion and – based on high-resolution post-explosion images obtained by William Herschel Telescope, Hubble Space Telescope (HST), and the Gemini telescope – the progenitor is rather a late-K to late-M supergiant of M⊙. Nevertheless, hydrodynamic and semi-analytical modeling of optical light curves lead to an ejecta mass of –23 M⊙ (Utrobin & Chugai, 2009; Nagy et al., 2014; Morozova et al., 2018; Ricks & Dwarkadas, 2019; Martinez & Bersten, 2019), implying a much larger progenitor mass. Using the method of late-time spectral modeling, Jerkstrand et al. (2012) determined a value of M⊙ for SN 2004et.
In the case of SN 2017eaw, archival HST and Large Binocular Telescope images enabled the identification of the progenitor as a red supergiant (RSG) star with an estimated initial mass of –17 M⊙ (van Dyk et al., 2017; Kilpatrick & Foley, 2018; Johnson et al., 2018; Rui et al., 2019). Modeling of optical light curves and nebular spectra (Szalai et al., 2019), as well as of near-infrared (NIR) spectra (Rho et al., 2018), consistently give M⊙. Note that Williams et al. (2018) give a much lower value for the progenitor mass (8.8) of SN 2017eaw from modeling the local stellar population.
Both SNe also show evidence for early dust formation in their ejecta. For SN 2004et, Kotak et al. (2009) and Fabbri et al. (2011) present one of the most detailed mid-IR Spitzer datasets of an SN including four-channel IRAC (3.6–8.0 m), MIPS (24.0 m), and IRS measurements. For SN 2017eaw, near-IR spectra and photometry, accompanied by 3.6 m and 4.5 m Spitzer photometry, were used for giving estimates of the properties of early-time dust (Rho et al., 2018; Tinyanont et al., 2019, see details later).
SNe 2004et and 2017eaw belong to the small group of SNe IIP showing signs of late-time circumstellar interaction. Early-time radio (SN 2004et: Stockdale et al. 2004; Beswick et al. 2004; Misra et al. 2007; Martí-Vidal et al. 2007; SN 2017eaw: Argo et al. 2017; Nayana & Chandra 2017) and X-ray (SN 2004et: Misra et al. 2007; Rho et al. 2007; SN 2017eaw: Kong & Li 2017; Grefensetette et al. 2017) detections, giving the highest fluxes among SNe II-P, have already implied the presence of (moderate) circumstellar material (CSM) in the vicinity of both SNe (Chevalier et al., 2006; Szalai et al., 2019). In the case of SN 2017eaw, an early bump peaking at –7 days after explosion in all optical bands also supports this picture (Szalai et al., 2019). Moreover, based on archival Spitzer images, Kilpatrick & Foley (2018) showed that the progenitor of SN 2017eaw was surrounded by a dusty shell at R⊙. Final evidence for the presence of CSM was the detection of strong H emission with a box-like line profile in both SNe yr after explosion (Kotak et al., 2009; Maguire et al., 2010; Weil et al., 2020) and very late-time optical detections (Rizzo Smith et al., 2022); these findings also strengthen the picture on the similarity of the two exploded stars and of their environments.
Combined light-curve analysis of SNe 2004et and 2017eaw also enabled a proper estimate of the distance of the host galaxy NGC 6946. While previous work gave a value of –5.9 Mpc, Szalai et al. (2019) showed that the distance of NGC 6946 is probably larger by %, in agreement with the values given by the tip-of-the-red-giant-branch (TRGB) method (Tikhonov, 2014; Anand et al., 2018). In this paper, we use the latest TRGB distance111http://edd.ifa.hawaii.edu/get_cmd.php?pgc=65001 of Mpc ( mag).
In Section 2 of this paper, we present our observations and reductions. Section 3 describes the dust formation physical scenarios and our dust models. We interpret the results in Section 4 and discuss the dust masses relative to those of other historic SNe. A summary of our results and the conclusions are given in Section 5.
2 Observations and Data Reduction
2.1 JWST/MIRI Imaging
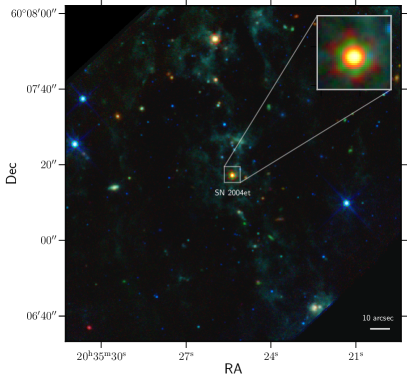
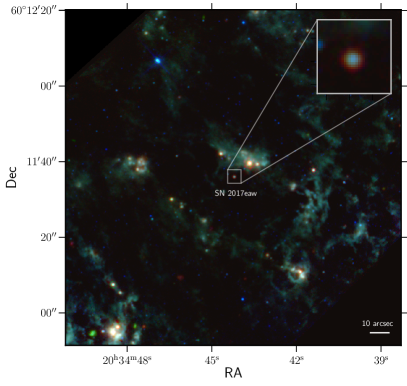
As part of the Cycle 1 General Observers (GO) 2666 program (PI O. Fox), we obtained images of SNe 2004et and 2017eaw with the JWST Mid-Infrared Instrument (MIRI; Bouchet et al. 2015; Ressler et al. 2015; Rieke et al. 2015; Rieke & Wright 2022) on 20 Sep. 2022 (6567 days post-explosion) and 21 Sep. 2022 (1954 days post-explosion), respectively (see Figure 1). The observations were acquired in the F560W, F1000W, F1130W, F1280W, F1500W, F1800W, F2100W, and F2550W filter bands, using the FASTR1 readout pattern in the FULL array mode and a 4-point extended source dither pattern. The data were processed with the JWST Calibration Pipeline version 1.7.2, using the Calibration Reference Data System version 11.16.9.
A “background image" was constructed for each filter by taking a sigma-clipped average of the individual dithers in detector coordinates, and this background was then subtracted from the calibrated (level two) individual dither images in the corresponding filter. The background-subtracted level-two images were then combined into a single calibrated image for each filter (Bright & JWST/MIRI Team, 2016; Greenfield & Miller, 2016; Bushouse et al., 2022). To measure the brightness of both SNe, we performed point-spread-function (PSF) photometry on background-subtracted level-two data products using WebbPSF (Perrin et al., 2014). In order to calibrate the flux, we applied flux offsets by measuring the PSF of all the stars in the field and comparing them to the corresponding catalogs created by the pipeline. The fluxes of all four dithers of each filter were then averaged. Table 3 summarizes the PSF photometry for both SNe in terms of both flux and AB magnitude (Oke & Gunn, 1983).
| Filters | SN 2004et | SN 2017eaw | ||
|---|---|---|---|---|
| Mag | Flux | Mag | Flux | |
| [Jy] | [Jy] | |||
| F560W | 20.89 0.03 | 15.96 0.49 | 21.90 0.04 | 6.39 0.29 |
| F1000W | 18.67 0.01 | 122.63 1.51 | 19.49 0.01 | 58.12 0.79 |
| F1130W | 17.78 0.01 | 279.68 3.60 | 19.64 0.02 | 51.17 1.25 |
| F1280W | 17.25 0.01 | 456.39 4.36 | 19.81 0.01 | 43.30 0.58 |
| F1500W | 16.74 0.01 | 727.80 5.85 | 19.40 0.01 | 63.26 0.69 |
| F1800W | 16.36 0.01 | 1037.30 6.42 | 18.73 0.01 | 117.00 1.28 |
| F2100W | 16.16 0.01 | 1238.45 7.58 | 18.63 0.01 | 128.20 1.61 |
| F2550W | 15.75 0.01 | 1804.75 21.60 | 18.87 0.05 | 102.47 6.08 |
2.2 HST Archival Photometry
For part of this analysis (Section 4.2 below), we obtained HST images for the two SNe from the Mikulski Archive for Space Telescopes (MAST). Although all the data were previously published in separate papers, we reanalyze the data here to provide single, consistent set of photometry reduced with the latest version of the HST pipeline. We downloaded drizzled images from MAST, so they have been processed through the standard pipeline at the Space Telescope Science Institute (STScI). Drizzled images are a combination of individual bias-subtracted, dark-subtracted, flat-fielded exposures that are then corrected for geometric distortion. We used the JWST-HST Alignment Tool (JHAT444readthedocs.jhat.io), which applies a relative astrometric correction to each image by iteratively matching sources between observations, to ensure precise alignment between the HST and JWST data.
With all images aligned, the total SN flux was measured inside a circular aperture placed in each HST observation at the JWST SN location using the Python package photutils. The aperture radius was set to 3 pixels, or –2 times the full width at half-maximum intensity for HST ACS and WFC3, owing to a nearby star contaminating the flux at larger radii. We subtract the local background flux from the aperture flux with the -clipped (using 3) median value in a circular annulus centered at the SN location, using an inner radius of 5 pixels and an outer radius of 7 pixels. This is sufficiently large that of the SN flux should be within the annulus inner radius, but small enough to ensure the neighboring star contamination and background light are removed. Finally, the measured flux for each image was corrected using aperture corrections from the public ACS/WFC3 encircled energy tables555https://www.stsci.edu/hst/instrumentation/acs/data-analysis/aperture-corrections,666https://www.stsci.edu/hst/instrumentation/wfc3/data-analysis/photometric-calibration/uvis-encircled-energy, and converted to AB magnitudes using the time-dependent inverse sensitivity and filter pivot wavelengths provided with each data file.
2.3 Spitzer Archival Photometry
SN 2004et was observed with the Spitzer InfraRed Array Camera (IRAC; Fazio et al., 2004) from 2004 to 2019. Data during the Cold Mission of Spitzer, prior to May 2009, were obtained in all four IRAC channels, while later data during the Warm Mission were obtained in the 3.6 m and 4.5 m channels. Photometry up to 1803 days post-explosion was published by Kotak et al. (2009); Fabbri et al. (2011). The bulk of the late-time data after 2014 was obtained as part of the SPitzer InfraRed Intensive Transients Survey (SPIRITS; Tinyanont et al., 2016; Kasliwal et al., 2017; Jencson et al., 2019).
To perform new photometry on the 3.6 m and 4.5 m IRAC data, we used a single archival pre-explosion Spitzer image to estimate and remove the galaxy background and nearby source contamination. We rotated and aligned IRAC images containing SN light based on the sky coordinates supplied in Spitzer data, and then simply subtract the archival image from a new science image. The location around SN 2004et is sufficiently sparse that careful PSF matching is not crucial. We conducted aperture photometry on the background-subtracted images and applied appropriate aperture corrections as given by the IRAC instrument handbook. We also estimated and removed residual background in the subtracted images using a sky aperture offset from the SN.
2.4 WISE Archival Photometry of SN 2004et
The location of SN 2004et was observed at several epochs during the ongoing NEOWISE all-sky, mid-IR survey in the ( m) and ( m) bands (Wright et al., 2010; Mainzer et al., 2014). We obtained the coadded time-series images of the fields created as part of the unWISE project (Lang, 2014; Meisner et al., 2018). A custom code (De et al., 2020) based on the ZOGY algorithm (Zackay et al., 2016) was used to perform image subtraction on the NEOWISE images using the full-depth coadds of the WISE and NEOWISE missions (obtained during 2010–2014) as reference images. Photometric measurements were obtained by performing forced PSF photometry at the transient position on the difference images until the epoch of the last NEOWISE data release (data acquired until December 2021).
By mid-2017 ( days post-discovery), SN 2004et had faded to a consistent flux below the zero-level of and Jy in the W1 and W2 difference images, respectively. This implies that SN emission was present in the 2010–2014 reference image coadd, and is largely consistent with the fluxes measured by Spitzer at those epochs in the similar 3.6 m and 4.5 m IRAC bands. We thus offset the difference measurements by these values to obtain absolute flux estimates, though this yields no positive detections of the SN () after 2014.
2.5 Optical Spectroscopy
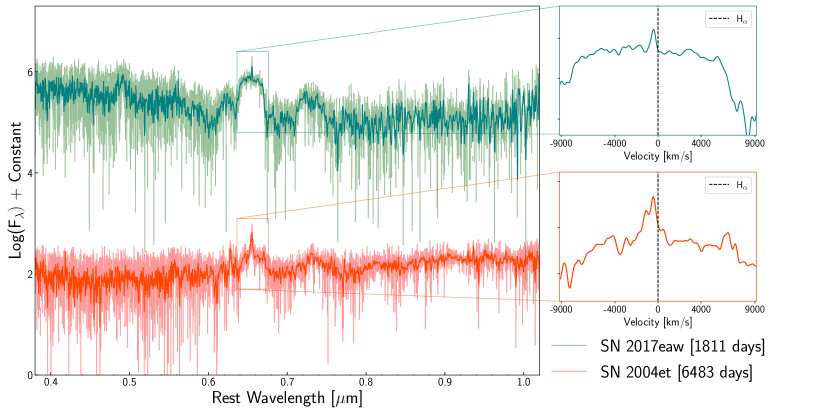
Late-time spectra of SNe 2004et and 2017eaw were obtained with the Keck Low Resolution Imaging Spectrometer (LRIS; Oke et al., 1995) on days 6424 and 1811, respectively (Figure 2). The spectra were acquired with the slit oriented at or near the parallactic angle to minimize slit losses caused by atmospheric dispersion (Filippenko, 1982). The LRIS observations utilized the slit, 600/4000 grism, and 400/8500 grating, to produce a similar wavelength range and spectral resolving power. Data reduction followed standard techniques for CCD processing and spectrum extraction (Silverman et al., 2012) utilizing IRAF777IRAF is written and supported by the National Optical Astronomy Observatories, operated by the Association of Universities for Research in Astronomy, Inc. under cooperative agreement with the National Science Foundation. (Tody, 1986) routines and custom Python and IDL codes.888https://github.com/ishivvers/TheKastShiv The most recent LRIS spectra (from 2017 and later) were processed using the LPipe data-reduction pipeline (Perley, 2019). Low-order polynomial fits to comparison-lamp spectra were used to calibrate the wavelength scale, and small adjustments derived from night-sky lines in the target frames were applied. The spectra were flux calibrated using observations of appropriate spectrophotometric standard stars observed on the same night, at similar airmasses, and with an identical instrument configuration.
3 Analysis
3.1 Physical Scenarios
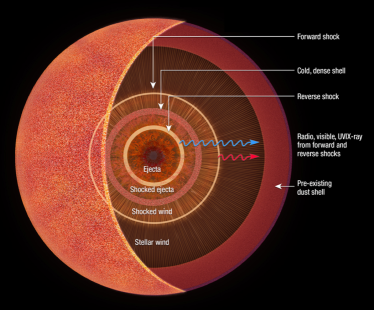
Late-time thermal-IR continuum emission typically indicates the presence of dust. The general SN environment can be complicated, with many different possible origins and heating mechanisms for the dust (Figure 3). The dust may be newly formed or pre-existing at the time of the SN. If newly formed, the dust may condense in the expanding SN ejecta (Kozasa et al., 1989; Wooden et al., 1993) or in the cool, dense shell of post-shocked gas lying in between the forward and reverse shocks (Smith et al., 2008). If pre-existing, the dust may have formed in a steady wind or during a short duration pre-SN outburst. In any scenario, several heating mechanisms are possible, including a thermal light echo from the peak SN flash, radiative heating from circumstellar interaction, and/or collisional heating by hot gas in the reverse shock (e.g., Fox et al., 2010). While strong CSM interaction that yields a Type IIn event is not typically associated with SNe IIP given the low density, relatively low mass-loss rates of their progenitor stars’ winds ( M⊙ yr-1; Beasor et al. 2020), it was more recently showed that even modest winds can build up and result in a relatively large ultraviolet (UV) flux at late times (Dessart & Hillier, 2022; Dessart et al., 2023).
3.2 Corresponding Dust Models
In the optically thick case, the actual dust mass is related to the observationally inferred dust mass, , by (Fox et al., 2010; Dwek et al., 2019)
| (1) |
where
| (2) |
and is the specific flux, the distance to the source, is the dust mass absorption coefficient, is the Planck function at wavelength , is the dust temperature, and is the escape probability of the infrared photons from the emitting region.
As described by Cox & Mathews (1969) and Osterbrock & Ferland (2006), is a function of optical depth (). For a homogeneous dusty sphere in which the absorbers (dust) are uniformly mixed with the emitting sources (in this case dust as well) is given by 999The and time dependence of has been suppressed for the sake of clarity.
| (3) |
The parameter is a typical optical depth, which depends on the geometry of the emitting dust. Assuming that the dust in the SN ejecta can be approximated by a homogeneously expanding sphere, we get that
| (4) | |||||
where is the ejecta density, is the total mass of ejecta dust, is the ejecta radius at time , and is the ejecta velocity.
As a reference, 1 of ejecta dust expanding at a velocity of 5000 km s-1 will have a radial optical depth of 6 at 20 m after 10 years of expansion, where we adopted a value of cm2 g-1, which is applicable for both silicates or amorphous carbon dust. So a priori, we cannot rule out the possibility that a large amount of dust may be hidden because of optical depth effects.
We can also calculate a maximum optical depth by assuming that the radiating dust is homogeneously distributed over the minimally allowed radius, given by the radius, derived by assuming that the observed flux emanates from a perfect blackbody
| (5) |
For values of cm, we get a maximum 20 m optical depth of 60.
| Model | a | Ta | Ra | ||
|---|---|---|---|---|---|
| [M⊙] | [K] | [cm] | |||
| (a) Dusty Sphere (Amorphous C) | 0.044 | 146 | 1.19 | 0 4.1 | 0.17 1 |
| (b) Optically Thin Dust (Amorphous C) | 0.047 | 137 | – | ||
| (c) Dusty Sphere (Silicates) | 0.036 | 167 | 5.24 | 8.9 29.7 | 0.02 0.08 |
| (d) Optically Thin Dust (Silicates) | 0.012 | 136 | – |
-
•
a The numbers reported here are the best fit the 1 (68%) confidence interval as reported by lmfit.conf_interval. See Table 4 for final reported numbers.
-
•
b and values have been calculated at the largest flux value ( 16 m).


| Model | a | a | a | R | ||
|---|---|---|---|---|---|---|
| [M⊙] | [K] | [K] | [cm] | |||
| (a) Dusty Sphere (Silicates) | 0.0007 | 1508 793 | 158 | 2.87 | 0 0.8 | 0.6 1 |
| (b) Optically Thin Dust (Silicates) | 0.0006 | 800 521 | 154 | – |
-
•
a The numbers reported here are the best fit the 1 (68%) confidence interval as reported by lmfit.conf_interval. See Table 4 for final reported numbers.
-
•
b and values have been calculated at 18 m.

3.3 Fitting the Data
To fit the IR data, we need to make some estimation about the dust composition. Since we do not have a mid-IR spectrum to base our assumptions, our choice of the chemical nature of dust is unconstrained. The many different chemical forms of cosmic dust relevant for SNe and their optical properties were explored by Arendt et al. (2014). In a simplified picture, observations and models of dust formation in SN ejecta, both support the presence of O-rich dust species in the form of Mg-silicates, and C-rich dust species such as amorphous carbon or graphite (Wesson & Bevan, 2021; Ercolano et al., 2007; Sarangi & Cherchneff, 2013). In this study, we have also chosen Mg-silicates and/or amorphous carbon as our dust composition. The abosorption and emission properties of these grains are obtained from Draine & Li (2007) and Zubko et al. (2004) for silicates and amorphous carbon respectively (see Sarangi (2022) for the values of absorption coefficients ). Given that we are dealing with mid-IR data, the wavelengths are much larger than the expected sizes of grains; in this Rayleigh regime, grain sizes do not impact the emerging fluxes. We have chosen the absorption coefficients corresponding to a grain radius of 0.1 m.
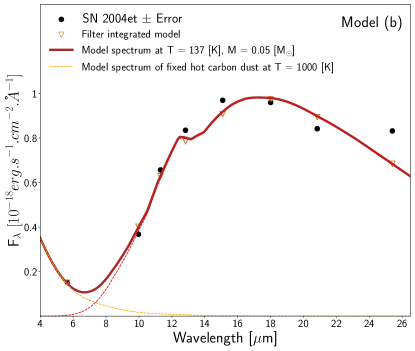
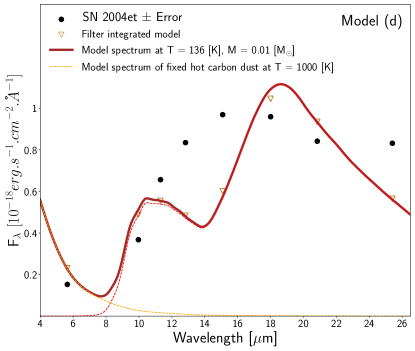
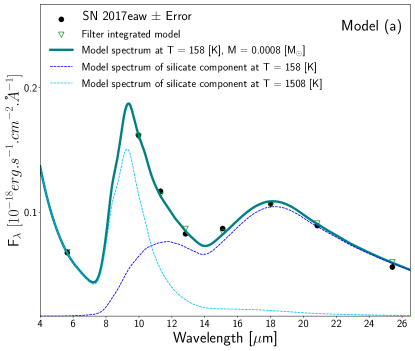
Using Equation 2, we simultaneously fit the dust mass, temperature, composition, and opacity. It is important to note that the best fitting parameters are not necessarily the values that we report. Traditionally, the extragalactic SN dust community has used some variation of Equation 2 to fit the mid-IR dust component straightforwardly with least squares minimization (i.e., using a package like Python’s lmfit). This technique, however, can be misleading. For the case of an increasing optical depth, a significant degeneracy begins to develop. As outlined by Dwek et al. (2019), an almost infinite dust mass can fit the data because the emission from the dust simply does not escape. The fits quickly become unbounded. Furthermore, we have multiple dust components to our model. It is therefore not reasonable to estimate the error from the covariance matrix. Instead, we explicitly calculate the confidence intervals for variable parameters using lmfit.conf_interval 101010https://lmfit.github.io/lmfit-py/confidence.html. Figures 4 and 5 show the best fitting results. Tables 2 and 3 report the best fitting parameters, while Table 4 reports our final dust masses as the values given by the 90% confidence interval.
In fitting the model we assumed that all the dust radiates at the same temperature, justifying the use of Equation 3 for . A more realistic scenario would be to adopt several analytical forms for the dust temperature gradient in the ejecta and use a simple radiative transfer model, such as the one used by Dwek & Arendt (2020) in modeling the emission from the galaxy Arp 220.
At first glance, SNe 2004et and 2017eaw appear to have different compositions, with SN 2017eaw having a strong 10 µm silicate feature. This may be true, but it may also be due to optical depth effects. Notice that an optically thick silicate dust sphere also fits the SN 2004et data quite well given the 10 µm feature is suppressed. From the photometry alone, it is too difficult to distinguish between models. We therefore report results for both compositions for SN 2004et.
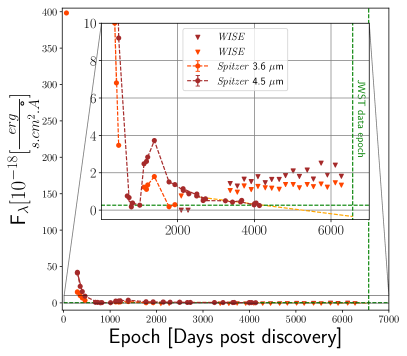
For both SN 2004et and SN 2017eaw, the F560W filter showed an excess relative to the best fitting model. In both cases, we therefore add an additional, hotter contribution that we attribute to the likely presence of hot dust, either newly formed or continuously heated by ongoing shock interaction. Given the contributions of this hot component in only a single JWST filter, we have relatively few constraints. For SN 2004et, the only other long-wavelength (i.e., mid-IR) data we have are the Spitzer and WISE archival data (Sections 2.3 and 2.4), shown in Figure 6. Spitzer observations are available only through days, while all WISE data at epochs days are upper limits. The trend in the Spitzer data is unclear. Although the light curve may be steadily declining, it may also be on a plateau, which is not uncommon for SNe that have signatures of CSM interaction, although the Spitzer fluxes for SN 2004et were close to the instrumental detection limits (see, e.g. Fox et al., 2011, 2013; Szalai et al., 2019, 2021). Figure 6 shows the possible fluxes at the epoch of the JWST observations for either scenario. We assume a flux in the range 10–18 Jy as reasonable, which is consistent with the F560W MIRI observations. Given the limited constraints we have on this warm dust, we add a 1000 K graphite component to both models.
In addition to the warm component in SN 2004et, we see an additional rise in the F2550W data point above the expected dust model fit. We attribute this flux to the presence of yet another dust component, this time much colder. Such a cold dust component is not unexpected, given that the majority of dust is expected to cool to temperatures K, as it did in SN 1987A (Matsuura et al., 2011). Again, given the lack of data, we have few constraints. However, we vary the mass and temperature of this additional component and show that significant quantities of dust may be present at these longer wavelengths.
4 Discussion
4.1 Dust Mass Lower Limits
It is worth repeating that the dust masses reported here are lower limits. We cannot account for dust hidden by high optical depths or cold dust emitting at wavelengths 25 µm. Even when taking into account these lower limits, the dust mass observed in SN 2004et is still the second-largest measured dust mass based on mid-IR observations reported in any extragalactic SN to date. And aside from SN 1987A, the detections of dust in both SNe also correspond to the latest detections thus far of dust in any extragalactic SNe.
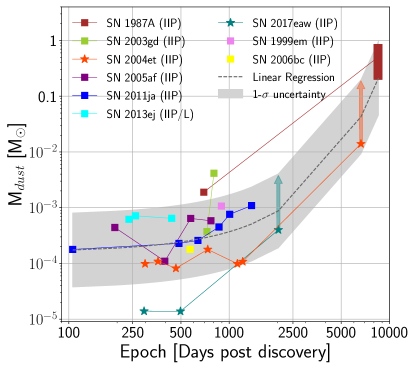
It is tempting to conclude an apparent trend of increasing dust mass with time in Figure 7, but two important caveats should be noted. First, the dust origin and even heating mechanism is not straight-forward. Section 4.2 explores the different possibilities. Second, the dust masses derived in previous studies are not consistent. The datasets range in mid-IR wavelength coverage and sensitivity, and the analysis techniques vary in scope, particularly how they report the best-fitting parameters versus the lower limits derived from the confidence intervals. Previous SEDs should be remodeled with a single, consistent procedure, but that work is beyond the scope of this paper.
4.2 Dust Origin and Heating Mechanisms
The origin and intensity of the IR emission depend on the source that heats the dust, and the geometry of the dust distribution. As noted in Section 3.1, the dust may be pre-existing in the unshocked CSM, or newly formed either in the ejecta or in the swept up shell of gas behind the SN blastwave. Assuming the distribution to be isotropic, we can impart necessary constraints on the geometry that are consistent with the physical scenarios introduced in Section 3.1. Assuming the dust to be confined within a dusty sphere, the blackbody radius, given by Equation 5, provides the smallest possible radius of the observed dust. For SN 2004et and SN 2017eaw, Equation 5 yields a blackbody radius of cm and cm, respectively.
The dust formation zone within the metal-rich ejecta is expected to be confined within 5000 km s-1 (Truelove & McKee, 1999; Maguire et al., 2012; Sarangi, 2022), which is consistent with the velocity profile in Figure 2. These velocities correspond to a radius of cm and cm for SN 2004et and SN 2017eaw, respectively. The ejecta radii are much larger than the blackbody radii; hence, the metal-rich ejecta is a completely acceptable site for dust that is responsible for the IR emission.
In the case of SN 2004et, Kotak et al. (2009) and Fabbri et al. (2011) have already done a detailed analysis on earlier optical and IR data that show increasing extinction over time that is consistent with new dust formation in the ejecta within the first 1000 days. Along these same lines, the optical spectra in Figure 2 show blueshifted H lines that are also consistent with dust present in the ejecta, that can preferentially absorb emission from the receding shock on the far side of the SN (Niculescu-Duvaz et al., 2022). In a spherical geometry, pre-existing dust, which is present beyond the blastwave radius cannot lead to this blueshift in emission lines; therefore, we argue that the dust responsible for the IR emission is most likely newly formed.
In SNe IIP, which are characterized by red supergiant type pre-explosion mass-loss (typically of the order of 10-6 M⊙yr-1), the swept up mass of gas by the SN blastwave in its first couple of decade after explosion should not exceed 0.1 M⊙. This circumstellar gas is typically H-rich, with refractory elements only amounting to about 1%. The CSM gas behind the shock is not likely to be the site that can produce the relatively large dust masses given in Table 2 and 3.
Based on the these arguments, the geometry favors the dust to be present in the ejecta. However, the time frame of the dust formation within the ejecta remains unclear. With only a limited number of data points, it is not possible to differentiate between a steady, continuous formation (e.g. Wesson & Bevan, 2021), and a relatively rapid formation followed by years of increasing optical depth as the ejecta expand (Dwek et al., 2019). Higher cadence observations of future dust-forming SNe should be able to disentangle the two models.
To help constrain the scenario in either case, we must also identify the heating mechanism. In the first couple of years after the explosion, newly formed dust in the ejecta is understood to be heated by the diffuse energy deposited in the ejecta, owing to the decay of radioactive 56Co. After 1500 days, the radioactive energy is dominated by the decay of 44Ti and possibly 57Co and 60Co; however, their total luminosity is expected to not exceed L⊙ (Seitenzahl et al., 2014). In this study, we find that the mid-IR fluxes of SN 2004et and SN 2017eaw correspond to the total luminosity of L⊙ and L⊙, respectively. Therefore, there must be some additional source of energy that is heating the dust.
| SN | a | RBB | Rshock | LIR | Lopt |
|---|---|---|---|---|---|
| [M⊙] | [cm] | [cm] | [L⊙] | [L⊙] | |
| SN 2004et (C) | 0.033 | 5.4 | 2.8 | 2.2 | 1.4 |
| SN 2004et (Sil) | 0.014 | 5.4 | 2.8 | 2.2 | 1.4 |
| SN 2017eaw (Sil) | 410-4 | 1.6 | 7.8 | 3.2 | 1.3 |
-
•
a With 90% confidence using lmfit.conf_interval.
One source of heating is radiative emission from shock interaction. At sufficiently late times, interaction with a steady-state wind will always win against the exponential decline of radioactive decay power. Simulations by Dessart & Hillier (2022) finds that a wind mass-loss rate of even M⊙ yr-1 generates a constant shock power of about erg s-1 in a standard SN II. A fraction of that power will come out as X-rays. The thermalized part of this power will emerge primarily in the UV, especially in Ly 1215.67 Å and Mg ii 2800 Å, while a few percent of that thermalized flux emerges in the optical as a weak continuum source together with emission lines, in particular H.
We know that both SNe 2004et and 2017eaw are undergoing late-time CSM interaction. Figure 2 plots the most recent optical spectra. The integrated flux for the late-time optical spectra of SNe 2004et and 2017eaw corresponds to only about L⊙ (Figure 4). The observed optical luminosity is not sufficient to heat the dust, but it does not represent the total luminosity produced by the shock-CSM interaction. Dessart & Hillier (2022) shows that the shock power introduced at the interface between ejecta and CSM emerges primarily in the UV, channeled primarily into Ly, for which we have no observational coverage, even in the archival HST/WFC3 UVIS data. These models suggest that the observed optical luminosities ( L⊙) could be compatible with a UV flux of L⊙, which is more than sufficient to heat the dust to the observed temperature and luminosity.
To summarize, we propose that the most plausible scenario is that the dust is present in the ejecta, and is being heated by the interaction between the SN forward shock and the ambient CSM. Since the heating source of the dust (that is, the forward shock) is external to the ejecta dust in a spherical geometry, it is not possible to find the exact radius of the dusty sphere despite knowing the dust temperatures, as the laws of electrodynamics state that the field strength is uniform inside a sphere. The percentage of the forward shock luminosity incident on the ejecta dust depends on the ratio of velocities between the outer radius of the metal-rich ejecta and the forward shock. Owing to the very large absorption coefficient of both amorphous carbon and silicates in the UV bands (Sarangi, 2022), the lower limit of the dust mass (derived in this study) is sufficient to completely absorb the incident radiation from the forward shock (can be verified by Equation 3). On the contrary, the optical depths are much lower in the mid-IR bands, where we probe the SNe with JWST. Therefore, we can expect that all the absorbed radiation will be reprocessed and radiated back in the IR. For SN 2004et, using the IR luminosity of L⊙ and a dust temperature of K, if we assume equilibrium of absorption and emission (Temim & Dwek, 2013; Sarangi, 2022), the approximate forward shock velocity can be calculated to be km s-1. Comparing the IR luminosity to the forward shock luminosity (which is expected to be at least 1040 ergs s-1, suggested by Dessart & Hillier 2022), the velocity of the dusty ejecta can be found estimated as km s-1, which matches well with the location of carbon-dust formation (Sarangi, 2022).
Interestingly, we find that the total IR luminosity of SN 2004et is higher than the luminosity of SN 2017eaw, even though the latter is younger and is expected to have a stronger forward shock luminosity. This may indicate that the younger SN 2017eaw, being more compact, is optically thick in the mid-IR, as some theoretical studies suggest (Dwek et al., 2019; Sarangi, 2022). On the other hand, it may also indicate that the silicate-rich dust in the ejecta of SN 2017eaw is expanding at a smaller velocity (compared to carbon dust in SN 2004et), so a smaller fraction of the forward shock luminosity is absorbed here. This is again in agreement with theoretical models, which predict that silicate dust is formed in the inner regions (hence smaller velocity) of the metal-rich ejecta (Sarangi et al., 2018).
We did not factor the impact of clumpiness of the ejecta in our analysis. The optical depths are expected to be lower in the case of clumpy ejecta (Inoue et al., 2020). Therefore, the lower limit on the dust mass that we estimated from an optically thin scenario in this study remains completely valid. The escape probabilities of the UV photons, and therefore the heating rates, might alter when clumpiness is taken into account. We intend to address the impact of clumpiness in a future study, when more data are available to constrain our results.
Other possible scenarios exist for the heating of the dust. For example, the majority of the flux may actually come out in X-rays at late times. The reverse shock may have traveled sufficiently far back into the ejecta to be heating them directly (i.e., not radiatively). The optical depth is quite high, thereby absorbing 99% of the optical flux. Or there may be a pulsar at the center. Each of these scenarios requires additional observations and more complex models, all of which are beyond the scope of this paper.
5 Conclusion
In this article, we present JWST MIRI observations of SNe 2004et and 2017eaw at roughly 18 yr and 5 yr post-explosion, respectively. The mid-IR imaging unveils reservoirs of warm dust totaling and M⊙, respectively. When compared to other mid-IR observations of dust in SNe, these are some of the latest detections and highlight the sensitivity of JWST. Aside from SN 1987A, SN 2004et has the largest mid-IR inferred dust mass of any extragalactic SN to date. The results extend the empirical trend of an increaing dust mass in SNe IIP at late times. Even at day , the dust in SN 2004et is still opaque (), allowing for the possibility that even more dust could be detected as the ejecta continue to expand. This trend suggests that we may be able to detect M⊙ of dust in extragalactic SNe at days, which would be sufficient to account for dust in the early universe (Dwek et al., 2007) if it can survive the reverse shock and injection back into the Universe (Slavin et al., 2020).
There are several caveats. First, eight filters do not offer significant constraints. For instance, the overall fit has a range of possible models (reflected in the confidence intervals in Tables 2 and 3). The lower limit on the dust from our confidence intervals is probably a bit lower than it needs to be. The MIRI Medium Resolution Spectrograph (MRS) would help tighten these constraints and perhaps even differentiate between optically thin and thick dust models. Along these same lines, MIRI is only mostly sensitive to the warm dust. There appear to be both hotter and colder components contributing at shorter and longer wavelengths. Regardless of the confidence intervals, the dust masses reported here should therefore be considered only as lower limits. While near-IR instruments can provide shorter-wavelength data, no instruments offer longer-wavelength data. MRS, again, can offer useful constraints of the colder dust component at the longest wavelengths by providing the shape of the long-wavelength curve. Also, optical data are needed to examine the interaction of the shock with the circumstellar dust and gas.
The blackbody radius provides only a minimum dust radius, and we rely on this as one of our arguments for the dust originating in the ejecta. Of course, the dust shell may be much larger, asymmetric, or clumpy. Detailed radiative-transfer modeling beyond the scope of this work must take into account these possibilities to provide consistency between the dust temperature, geometry, and heating mechanism. The heating mechanism is another unknown; in our case, the optical luminosity is insufficient to power the dust to the observed luminosity. We assume a UV component from theoretical models, but these models are untested. No SN IIP has ever been observed at Ly at late times. HST spectroscopy at these wavelengths could confirm the heating mechanism. If Ly emission is not present, other possibilities must be explored, as discussed in the text.
Finally, the observed empirical trend implies significant dust growth over decades, but this trend only corresponds to the inferred dust growth. The actual dust growth may have happened at early times, with progressively more dust visible as the ejecta expand and become increasingly optically thin. Testing dust formation and evolution scenarios requires continued monitoring at multiple wavelengths. In other words, more observations are required to explore this new, exciting field of dusty SNe in the era of JWST.
Acknowledgements
This work is based on observations made with the NASA/ESA/CSA James Webb Space Telescope. The data were obtained from the Mikulski Archive for Space Telescopes at the Space Telescope Science Institute, which is operated by the Association of Universities for Research in Astronomy, Inc., under NASA contract NAS 5-03127 for JWST. These observations are associated with program #2666. Some of the data presented herein were obtained at the W. M. Keck Observatory, which is operated as a scientific partnership among the California Institute of Technology, the University of California, and NASA; the observatory was made possible by the generous financial support of the W. M. Keck Foundation. A major upgrade of the Kast spectrograph on the Shane 3 m telescope at Lick Observatory, led by Brad Holden, was made possible through generous gifts from the Heising-Simons Foundation, William and Marina Kast, and the University of California Observatories. Research at Lick Observatory is partially supported by a generous gift from Google. A.V.F.’s supernova group at U.C. Berkeley is grateful for financial assistance from the Christopher R. Redlich Fund and many individual donors. T.S. has been supported by the János Bolyai Research Scholarship of the Hungarian Academy of Sciences, as well as by the FK134432 grant of the National Research, Development and Innovation (NRDI) Office of Hungary and the ÚNKP 22-5 New National Excellence Programs of the Ministry for Culture and Innovation from the source of the NRDI Fund, Hungary.
Data Availability
References
- Anand et al. (2018) Anand G. S., Rizzi L., Tully R. B., 2018, AJ, 156, 105
- Andrews et al. (2010) Andrews J. E., et al., 2010, ApJ, 715, 541
- Andrews et al. (2011) Andrews J. E., et al., 2011, AJ, 142, 45
- Arendt et al. (2014) Arendt R. G., Dwek E., Kober G., Rho J., Hwang U., 2014, ApJ, 786, 55
- Argo et al. (2017) Argo M., Torres M. P., Beswick R., Wrigley N., 2017, The Astronomer’s Telegram, 10472, 1
- Beasor et al. (2020) Beasor E. R., Davies B., Smith N., van Loon J. T., Gehrz R. D., Figer D. F., 2020, MNRAS, 492, 5994
- Beswick et al. (2004) Beswick R. J., Muxlow T. W. B., Argo M. K., Pedlar A., Marcaide J. M., 2004, IAU Circ., 8435, 3
- Bevan & Barlow (2016) Bevan A., Barlow M. J., 2016, MNRAS, 456, 1269
- Bevan et al. (2017) Bevan A., Barlow M. J., Milisavljevic D., 2017, MNRAS, 465, 4044
- Bevan et al. (2019) Bevan A., et al., 2019, MNRAS, 485, 5192
- Bouchet et al. (2015) Bouchet P., et al., 2015, PASP, 127, 612
- Bright & JWST/MIRI Team (2016) Bright S. N., JWST/MIRI Team 2016, in American Astronomical Society Meeting Abstracts #227. p. 147.15
- Bushouse et al. (2022) Bushouse H., et al., 2022, JWST Calibration Pipeline, doi:10.5281/zenodo.7229890, https://doi.org/10.5281/zenodo.7229890
- Buta & Keel (2019) Buta R. J., Keel W. C., 2019, MNRAS, 487, 832
- Cernuschi & Codina (1967) Cernuschi F., Codina S., 1967, AJ, 72, 788
- Cherchneff & Dwek (2009) Cherchneff I., Dwek E., 2009, ApJ, 703, 642
- Chevalier et al. (2006) Chevalier R. A., Fransson C., Nymark T. K., 2006, ApJ, 641, 1029
- Clayton & Nittler (2004) Clayton D. D., Nittler L. R., 2004, ARA&A, 42, 39
- Cox & Mathews (1969) Cox D. P., Mathews W. G., 1969, ApJ, 155, 859
- Crockett et al. (2011) Crockett R. M., Smartt S. J., Pastorello A., Eldridge J. J., Stephens A. W., Maund J. R., Mattila S., 2011, MNRAS, 410, 2767
- De Looze et al. (2017) De Looze I., Barlow M. J., Swinyard B. M., Rho J., Gomez H. L., Matsuura M., Wesson R., 2017, MNRAS, 465, 3309
- De et al. (2020) De K., et al., 2020, PASP, 132, 025001
- Dessart & Hillier (2022) Dessart L., Hillier D. J., 2022, A&A, 660, L9
- Dessart et al. (2023) Dessart L., Gutierrez C. P., Kuncarayakti H., Fox O. D., Filippenko A. V., 2023, arXiv e-prints, p. arXiv:2301.09089
- Dong & Stanek (2017) Dong S., Stanek K. Z., 2017, The Astronomer’s Telegram, 10372, 1
- Draine & Li (2007) Draine B. T., Li A., 2007, ApJ, 657, 810
- Dwek & Arendt (2020) Dwek E., Arendt R. G., 2020, ApJ, 901, 36
- Dwek et al. (2007) Dwek E., Galliano F., Jones A. P., 2007, ApJ, 662, 927
- Dwek et al. (2019) Dwek E., Sarangi A., Arendt R. G., 2019, ApJ, 871, L33
- Ercolano et al. (2007) Ercolano B., Barlow M. J., Sugerman B. E. K., 2007, MNRAS, 375, 753
- Fabbri et al. (2011) Fabbri J., et al., 2011, MNRAS, 418, 1285
- Fazio et al. (2004) Fazio G. G., et al., 2004, ApJS, 154, 10
- Filippenko (1982) Filippenko A. V., 1982, PASP, 94, 715
- Fox et al. (2010) Fox O. D., Chevalier R. A., Dwek E., Skrutskie M. F., Sugerman B. E. K., Leisenring J. M., 2010, ApJ, 725, 1768
- Fox et al. (2011) Fox O. D., et al., 2011, ApJ, 741, 7
- Fox et al. (2013) Fox O. D., Filippenko A. V., Skrutskie M. F., Silverman J. M., Ganeshalingam M., Cenko S. B., Clubb K. I., 2013, AJ, 146, 2
- Gall et al. (2011) Gall C., Hjorth J., Andersen A. C., 2011, A&ARv, 19, 43
- Gall et al. (2014) Gall C., et al., 2014, Nature, 511, 326
- Gerardy et al. (2002) Gerardy C. L., Fesen R. A., Nomoto K., Maeda K., Hoflich P., Wheeler J. C., 2002, PASJ, 54, 905
- Greenfield & Miller (2016) Greenfield P., Miller T., 2016, Astronomy and Computing, 16, 41
- Grefensetette et al. (2017) Grefensetette B., Harrison F., Brightman M., 2017, The Astronomer’s Telegram, 10427, 1
- Hosseinzadeh et al. (2022) Hosseinzadeh G., et al., 2022, arXiv e-prints, p. arXiv:2210.06499
- Hoyle & Wickramasinghe (1970) Hoyle F., Wickramasinghe N. C., 1970, Nature, 226, 62
- Indebetouw et al. (2014) Indebetouw R., et al., 2014, ApJ, 782, L2
- Inoue et al. (2020) Inoue A. K., Hashimoto T., Chihara H., Koike C., 2020, MNRAS, 495, 1577
- Jencson et al. (2019) Jencson J. E., et al., 2019, ApJ, 886, 40
- Jerkstrand et al. (2012) Jerkstrand A., Fransson C., Maguire K., Smartt S., Ergon M., Spyromilio J., 2012, A&A, 546, A28
- Johnson et al. (2018) Johnson S. A., Kochanek C. S., Adams S. M., 2018, MNRAS, 480, 1696
- Kasliwal et al. (2017) Kasliwal M. M., et al., 2017, ApJ, 839, 88
- Kilpatrick & Foley (2018) Kilpatrick C. D., Foley R. J., 2018, MNRAS, 481, 2536
- Kong & Li (2017) Kong A. K. H., Li K. L., 2017, The Astronomer’s Telegram, 10380, 1
- Kotak et al. (2009) Kotak R., et al., 2009, ApJ, 704, 306
- Kozasa et al. (1989) Kozasa T., Hasegawa H., Nomoto K., 1989, ApJ, 344, 325
- Lang (2014) Lang D., 2014, AJ, 147, 108
- Li et al. (2005) Li W., Van Dyk S. D., Filippenko A. V., Cuillandre J.-C., 2005, PASP, 117, 121
- Maguire et al. (2010) Maguire K., et al., 2010, MNRAS, 404, 981
- Maguire et al. (2012) Maguire K., et al., 2012, MNRAS, 420, 3451
- Mainzer et al. (2014) Mainzer A., et al., 2014, ApJ, 792, 30
- Maiolino et al. (2004) Maiolino R., Schneider R., Oliva E., Bianchi S., Ferrara A., Mannucci F., Pedani M., Sogorb M. R., 2004, Nature, 431, 533
- Martí-Vidal et al. (2007) Martí-Vidal I., et al., 2007, A&A, 470, 1071
- Martinez & Bersten (2019) Martinez L., Bersten M. C., 2019, A&A, 629, A124
- Matsuura et al. (2011) Matsuura M., et al., 2011, Science, 333, 1258
- Meikle et al. (2007) Meikle W. P. S., et al., 2007, ApJ, 665, 608
- Meikle et al. (2011) Meikle W. P. S., et al., 2011, ApJ, 732, 109
- Meisner et al. (2018) Meisner A. M., Lang D. A., Schlegel D. J., 2018, Research Notes of the American Astronomical Society, 2, 202
- Misra et al. (2007) Misra K., Pooley D., Chandra P., Bhattacharya D., Ray A. K., Sagar R., Lewin W. H. G., 2007, MNRAS, 381, 280
- Morozova et al. (2018) Morozova V., Piro A. L., Valenti S., 2018, ApJ, 858, 15
- Nagy et al. (2014) Nagy A. P., Ordasi A., Vinkó J., Wheeler J. C., 2014, A&A, 571, A77
- Nayana & Chandra (2017) Nayana A. J., Chandra P., 2017, The Astronomer’s Telegram, 10534, 1
- Niculescu-Duvaz et al. (2022) Niculescu-Duvaz M., et al., 2022, MNRAS, 515, 4302
- Nozawa et al. (2003) Nozawa T., Kozasa T., Umeda H., Maeda K., Nomoto K., 2003, ApJ, 598, 785
- Nozawa et al. (2008) Nozawa T., et al., 2008, ApJ, 684, 1343
- Oke & Gunn (1983) Oke J. B., Gunn J. E., 1983, ApJ, 266, 713
- Oke et al. (1995) Oke J. B., et al., 1995, PASP, 107, 375
- Osterbrock & Ferland (2006) Osterbrock D. E., Ferland G. J., 2006, Astrophysics of gaseous nebulae and active galactic nuclei
- Owen & Barlow (2015) Owen P. J., Barlow M. J., 2015, ApJ, 801, 141
- Perley (2019) Perley D. A., 2019, PASP, 131, 084503
- Perrin et al. (2014) Perrin M. D., Sivaramakrishnan A., Lajoie C.-P., Elliott E., Pueyo L., Ravindranath S., Albert L., 2014, in Oschmann Jacobus M. J., Clampin M., Fazio G. G., MacEwen H. A., eds, Society of Photo-Optical Instrumentation Engineers (SPIE) Conference Series Vol. 9143, Space Telescopes and Instrumentation 2014: Optical, Infrared, and Millimeter Wave. p. 91433X, doi:10.1117/12.2056689
- Pozzo et al. (2004) Pozzo M., Meikle W. P. S., Fassia A., Geballe T., Lundqvist P., Chugai N. N., Sollerman J., 2004, MNRAS, 352, 457
- Priestley et al. (2020) Priestley F. D., Barlow M. J., De Looze I., Chawner H., 2020, MNRAS, 491, 6020
- Ressler et al. (2015) Ressler M. E., et al., 2015, PASP, 127, 675
- Rho et al. (2007) Rho J., Jarrett T. H., Chugai N. N., Chevalier R. A., 2007, ApJ, 666, 1108
- Rho et al. (2018) Rho J., Geballe T. R., Banerjee D. P. K., Dessart L., Evans A., Joshi V., 2018, ApJ, 864, L20
- Ricks & Dwarkadas (2019) Ricks W., Dwarkadas V. V., 2019, ApJ, 880, 59
- Rieke & Wright (2022) Rieke G., Wright G., 2022, Nature Astronomy, 6, 891
- Rieke et al. (2015) Rieke G. H., et al., 2015, PASP, 127, 584
- Rizzo Smith et al. (2022) Rizzo Smith M., Kochanek C. S., Neustadt J. M. M., 2022, arXiv e-prints, p. arXiv:2212.09763
- Rui et al. (2019) Rui L., et al., 2019, MNRAS, 485, 1990
- Sahu et al. (2006) Sahu D. K., Anupama G. C., Srividya S., Muneer S., 2006, MNRAS, 372, 1315
- Sarangi (2022) Sarangi A., 2022, A&A, 668, A57
- Sarangi & Cherchneff (2013) Sarangi A., Cherchneff I., 2013, ApJ, 776, 107
- Sarangi & Cherchneff (2015) Sarangi A., Cherchneff I., 2015, A&A, 575, A95
- Sarangi et al. (2018) Sarangi A., Matsuura M., Micelotta E. R., 2018, Space Sci. Rev., 214, 63
- Schneider et al. (2004) Schneider R., Ferrara A., Salvaterra R., 2004, MNRAS, 351, 1379
- Seitenzahl et al. (2014) Seitenzahl I. R., Timmes F. X., Magkotsios G., 2014, ApJ, 792, 10
- Silverman et al. (2012) Silverman J. M., et al., 2012, MNRAS, 425, 1789
- Slavin et al. (2020) Slavin J. D., Dwek E., Mac Low M.-M., Hill A. S., 2020, ApJ, 902, 135
- Sluder et al. (2018) Sluder A., Milosavljević M., Montgomery M. H., 2018, MNRAS, 480, 5580
- Smith et al. (2008) Smith N., Foley R. J., Filippenko A. V., 2008, ApJ, 680, 568
- Stockdale et al. (2004) Stockdale C. J., Weiler K. W., van Dyk S. D., Sramek R. A., Panagia N., Marcaide J. M., 2004, IAU Circ., 8415, 1
- Sugerman et al. (2006) Sugerman B. E. K., et al., 2006, Science, 313, 196
- Szalai et al. (2011) Szalai T., Vinkó J., Balog Z., Gáspár A., Block M., Kiss L. L., 2011, A&A, 527, A61
- Szalai et al. (2019) Szalai T., et al., 2019, ApJ, 876, 19
- Szalai et al. (2021) Szalai T., et al., 2021, ApJ, 919, 17
- Temim & Dwek (2013) Temim T., Dwek E., 2013, ApJ, 774, 8
- Temim et al. (2017) Temim T., Dwek E., Arendt R. G., Borkowski K. J., Reynolds S. P., Slane P., Gelfand J. D., Raymond J. C., 2017, ApJ, 836, 129
- Tikhonov (2014) Tikhonov N. A., 2014, Astronomy Letters, 40, 537
- Tinyanont et al. (2016) Tinyanont S., et al., 2016, ApJ, 833, 231
- Tinyanont et al. (2019) Tinyanont S., et al., 2019, ApJ, 873, 127
- Todini & Ferrara (2001) Todini P., Ferrara A., 2001, MNRAS, 325, 726
- Tody (1986) Tody D., 1986, in Crawford D. L., ed., Society of Photo-Optical Instrumentation Engineers (SPIE) Conference Series Vol. 627, Instrumentation in astronomy VI. p. 733, doi:10.1117/12.968154
- Truelove & McKee (1999) Truelove J. K., McKee C. F., 1999, ApJS, 120, 299
- Tsvetkov et al. (2018) Tsvetkov D. Y., et al., 2018, Astronomy Letters, 44, 315
- Utrobin & Chugai (2009) Utrobin V. P., Chugai N. N., 2009, A&A, 506, 829
- Van Dyk et al. (2019) Van Dyk S. D., et al., 2019, ApJ, 875, 136
- Weil et al. (2020) Weil K. E., Fesen R. A., Patnaude D. J., Milisavljevic D., 2020, ApJ, 900, 11
- Wesson & Bevan (2021) Wesson R., Bevan A., 2021, ApJ, 923, 148
- Wesson et al. (2015) Wesson R., Barlow M. J., Matsuura M., Ercolano B., 2015, MNRAS, 446, 2089
- Wiggins (2017) Wiggins P., 2017, Transient Name Server Discovery Report, 2017-548, 1
- Williams et al. (2018) Williams B. F., Hillis T. J., Murphy J. W., Gilbert K., Dalcanton J. J., Dolphin A. E., 2018, ApJ, 860, 39
- Wooden et al. (1993) Wooden D. H., Rank D. M., Bregman J. D., Witteborn F. C., Tielens A. G. G. M., Cohen M., Pinto P. A., Axelrod T. S., 1993, ApJS, 88, 477
- Wright et al. (2010) Wright E. L., et al., 2010, AJ, 140, 1868
- Zackay et al. (2016) Zackay B., Ofek E. O., Gal-Yam A., 2016, ApJ, 830, 27
- Zubko et al. (2004) Zubko V., Dwek E., Arendt R. G., 2004, ApJS, 152, 211
- Zwitter et al. (2004) Zwitter T., Munari U., Moretti S., 2004, Central Bureau Electronic Telegrams, 95, 1
- van Dyk et al. (2017) van Dyk S. D., Filippenko A. V., Fox O. D., Kelly P. L., Milisavljevic D., Smith N., 2017, The Astronomer’s Telegram, 10378, 1