Disc-halo gas outflows driven by stellar clusters as seen in multiwavelength tracers
Abstract
We consider the dynamics of and emission from growing superbubbles in a stratified interstellar gaseous disc driven by energy release from supernovae explosions in stellar clusters with masses . Supernovae are spread randomly within a sphere of pc, and inject energy episodically with a specific rate proportional to the star formation rate (SFR) in the cluster. Models are run for several values of SFR in the range to yr-1, with the corresponding average surface energy input rate erg cm-2 s-1. We find that the discrete energy injection by isolated SNe are more efficient in blowing superbubbles: asymptotically they reach heights of up to 3 to 16 kpc for , correspondingly, and stay filled with a hot and dilute plasma for at least 30 Myr. During this time they emit X-ray, H and dust infrared emission. X-ray liminosities that we derive here are consistent with observations in star-forming galaxies. Even though dust particles of small sizes m are sputtered in the interior of bubbles, larger grains still contribute considerably ensuring the bubble luminosity . It is shown that the origin of the North Polar Spur in the Milky Way can be connected with activity of a cluster with the stellar mass of and the yr-1 some 25–30 Myr ago. Extended luminous haloes observed in edge-on galaxies (NGC 891 as an example) can be maintained by disc spread stellar clusters of smaller masses .
keywords:
galaxies: halos – starburst – ISM: supernova remnants – shock waves – X-rays: galaxies – infrared: galaxies1 Introduction
The discovery and intensive study of absorptions from heavy elements (such as CIV, SiIV, NV, OVI) in the circumgalactic medium (CGM) in quasar absorption spectra (e. g. Prochaska et al., 2006; Simcoe et al., 2006; Prochaska et al., 2017), have posed stellar feedback as one of the most important physical factors that determines, along with gravity, the structure and evolution of galaxies. It has become clear that energy and mass exchange between interstellar discs and circumgalactic environment driven by energy release from massive stars and supernovae, is ubiquitous among galaxies. Even dwarf galaxies at the low end of SFR reveal extended metal polluted haloes around them (Burchett et al., 2015; Bordoloi et al., 2014). More recently, Keeney et al. (2017) reported about presence of such haloes around galaxies without currently ongoing star formation. This suggests a very efficient mass exchange between galactic discs where heavy elements are produced and their distant neighbourhood in the halo.
A common understanding is that the mass exchange between galaxies and their extragalactic environments is maintained by energy release from an enhanced SF that drives galactic winds. Galactic wind, a large scale gas outflow from star formation in galactic discs, is thought to be driven by energy injection from young stars and supernovae in starbursts events with a surface SFR exceeding a certain critical value. The threshold for galactic winds driven by central starbursts is estimated of erg cm-2 s-1 (Lehnert & Heckman, 1996a; Heckman, 2000), and for disc-halo circulation in edge-on galaxies erg cm-2 s-1 (Dahlem et al., 1995; Rossa et al., 2000; Dahlem et al., 2006). However, study of interrelations between the soft X-ray, UV, H, FIR and 1.4 GHz radio continuum emissions in a larger sample of 23 edge-on-galaxies led only to put a lower limit on the surface SN energy input rate erg cm-2 s-1 (Tüllmann et al., 2006).
From a theoretical point of view, the evaluation of the energy threshold is a challenge. It is obvious that this threshold depends on many factors: ambient gas density, its vertical stratification – characteristic scale heights and the circumgalactic floor density, concentration of energy sources both in space and time, dark matter distribution, energy injection regime and so forth (Rossa et al., 2000; Dahlem et al., 2001, 2006; Roy et al., 2013; Nath & Shchekinov, 2013; Vasiliev et al., 2015; Girichidis et al., 2016; Vasiliev et al., 2017; Yadav et al., 2017; Fielding et al., 2018; Vasiliev et al., 2019). Moreover, circulation of gas between different regions of a vertically stratified interstellar gas requires different characteristic energy input rates. From simulations the required energy rate for driving low Mach number superbubbles () confined to the lower halo layer (within 2–3 scale heights) is erg cm-2 s-1 (Vasiliev et al., 2017; Yadav et al., 2017; Fielding et al., 2018; Shchekinov, 2018; Vasiliev et al., 2019), whereas a transition of gas circulation to the outer halo layers, being comparable in size to the galactic radial scale, seems to occur under shocks with higher Mach numbers () requiring an order of magnitude larger energy rate erg cm-2 s-1 (Roy et al., 2013). Early observations of our Galaxy towards the central region in 408 GHz have revealed loop-like structures – Loop I amongst the most prominent (Hanbury Brown et al., 1960; Berkhuijsen et al., 1971; Haslam et al., 1983). More detailed analysis of the morphology of Loop I in 408 GHz and X-ray patterns from ROSAT led Sofue (1994) to conclude that Loop I is produced by a starburst in the Galactic center (radius of pc) with total energy of erg within nearly 15 Myr (the equivalent SFR yr-1). The corresponding surface energy input rate lies in the range erg cm-2 s-1 derived in (Nath & Shchekinov, 2013). A more recent numerical analysis has demonstrated that large scale structures similar to Loop I in our Galaxy might require even a higher energy input erg cm-2 s-1 (Sarkar et al., 2015).
The discovery of the Fermi-Bubbles (Dobler et al., 2010; Su et al., 2010) has revealed a deficit of the SFR in the Galactic center (GC) as compared to the value needed for their maintenance. It was found that the GC shows a modest level of star formation, which is not sufficient for providing the energetics of Loop I (Sofue, 1994). The estimates have been confirmed by more accurate evaluation from numerical simulations in Sarkar et al. (2015). Yusef-Zadeh et al. (2009) have inferred the history of SF rate in the GC (400 pc radius) from Spitzer and Midcourse Space Experiment and concluded that the SF rate during the latest history – the last 10 Myr, is only yr-1, while the SFR averaged over 10 Gyr is yr-1. The surface energy input rate is thus erg cm-2 s-1 during the last 10 Myr, and erg cm-2 s-1 over 10 Gyr. Even though this number looks consistent to the limits determined in Dahlem et al. (1995); Tüllmann et al. (2006) for galactic discs, and the early estimate by Heckman (2000) for galactic winds, numerical simulations raise the lower limit of the required energy input by factor of at least 3–5 (Sofue, 1994; Sarkar et al., 2015). The inconsistency between the estimated SFR and the very existence of the Fermi-bubbles may be attributed to observational difficulties of inferring star formation rate on long time scales caused by a crowded environment in the Central molecular zone (CMZ), that causes uncertainties in counting stars of different age, measurements of infrared, bremsstrahlung emissions and other indicators of star formation. More recent discussions (see, e.g. Barnes et al., 2017; Federrath et al., 2016; Krumholz & Kruijssen, 2015; Krumholz et al., 2016; Kruijssen, 2017) suggest that a short-term episodic regime of star formation with less pronounced observational manifestations can be possible.
A similar phenomenon, the existence of extended haloes in galaxies with a relatively weak SF rate in the underlying discs, is observed in several edge-on galaxies in the local Universe. The galaxy NGC 891 represents a good example with the SFR yr-1 across the disc (optical radius kpc) equivalent to erg cm-2 s-1, and at the same time with a halo extending up to kpc in dust IR emission (Howk & Savage, 1999; Alton et al., 2000; Rossa et al., 2004; Hughes et al., 2014; Seon et al., 2014; Bocchio et al., 2016; Yoon et al., 2021, see also a recently published catalog of dusty edge-on galaxies in Shinn (2018)), kpc in keV (Hodges-Kluck et al., 2018), to kpc in soft X-ray ( keV), and to kpc in HI (Oosterloo et al., 2007). Extended circumgalactic gas traced by CIV, SiIV and OVI ions at projected radii of the order of 100 to 200 kpc are observed around galaxies often with a rather modest SFR yr-1 (see discussion in Tumlinson et al., 2011; Bordoloi et al., 2014). Such extended haloes can either indicate that even a low SF rate under certain conditions is capable to drive circulation of gas within the inner and outer haloes as in the former case, or they are caused by powerful starbursts that have taken place in the past, e.g. 20–30 Myr ago, as in the latter.
In this paper we focus on the ability of SF in galactic stellar clusters with a low to modest SFR ( yr-1), and energy injection concentrated in a relatively small volume, to drive outflows between the disc and the halo, and on their observational manifestations in X-ray, optical and FIR tracers. In Sec. 2 we describe the model we use in simulations, Sec 3 presents the results: i) evolution of the bubble under the action of a cluster depending on its SFR in Sec 3.1, including also ii) destruction of dust particles in Sec 3.1.4, iii) the bubble emission characteristics – X-ray, dust far-infrared, and H, and their possible interrelations in Sec 3.2, in Sec 4 we consider possible implications of our results for the Milky Way and edge-on galaxies with a focus on NGC 891 among them, Sec 5 summarizes the results.
2 Model description
2.1 Equilibrium
We carry out 3-D hydrodynamic simulations (Cartesian geometry) of SN explosions inside a massive stellar cluster located in the galactic center. We study the dynamics of a bubble expanding preferentially perpendicular to the disc. We consider the bubble evolution during a period approximately twice as the lifetime of a least massive SN progenitor with , i.e. Myr. The gaseous disc is set up to be initially in hydrostatic equilibrium in the gravitational potential of the dark matter (DM) halo and the stellar disc (see e.g., de Avillez, 2000; Hill et al., 2012; Walch et al., 2015; Li, Bryan & Ostriker, 2017; Vasiliev et al., 2019). The -component of the gravitational acceleration due to the dark mater halo is calculated from a Navarro-Frenk-White profile with the virial radius of the halo equal to 200 kpc and concentration parameter .
2.2 Stellar disc
The stellar disc is assumed to be self-gravitating with an isothermal velocity dispersion. The acceleration perpendicular to the disc is , where and are the stellar surface density and the scale height of the stellar disc. We adopt /pc2 and kpc.
2.3 Gaseous disc
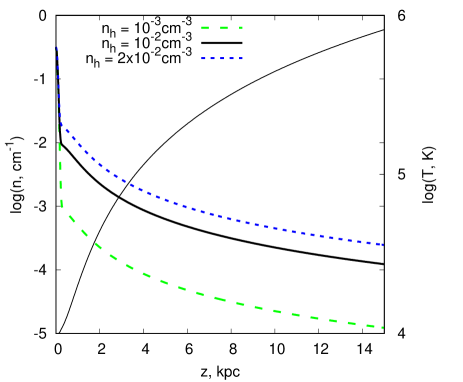
The gas density in the midplane is assumed cm-3 following (Kalberla & Kerp, 1994), which corresponds to gas surface density pc-2 with the scale height kpc at kpc. At larger heights above the midplane we assume a warm-hot gaseous halo with the profile , where cm-3, kpc as follows from the MW halo distribution in Miller & Bregman (2015). The temperature of the gaseous disc is set to K, the temperature of the halo increases with height to keep hydrostatic equilibrium. Figure 1 shows the initial gaseous density profiles in the vertical direction, with cm-3 as our fiducial value. The initial metallicity in disc is assumed to be solar, in the vertical direction the metallicity decreases to its floor value [Z/H] at heights larger than 1 kpc. This allows us to better trace propagation of metallicity from exploded SNe into the halo. Initially the heating rate in the unperturbed disc and halo is set equal to the cooling rate according to the initial values of temperature and metallicity.
2.4 Energy injection
The dominant energy source feeding growing superbubbles is explosions of SNe, with a minor contribution from stellar wind as demonstrated recently by Franeck et al. (2022). We inject the mass and energy by individual events with the energy corresponding to a joint energy of 30 standard SNe. Masses of standard SNe progenitors in a cluster are distributed randomly within 8–40 range according to the Salpeter initial mass function, the specific per mass SN rate is . Therefore, each joint injection carries the energy erg in thermal form and the mass load of 240-1200 . This allows us to consider larger computational cells and assumes the injection radius corresponding to the Sedov-Taylor solution to be smaller than the cooling length. The energy injection in form of thermal energy seems to be the most suitable in models with randomly spread in space and time point-like sources mimicing discrete SNe. As stressed above with the chosen cell size we avoid the overcooling problem discussed in Sharma et al. (2014). The interval between following energy injections corresponds in average to the lifetime of massive stars within 8–40 (see in Iben, 2012). The energy and mass are injected randomly into a cell located within a spherical region of radius 60 pc centered at . This procedure mimics random SNe explosions in a cluster. Overall, the energy injection rate in each of such clusters corresponds to explosions of standard SNe with the rate SN per year, or equivalently SFR yr-1, the corresponding stellar masses of clusters are in the high mass end of the clusters’ mass function (Krumholz et al., 2019). Note that SFR yr-1 within the energy injection volume of radius pc corresponds to the surface SN energy injection rate erg cm-2 s-1.
2.5 The code and simulations
The code is based on the unsplit total variation diminishing (TVD) approach that provides high-resolution capturing of shocks and prevents unphysical oscillations. We have implemented the Monotonic Upstream-Centered Scheme for Conservation Laws (MUSCL)-Hancock scheme and the Haarten-Lax-van Leer-Contact (HLLC) method (see e.g. Toro, 1999) as an approximate Riemann solver. This code has successfully passed the whole set of tests proposed in Klingenberg et al. (2007).
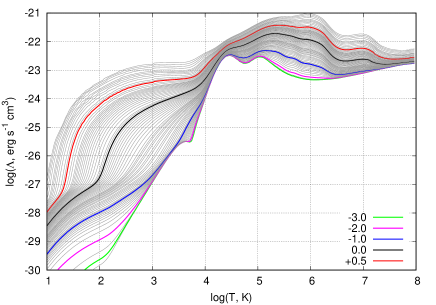
Simulations are run with a radiative cooling described by a set of tabulated non-equilibrium cooling functions calculated by using the approach described in detail (Vasiliev, 2013). The functions are obtained for the gas cooling isochorically from K down to 10 K for metallicities within the range [Z/H]. The non-equilibrium calculation (Vasiliev, 2011, 2013) includes kinetics of all ionization states of H, He, C, N, O, Ne, Mg, Si, Fe, as well as kinetics of molecular hydrogen at K. Fig. 18 in Appendix A presents this set of cooling functions.
We apply a diffuse heating term representing the photoelectric heating of dust grains (Bakes & Tielens, 1994), which is thought to be the dominant heating mechanism in the interstellar medium. In our simulations, the heating rate is assumed to be time-independent and exponentially decreasing in the vertical direction with the scale height of the ISM disc. Such an assumption allows to stabilize radiative cooling of ambient gas with the temperature profile shown in Fig. 1. Any deviation of the heating rate in the unperturbed gas violates the balance between cooling and heating and stimulates thermal instability, resulting in redistribution of gas mass in the interstellar disc (see e.g. in de Avillez, 2000; Hill et al., 2012). The heating rate exponentially decreasing upwards across the whole computational domain suppresses such contaminations (Li, Bryan & Ostriker, 2017).
The simulations are performed with a physical cell size of 20 pc. The standard computational domain contains cells, that corresponds to kpc3, but in several cases we extend the domain. We suppose a symmetry relative to the disc midplane and along the plane going through the cluster center perpendicular to the midplane, so we consider one fourth of the space. Usually we restrict our simulations within 35 Myr, in the end of this period the total vertical momentum of a bubble becomes negative. We complete simulation earlier if the bubble reaches the borders of the computational domain, even though the total vertical momentum remains highly positive.
3 Results
3.1 Bubble evolution
3.1.1 Gas
In our model the cluster size is comparable to the disc scale height, therefore, the collective bubble formed by SNe with the rate SN per year (SFR yr-1, yr-1 pc-3) considered here as an example, expands preferentially in the vertical direction, and during Myr reaches heights of kpc. When the shock wave approaches the interface between the disc and the halo at kpc (seen in Fig. 1) Rayleigh-Taylor instability breaks the shell and hot gas expands into halo with a larger scale height, resulting in a bottle-neck shaped bubble. At age Myr SNe explosions exhaust and the bubble continues expansion under momentum conservation.
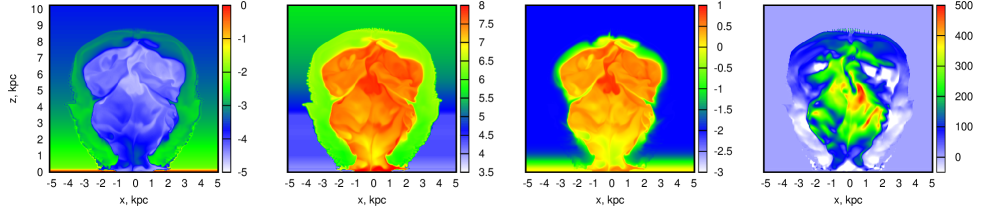
Figure 2 presents the hydrodynamical field in the outflow formed by the cluster at the age 25 Myr – left to right: gas density, temperature, metallicity, -component of velocity. The bubble reaches almost 9 kpc in height and about 8 kpc in its widest part. The bubble shell is still thick, around 1 kpc, and hot, K. Effects of radiative cooling are marginally observed in the lowermost region of the bubble edge in form of a small-scale density enhancement. The bubble interior is hotter than its shell – K, and will remain as hot further on for a characteristic cooling time Myr. The bubble is still expanding with velocity km s-1, and with positive velocities dominating almost in the entire bubble, except in the outer regions of the hot interior at heights kpc and the compressed shell below kpc.
3.1.2 Metals
Metals ejected by SNe partly mix with the ambient hot bubble gas resulting in the metallicity spread from [Z/H] to [Z/H]. It is worth to be pointed out that in our model mixing operates due to numerical diffusion cm2 s-1 in the shell with sound speed km s-1, and cm2 s-1 in the hot bubble with km s-1. This is consistent with the estimate of numerical kinematic viscosity corresponding to the increase of specific per mass thermal energy as if it was grown due to viscousity at shock fronts . Within Myr numerical diffusion can mix metallicity over pc which is half of the shell thickness. In the bubble interior mixing covers kpc in the same time range. In the thin external interface at the uppermost parts of the contact discontinuity it remains lower than [Z/H], indicating that mixing between the ejecta and ambient gas is slow. Inefficient mixing is one of the reasons that the shell still is hot, the cooling time in shell with [Z/H] is of the order 30–50 Myr. It is worth also noting that metals do not penetrate into the very external layer of the shell of kpc, being confined in a thinner layer kpc – it can be seen when comparing the distributions of metals and temperature/density on Fig. 2. It is also seen that in the lower (conical) parts of the shell metals remain locked in even a thinner layer of kpc because of a lower temperature and higher density in this domain. At the asymptotic (“inertial”) stage with exhausted SNe explosions shown in Fig. 2 metals are swept up from the superbubble centre, as can be observed in the central domain deficient in metals.
3.1.3 Overall dynamics
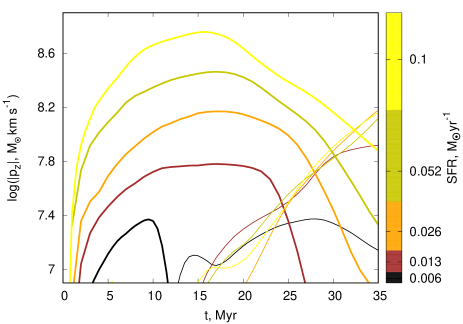
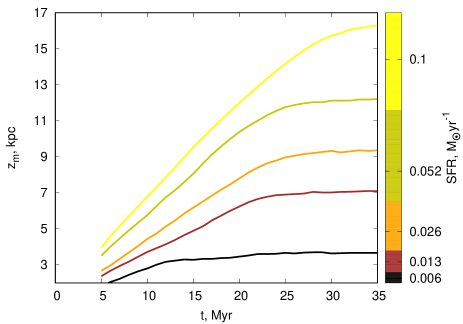
Long-term evolution of superbubbles can be illustrated by time-behavior of their vertical momentum shown in Fig. 3 for several bubble models. Typically fast growth of at very initial stages changes to a slow continuous gain on longer times Myr until reaching the maximum of . For lower SFR, except the lowest with the SFR yr-1, the maximum stays on a plateau for long times (up to 15 Myr for SFR yr-1). On the contrary, superbubbles from clusters with higher SFR pass the maximum phase faster. The maximum and following drop of are connected mostly with a decrease of the shell mass because of a downward slipping of cold gas fragments along the shell. This can be the result of an enhanced pressure under more energetic shock waves from clusters with higher SFR, that stimulate faster gas cooling and the corresponding depletion of the shell mass. This process limits the expansion of shells. The superbubble from the minimum SFR yr-1 is an exception of this trend: the shell with such a low SFR expands on average into a denser environment than it gains for larger superbubbles, and its gas cools faster than gains energy from feeding explosions. The expansion phase ends by freezing out of the shells (Fig.S 4), until they are disrupted by turbulence, by ongoing star formation nearby and/or galactic differential rotation. Depending on the SFR in the parent cluster it may take next tens of Myr as seen in Fig. 4.
The model with yr-1 seems to be close to the threshold SFR capable to drive the superbubles. Very rough estimates based on a comparison of the ram pressure from exploding SNe on the shell of radius , and the disc gravity , result in
| (1) |
for the disc parameters as in Sec. 2.2. Here is the mechanical luminosity of exploding SNe, , the shell velocity . The shell expansion velocity in the segments with predominantly vertical walls , , and estimated at . With these assumptions Eq. (1) is equivalent to the yr-1, or yr-1 for cm-3, kpc, and km s-1. It is important to stress though, that this conclusion is valid for star-formation localized in clusters with characteristic radius pc, immersed into ambient gas with the parameters close to those defined in Sec. 2.3.
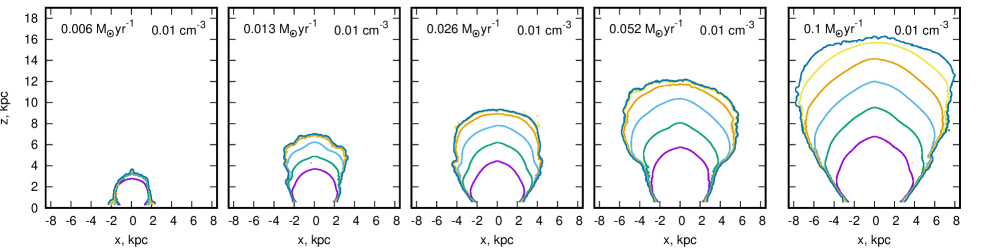
Figure 5 presents the outer borders (defined by the density jump) of the superbubbles evolving to this asymptotic: from left to right, we show the bubbles driven by clusters with SFR=0.006, 0.013, 0.026, 0.052 and 0.1 yr-1 at several epochs. Nearly equidistant contours during the first 20 Myr show that the bubbles grow uniformly, i.e. with a constant velocity. After this period the bubbles driven by SFR yr-1 start decelerating until their vertical expansion terminates by Myr; the corresponding energy injection rate erg cm-2 s-1. Bubbles of higher SF rates end their vertical expansion at later times. Radial expansion lasts several Myr shorter. The smallest superbubble in the first panel expands obviously slower as compared to those with a higher SFR. Moreover, so far as in this case a considerable fraction of the superbubble expands into on average denser medium, the effects of radiative cooling in the walls below , and the predominance of negative momentum from these regions, determine a fast decrease of the -momentum component on Fig. 3.
The superbubble collimation increases with the halo gas density, as seen on two panels of Fig. 6, because a higher density beyond the interface between the ISM disc and the halo suppresses the radial expansion.
3.1.4 Dust destruction
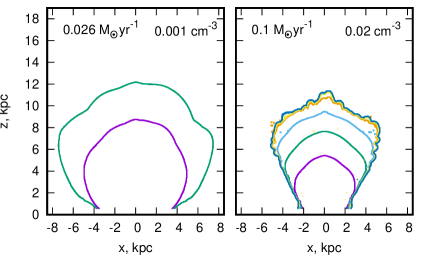
Collisions of heavy ions of energies eV with dust particles result in their sputtering (Burke, 1974; Draine, 1981; Dwek, 1981; Dwek & Arendt, 1992). The characteristic sputtering time in a given computational cell is approximated as yr ( K, see Eq. 25.14 in Draine, 2011). In a magnetic free medium a nonthermal sputtering proceeds during the motion of a dust particle relative to plasma in a thin layer immediately behind the shock front pc for the accepted parameters and thus can be neglected in our calculations. Thermal sputtering proceeds for the radiative cooling time yr unless local plasma is heated under the action of a shock from a distant SN. A rough estimate of time lags between two subsequent shocks impinging a given point in the bubble is varying from to yr depending on the SFR, here is the total SNR in the cluster center. Such a high impinging rate prevents gas cooling and provides a continuous maintenance of high temperature. In this environment a dust grain loses around 90% of its radius in , and hence in order to account dust destruction in a computational cell at a given stage the condition , with being the dynamical time, can be roughly accepted. Therefore, as this condition is met, dust particles with radius are removed from a given computational cell. Figure 7 presents the logarithm of the ratio within the superbubble at different times for a set of particle radii.
As readily seen, smaller particles are sputtered first. However, the contribution of small grains to the thermal emission can remain considerable, particularly at higher frequencies because dust temperature is normally higher for smaller particles. In order to estimate this effect we plot111We consider five bins of dust with radius 30, 100, 300, 1000 and 3000Å following to the “standard” Mathis-Rumple-Nordsieck (MRN) distribution (Mathis et al., 1977). a distribution of the ratio in the bubble over its evolution in Fig. 7. It is seen that during the whole evolution only small dust particles Å in the bubble shell are destroyed. In the low-density bubble interior the sputtering time is higher than Myr (Dwek & Arendt, 1992), such that even small particles partly survive. Accounting for the fact that the shell sweeps up mostly the halo gas with a low dust mass fraction, the effects of dust destruction to the IR emission is of minor importance.
Destruction of dust behind shock fronts is partly replenished by stellar activity via SNe factories (Todini & Ferrara, 2001; Bianchi & Schneider, 2007; Matsuura et al., 2011; Gall et al., 2014; Lau et al., 2015). We assume that besides the dust already present in the ISM gas, an additional dust mass is supplied into the bubble interior proportionally to the mass of ejected metals by SNe. Collisional heating (Burke, 1974; Draine, 1981; Dwek, 1981; Dwek & Arendt, 1992) and destruction (Draine & Salpeter, 1979; Tielens et al., 1994; Jones et al., 1994) of the ejected dust is also implemented into our calculations.
3.2 Bubble emission
3.2.1 X-rays
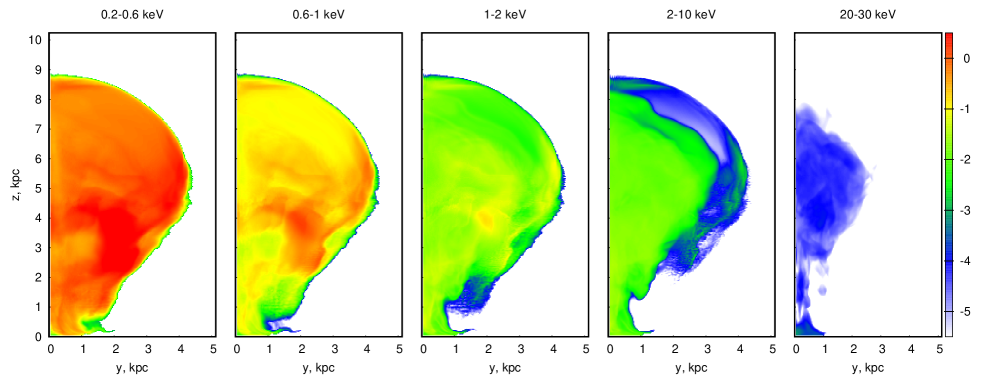
Although radiative losses are too weak to affect the dynamics of the bubble during its expansion, the hot plasma in the interior emits sufficient energy in far-UV and X-ray ranges to manifest observationally. Figure 8 presents the simulated X-ray emission (in log scale) of a bubble seen edge-on (-plane) at Myr, SFR=0.026 yr-1. As seen, X-ray surface intensity of the bubble in the low-energy bands (0.2–0.6 and 0.6–1.0 keV) is considerable ( keV s-1 cm-2 sr-1) and comparable to that observed by eROSITA in the Galactic bubbles (see below in Sec. 4.1), and an order of magnitude lower than the intensity of the diffuse X-ray emission in the halo of NGC 891 galaxy (Temple et al., 2005). It degrades slowly and stays approximately in the same range of intensity as shown in Fig. 8 within next Myr, even after 25 Myr when SNe explosions exhaust. In general, the intensity is more or less uniform throughout the bubble except several large-scale fluctuations in the highest energy bands close to the bubble border at heights kpc.
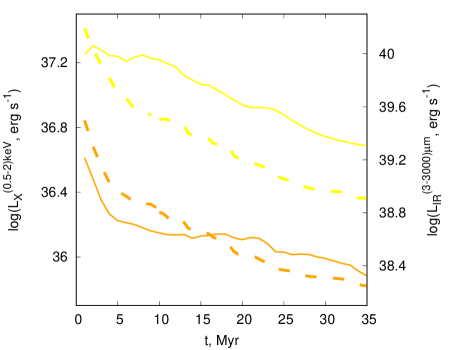
A slow cooling in the bubble interior keeps the gas hot and the total X-ray luminosity at a sufficiently high level. This is clearly seen in Fig. 9 where evolution of X-ray luminosity in the low energy band keV is shown. The luminosity in this band descreases gradually roughly as .
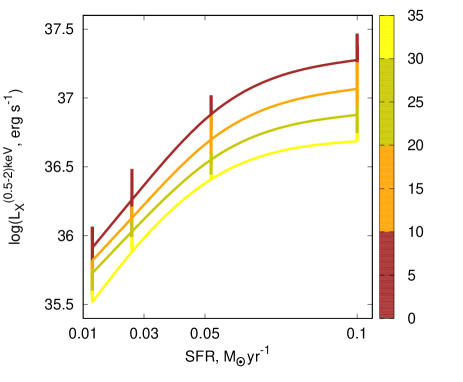
The total X-ray luminosity in the 0.5-2 keV band from the entire bubble increases for higher SFR approximately as for yr-1, and flattens to yr-1 at higher SFR (Fig. 10). The flatness may be caused by the fact that for bubbles with yr-1 a higher fraction of the hot interior expands adiabatically. The ‘-SFR’ dependence in Fig. 10 is consistent with the integrated ‘–SFR’ relation ( keV) for star-forming late-type edge-on galaxies (Tüllmann et al., 2006; Li, Bregman, Wang, et al., 2017).
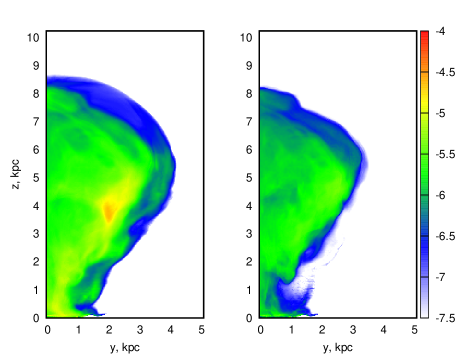
3.2.2 IR dust emission
In order to evaluate the influence of dust destruction on their spectrum we calculate the dust emissivity with and without (depending on their lifetime) small dust grains – we refer the latter “burnt” dust. The left panel in Fig. 11 presents the total IR flux (in log scale) produced by dust with sizes m as if it was not destroyed in the entire bubble for the same model and age depicted in Figs. 2 and 8. The flux of the dust emission in the right panel of Fig. 11 includes only grains with radii whose lifetime scale as shown in lowest row Fig. 7. In other words, in the bubble shell it mainly corresponds to the sum of contributions from dust particles m as shown in the lowest row of Fig. 7. One can see that the smallest grains (30Å) give a dim shell-like structure around a smooth bubble from larger grains at the level erg s-1 cm-2. Reduced FIR intensity in the shell on the right panel of Fig. 11 is obviously due to a deficient short wavelength emission from small-size particles. One can think that gas in the shells passed through hot and dense stages and destroyed small dust grains should manifest “colder” FIR spectra shifted towards longer wavelengths, in comparison with those regions with “normal” dust size content, as seen on the right panel in Fig. 11. It is worth noting that even though sputtering of larger particles partly replenishes particles of smaller size, it is insufficient to compensate for their loss: first, because the sputtering time scales with radius , and second, the number of larger particles is smaller, as for instance, in the case of spectrum. Larger grains survive longer, as illustrated in Appendix B.
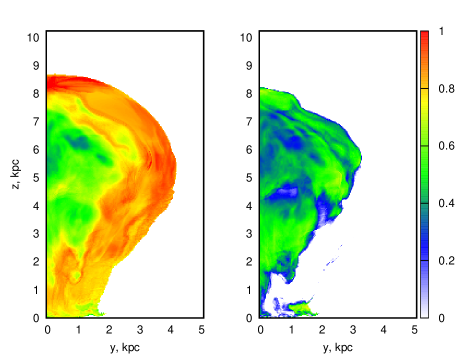
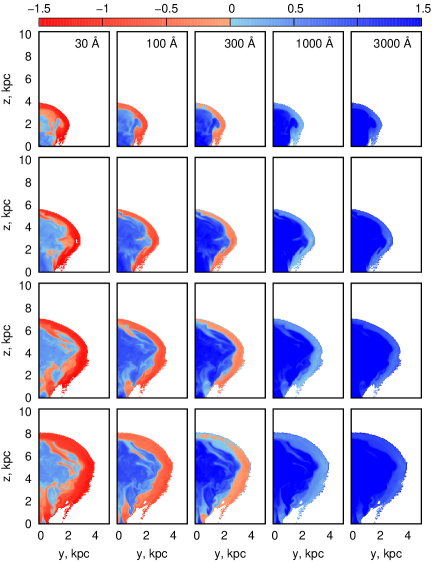
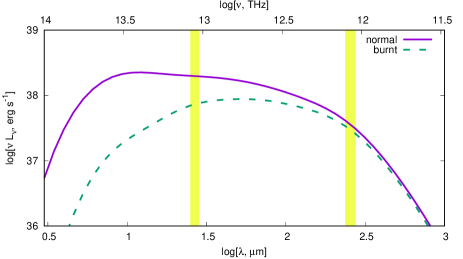
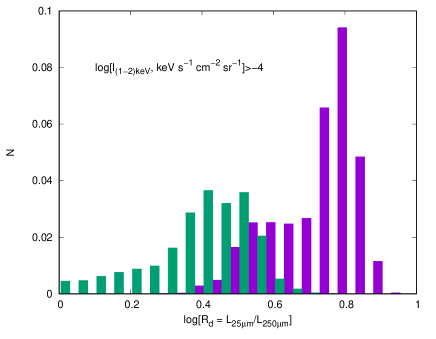
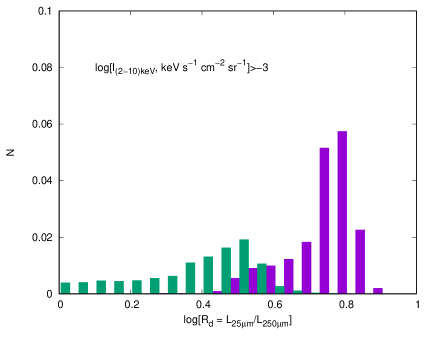
As mentioned above, smaller particles have higher temperature and can contribute predominantly in emission spectra at higher frequencies. The latter is because that even in steady-state conditions dust temperature varies nearly as ( is the dust spectral index), whereas in hot dilute plasma stochastic heating from electrons makes small dust grains even “hotter” than at steady-state conditions (Dwek, 1981, 1986): small dust particles experience higher magnitude of temperature fluctuations around a median value. At such circumstances, an ensemble of dust particles immersed in a hot environment show a thermal spectrum enhanced in the high frequency range. On the contrary, their deficit manifests a modified black-body spectrum with a monotonic 2nd derivative over frequency, as depicted by the dashed curve in Fig. 12. Observationally this difference can be obvisously recognized on “color” maps: the maps of the ratio – the ratio of intensities at the wavelengths marked in Fig. 12 by yellow bands at which the contribution of small dust into the IR spectrum is clearly distinct. These maps for “normal” and “burnt” dust are shown on the left and right panels in Fig. 13, corespondingly. The bubble with “burnt” dust is obviously seen to suffer of a deficit of emission at short wavelentgh as compared with the spectrum of an identical bubble with “normal” dust. The difference between the spectrum with a “burnt” and a “normal” dust can be also recognized in a correlation between the dust FIR color, the ratio and the X-ray intensity. This correlation can be seen in the distribution function of the color over the superbubble edge-on projection as shown in Fig. 14: the “burnt” dust lacking of small size grains does not show the excess of emission at shorter wavelengths m, and thus has a lower ratio , while the “normal” dust shows a higher ratio .
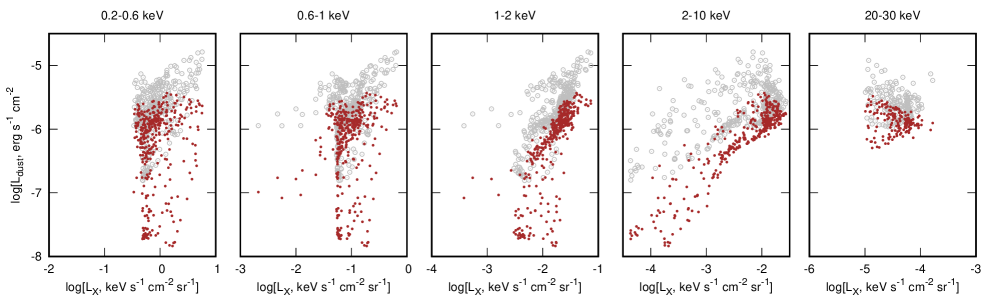
Scatter plots in Fig. 15 show the interrelation between the IR and X-ray surface intensities in different energy ranges for a bubble fed by SFR=0.026 yr-1. A remarkable difference between IR distributions of “normal” and “burnt” dust composition is that the former lies at high intensity end erg s-1 cm-2, whereas the latter tends to lower intensity due to a deficit of small grains (see discussion in Sec. 3.2.2). The “burnt” dust deficient of smaller grains locates predominantly in the shell and in the edge layer between the shell and the hot bubble, i.e., it is connected spatially with denser and colder plasma. As a result, the low-brightness dust emission is present on panels with the low-energy X-ray bands as they occupy the entire field of the bubble including the dense shell and the edge between the shell and hot bubble. The energy band keV represents the bubble hot interior and its colder shell (Fig. 8). This is reflected in the low-brightness tail both in X-ray and IR. The highest energy band emission ( keV) concentrates towards the bubble center and has the lowest brightness, The dust in this region mostly avoids destruction from the hostile environment and is on average brighter.
3.2.3 Emissions vs height
Emission characteristics of the superbubble interior depend on gas density and temperature, and therefore change in height and time. Thus they can characterize the bubble physical state and the age. Fig. 16 presents emission intensities along the vertical axis averaged over rings centered at for a given -coordinate within radial direction pc. These are: H line, X-ray low-energy (0.6–1 keV), and m to mm IR from dust, commonly used for diagnostics of gaseous haloes in edge-on galaxies.
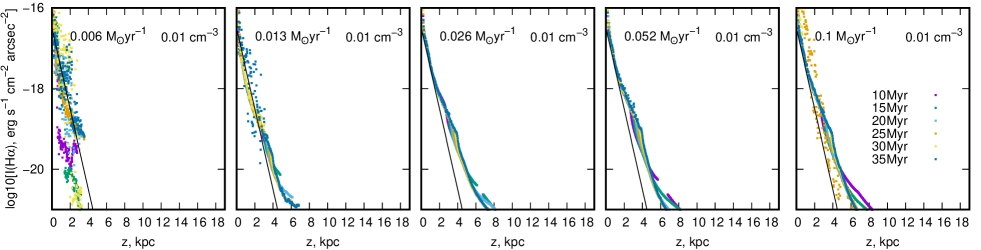
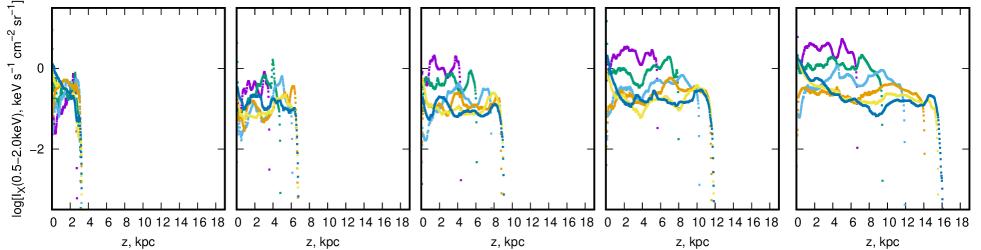
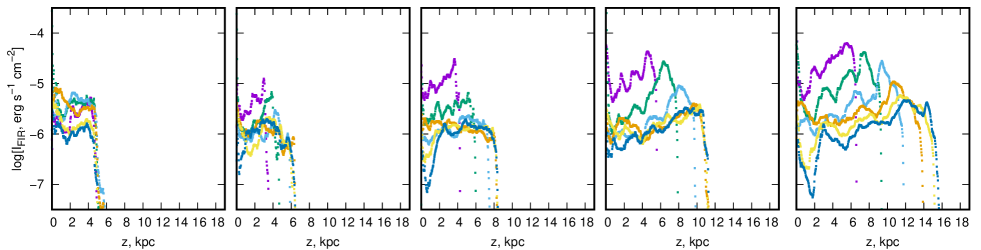
As can be seen, H emission extends at a detectable limit erg s-1 cm-2 arcsec-2 up to kpc indicating that it comes from the lowest parts of the bubbles shells with a relatively high densities. X-ray low-energy band with small (within factor of 2) variations occupies the entire superbubble volume (as seen in Fig. 8) and decreases in time. IR dust emission is clearly seen to evolve similar to the low-energy X-ray emission. This reflects the fact that dust easily survives in the hot and X-ray bright bubbles’ interior, as seen from comparison of Fig. 11 with Fig. 8 (the first 3 panels).
OVI ions are known to be very sensitive to temperature variations in a cooling plasma (Vasiliev, 2011, 2013), and does not show a clear trend in the vertical distribution. However, it shows a rather intense 1036Å line emission with erg cm-1 s-1 arcmin-2 and can trace outflows of hot enriched gas into galactic haloes.
4 Implications: Milky Way and NGC 891
4.1 The giant bubble in the Galaxy
Estimates of SFR in the central Milky Way during recent 10 Myr vary around yr-1 (Yusef-Zadeh et al., 2009; Immer et al., 2012; Koepferl et al., 2015; Barnes et al., 2017) with the corresponding cluster mass of , and as such can work as a source for keeping the central superbubble manifested in form of the North Polar Spur and Fermi-Bubbles. Recently, eROSITA telescope installed onboard of the Spektr-RG mission has found an observational evidence of energy injection into the halo from past activity in the central part of the Milky Way (Predehl et al., 2020). In the 0.6–1.0 keV band, the average observed X-ray intensity within the nothern and southern bubbles is around erg s-1 cm-2 arcmin-2.
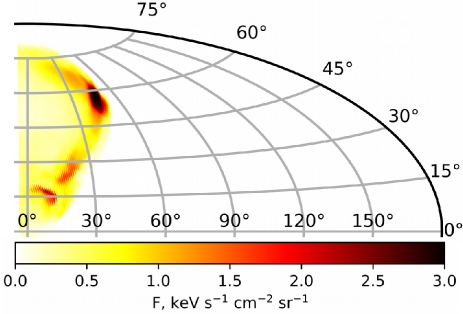
In our simulations we consider the evolutionary and emitting properties of similar giant bubbles formed by SFR= yr-1 (Fig. 5). The intensity obtained in our models is close to that observed in the Galaxy. The bubble from a cluster with the SFR= yr-1 reaches the height kpc at 25 Myr (forth panel on Fig. 5), that is close to the observed height of the North Polar Spur. For an observer at 8 kpc from the center the X-ray intensity (in 0.7-1.2 keV) of the bubble in galactic coordinates is shown in Fig. 17. The intensity in the bright shell is close to the values detected by eROSITA: keV s-1 cm-2 sr-1. As can be seen from Fig. 4 at Myr the bubble continues to expand. In the next 10 Myr its flux decreases by a factor of , and the shell rises upto latitudes of 80∘. The overall morphology is similar to the Milky Way bubble. Small-scale morphological differences are observed at lower latitudes, where details of inhomogeneous distribution of gas and star formation around the central galactic zone can introduce pecularities into dynamics.
Sarkar et al. (2015) have described first a 2D dynamical model of a galactic scale outflow that might have resulted in formation of the Loop I structure and Fermi-bubbles inside. The overall dynamics is very similar to ours, with small differences in morphology, which are connected with the difference in energy injection regimes: spherically symmetric wind with a continuous rate in their model versus episodic explosions from individual SNe randomly spread in space and time within a central spherical stellar cluster of radius pc. The effective luminosities though differ by factor of five: star formation rates yr-1 in Sarkar et al. (2015) model versus yr-1 in our the most powerful model with the SFR close to the observed one (Yusef-Zadeh et al., 2009; Immer et al., 2012; Koepferl et al., 2015; Barnes et al., 2017). The difference is also in total activity of the central source: Sarkar et al. (2015) considered the central source active for over 27 Myr, whereas in our case the star formation ceased at Myr. The superbubble vertical scales are similar though: kpc at Myr. The efficiencies of a continuous wind and sporadic individual SNe in driving large scale outflows are hard to compare because the models differ in their basic parameters: mid plane disc densities, halo densities and the corresponding scales.
It is worth noting that the expected brightness of the superbubble in our model is comparable in order of magnitude to the one obtained by Sarkar et al. (2015). For the leptonic mechanism of -emission connected with inverse scattering of CMB photons on cosmic ray electrons with TeV, one can estimated the surface brightness of the bubble at -ray energy GeV as GeV cm-2 s-1 sr-1, with the gas density , and temperature , and the line-of-sight thickness of the emitting hot gas , following the assumption of Sarkar et al. (2015) that the cosmic ray electron energy density is proportional to the energy density of the hot gas.
4.2 Edge-on galaxies
Our results can be applied also to edge-on galaxies where growing bubbles and superbubbles are seen projected along a sightline, and in some cases can be superimposed to form a smooth image along the galactic disc without being separated individually.
The superbubble X-ray brightness in the low energy band keV band increases with the halo floor density . This follows from the dependence of emissivity on density: the intensity is roughly , where is the emissivity, the bubble radius, . At later stages when the vertical size of the bubble is in excess of , it expands predominantly into the halo, and we assume that the mean gas density in the bubble is (Vasiliev et al., 2017). The exponential factor in the emissivity determines a slow decay of the brightness in time.
Quite similarly H emission increases with the halo density as the X-ray intensity does. It is connected with the fact that the recombination emissions come from the denser and colder shell with a dominant contribution from the regions belonging to the halo.
For a fixed gas halo density profile the soft X-ray intensity of the bubbles shows rather a weak sensitivity to SFR in the range yr-1, as seen in Fig. 10 and on the second row in Fig. 16: from left to right the -averaged intensity shows only time variations from at Myr to keV cm-2 s-1 sr-1 at Myr. This is connected with a weak dependence of the superbubble radius on SFR nearly as . Another reason is that superbubbles with higher SFR expand progressively upwards after reaching a few , and the gas density inside decreases faster than in those bubbles driven by lower SFR. However, when integrated over the superbubble the total X-ray luminosity relates to the SFR as with depending on the age (see, Sec. 3.2.1).
Warm dust is also known to trace galactic outflows on scale heights from the inner and intermediate haloes (Dahlem et al., 2001; Tüllmann et al., 2006; McCormick et al., 2013) to larger heights reached by strong galactic winds. In the end of evolution the integral IR luminosity of a single bubble with a given SFR (in yr-1) is (see Fig. 9). This is strikingly lower (four order of magnitudes) than the – relation for normal and starbursts galaxies (see, for recent discussion Kennicutt & Neal, 2012; Kennicutt & De Los Reyes, 2021). It is important to emphasize though that this relation belongs solely to the superbubble interior extending to the outer kpc halo, and is explained by a low gas density in there. On the contrary, FIR from starburst galaxies stems from the brightest regions of SF in the galaxy discs. Estimates of the extraplanar ( kpc) FIR emission in edge-on galaxies give similar numbers. For instance, the sum of the FIR fluxes from extraplanar regions around the X-shaped structure in the galaxy NGC 3079 with its SFRyr-1 (Veilleux et al., 2021), results in in solar units. A similar value can be inferred from the data for the halo of the galaxy NGC 891 presented by Yoon et al. (2021, see their Table 3).
4.2.1 NGC 891
The galaxy NGC 891 is similar to the Milky Way (Bok & Bok, 1981; van der Kruit, 1984; Sofue et al., 1987; Bottema et al., 1991; Dettmar, 1992; Dahlem et al., 1995). Its IR, H, CO, [CII] 158m emissions and the synchrotron radio-halo and other galaxy-scale structures are fed by SFR to yr-1 (as inferred from Dahlem et al., 1995). Recently Yoon et al. (2021) described a FIR emission from a dusty halo extending upto 8 kpc above the disc. It may indicate that even though averaged over the disc surface SFR is only yr-1 kpc-2, under certain conditions it can launch a large scale elevation of the interstellar gas. From the point of view of our simulations, such conditions can be fulfilled when the injection of energy into the ISM is provided by compact stellar clusters: about a hundred OB-associations of yr-1 with the total rate yr-1 spread randomly over the disc can maintain such a halo. Indeed, as seen from Fig. 5, a cluster with SFR yr-1 in 35 Myr reaches kpc and kpc, covering in the disc kpc2. As seen in Fig. 4 the lifetime of such superbubbles can be longer than 35 Myr, resulting in a high covering fraction of the disc area by superbubbles. The total X-ray luminosity of such superbubbles can be of erg s-1 each as can be judged from Fig. 9, being in agreement with observational estimates (Bregman & Pildis, 1994; Wang et al., 1995).
Hodges-Kluck et al. (2018) report a disc-wide X-ray emission keV with the intensity erg cm-2 s-1 arcmin-2 extending up to 5 kpc in the vertical direction, and up to 10 kpc in the central part; higher energy photons keV extend over smaller distances. All our models except the one with SFR yr-1 and cm-3 (5th panel in Fig. 5) predict similar intensities within the heights they occupy. In particular, the model superbubble from a cluster witn SFR yr-1 extends its soft X-ray up to kpc (see third panel in second row in Fig. 16). The latter may indicate on the presence of an active stellar cluster that might has initiated an outflow 25–30 Myr ago in the center of NGC 891.
5 Conclusions
Our results are summarized as follows:
-
1.
Stellar clusters with SFR yr-1 and surface energy injection rate of erg cm-2 s-1 produce superbubbles extending from 3 to 16 kpc. The superbubble traced in the Milky Way by the North Polar Spur can be launched and maintained by a cluster with a relatively low yr-1 close to the observed one. The value of the yr-1 and the corresponding energy input rate erg cm-2 s-1 is close to the threshold in ambient gas with parameters typical for the Milky Way central region.
-
2.
Such superbubbles can stay filled with a hot ( K) low-density ( cm-3) and enriched () gas for a long time of the order of Myr, and be sufficiently bright in the soft X-ray emission in energy range keV with erg s-1 while yr-1, and erg s-1 at higher SFR.
-
3.
A fraction of dust can survive in the bubble interior on this time scale, and can be seen in infrared emission. However, a deficit of dust particles of small sizes Å results in a considerable, factor of ten, depression of the integrated dust IR emission, even though the dust mass remains practically unchanged. The deficit of small size particles is also revealed in the ratio . The “normal” dust shows , whereas the “burnt” one has .
-
4.
Stellar clusters with SFR in this range spread through over galactic discs can maintain gaseous haloes that radiates in X-ray, H, and IR dust continuum with the intensities similar to those observed in edge-on galaxies (such as NGC 891). The luminosity of individual supperbubbles is connected with the underlying SFR , roughly consistent with the halo IR-emission observed in a few edge-on galaxies.
Acknowledgements
We thank the referee, R. Wünsch, for his friendly criticism and valuable comments. The work by SD and YS is done under partial support from the pro “New Scientific Groups LPI” 41-2020. The numerical simulations have been performed in the High Performance Cluster at the Raman Research Institute, Bangalore.
Data Availability
The data underlying this article are available in the article.
References
- Alton et al. (2000) Alton, P. B., Rand, R. J., Xilouris, E. M., et al. , 2000, A& A, Suppl., 145, 83
- de Avillez (2000) de Avillez M.A., 2000, MNRAS, 315, 479
- Bakes & Tielens (1994) Bakes E.L.O. & Tielens A.G.G.M., 1994, ApJ, 427, 822
- Barnes et al. (2017) Barnes, A. T., Longmore, S. N., Battersby, C., et al. 2017, MNRAS, 469, 2263
- Berkhuijsen et al. (1971) Berkhuijsen, E. M., et al. 1971, A& A, 14, 359
- Bianchi & Schneider (2007) Bianchi, S., & Schneider, R., 2007, MNRAS, 378, 973
- Bocchio et al. (2016) Bocchio, M., Bianchi, S., Hunt, L. K., Schneider, R., 2016, A&A 586, A8
- Bok & Bok (1981) Bok, J. B. & Bok, P. F., The Milky Way, Harvard University Press, 1981
- Bordoloi et al. (2014) Bordoloi, R., Tumlinson, J., Werk, J. K., et al. 2014, ApJ, 796, 136
- Bottema et al. (1991) Bottema, R., van der Kruit, P. C., Valentijn, E. A., 1991, A& A, 247, 357
- Bregman & Pildis (1994) Bregman, J. N., Pildis, R. A., 1994, ApJ, 420, 570
- Burchett et al. (2015) Burchett, J. N., Tripp, T. M., Prochaska, J. X., et al. 2015, ApJ, 815, 91
- Burke (1974) Burke J., Silk J., 1974, ApJ, 190, 1
- Chung et al. (2021) Chung, H., Vargas, C. J., Hamden, E., 2021, ApJ, 916, 7
- Dahlem et al. (2001) Dahlem, M., Lazendic, J. S., Haynes, R. F., Ehle, M., Lisenfeld, U., 2001, A& A, 374, 42
- Dahlem et al. (1995) Dahlem M., Lisenfeld U., Golla G., 1995, ApJ, 444, 119
- Dahlem et al. (2006) Dahlem, M., Liesenfeld, U., Rossa, J., 2006, A& A, 457, 121
- Dettmar (1992) Dettmar, R. -J., 1992, FCPh, 15, 143
- Dobler et al. (2010) Dobler, G., Finkbeiner, D. P., Cholis, L., et al. 2010, ApJ, 717, 825
- Draine (1981) Draine B.T., 1981, ApJ, 245, 880
- Draine & Salpeter (1979) Draine B.T., & Salpeter, E. E., 1979, ApJ, 231, 77
- Draine (2011) Draine B.T., Physics of the Interstellar and Intergalactic Medium, Princeton University Press, 2011
- Dwek (1981) Dwek E., 1981, ApJ, 247, 614
- Dwek (1986) Dwek E., 1986, ApJ, 302, 363
- Dwek & Arendt (1992) Dwek E., Arendt R., 1992, ARA&A, 30, 11
- Federrath et al. (2016) Federrath, C., Rathborne, J. M., Longmore, S. N., et al. 2016, ApJ, 832, 143
- Fielding et al. (2018) Fielding, E., Quataert, E., Martizzi, D., 2018, MNRAS, 481, 3325
- Franeck et al. (2022) Franeck, A., Wünsch, R. Martínez-Gonzĺez, S., et al. , 2022, arXiv:2201.12339
- Gall et al. (2014) Gall C., Hjorth J., et al. 2014, Nature, 511, 7509, 326
- Girichidis et al. (2016) Girichidis P. et al. , 2016, MNRAS, 456, 3432
- Hanbury Brown et al. (1960) Hanbury Brown, R., Davies, R. D., Hazard, C., 1960, Observatory, 80, 191
- Haslam et al. (1983) Haslam, C. G. T., Salter, C. J., Stoffel, H., Wilson, W. E., 1983, A& AS, 47, 1
- Heckman (2000) Heckman, T. M., 2000, RSPTA, 358, 2077
- Hill et al. (2012) Hill A.S., Joung M.R., Mac Low M.-M. et al. , 2012, ApJ, 750, 104
- Hodges-Kluck et al. (2018) Hodges-Kluck, E. J., Bregman, J. N., Li, J.-t., 2018, ApJ, 866, 126
- Howk & Savage (1999) Howk, J. C., Savage, B. D., 1999, AJ, 117, 2077
- Hughes et al. (2014) Hughes, T. M., Baes, M., Fritz, J., et al. , 2014, A&A 565, A4
- Iben (2012) Iben I., Stellar Evolution Physics, Volume 2, Cambridge, Cambridge University Press, 2012
- Immer et al. (2012) Immer, K., Schuller, F., Ommont, A., Menten, K. M., 2012, A& , 537, A121
- Jones et al. (1994) Jones, A. P., Tielens, A. G. G. M., Hollenbach, D. J., McKee, C. F., 1994, ApJ, 433, 797
- Kalberla & Kerp (1994) Kalberla, P. M. W., Kerp, J., 2009, ARA&A, 47, 27
- Keeney et al. (2017) Keeney, B. A., Stocke, J. T., Danforth, C. W., et al. 2017 ApJS, 230, 6
- Kennicutt & Neal (2012) Kennicutt, R. C., Jr., Neal, J. E. II, 2012, ARA&A 50, 531
- Kennicutt & De Los Reyes (2021) Kennicutt, R. C., Jr., De Los Reyes, M. A. C., 2021, ApJ, 908, 61
- Klingenberg et al. (2007) Klingenberg Ch., Schmidt W., Waagan K., 2007, J. Comp. Phys., 227, 12
- Koepferl et al. (2015) Koepferl, C. M., Robitaille, T. P., Morales, E. F. E., Johnston, K. G., 2015, ApJ, 799, 53
- Kruijssen (2017) Kruijssen, J. M. D., 2017, IAUS, 322, 64
- Krumholz & Kruijssen (2015) Krumholz, M. R., & Kruijssen, J. M. D., 2015, MNRAS, 453, 739
- Krumholz et al. (2016) Krumholz, M. R., Kruijssen, J. M. D., Crocker, R. M., 2016, MNRAS, 466, 1213
- Krumholz et al. (2019) Krumholz M. R., McKee C. F., Bland-Hawthorn J., 2019, ARA&A, 57, 227
- Laor & Draine (1993) Laor, A., Draine, B. T., 1993, ApJ, 402, 441
- Lau et al. (2015) Lau R., Herter T., et al. 2015, Science, 348, 6233, 413
- Lehnert & Heckman (1996a) Lehnert, M. D., Heckman, T. M., 1996a, ApJ, 462, 651
- Li, Bryan & Ostriker (2017) Li M., Bryan G.L., Ostriker J.P., 2017, ApJ, 841, 101
- Li, Bregman, Wang, et al. (2017) Li, J.-T., Bregman, J. N., Wang, Q. D., et al. , 2017, ApJS, 232, 20
- Mathis et al. (1977) Mathis, J. S., Rumpl, W., Nordsieck, K. H., 1977, ApJ, 217, 425
- Matsuura et al. (2011) Matsuura M., Dwek E., et al. 2011, Science, 333, 6047, 1258
- McCormick et al. (2013) McCormick, A., Veilleux, S., Rupke, D. S. N., 2013, ApJ, 774, 126
- Miller & Veilleux (2003) Miller, S. T., Veilleux, S., 2003, ApJS, 148, 383
- Miller & Bregman (2015) Miller M.J., Bregman J.N., 2015, ApJ, 800, 14
- Nath & Shchekinov (2013) Nath, B. B., Shchekinov, Y. A., 2013, ApJ, 777, L12
- Oosterloo et al. (2007) Oosterloo, T., Fraternali, F., Sancisi, R., 2007, AJ, 134, 1019
- Predehl et al. (2020) Predehl P., Sunyaev R. A., Becker W., Brunner H., Burenin R., Bykov A., Cherepashchuk A., et al., 2020, Natur, 588, 227
- Prochaska et al. (2006) Prochaska, J. X., Weiner, B. J., Chen, H.-W., & Mulchaey, J. S., 2006, ApJ, 643, 680
- Prochaska et al. (2017) Prochaska, J. X., Werk, J. K., Worseck, J., et al. 2017, ApJ, 837, 169
- Qu et al. (2019) Qu, Z., Bregman, J. N., Hodges-Kluck, E. J., 2019, ApJ, 876, 101
- Rossa et al. (2000) Rossa, J., Dettmar, R.-J., 2000, A& A, 359, 433
- Rossa et al. (2004) Rossa, J., Dettmar, R.-J., Walterbos, R., A. M., Norman, C. A., 2004, AJ, 128, 674
- Roy et al. (2013) Roy, R., Nath, B. B., Sharma, P., Shchekinov, Y. A., 2013, MNRAS, 434, 3572
- Sarkar et al. (2015) Sarkar, K. C., Nath, B. B., Sharma, P., 2015, MNRAS, 453, 3827
- Seon et al. (2014) Seon, K.-I, Witt, A. N., Shinn, J.-H., Kim, I.-J., 2014, ApJ, 785, L18
- Sharma et al. (2014) Sharma, P., Roy, A., Nath, B. B., Shchekinov, Y. A., 2014, MNRAS, 443, 3463
- Shchekinov (2018) Shchekinov Y., 2018, Galaxies, 6, 62
- Shinn (2018) Shinn, J.-H., 2018, ApJS, 239, 21
- Simcoe et al. (2006) Simcoe, R. A., Sargent, W. L. W., Rauch, M., & Becker, G., 2006, ApJ, 637, 648
- Sofue (1994) Sofue, Y., 1994, ApJ, 431, L91
- Sofue et al. (1987) Sofue, Y., Nakai, N., Handa, T., 1987, PASJ, 39, 47
- Su et al. (2010) Su, M., Slatyer, T. R., & Finkbeiner, T. P., 2010, ApJ, 724, 1044
- Temple et al. (2005) Temple R. F., Raychaudhury S., Stevens I. R., 2005, MNRAS, 362, 581
- Tielens et al. (1994) Tielens, A. G. G. M., McKee, C. F., Seab, C. G., Hollenbach, D. J., 1994, ApJ, 431, 321
- Todini & Ferrara (2001) Todini, P.,& Ferrara, A., 2001, MNRAS, 325, 726
- Toro (1999) Toro E., Riemann solvers and numerical methods for fluid dynamics, Springer-Verlag, Berlin, second edition, 1999
- Tumlinson et al. (2011) Tumlinson, J., Thom, C., Werk, J. K., 2011, Sci., 334, 948
- Tüllmann et al. (2006) Tüllmann, R., Breitschwerdt, D., Rossa, J., Pietsch, W., Dettmar, R.-J., 2006, A& A, 457, 779
- van der Kruit (1984) van der Kruit, P. C., 1984, A& A, 140, 470
- Vasiliev (2011) Vasiliev, E.O., 2011, MNRAS, 414, 3145
- Vasiliev (2013) Vasiliev E.O., 2013, MNRAS, 431, 638
- Vasiliev et al. (2015) Vasiliev, E. O., Nath, B. B., Shchekinov, Yu. A., 2015, MNRAS, 446, 1703
- Vasiliev et al. (2017) Vasiliev, E. O., Shchekinov, Yu. A., Nath, B. B., 2017, MNRAS, 468, 2757
- Vasiliev et al. (2019) Vasiliev, E. O., Shchekinov, Yu. A., Nath, B. B., 2019, MNRAS, 486, 3685
- Veilleux et al. (2021) Veilleux, S., Meléndez, M., Stone, M., et al. , 2021, MNRAS, 508, 4902
- Walch et al. (2015) Walch S., Girichidis P., Naab T., et al. 2015, MNRAS, 454, 238
- Wang et al. (1995) Wang, Q. D., Walterbos, R. A. M., Steakley, M. F., et al. , 1995, ApJ, 439, 176
- Yadav et al. (2017) Yadav, N., Mukherjee, D., Sharma, P., Nath, B. B., 2017, MNRAS, 465, 1720
- Yoon et al. (2021) Yoon, J. H., Martin, C. L., Veilleux, S., et al. , 2021, MNRAS, 502, 969
- Yusef-Zadeh et al. (2009) Yusef-Zadeh, F., Hewitt, J. W., Arendt, R. G., et al. 2009, ApJ, 702, 178
Appendix A Cooling function
In our simulations we have used a non-equilibrium cooling function that includes time-dependent evolution of the ionization state of the dominant coolants: He, C, N, O, Ne, Mg, Si, Fe, implemented self-consistently into cooling processes described by Vasiliev (2013), is the abundance of heavy elements. In (Vasiliev, 2013) calculations of the gas ionization and thermal state begin from the initial conditions at K when all dominant elements are fully ionized and then are supposed to recombine free without additional ionization and heating sources. We make use only the isochoric version of the cooling function because hydrodynamical processes relax to pressure equilibrium on relevant time scales of a Myr. In our simulations the function is tabulated properly, and when necessary splined between different and corresponding to their values in a given cell and at a given time. Figure 18 shows a graphical representation of , the increment is calculated from the requierements that
| (2) |
resulting in an approximate difference between subsequent values of by not more than 10–12%.
Appendix B Evolution of dust size distribution
At K thermal sputtering rate of a dust particle is cm s-1, does not depend explicitly on dust radius . Correspondingly, the continuity equation for dust size distribution is (Eq. 72 in Laor & Draine, 1993)
| (3) |
with the solution , with , is the dust size distribution an the initial state. For the “standard” MRN distribution within (Mathis et al., 1977) the distribution remains similar with a decreasing magnitude and with the minimum size .