2 INAF, Osservatorio Astronomico di Brera, via E. Bianchi 46, I-23807 Merate (LC), Italy
3 Max-Planck-Institut für extraterrestrische Physik, Giessenbachstrasse, D-85748, Garching, Germany
4 INAF, Osservatorio di Astrofisica e Scienza dello Spazio, Via P. Gobetti 101, 40129 Bologna, Italy
5 Scuola Universitaria Superiore IUSS Pavia, Piazza della Vittoria 15, 27100, Pavia, Italy
Capturing the lowest luminosity state of the Supergiant Fast X-ray Transient XTE J1739-302
We report here on the results of the analysis of Chandra, XMM–Newton and NuSTAR recent observations of the Supergiant Fast X-ray Transient XTE J1739-302. The source was caught in a low X-ray luminosity state, from a few to erg s-1 (0.5-10 keV). In particular, a very low X-ray luminosity was captured during an XMM–Newton observation performed in October 2022, at a few erg s-1 (0.5-10 keV), never observed before in XTE J1739-302. The XMM–Newton spectrum could be well fitted either by an absorbed, steep power law model (photon index of 3.5) or by a collisionally-ionized diffuse gas with a temperature of 0.7 keV, very likely produced by shocks in the supergiant donor wind. These observations covered different orbital phases, but all appear compatible with the low luminosity level expected from the orbital INTEGRAL light curve. The absorbing column density is variable in the range cm-2. A broad-band X-ray spectrum could be investigated at erg s-1 (0.5-30 keV) for the first time in XTE J1739-302 with not simultaneous (but at similar orbital phases) Chandra and NuSTAR data, showing a power law spectral shape with a photon index of 2.2 and an absorbing column density of cm-2. Remarkably, owing to the XMM–Newton observation, the amplitude of the X-ray variability has increased to five orders of magnitude, making XTE J1739-302 one of the most extreme SFXTs.
Key Words.:
stars: neutron: massive - X-rays: binaries: individual: XTE J1739-302, IGR J17391-30211 Introduction
The X-ray surveys of the Milky Way performed with focusing instruments are legacy datasets of paramount importance for many kind of investigations, from the study of diffuse X-ray emitting structures to the faintest point-like sources (e.g. Muno et al. 2009; Ponti et al. 2015a, b; Degenaar & Wijnands 2010; Degenaar et al. 2015; Bodaghee et al. 2014). One of their important outcomes is the monitoring and characterization of the behaviour of transient sources at their lowest X-ray luminosity state. In this paper we make use of observations taken from two ongoing survey programmes of the Galactic Center region performed with Chandra and XMM–Newton in 2022 to cast light on the behavior outside outbursts of the Supergiant Fast X-ray Transient XTE J1739-302.
Supergiant Fast X–ray Transients (SFXTs) are a subclass of high mass X-ray binaries (HMXBs) recognized through INTEGRAL observations (Sguera et al., 2005, 2006; Negueruela et al., 2006b). Their outbursts are brief (lasting less than a few days; Romano et al. 2007; Rampy et al. 2009) and made of a number of bright X-ray flares with a duration of a few thousand seconds, when the X-ray luminosity reaches 1036 erg s-1. These flares show a power law distribution of their hard X-ray luminosity (Smith et al., 2012; Paizis & Sidoli, 2014) and the outburst duty cycle (i.e the percentage of time spent in bright X-ray flares) is shorter than 5% (Sidoli & Paizis, 2018).
SFXTs are associated with early type supergiants, as the classical persistent accreting pulsars in HMXBs. But, at odds with persistent HMXBs, they show a large range of X-ray variability between flare peaks and quiescence (below 1034 erg s-1) of (Sidoli & Paizis, 2018), reaching 106 only in the source IGR J17544-2619 (Romano et al., 2015). The physical driver of this phenomenology is very debated in the literature (see Kretschmar et al. 2019 for the most recent review).
The source XTE J1739-302 (also known as IGR J17391-3021; Sunyaev et al. 2003) was discovered in 1998 (Smith et al., 1998) and classified as an SFXT because of its X-ray emission detected by INTEGRAL (Sguera et al., 2005) and RossiXTE (Smith et al., 2006) only during short (a few thousand seconds) flares above 1035 erg s-1 (for a distance of 2 kpc, see below). The outburst duty cycle is very low (0.89%; Sidoli & Paizis 2018), with short bright flares caught by (Sakano et al., 2002), RossiXTE (Smith et al., 2006, 2012), INTEGRAL (Sunyaev et al., 2003; Lutovinov et al., 2005; Sguera et al., 2005, 2006; Walter & Zurita Heras, 2007; Blay et al., 2008; Drave et al., 2010; Ducci et al., 2010; Paizis & Sidoli, 2014; Sidoli et al., 2016; Sidoli & Paizis, 2018) and Swift (Sidoli et al., 2009b, a; Romano et al., 2009; Farinelli et al., 2012; Romano et al., 2014; Romano, 2015; Romano et al., 2022). The latest bright flaring activity has been detected by INTEGRAL/JemX on October 3, 2021 (Maartensson et al., 2021).
The out-of-outburst emission was investigated by means of (Sakano et al., 2002), Chandra (Smith et al., 2006), Suzaku (Bodaghee et al., 2011; Pradhan et al., 2021), Swift (Sidoli et al., 2008; Romano, 2015) and XMM–Newton (Bozzo et al., 2010; Sidoli et al., 2019). These observations caught (or allowed to constrain) the source X-ray emission in the luminosity range 10 erg s-1.
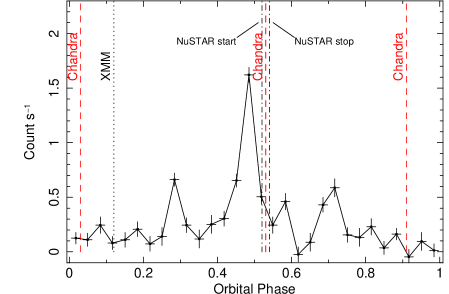
An orbital period of 51.47 days was discovered in INTEGRAL data, from the modulation of the X–ray light curve (Drave et al., 2010). The folded INTEGRAL light curve shows a main peak (at orbital phases 0.4-0.5, assuming a zero phase at epoch MJD 52698.2) with two side peaks covering phases 0.25-0.35 and 0.65-0.75. The shape of the X-ray light curve suggests a large orbital eccentricity (Drave et al., 2010). A radial velocity investigation is lacking, therefore the orbital geometry (except for the orbital period) is unknown. Nevertheless, the periastron (apastron) passage is usually assumed to be located near the phases of the maximum (minimum) X-ray level of emission in the orbital curve.
The refined Chandra position (Smith & Heindl, 2004; Smith et al., 2006) enabled the optical/near-infrared association with an O8Iab(f) star located at a distance of 2.3 kpc (Negueruela et al., 2006a). Within its uncertainties, the nominal value is compatible with the distance derived by Rahoui et al. 2008 (2.7 kpc) from the fitting of the broad-band spectral energy distribution of the companion star. Precise information on the source distance is mandatory to calculate the correct associated luminosities. To this aim, nowadays accurate and reliable distance estimates are available from the Gaia mission (Gaia Collaboration et al., 2016). We relied on the Gaia EDR3 data (Gaia Collaboration et al., 2021), and the distances by Bailer-Jones et al. (2021). Two distance estimates are available for XTE J1739-302 (obtained with two different methods) which are fully compatible with each other: dgeo=1.93 kpc (based only on the parallax) and dphotogeo=2.01 kpc (which uses also the colour and the apparent magnitude). We note that the Gaia distance has a smaller uncertainty (1.76-2.13 kpc) compared with the range derived from optical and infrared observations (1.8-2.9 kpc, Negueruela et al. 2006a). Therefore, according to the Gaia results, we will adopt a distance of 2 kpc in our paper.
2 Observation and data reduction
We summarize in Table LABEL:tab:log the observations investigated here, together with the orbital phases covered assuming the ephemeris of Drave et al. (2010). The spectral analysis was performed using xspec in HEASoft (Nasa High Energy Astrophysics Science Archive Research Center (2014) Heasarc; v.29). We adopted the absorption model TBabs to fit the spectrum, assuming the photoelectric absorption cross sections of Verner et al. (1996) and the interstellar abundances of Wilms et al. (2000). The spectra were grouped to have at least 15 counts per bin, to apply the statistics. In low counts spectra, 1 count per bin was adopted and Cash statistics (Cash, 1979). All uncertainties in the spectral analysis are given at 90% confidence level, for one interesting parameter. Uncertainties on the count rates are at 1 . The uncertainty on the unabsorbed X-ray fluxes have been calculated using cflux in xspec. When spectra from different instruments were simultaneously fitted in xspec, we adopted numerical factors to account for the calibration uncertainties. The arrival times of all events were corrected to the Solar System barycenter. In the following sub-sections the data reduction and analysis specific to the different instruments are explained.
2.1 Chandra
Chandra serendipitously observed the source sky position in 2022 during the survey program of the Galactic Center region (Table LABEL:tab:log; PI G. Ponti; Program IDs GDHIdp40, GDHIdp44 and GDHIdp51). All observations were performed with ACIS-I in very faint mode (VFAINT). The data were reprocessed with standard procedures using the Chandra Interactive Analysis of Observation (CIAO 4.14) and CALDB (4.9.8). Images and exposure maps were produced using fluximage in the energy range 0.5-7 keV. We used the tool srcflux to estimate the radii of the circular regions enclosing 90% of the point spread function at 1.0 keV at the large off-axis angles of the source location. The source-free backgrounds were extracted using annular regions centered on the XTE J1739-302 position, adopting an inner and an outer radius of two and five times source extraction radius. We report the results in Sect. 3.1.
| Satellite | ObsID | Start Time (UTC) | Stop time (UTC) | Exp. | Off-axis angle | Orbital | |
|---|---|---|---|---|---|---|---|
| (yyyy-mm-dd hh:mm:ss) | (yyyy-mm-dd hh:mm:ss) | (ks) | (arcmin) | phase | |||
| 1 | Chandra | 24108 | 2022-03-04 09:11:25 | 2022-03-04 10:50:27 | 4.4 | 9.6 | 0.92 |
| 2 | Chandra | 24151 | 2022-06-21 17:21:30 | 2022-06-21 18:46:16 | 4.2 | 5.6 | 0.04 |
| 3 | Chandra | 24086 | 2022-09-06 04:03:08 | 2022-09-06 05:38:27 | 4.2 | 8.9 | 0.53 |
| 4 | XMM–Newton | 0886121201 | 2022-10-06 14:56:37 | 2022-10-06 21:49:18 | 26.3 | 1.5 | 0.12 |
| 5 | NuSTAR | 30601023002 | 2021-02-16 20:51:09 | 2021-02-17 20:26:09 | 41.9 | 0.0 | 0.52-0.54 |
2.2 XMM–Newton
The source sky position was serendipitously observed with XMM–Newton (Jansen et al., 2001) in October 2022 during a survey of the central portion of the Milky Way disc (Table LABEL:tab:log; PI G. Ponti; Program ID MW Plane155). Luckily, XTE J1739-302 was imaged almost on-axis. During this pointing (ObsID. 0886121201) the three European Photon Imaging Cameras (EPIC) (Strüder et al., 2001; Turner et al., 2001) operated in full frame mode, adopting the medium filter.
EPIC data were reprocessed with epchain and emchain in the version 20 of the XMM–Newton Science Analysis Software (SAS), adopting standard procedures and the most updated calibration files. We adopted PATTERN selection from 0 to 4 in the EPIC pn and from 0 to 12 in both MOS. Response matrices were generated using the SAS tasks arfgen and rmfgen.
Unfortunately, the observation was severely affected by high background levels. Adopting the same procedure used by Ponti et al. (2015b), background flares were filtered-out reducing the usable exposure time to about 11 ks for each of the two MOS and to 7.5 ks for the EPIC pn.
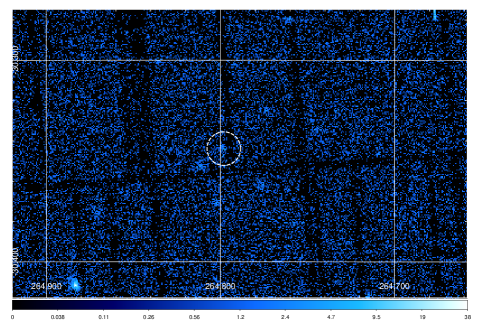
Since a visual inspection of the EPIC mosaic revealed a faint source positionally coincident with XTE J1739-302 (Fig. 2), we performed a proper source detection procedure using the SAS tool edetect_chain. It first performs a sliding box source searching (with both local and global background) and then a maximum likelihood multi-source point spread function fitting. We run edetect_chain on the EPIC clean images extracted in the energy bands 0.2-0.5 keV, 0.5-1.0 keV, 1.0-2.0 keV, 2.0-4.5 keV and 4.5-12 keV, the standard ones adopted also in the XMM–Newton source catalog (Webb et al., 2020). This led to the detection of a source consistent with the XTE J1739-302 position (with a probability of 2.910-15 of detection occurring by chance), considering all EPIC in the full energy range 0.2-12 keV. The resulting net count rate is (7.56)10-3 count s-1 (combining the three EPIC in the 0.2-12 keV energy band). The source is better detected in the energy band 1.0-2.0 keV.
The EPIC spectra were extracted from the cleaned event files using xmmselect, with circular regions with a radius of 30′′. The background spectra were extracted from larger circular regions, free of sources, from the same CCD. We report the results in Sect. 3.2.
2.3 NuSTAR
The Nuclear Spectroscopic Telescope Array (NuSTAR, Harrison et al. 2013) carries two identical co-aligned telescopes focusing X-ray photons onto two Focal Plane Modules, named A and B (hereafter FPMA and FPMB). Each FPM contains four solid-state cadmium zinc telluride (CdZnTe) detectors, covering a 12′12′ FOV, providing a spectral resolution of 400 eV (full width at half maximum, FWHM) at 10 keV and a spatial resolution of 18′′ (FWHM).
XTE J1739-302 was observed with NuSTAR in February 2021 (Table LABEL:tab:log), collecting net exposure times of 41.9 ks (FPMA) and 41.5 ks (FPMB). We downloaded the public data from HEASARC and performed the reduction with nupipeline (v.0.4.9) in the NuSTAR data analysis software (), using standard procedures and CALDB version 20220608.
The spectra and the light curves were extracted from the cleaned event files using nuproducts. Given the faintness of the source, a circle with a 60′′ radius was used to extract source products, while for the background an annular region with an inner radius of 100′′ and an outer radius of 120′′ was assumed. Given the stable background, no further filtering was applied. NuSTAR source light curves and event lists used for the timing analysis were extracted with nuproducts and the keyword “barycorr=yes”, to correct arrival times to the Solar System barycenter. The net count rates (3-78 keV) calculated from the whole observation were the following: 0.0150 counts s-1 (FPMA) and 0.0133 counts s-1 (FPMB). We report the results in Sect. 3.3.
3 Results
We report here the results on the low luminosity state of XTE J1739-302 as observed with the satellites Chandra, XMM–Newton, and NuSTAR, in different epochs and orbital phases.
3.1 Chandra
The source has always been detected in the three observations, but with different intensities: we have extracted a spectrum only from obsID 24086, where the source is brighter, while for the other two we have estimated an average flux using the CIAO tool srcflux. The spectral parameters are listed in Table 2. Assuming the same spectral shape obtained from the spectroscopy of ObsID 24086 (an absorbed powerlaw model with a photon index , and = cm-2), we obtained the following values: in ObsID 24108 the net count rate was (9.8) count s-1 (0.5-7 keV), implying fluxes corrected for the absorption of 3.6()10-12 erg cm-2 s-1 (0.5-7 keV) and 3.910-12 erg cm-2 s-1 (0.5-10 keV). This latter value translates into an X-ray luminosity of L0.5-10keV=1.9 erg s-1. In ObsID 24151 the source net count rate was (1.6) count s-1 (0.5-7 keV), implying fluxes corrected for the absorption of 3.1()10-13 erg cm-2 s-1 (0.5-7 keV) and 3.410-13 erg cm-2 s-1 (0.5-10 keV). This latter flux translates into a luminosity of L0.5-10keV=1.6 erg s-1. The fluxes corrected for the absorption (0.5-10 keV) are plotted versus the orbital phase of these observations in Fig. 3. The adoption of the above spectral model is suggested by the faintness of the source: since SFXT spectra are harder when brighter (e.g., Romano et al. 2014), the adoption of a harder spectral shape than the one observed during ObsID 24086 (when the source was brighter) would be unusual. We note that Chandra observed the source also in 2001 (Smith et al., 2006), with a harder powerlaw spectrum (=0.62, =4.2 cm-2, orbital phase=0.27), but at a much higher flux (1.310-11 erg cm-2 s-1). For what concerns the column density, the adoption of = cm-2 should be considered merely as an example, since the absorption can be very variable (also due to the clumpy circumstellar environment). For the sake of completeness, we note that assuming = cm-2 with the same power law model, the unabsorbed flux is reduced by a factor of 4.

The source light curves (0.5-7 keV) during observations 24108 (March 2022) and 24086 (September 2022) are reported in Fig. 4. We do not show any light curve from observation 24151, because of the limited number of counts collected.


The timing analysis on the barycentered events files from ObsID 24086 yielded a candidate period at 10.58 s that, however, after taking into account the number of trials in the Fourier analysis (2048), is not statistically significant (3). The upper limit for the pulsed fraction of a coherent sinusoidal modulation that we derived for the timing series of observation 24086 with extensive simulations is 56%, in the 0.5–7 keV band and after the background subtraction. The other Chandra observations do not have enough counts for a sensitive timing analysis or to derive meaningful limits.
3.2 XMM–Newton
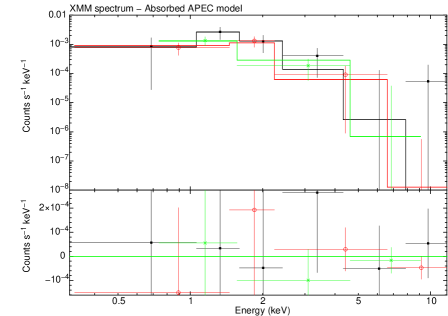
We fitted the three EPIC spectra using either an absorbed power law model for the continuum, or an absorbed apec model, both resulting in equally good fits. The adoption of the apec model (an emission spectrum from collisionally-ionized diffuse gas) is suggested by the very low luminosity of the source (a few 1031 erg s-1). At these X-ray luminosities, the supergiant strong wind is expected to contribute a significant fraction (if not all) of the X-ray emission (see Sect.4). The results are reported in Table 2 and the fit with the apec model is shown in Fig. 5. We searched the barycentered data for periodic modulations, but we found none. The low signal-to-noise ratio of the data did not allow us to derive constraining limits on possible signals.
3.3 NuSTAR
The NuSTAR light curves extracted from both FPMs are shown in Fig.6, where some flaring activity is evident, although the source was not in outburst. The observation spanned a whole day, covering the orbital phase range =0.52-0.54. The uncertainty on the orbital phases, extrapolated at the times of these observations, is =.
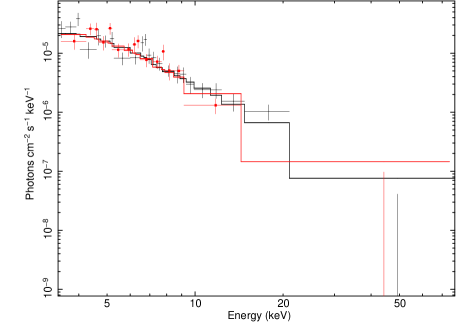
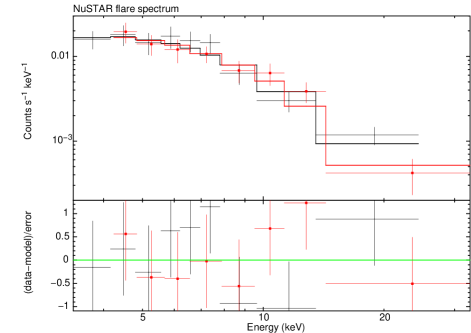
We have performed two spectral extractions: one from the whole exposure time (time-averaged spectrum in Table 2) and one from the brightest flare present in the light curve (it is marked by vertical dashed lines in Fig. 6). A simple absorbed power law is already a good fit to the data, therefore no more complicated models were tried. Spectral parameters are reported in Table 2 for both spectral extractions, while in Fig. 7 and Fig. 8 we show the time averaged and the flare spectra, respectively. In Table 2, fourth column, we report also the flux corrected for the absorption extrapolated to a softer energy range, only to compare better with XMM–Newton and Chandra results. Therefore, these fluxes have no associated uncertainty. However, we note that these values should be taken with caution, as the absorbing column density obtained from NuSTAR spectroscopy only might be unreliable, given the hard energy band of operation (see, e.g., Sidoli et al. 2017).


| Obs. | NH | Powerlaw | UF0.5-10keV | UF3-78keV | L0.5-10keV | (dof) |
|---|---|---|---|---|---|---|
| (1022 cm-2) | or kTapec (keV) | (erg cm-2 s-1) | (erg cm-2 s-1) | (erg s-1) | or C-Stat | |
| Chandra (24086) | = | 1.1 | =16.19 (13 dof) | |||
| XMM–Newton | = | 2.3 | C-Stat=209.23 (224 dof) | |||
| XMM–Newton | kTapec= | 6.7 | C-Stat=206.46 (224 dof) | |||
| NuSTAR (time-av.) | =2.8 | 3.2 | =116.12 (92 dof) | |||
| NuSTAR (flare) | =2.1 | 6.2 | =8.24 (13 dof) | |||
| Chandra + NuSTAR (flare) | = | 1.0 | =24.3 (27 dof) |
We examined the barycentered light curves and event lists to search for timing modulations. No significant periodic or quasi-periodic signal was found. The upper limits on the pulsed fraction of a sinusoidal periodical signal are 47% below 500 s, and 62% up to 2000 s. For longer periods, the sensitivity is very low, due to the presence of strong non-Poissonian noise, mainly induced by the NuSTAR orbital period and the source variability.
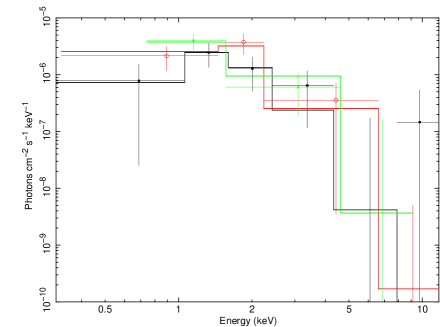
3.4 The broad-band X-ray spectrum
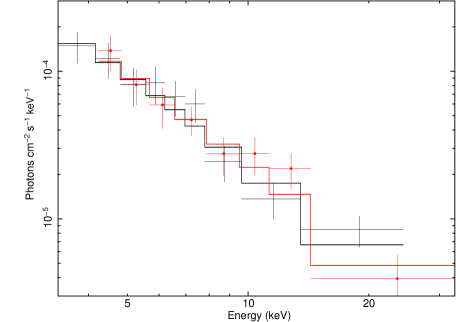
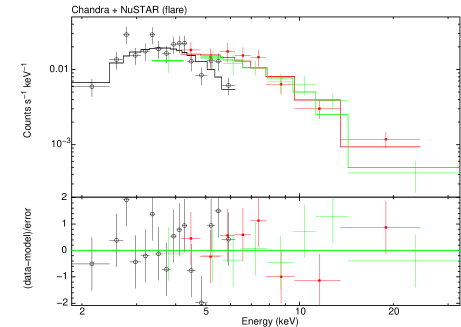
The Chandra observation ObsID 24068 falls within the orbital phase interval covered by the NuSTAR observation. From the spectroscopy of these single observations (Table 2), it is evident that the NuSTAR spectrum extracted from the whole exposure time captured a fainter X-ray state than the one caught by Chandra. On the contrary, the NuSTAR spectrum extracted from the faint flare is consistent with the one observed by Chandra, and they nicely overlap in the energy range 3-7 keV. Therefore, we will discuss here the XTE J1739-302 broad band spectrum (0.5-30 keV), although the non simultaneous observations suggest to consider the following results with caution.
Adopting an absorbed power law model we obtained a very good fit (=24.3 with 27 dof), with no evidence of any curvature in the spectrum or additional spectral components (Fig. 9). It is important to note that all constant factors adopted to account for calibration uncertainties were consistent with unity: when the constant factor for Chandra is fixed at 1, we got and for FPMA and FPMB spectra, respectively.
The resulting spectral parameters are an absorbing column density NH= cm-2 and a power law photon index =. We measured the following fluxes corrected for the absorption: erg cm-2 s-1 (0.5-10 keV) and erg cm-2 s-1, when extrapolated to the 0.5-100 keV energy range. The X-ray luminosity is 1.4 erg s-1 (0.5-100 keV) at 2 kpc. To the best of our knowledge, this is the first XTE J1739-302 broad-band spectrum outside outbursts.

4 Discussion
In this paper, we have reported on sensitive X-ray observations performed with Chandra and XMM–Newton, which serendipitously caught XTE J1739-302 outside outbursts. The X-ray luminosity was low and variable in the range from to 1.1 erg s-1 (0.5-10 keV). To summarize this variability, in Fig. 3 the fluxes corrected for the absorption (0.5-10 keV) versus the orbital phase are displayed. Additionally, we analysed an archival NuSTAR pointing allowing us to investigate the broad-band spectrum (0.5-30 keV) of XTE J1739-302 in low state, for the first time. A featureless, absorbed power law model is a good deconvolution of the 0.5-30 keV spectrum.
The absorbing column density is variable within a factor of 10 (as already found and discussed in previous studies; e.g. Negueruela et al. 2006a; Sidoli et al. 2009a), with the lowest values (1022 cm-2) consistent with the optical extinction (Negueruela et al., 2006a). This variability is usual also in persistent HMXBs and can be ascribed to clumps in the supergiant winds or denser wind structures around the compact object (Martínez-Núñez et al., 2017).
The light curves observed with Chandra and NuSTAR showed some level of variability, with flaring activity on a timescale of about seconds. This behaviour is common to all known SFXTs at any X-ray luminosity (see, e.g., Sidoli et al. 2019 for a global investigation of XMM–Newton observations of SFXTs). No statistically significant periodic or quasi-periodic modulation was found in any data set. The limits on their presence, however, are not particularly strict.
The most remarkable result is the very low X-ray emission caught during the XMM–Newton observation, implying an X-ray luminosity as low as a few erg s-1 (0.5-10 keV), never observed before in XTE J1739-302. A so low X-ray luminosity has been previously detected in SFXTs only in an another member of the class, the source IGR J08408-4503 (Sidoli et al., 2021). A third case is the 3 upper limit placed on the X-ray luminosity from the SFXT SAX J1818.6-1703 at erg s-1 (0.5-10 keV; Bozzo et al. 2008), assuming a power law model with =1.9 and =61022 cm-2.
The continuum models used to fit the EPIC spectra of XTE J1739-302 were a power law and a thermal emission from a collisionally-ionized plasma (apec). This latter model is usually adopted to fit the X-ray spectra from early-type massive stars. Indeed, the shocks that naturally develop inside the supersonic strong stellar winds heat the wind matter up to X-ray temperatures (Feldmeier et al., 1997). The X-ray luminosities from these massive stars are in the range -a few erg s-1 (Berghoefer et al., 1997; Nazé, 2009; Oskinova, 2016; Nebot Gómez-Morán & Oskinova, 2018). This implies that stellar emission from the donor star can contribute a large fraction (or all) of the X-ray luminosity from a SFXT at its lowest state, as found recently in the SFXT IGR J08408-4503 (Sidoli et al., 2021).
The adoption of an apec model fitting the XMM–Newton spectrum was also suggested by the resulting steep best-fit power law slope of =3.5 (although we note that the large uncertainty makes this photon index consistent with the values obtained from all other observations reported here). The spectral parameters obtained using the apec model are consistent with X-ray stellar emission: O-type stars usually display a double-temperature spectrum, with temperatures components – keV and – keV (Rauw et al., 2015; Huenemoerder et al., 2020). But the large absorbing column density towards XTE J1739-302 hampers the detection of the lowest temperature component, showing only the hottest one at 0.7 keV. The derived luminosity of erg s-1 is also compatible with intrinsic X-ray emission from the O-type donor star only.
We note that the low number of counts in the EPIC spectra and the large uncertainty in the derived spectral parameters, hampers a determination of the X-ray emission contributed by the compact object alone, contrary to what was done in Sidoli et al. (2021) investigating the SFXT IGR J08408-4503. In that case, the very low absorption allowed us to clearly disentangle the X-ray emission produced by the supergiant wind from the one contributed by the compact object.
However, given the very low level of X-ray luminosity caught from XTE J1739-302, we can apply to XTE J1739-302 the same physical scenario extensively discussed by Sidoli et al. (2021), which we briefly summarize here. In this theoretical picture, a SFXT is thought to be a slowly rotating neutron star (NS) accreting matter from the supergiant wind (Shakura et al., 2012, 2014). Because of an inefficient cooling of the accreting matter, a hot shell of matter forms above the NS magnetosphere and a quasi-spherical settling accretion regime sets-in. The accretion of the shell material onto the NS occurs by means of the Rayleigh-Taylor instability and it is controlled by an inefficient, radiative cooling. This maintains the source in a low X-ray luminosity state, the most frequent level of emission in SFXTs, at - erg s-1 (Sidoli et al., 2008). In this model, the outbursts in SFXTs can be produced by an instability at the NS magnetosphere (probably due to magnetic reconnection with the magnetized stellar wind material), enabling the sudden accretion of the hot shell onto the NS, producing the bright short flares (Shakura et al., 2014). Sidoli et al. (2021) explains the very low X-ray luminosity observed from the SFXT IGR J08408-4503 with a NS magnetosphere that is Rayleigh-Taylor stable. In this regime, the very low X-ray luminosity of erg s-1 can be produced by the residual accretion onto the NS, permitted by the mechanism of the Bohm diffusion through the magnetosphere (see Sidoli et al. 2021 for a detailed discussion).
It is interesting that in both sources these lowest luminosity states are shown near the supposed apastron passage. However, it is remarkable that the opposite is not true: outbursts in XTE J1739-302 can happen at any orbital phase, even near apastron (Drave et al., 2010). For instance, this is the case of the latest bright flare caught in 2021, that occurred at orbital phase =0.97. The similarity of XTE J1739-302 with the SFXT IGR J08408-4503 also deals with a significant eccentricity of their orbits. But while in IGR J08408-4503 it is well known (e=0.63; Gamen et al. 2015), in XTE J1739-302 it is only inferred from the shape of the X-ray orbital light curve and constrained in the range e=0.16-0.8 (Drave et al., 2010)
Finally, it is important to remark that the XMM–Newton observation allowed us to increase to the source dynamic range, between the X-ray flux at the peak of the flares and in quiescence (Sidoli et al., 2009a; Romano et al., 2022). With this new amplitude of the observed X-ray variability, XTE J1739-302 can be now classified among the most extremes SFXTs (Sidoli & Paizis, 2018). This result demonstrates that frequent sensitive observations of transient sources with very low duty cycles are crucial to better characterize their properties, to catch very faint states and estimate how often they occur.
5 Conclusions
We have reported here the analysis of recent Chandra, XMM–Newton and NuSTAR observation of the SFXT XTE J1739-302. All observations caught the source outside outbursts, at a low X-ray luminosity level, below a few 1034 erg s-1. The main results of our analysis can be summarized as follows:
-
•
the XMM–Newton observation has captured the faintest X-ray state ever observed in XTE J1739-302 at a luminosity of a few 1031 erg s-1, near the supposed apastron passage;
-
•
this low emission can be fitted equally well by a steep power law model or by a thermal hot plasma emission; this latter is consistent with X-ray emission from the donor star only; however, given the low number of counts, it is difficult to estimate the contribution of the compact object to this very low state;
-
•
if a fraction of this X-ray emission at a few 1031 erg s-1 is produced by the compact object, it can be explained by residual accretion onto the NS produced by Bohm diffusion through the NS magnetosphere in the settling accretion regime, similarly to what found in the SFXT IGR J08408-4503 by Sidoli et al. (2021);
-
•
the source dynamic range increases to 3, making XTE J1739-302 one of the most extreme SFXTs;
-
•
the broad-band X-ray spectrum (0.5-30 keV) in the low luminosity state (at 1034 erg s-1) is investigated here for the first time, and it is well fitted by a featureless, absorbed power law model.
Acknowledgements.
This work is based on observations performed with XMM–Newton, Chandra and NuSTAR satellites. XMM–Newton is an ESA science mission with instruments and contributions directly funded by ESA Member States and NASA. We made use of the software provided by the Chandra X-ray Center (CXC) in the application package CIAO. The NuSTAR mission is a project led by the California Institute of Technology, managed by the Jet Propulsion Laboratory, and funded by the National Aeronautics and Space Administration. This research made use of the software package, jointly developed by the ASDC (Italy) and Caltech (USA). We made use of the High Energy Astrophysics Science Archive Research Center (HEASARC), a service of the Astrophysics Science Division at NASA/GSFC. This work has made use of data from the European Space Agency (ESA) mission Gaia (https://www.cosmos.esa.int/gaia), processed by the Gaia Data Processing and Analysis Consortium (DPAC, https://www.cosmos.esa.int/web/gaia/dpac/consortium). Funding for the DPAC has been provided by national institutions, in particular the institutions participating in the Gaia Multilateral Agreement. LS acknowledges useful information provided by the xspec helpdesk. GP acknowledges funding from the European Research Council (ERC) under the European Union’s Horizon 2020 research and innovation programme (grant agreement No 865637). We are grateful to the anonymous referee for their prompt and constructive report.References
- Bailer-Jones et al. (2021) Bailer-Jones, C. A. L., Rybizki, J., Fouesneau, M., Demleitner, M., & Andrae, R. 2021, AJ, 161, 147
- Berghoefer et al. (1997) Berghoefer, T. W., Schmitt, J. H. M. M., Danner, R., & Cassinelli, J. P. 1997, A&A, 322, 167
- Blay et al. (2008) Blay, P., Martínez-Núñez, S., Negueruela, I., et al. 2008, A&A, 489, 669
- Bodaghee et al. (2014) Bodaghee, A., Tomsick, J. A., Krivonos, R., et al. 2014, ApJ, 791, 68
- Bodaghee et al. (2011) Bodaghee, A., Tomsick, J. A., Rodriguez, J., et al. 2011, ApJ, 727, 59
- Bozzo et al. (2008) Bozzo, E., Campana, S., Stella, L., et al. 2008, The Astronomer’s Telegram, 1493, 1
- Bozzo et al. (2010) Bozzo, E., Stella, L., Ferrigno, C., et al. 2010, A&A, 519, A6
- Cash (1979) Cash, W. 1979, ApJ, 228, 939
- Degenaar & Wijnands (2010) Degenaar, N. & Wijnands, R. 2010, A&A, 524, A69
- Degenaar et al. (2015) Degenaar, N., Wijnands, R., Miller, J. M., et al. 2015, Journal of High Energy Astrophysics, 7, 137
- Drave et al. (2010) Drave, S. P., Clark, D. J., Bird, A. J., et al. 2010, MNRAS, 409, 1220
- Ducci et al. (2010) Ducci, L., Sidoli, L., & Paizis, A. 2010, MNRAS, 408, 1540
- Farinelli et al. (2012) Farinelli, R., Romano, P., Mangano, V., et al. 2012, MNRAS, 424, 2854
- Feldmeier et al. (1997) Feldmeier, A., Puls, J., & Pauldrach, A. W. A. 1997, A&A, 322, 878
- Gaia Collaboration et al. (2021) Gaia Collaboration, Brown, A. G. A., Vallenari, A., et al. 2021, A&A, 649, A1
- Gaia Collaboration et al. (2016) Gaia Collaboration, Prusti, T., de Bruijne, J. H. J., et al. 2016, A&A, 595, A1
- Gamen et al. (2015) Gamen, R., Barbà, R. H., Walborn, N. R., et al. 2015, A&A, 583, L4
- Harrison et al. (2013) Harrison, F. A., Craig, W. W., Christensen, F. E., et al. 2013, ApJ, 770, 103
- Huenemoerder et al. (2020) Huenemoerder, D. P., Ignace, R., Miller, N. A., et al. 2020, ApJ, 893, 52
- Jansen et al. (2001) Jansen, F., Lumb, D., Altieri, B., et al. 2001, A&A, 365, L1
- Kretschmar et al. (2019) Kretschmar, P., Fürst, F., Sidoli, L., et al. 2019, New Astronomy Reviews, 86, 101546
- Lutovinov et al. (2005) Lutovinov, A., Revnivtsev, M., Molkov, S., & Sunyaev, R. 2005, A&A, 430, 997
- Maartensson et al. (2021) Maartensson, A. S., Chenevez, J., Brandt, S., et al. 2021, The Astronomer’s Telegram, 14964, 1
- Martínez-Núñez et al. (2017) Martínez-Núñez, S., Kretschmar, P., Bozzo, E., et al. 2017, Space Science Reviews, 212, 59
- Muno et al. (2009) Muno, M. P., Bauer, F. E., Baganoff, F. K., et al. 2009, ApJS, 181, 110
- Nasa High Energy Astrophysics Science Archive Research Center (2014) (Heasarc) Nasa High Energy Astrophysics Science Archive Research Center (Heasarc). 2014, HEAsoft: Unified Release of FTOOLS and XANADU, Astrophysics Source Code Library, record ascl:1408.004
- Nazé (2009) Nazé, Y. 2009, A&A, 506, 1055
- Nebot Gómez-Morán & Oskinova (2018) Nebot Gómez-Morán, A. & Oskinova, L. M. 2018, A&A, 620, A89
- Negueruela et al. (2006a) Negueruela, I., Smith, D. M., Harrison, T. E., & Torrejón, J. M. 2006a, ApJ, 638, 982
- Negueruela et al. (2006b) Negueruela, I., Smith, D. M., Reig, P., Chaty, S., & Torrejón, J. M. 2006b, in Proc. of the “The X-ray Universe 2005”, 26-30 September 2005, El Escorial, Madrid, Spain. Ed. by A. Wilson. ESA SP-604, Volume 1, Noordwijk: ESA Pub. Division, ISBN 92-9092-915-4, 2006
- Oskinova (2016) Oskinova, L. M. 2016, Advances in Space Research, 58, 739
- Paizis & Sidoli (2014) Paizis, A. & Sidoli, L. 2014, MNRAS, 439, 3439
- Ponti et al. (2015a) Ponti, G., De Marco, B., Morris, M. R., et al. 2015a, MNRAS, 454, 1525
- Ponti et al. (2015b) Ponti, G., Morris, M. R., Terrier, R., et al. 2015b, MNRAS, 453, 172
- Pradhan et al. (2021) Pradhan, P., Paul, B., Bozzo, E., Maitra, C., & Paul, B. C. 2021, MNRAS, 502, 1163
- Rahoui et al. (2008) Rahoui, F., Chaty, S., Lagage, P. O., & Pantin, E. 2008, A&A, 484, 801
- Rampy et al. (2009) Rampy, R. A., Smith, D. M., & Negueruela, I. 2009, ApJ, 707, 243
- Rauw et al. (2015) Rauw, G., Hervé, A., Nazé, Y., et al. 2015, A&A, 580, A59
- Romano (2015) Romano, P. 2015, Journal of High Energy Astrophysics, 7, 126
- Romano et al. (2015) Romano, P., Bozzo, E., Mangano, V., et al. 2015, A&A, 576, L4
- Romano et al. (2022) Romano, P., Evans P., A., Bozzo, E., et al. 2022, arXiv e-prints, arXiv:2212.05083
- Romano et al. (2014) Romano, P., Krimm, H. A., Palmer, D. M., et al. 2014, A&A, 562, A2
- Romano et al. (2009) Romano, P., Sidoli, L., Cusumano, G., et al. 2009, MNRAS, 399, 2021
- Romano et al. (2007) Romano, P., Sidoli, L., Mangano, V., Mereghetti, S., & Cusumano, G. 2007, A&A, 469, L5
- Sakano et al. (2002) Sakano, M., Koyama, K., Murakami, H., Maeda, Y., & Yamauchi, S. 2002, ApJS, 138, 19
- Sguera et al. (2005) Sguera, V., Barlow, E. J., Bird, A. J., et al. 2005, A&A, 444, 221
- Sguera et al. (2006) Sguera, V., Bazzano, A., Bird, A. J., et al. 2006, ApJ, 646, 452
- Shakura et al. (2012) Shakura, N., Postnov, K., Kochetkova, A., & Hjalmarsdotter, L. 2012, MNRAS, 420, 216
- Shakura et al. (2014) Shakura, N., Postnov, K., Sidoli, L., & Paizis, A. 2014, MNRAS, 442, 2325
- Sidoli & Paizis (2018) Sidoli, L. & Paizis, A. 2018, MNRAS, 481, 2779
- Sidoli et al. (2016) Sidoli, L., Paizis, A., & Postnov, K. 2016, MNRAS, 457, 3693
- Sidoli et al. (2021) Sidoli, L., Postnov, K., Oskinova, L., et al. 2021, A&A, 654, A131
- Sidoli et al. (2019) Sidoli, L., Postnov, K. A., Belfiore, A., et al. 2019, MNRAS, 487, 420
- Sidoli et al. (2009a) Sidoli, L., Romano, P., Ducci, L., et al. 2009a, MNRAS, 397, 1528
- Sidoli et al. (2009b) Sidoli, L., Romano, P., Mangano, V., et al. 2009b, ApJ, 690, 120
- Sidoli et al. (2008) —. 2008, ApJ, 687, 1230
- Sidoli et al. (2017) Sidoli, L., Tiengo, A., Paizis, A., et al. 2017, ApJ, 838, 133
- Smith & Heindl (2004) Smith, D. M. & Heindl, W. A. 2004, The Astronomer’s Telegram, 218, 1
- Smith et al. (2006) Smith, D. M., Heindl, W. A., Markwardt, C. B., et al. 2006, ApJ, 638, 974
- Smith et al. (1998) Smith, D. M., Main, D., Marshall, F., et al. 1998, ApJL, 501, L181+
- Smith et al. (2012) Smith, D. M., Markwardt, C. B., Swank, J. H., & Negueruela, I. 2012, MNRAS, 422, 2661
- Strüder et al. (2001) Strüder, L., Briel, U., Dennerl, K., et al. 2001, A&A, 365, L18
- Sunyaev et al. (2003) Sunyaev, R., Lutovinov, A., Molkov, S., & Deluit, S. 2003, The Astronomer’s Telegram, 181, 1
- Turner et al. (2001) Turner, M. J. L., Abbey, A., Arnaud, M., et al. 2001, A&A, 365, L27
- Verner et al. (1996) Verner, D. A., Ferland, G. J., Korista, K. T., & Yakovlev, D. G. 1996, ApJ, 465, 487
- Walter & Zurita Heras (2007) Walter, R. & Zurita Heras, J. 2007, A&A, 476, 335
- Webb et al. (2020) Webb, N. A., Coriat, M., Traulsen, I., et al. 2020, A&A, 641, A136
- Wilms et al. (2000) Wilms, J., Allen, A., & McCray, R. 2000, ApJ, 542, 914