Abstract
New results on the radio-quiet type 2 quasar, known as the Teacup galaxy (SDSSJ1430+1339), based on the long-slit and 3D spectroscopic data obtained at the Russian 6-m telescope, are presented. The ionized gas giant nebula, which extends up to kpc in the [O iii] emission line, was mapped with the scanning Fabry–Perot interferometer. The direct estimation of the emission line ratios confirmed that the giant nebula is ionized by the AGN. Stars in the inner kpc are significantly younger than the outer host galaxy and have a solar metallicity. The central starburst age (1 Gyr) agrees with possible ages for the galactic merger events and the previous episode of the quasar outflow produced two symmetric arcs visible in the [O iii] emission at the distances 50–55 kpc. The ionized gas velocity field can be fitted by the model of a circular rotating disk significantly inclined or even polar to the stellar host galaxy.
keywords:
Interstellar medium (ISM): nebulae; galaxies: individual: Teacup1 \issuenum1 \articlenumber0 \datereceived \dateaccepted \datepublished \hreflinkhttps://doi.org/ \TitleGas and stars in the Teacup quasar looking with the 6-m telescope \TitleCitationGas and stars in the Teacup \AuthorAlexei V. Moiseev 1,†,‡*\orcidA and Alina I. Ikhsanova 2,‡ \AuthorNamesAlexei V. Moiseev and Alina I. Ikhsanova \AuthorCitationAlexei V. Moiseev and Alina I. Ikhsanova \corresCorrespondence: moisav@gmail.com; (A.V.)
1 Introduction
Extended Emission-Line Regions (EELRs) detected in outskirts of some active galaxies are considered as a result of Active Galactic Nuclei (AGN) feedback in the radiative and kinetic (jet and wind outflows) forms. The Seyfert galaxy Mrk 6 gives us a nearby, recent and a very typical example of EELR related with AGN ionization cone observed outside of stellar host up to a projected distance 40 kpc (Smirnova et al., 2018). Study of such structures allows us to better understand both the history of nuclear radiative output on the scales 0.01-0.1 Myr and the distribution of intergalactic medium (Morganti, 2017; Knese et al., 2020; Keel et al., 2022, and references therein).
One of the largest EELR among low-redshift radio-quiet AGN was recently found around Teacup galaxy (SDSS J143029.88+133912.0). The galaxy was discovered by volunteers of the Galaxy Zoo project, its EELR was confirmed in follow-up spectroscopic observations (Gagne et al., 2011). This type-2 quasar was nicknamed due to the morphology of ionized gas bubbles that extend 10 kpc of the galactic centre in the shape of ‘handle’. Keel et al. (2017) considered Teacup as a fading AGN, whereas X-ray data have indicated that it is possible that no fading is required (Lansbury et al., 2018).
The Hubble Space Telescope (HST) imaging shows that the Teacup is a bulge-dominated galaxy, with a shell-like structure and a tidal tail, which have been interpreted as an indicative of merger 1–2 Gyr ago with a cold disk system and 1/10 mass ratio (Keel et al., 2015). Another interesting feature of this system is the presence of a giant outflow generated by small-scale radio jets and/or quasar winds (Harrison et al. (2015),(Keel et al., 2017)). This outflow appears to be responsible for the bubble-like morphology of the galaxy. The ionized gas kinematics of the outflow in the inner 15 kpc were studied several times using long-slit and 3D-spectroscopic technique (Keel et al., 2012; Gagne et al., 2014; Keel et al., 2017; Ramos Almeida et al., 2017). However, the stellar kinematics of the host galaxy is still unknown.
The long-slit Gran Telescopio Canarias (GTC) optical spectroscopy by Villar-Martín et al. (2018) reveals that the ionizied gas around Teacup extending up to 50 kpc in the H emission line. This giant nebula has been considered by the authors as reservoir of the circumgalactic medium populated by tidal debris produced by galactic merger events. The external gas is most likely photoionized by the nuclear radiation is significantly dynamical cold comparing with the inner 10–20 kpc region. The recent GTC deep image in the H emission line clearly demonstrates that the giant Teacup EELR ( kpc in a total size) elongates in the same direction with the main axis of the inner bubble and radio jet (Villar Martín et al., 2021). Several arcs and emission knots are visible up to kpc from the AGN. However, details of gas rotation pattern were still unknown (Villar-Martín et al., 2018, proposed that the gas maybe settled in a giant rotating disk).
The giant nebula is most likely photoionized by the nuclear radiation, however to construct their diagnostic diagrams Villar-Martín et al. (2018) accepted the ([O III] 5007)/(H) flux ratio similar with the value obtained early for the internal regions, due to the lack of a green lines in the GTC spectrum.
In this work we present results of new long–slit and 3D spectroscopic observations at the 6-m telescope of the Special Astrophysical Observatory of the Russian Academy of Sciences (SAO RAS) performed to solve the above-mentioned puzzles of the Teacup galaxy: properties of the host stellar population, the structure and the velocity field of the extended nebula, including direct estimation of its ionization state. Following (Villar-Martín et al., 2018), we accepted Teacup redshift that corresponds to the distance Mpc ( = 71 kms-1 Mpc-1) and a spatial scale 1.58 kpc arcsec-1.
2 Observations and data analysis
The observations were carried out at the prime focus of the SAO RAS 6m telescope with the SCORPIO-2 multi-mode focal reducer(Afanasiev and Moiseev, 2011). The detector was CCD E2V 42-90 . The observations in the long-slit mode performed with the slit and the scale px, other parameters are given in the Tab. 1 ( – total exposure, – mean seeing value, and are the spectral range and resolution). The position angle corresponds to the major axis of the nebula (Fig. 1). The initial data reduction were performed in a standard way as it was described in our previous papers (e.g. Egorov et al., 2018).
The 3D-spectroscopy mapping in the [O iii] emission line was carried out in the scanning Fabry-Perot interferometer (FPI) mode of SCORPIO-2 with the same low-resolution FPI that is usually used for the tunable filter imaging in the MaNGaL device (Moiseev et al., 2020). During the observations we subsequently obtained narrow band (the bandwidth Å) images with different central wavelength: 5 frames spanned the spectral range around the redshifted [O iii] line with the step Å and one frame in continuum at the central wavelength shifted on 24Å from this emission line. The field of view at the new detector CCD E2V 261-80 was sampled with a pixel scale and at the nights 2020 Apr 19 and Apr 24 respectively, other parameters are given in Tab. 1.
| Mode | Date of obs. | , s | , ′′ | , Å | , Å |
|---|---|---|---|---|---|
| Long-slit | 2018 Feb 11 | 2.2 | 3500–7220 | 5 | |
| FPI | 2020 Apr 19 | 3.2 | 5410–5470 | 13 | |
| FPI | 2020 Apr 24 | 1.6 | 5410–5470 | 13 |
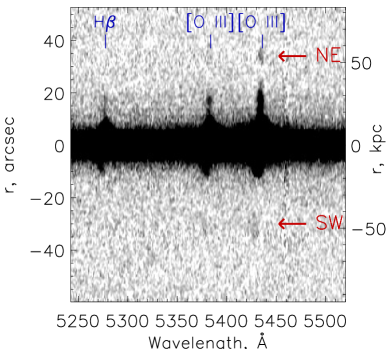
The preliminary data reduction (bias, flat-field correction, combining individual 90 s exposures with cosmic-ray hits cleaning) was performed with IDL-based software as described in Moiseev et al. (2020) for the MaNGaL scanning mode. The air-glow lines subtraction, photometric correction and phase-shift wavelength calibration were done with our software for SCORPIO-2/FPI data reduction (see description and references in Moiseev, 2021). The data obtained during two nights were merged in the single data cube containing low-resolution [O iii] spectra in each pixel with the size . The total exposure was about 2.4 h. The surface brightness of the most faint detected emission filaments is about .
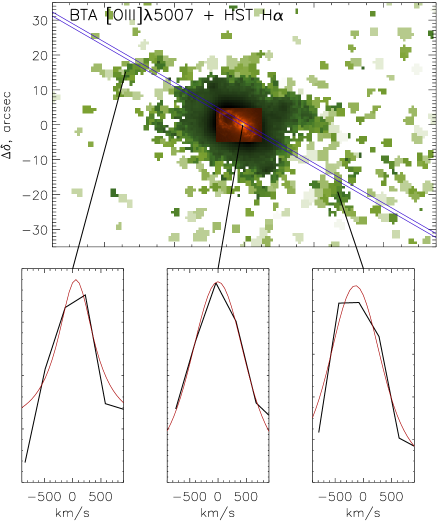
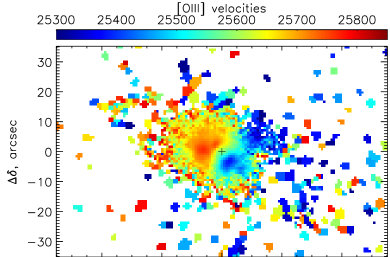
In order to improve signal-to-noise (S/N) ratio in the spectra of the faint outer region the Voronoi tessellation was used (Cappellari and Copin, 2003). The emission line in the binned data cube was fitted with Voigt function that provides a good approximation of the observed FPI spectra (Moiseev and Egorov, 2008). The example of emission line profiles together with the [O iii] flux maps (in the binned and original resolution) and line-of-sight velocity field is shown in Fig. 1.
3 The stellar population properties and kinematics
The observed long-slit spectra contain the combination of the ionized gas emission and stellar absorption lines. We used penalized pixel-fitting (pPXF) method to fit a stellar population spectrum (Cappellari, 2017), using MILES stellar spectral library by Vazdekis et al. (2010) covering the range 3525–7500Å with a twice higher spectral resolution than in the SCORPIO-2 data. In order to improve the signal-to-noise ratio, the spectra used for the pPXF analysis were binned along the slit using the step exponentially increasing with radius: from 2 px () bins in the nucleus up to 10 px () at the distances from the center. The example of the observed Teacup spectrum fitted by pPXF model is shown in Fig. 2.
Fig. 3 shows the distribution along the spectrograph’s slit of the stellar line-of-sight velocities, age and metallicity derived from the description of the SCORPIO-2 spectra by the single stellar population (SSP) pPXF model. This plot demonstrates that the inner (5–6.5 kpc) region is decoupled both in kinematic and stellar population properties from the outer host galaxy. The luminosity–averaged age of stars in the central region is significantly younger comparing with outer part of the galaxy ( vs 7–9 Gyr) and has a near solar metallicity typical for the recent burst of star formation, whereas [M/H] in the outer region that is typical for the “red-sequence” early-type galaxy.
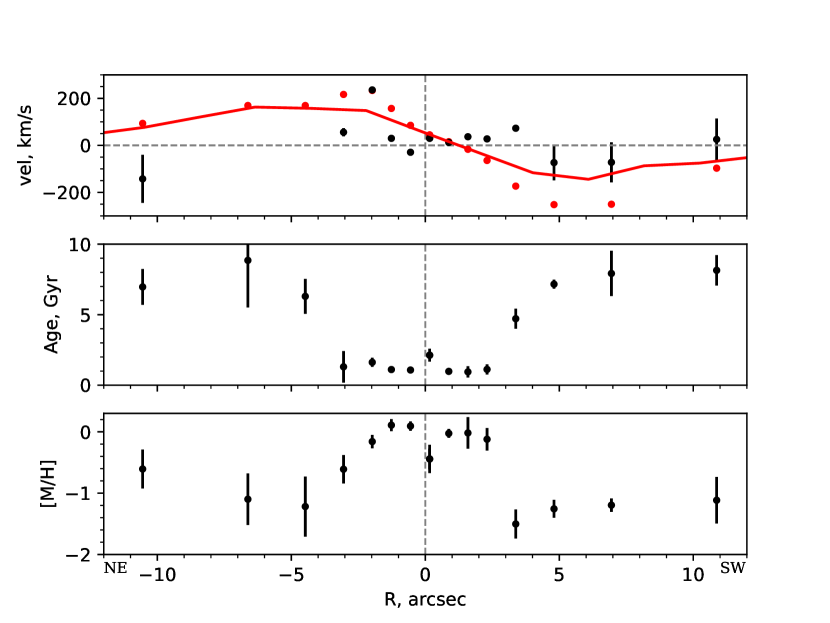
The flux and velocity of the ionized gas emission lines were derived via Gaussian fitting of galactic spectra after subtraction of the pPXF model in each radial bin. During this procedure we accepted the same line-of-sight velocity separately for the system of the forbidden ([O iii], [N ii], [S ii]) and the Balmer hydrogen lines. The top panel in the Fig. 3 demonstrates an agreement between velocities of the forbidden lines in the SCORPIO-2 long-slit spectrum (red points) and a pseudo-slit cut through the FPI velocity field (red line) if the differences in the spatial and spectral resolutions will be taken into account.
According to our Gaussian fitting results the mean flux ratio of the brightest Balmer lines at (H(H)= is in a good agreement with the ‘standard’ value of an intrinsic Balmer decrement both for AGN and H ii-regions ( and 2.86, see Groves et al. (2012) for review). For this reason, we did not correct the observed spectrum for interstellar dust extinction. The reddening map presented in Gagne et al. (2014) reveals that the significant extinction (possibly related to a circumnuclear dust lane) is detected in the inner . This region is a poorly resolved in our long-slit data with a seeing value .
The kinematic of stars is significantly differing from the gaseous component: in the inner the radial gradient of stellar line-of-sight velocities is near zero with a hint of slow counter-rotation in the SW part of the velocity distribution. Such kinematic feature is indicative of a multi-spin galaxy where the gas and stars rotate in different planes and/or in different directions. Indeed, an absence of a velocity gradient should be observed if we put a slit along the rotating disk minor axis, or if an unresolved counter-rotating stellar component presents in the kinematically distinct core Young et al. (2018); Gasymov and Katkov (2022). Both features are unsurprising after galactic merging or accretion of the external gas by early type host galaxy Sil’chenko et al. (2019).
4 The gas ionization
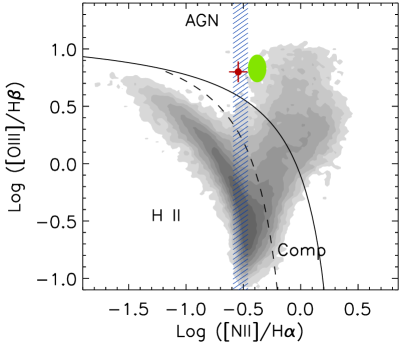
To discriminate the gas excitation mechanism the BPT (after (Baldwin et al., 1981)) diagnostic diagrams of the emission line flux ratios were widely used. In the previous work Villar-Martín et al. (2018) argued that even the very external regions of the Teacup giant nebula is illuminated by the AGN ionized radiation. However, the GTC spectra did not cover the green region. It was the reason why in Villar-Martín et al. (2018) a very important ([O III] 5007)/(H) line ratio for the giant EELR was accepted the same with the nuclear value.
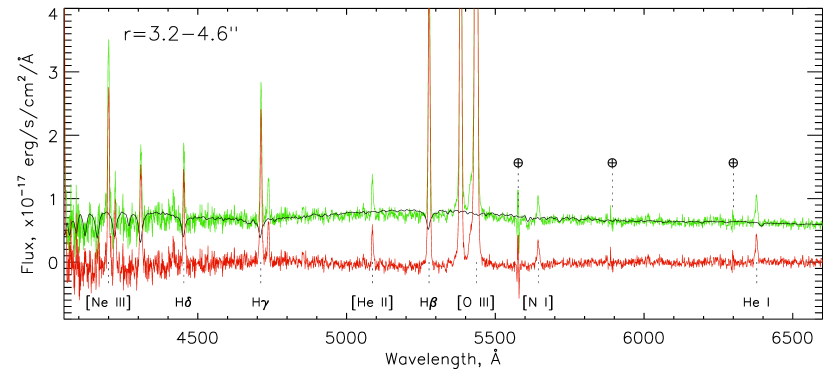
In our 6-m telescope spectrum we were able to detect the [O iii] line in the emission arcs up to kpc (fig. 4, left). The flux in the H was also estimated in the integrated spectrum on distances (19–41 kpc). This gives the direct estimation of the ([O III] 5007)/(H)= that agrees in the errors with prediction in Villar-Martín et al. (2018). The diagram ([O III] 5007)/(H) vs ([N II])/(H) (fig. 4, right) clearly demonstrates that the observed line ratios both for the central and external parts of the giant nebula corresponds to AGN-type ionizaion. Here we used ([O III] 5007)/(H) and ([N II])/(H) ratios derived from the 6m and GTC observations respectively and accepted that the ([N II])/(H) ratio in the NE region at is the same as in the integrated GTC spectral measurements in two apertures at and according Villar-Martín et al. (2018).
The similar situation is in other BPT-diagramms presented in Villar-Martín et al. (2018): the line ratios of the emission lines in the Teacup EELR clearly corresponds to the ionization by UV-radiation of the central QSO.
5 The extended nebula: morphology and kinematics
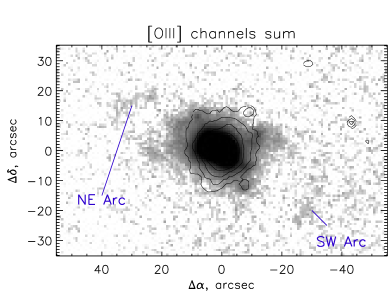
At the first glance, the distribution of the ionized gas derived in SCORPIO-2 observations looks similar with the deep H emission line images recently published in Villar Martín et al. (2021): the whole emission structure up to ( kpc) possesses the inner bubble ( kpc) and distant emission patches and filaments at ( kpc). The giant emission nebula is elongated in the same position angle with the radio jet direction ( Harrison et al. (2015)). However, the image in the hydrogen recombination line H reveals the characteristic Arc+Cavity structure in the NE side of the nebula, and very faint straight filament in the SW direction. In contrast with this picture, on the image in the high excited forbidden [O iii] line (fig. 1) we see the arc-like structure in the SE side too. It seems to be symmetric with the NE arc in an agreement with Villar Martín et al. (2021) suggestion that the large scale morphology of the nebula is influenced by AGN.
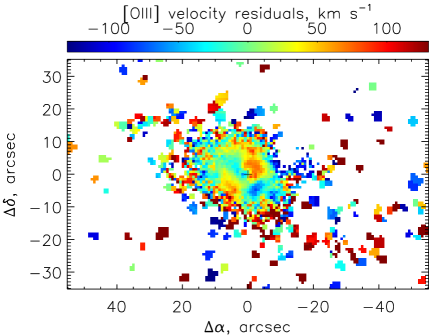
We tried to describe the observed line-of-sight ionized gas velocity distribution by the model of a regular circular rotation using our adaptation of a classical ‘tilted-ring’ technique (see Sil’chenko et al., 2019; Moiseev, 2021, and references therein). The mean parameters of the gaseous disk orientation were determined from the central part of the velocity field (): inclination and the position angle . Fig. 5 shows the radial variations of the main model parameters: the circular rotation velocity and kinematic position angle for the fixed values of the inclination () and systemic velocity. The was also fixed for large radii () in order to avoid unstable approximation in a sparse velocity field regions.
It is possible that the rotation curve presented in fig. 5 is affected by non-circular motions, first of all in the central kpc (location of the giant bubble – ‘teacup handle’). This fact is indicated by both the radial changes and maps of the residual velocities (fig. 5, right) with well-ordered patches of negative and positive values. The maximal value of the deviations from the mean rotation () could be considered as the lower limit on the speed of a large-scale outflow, the projection effect can increase this value. Note that the amplitude of these non-circular motions along line-of-sight is significantly smaller than at the corresponded distances.
The spread of velocity measurements in the faint distant regions prevents us from interpretation of its velocity residuals. Nevertheless, we can conclude that the gas in both NE and SW arcs lies on the common flat rotation curve with an amplitude .

6 Discussion
There is no doubt that the stellar morphology of the Teacup galaxy reveals the footprint of a merger event (sec. 1). The observed shell-like narrow tidal features could be either a result of minor merger (mass ratio ) of a cold disk system with a massive elliptical galaxy Thomson (1991); Feldmann et al. (2008), either a moderate merger of two disk galaxies (mass ratio , Petersson et al. (2022)). In the both cases, the lifetime of the observed stellar arcs can be about 1–2 Gyr.
In Sec. 3 we find out that the stellar population in the center of galaxy ( kpc) are significantly younger (SSP age Gyr) and metal richer ([M/H]) comparing the outer host (SSP age Gyr, [M/H]). These age of the central starburst put in the above range of the merger age. It indicates that the star formation possible triggered by interaction, as it predicted in numerous simulations (Petersson et al. (2022) and references therein). It is appearing that the same interaction event fed the AGN. In this case, we do not exclude that the central star formations was partly a result of AGN outflow positive feedback. For instance, (Keel et al., 2015) found several candidates for young star clusters in the inner 8 kpc region, outside the ionization cone boundaries.
The ionized gas distribution agrees with the picture suggested by (Villar Martín et al., 2021) for this and other optically selected Type-2 quasars: in the systems undergoing interaction or merging the ionized gas spread at over large spatial scales (10–90 kpc) and illuminated by the AGN. Using the long-slit spectroscopy we directly measured the indicative line ratio ([O III] 5007)/(H) in the external regions (19-41 kpc) of the Teacup nebula for the first time. Our result fully confirmed the previous suggestion about domination of the AGN ionization even on these distances (Villar-Martín et al., 2018).
The analysis of the [O iii] velocity field demonstrates that the gas kinematics can be described in the model of a global rotating disk with the line-of-nodes major axis . This value is significantly differed from the orientation of the stellar continuum isophotes (fig. 1): according to our estimation at . The same orientation of the red continuum isophotes is also appearing in fig. A.16 in Vazdekis et al. (2010). It implies that the gaseous disk is significantly inclined or even orthogonal to the stellar one, that also agrees with kinematically decoupling stars/gas according to long-slit data (sec. 3): stellar radial velocity gradient is near zero and significantly smaller than gaseous one, because the slit crosses the stellar host near its minor axis.
The domination of a regular circular rotation in the gaseous kinematics together with the multi-spin gas/stars configuration might constrain parameters of the interaction produced the Teacup galaxy. It is possible that in the most of the nebula we are observing not the main galaxy gas, spread by galactic interaction and outflow, but the matter accreted from a companion with a corresponded spin orientation.
The deep [O iii] emission line image reveals that the arc-like faint emission structure elongated according to the radio jet direction exists not only in NE direction, as it followed from the previous H map by Villar Martín et al. (2021), but appears also in SW at the same distance from the AGN (50–55 kpc). The shape of the both SW and NE arcs partly repeats the well-known inner emission bubbles, suggesting the possible origin. Could it be related to a previous AGN outflow?
There are different estimations of current AGN outflow velocities in the region of 10–12 kpc radio bubbles, spanning the range of (Gagne et al., 2014; Harrison et al., 2015; Ramos Almeida et al., 2017). If we accepted a conservative estimation according to the [O iii] residual velocity map (Sec. 5), then the dynamical age of the NE and SW arcs is Gyr. This value seems to be in a good agreement with age of a central star formation and minor/moderate merging. Therefore, our estimation does not contradict the fact that the most distant emission arcs around Teacup galaxy are related with the first QSO activity episode triggered by galactic interaction that also started a central burst of star formation. Moreover, it is possible that a circumnuclear starburst also contributed to the formation of the external emission arcs via a galactic wind (see López-Cobá et al. (2020) for review and observational examples). A more deep study of the external gas ionization properties and its kinematics (including the velocity dispersion distribution) are needed to separate the possible influence of AGN and starburst-driven wind and radio jet action on a formation of the emission arcs.
7 Conclusion
3D spectroscopy with scanning FPI is an old but very powerful technique to study different astrophysical objects. In this work we present new observational capabilities of the SAO RAS 6m telescope with the low-resolution FPI that was early used by our team as a tunable filter at 1–2.5m telescopes. The example of the giant nebula related with radio-quiet quasar known as the Teacup galaxy demonstrates that with this device we are able to map emission lines at the surface brightness level during 2 hours of exposures and even study the gas kinematics if the amplitude of velocity changes exceed 50–20.
The Teacup galaxy has been well studied, including multiwavelength data from X-ray to radio and integral-field spectroscopy in optical and near infrared. Nevertheless, using SCORPIO-2 long-slit and 3D spectroscopy we obtained the following new results:
-
•
The indicative line ratio ([O III] 5007)/(H) was directly estimated for the external regions (19–41 kpc) of the Teacup nebula. The obtained value lies in the range 0.7–0.9 presented in Gagne et al. (2014) for the nearest to the AGN region. Together with ([N II])/(H) ratio obtained early in GTC observations it confirms the domination of AGN radiation in gas ionization in good agreement with conclusion of the paper Villar-Martín et al. (2018).
-
•
Stars in the inner kpc are significantly younger and metal richer than the outer host galaxy. The starburst age ( Gyr) agrees with timescale of a merger event proposed in Keel et al. (2015).
-
•
The ionized gas velocity field can be described in the term of a circular rotating disk with a flat rotation curve up to distances 50–60 kpc. This disc appears to be significantly inclined or even polar to the stellar host galaxy.
-
•
The deep map of the [O iii] emission reveals two symmetric arcs in the external region of the EELR ( kpc). It might be a remnant of the previous AGN outflow (may be in a combination with a starburst-driven galactic wind) with the age Gyr.
An intriguing puzzle is an alignment of the line-of-nodes of the global rotating gaseous disk and radio jet (and ionization cone) direction. Whether is this a coincidence or a manifestation of a more powerful AGN influence on the surrounding gas than we expected? In any case, we hope that the results presented here will be useful for further detailed simulations of the Teacup system formation, including interaction with a companion and AGN feedback.
This research was funded by grant No075-15-2022-262 (13.MNPMU.21.0003) of the Ministry of Science and Higher Education of the Russian Federation.
Acknowledgements.
We obtained the observed data on the unique scientific facility “Big Telescope Alt-azimuthal” of SAO RAS. The long-slit observations were peformed by Dmitry Oparin. We thank the referees (Bobir Toshmatov and Sebastian Sánchez) and Cristina Ramos Almeida for their constructive comments and Aleksandrina Smirnova for her help in preparing the text. This work is dedicated to the memory of Victor Afanasiev, whose enthusiasm and work helped make these observations. Some of the data presented in this paper were obtained from the Mikulski Archive for Space Telescopes (MAST). This research made use of NASA’s Astrophysics Data System and the the NASA/IPAC Extragalactic Database (NED), which is operated by the Jet Propulsion Laboratory, California Institute of Technology, under contract with the National Aeronautics and Space Administration. \conflictsofinterestThe authors declare no conflict of interest. \abbreviationsAbbreviations The following abbreviations are used in this manuscript:| ASC | Advanced Camera for Surveys |
| EELR | Extended Emission-Line Regions EELR |
| FPI | Fabry-Perot interferometer |
| GTC | Gran Telescopio Canarias |
| HST | Hubble Space Telescope |
| SAO RAS | Special Astrophysical Observatory of the Russian Academy of Sciences |
| SSP | Single stellar population |
References
- Smirnova et al. (2018) Smirnova, A.A.; Moiseev, A.V.; Dodonov, S.N. A close look at the well-known Seyfert galaxy: extended emission filaments in Mrk 6. MNRAS 2018, 481, 4542–4547, [arXiv:astro-ph.GA/1809.05950]. https://doi.org/10.1093/mnras/sty2569.
- Morganti (2017) Morganti, R. Archaeology of active galaxies across the electromagnetic spectrum. Nature Astronomy 2017, 1, 596–605, [arXiv:astro-ph.GA/1709.01667]. https://doi.org/10.1038/s41550-017-0223-0.
- Knese et al. (2020) Knese, E.D.; Keel, W.C.; Knese, G.; Bennert, V.N.; Moiseev, A.; Grokhovskaya, A.; Dodonov, S.N. An [O III] search for extended emission around AGN with H I mapping: a distant cloud ionized by Mkn 1. MNRAS 2020, 496, 1035–1050. https://doi.org/10.1093/mnras/staa1510.
- Keel et al. (2022) Keel, W.C.; Moiseev, A.; Kozlova, D.V.; Ikhsanova, A.I.; Oparin, D.V.; Uklein, R.I.; Smirnova, A.A.; Eselevich, M.V. The TELPERION survey for distant [O III] clouds around luminous and hibernating AGN. MNRAS 2022, 510, 4608–4625, [arXiv:astro-ph.GA/2112.07084]. https://doi.org/10.1093/mnras/stab3656.
- Gagne et al. (2011) Gagne, J.; Crenshaw, D.M.; Keel, W.C.; Fischer, T.C. Optical Spectra of the Teacup AGN. In Proceedings of the American Astronomical Society Meeting Abstracts #217, 2011, Vol. 217, American Astronomical Society Meeting Abstracts, p. 142.12.
- Keel et al. (2017) Keel, W.C.; Lintott, C.J.; Maksym, W.P.; Bennert, V.N.; Chojnowski, S.D.; Moiseev, A.; Smirnova, A.; Schawinski, K.; Sartori, L.F.; Urry, C.M.; et al. Fading AGN Candidates: AGN Histories and Outflow Signatures. ApJ 2017, 835, 256, [arXiv:astro-ph.GA/1612.06006]. https://doi.org/10.3847/1538-4357/835/2/256.
- Lansbury et al. (2018) Lansbury, G.B.; Jarvis, M.E.; Harrison, C.M.; Alexander, D.M.; Del Moro, A.; Edge, A.C.; Mullaney, J.R.; Thomson, A.P. Storm in a Teacup: X-Ray View of an Obscured Quasar and Superbubble. ApJ 2018, 856, L1, [arXiv:astro-ph.GA/1803.00009]. https://doi.org/10.3847/2041-8213/aab357.
- Keel et al. (2015) Keel, W.C.; Maksym, W.P.; Bennert, V.N.; Lintott, C.J.; Chojnowski, S.D.; Moiseev, A.; Smirnova, A.; Schawinski, K.; Urry, C.M.; Evans, D.A.; et al. HST Imaging of Fading AGN Candidates. I. Host-galaxy Properties and Origin of the Extended Gas. AJ 2015, 149, 155, [arXiv:astro-ph.GA/1408.5159]. https://doi.org/10.1088/0004-6256/149/5/155.
- Harrison et al. (2015) Harrison, C.M.; Thomson, A.P.; Alexander, D.M.; Bauer, F.E.; Edge, A.C.; Hogan, M.T.; Mullaney, J.R.; Swinbank, A.M. Storm in a “Teacup”: A Radio-quiet Quasar with 10 kpc Radio-emitting Bubbles and Extreme Gas Kinematics. ApJ 2015, 800, 45, [arXiv:astro-ph.GA/1410.4198]. https://doi.org/10.1088/0004-637X/800/1/45.
- Keel et al. (2012) Keel, W.C.; Chojnowski, S.D.; Bennert, V.N.; Schawinski, K.; Lintott, C.J.; Lynn, S.; Pancoast, A.; Harris, C.; Nierenberg, A.M.; Sonnenfeld, A.; et al. The Galaxy Zoo survey for giant AGN-ionized clouds: past and present black hole accretion events. MNRAS 2012, 420, 878–900, [arXiv:astro-ph.CO/1110.6921]. https://doi.org/10.1111/j.1365-2966.2011.20101.x.
- Gagne et al. (2014) Gagne, J.P.; Crenshaw, D.M.; Kraemer, S.B.; Schmitt, H.R.; Keel, W.C.; Rafter, S.; Fischer, T.C.; Bennert, V.N.; Schawinski, K. Spatially Resolved Spectra of the “Teacup” Active Galactic Nucleus: Tracing the History of a Dying Quasar. ApJ 2014, 792, 72, [arXiv:astro-ph.GA/1407.1729]. https://doi.org/10.1088/0004-637X/792/1/72.
- Ramos Almeida et al. (2017) Ramos Almeida, C.; Piqueras López, J.; Villar-Martín, M.; Bessiere, P.S. An infrared view of AGN feedback in a type-2 quasar: the case of the Teacup galaxy. MNRAS 2017, 470, 964–976, [arXiv:astro-ph.GA/1705.07631]. https://doi.org/10.1093/mnras/stx1287.
- Villar-Martín et al. (2018) Villar-Martín, M.; Cabrera-Lavers, A.; Humphrey, A.; Silva, M.; Ramos Almeida, C.; Piqueras-López, J.; Emonts, B. A 100 kpc nebula associated with the ‘Teacup’ fading quasar. MNRAS 2018, 474, 2302–2312, [arXiv:astro-ph.GA/1711.02529]. https://doi.org/10.1093/mnras/stx2911.
- Villar Martín et al. (2021) Villar Martín, M.; Emonts, B.H.C.; Cabrera Lavers, A.; Bellocchi, E.; Alonso Herrero, A.; Humphrey, A.; Dall’Agnol de Oliveira, B.; Storchi-Bergmann, T. Interactions between large-scale radio structures and gas in a sample of optically selected type 2 quasars. A&A 2021, 650, A84, [arXiv:astro-ph.GA/2103.06805]. https://doi.org/10.1051/0004-6361/202039642.
- Afanasiev and Moiseev (2011) Afanasiev, V.L.; Moiseev, A.V. Scorpio on the 6 m Telescope: Current State and Perspectives for Spectroscopy of Galactic and Extragalactic Objects. Baltic Astronomy 2011, 20, 363–370, [arXiv:astro-ph.IM/1106.2020].
- Egorov et al. (2018) Egorov, O.V.; Lozinskaya, T.A.; Moiseev, A.V.; Smirnov-Pinchukov, G.V. Star formation complexes in the ‘galaxy-sized’ supergiant shell of the galaxy HolmbergI. MNRAS 2018, 478, 3386–3409, [arXiv:astro-ph.GA/1805.00315]. https://doi.org/10.1093/mnras/sty1158.
- Moiseev et al. (2020) Moiseev, A.; Perepelitsyn, A.; Oparin, D. Mapper of Narrow Galaxy Lines (MaNGaL): new tunable filter imager for Caucasian telescopes. Experimental Astronomy 2020, 50, 199–214, [arXiv:astro-ph.IM/2005.14598]. https://doi.org/10.1007/s10686-020-09672-x.
- Moiseev (2021) Moiseev, A.V. Scanning Fabry-Perot Interferometer of the 6-m SAO RAS Telescope. Astrophysical Bulletin 2021, 76, 316–339, [arXiv:astro-ph.IM/2109.01802]. https://doi.org/10.1134/S1990341321030081.
- Cappellari and Copin (2003) Cappellari, M.; Copin, Y. Adaptive spatial binning of integral-field spectroscopic data using Voronoi tessellations. MNRAS 2003, 342, 345–354, [arXiv:astro-ph/astro-ph/0302262]. https://doi.org/10.1046/j.1365-8711.2003.06541.x.
- Moiseev and Egorov (2008) Moiseev, A.V.; Egorov, O.V. Reduction of CCD observations made with the Fabry-Perot scanning interferometer. II. Additional procedures. Astrophysical Bulletin 2008, 63, 181–192, [arXiv:astro-ph/0805.2367]. https://doi.org/10.1134/S1990341308020089.
- Cappellari (2017) Cappellari, M. Improving the full spectrum fitting method: accurate convolution with Gauss-Hermite functions. MNRAS 2017, 466, 798–811, [arXiv:astro-ph.GA/1607.08538]. https://doi.org/10.1093/mnras/stw3020.
- Vazdekis et al. (2010) Vazdekis, A.; Sánchez-Blázquez, P.; Falcón-Barroso, J.; Cenarro, A.J.; Beasley, M.A.; Cardiel, N.; Gorgas, J.; Peletier, R.F. Evolutionary stellar population synthesis with MILES - I. The base models and a new line index system. MNRAS 2010, 404, 1639–1671, [arXiv:astro-ph.CO/1004.4439]. https://doi.org/10.1111/j.1365-2966.2010.16407.x.
- Groves et al. (2012) Groves, B.; Brinchmann, J.; Walcher, C.J. The Balmer decrement of Sloan Digital Sky Survey galaxies. MNRAS 2012, 419, 1402–1412, [arXiv:astro-ph.CO/1109.2597]. https://doi.org/10.1111/j.1365-2966.2011.19796.x.
- Young et al. (2018) Young, L.M.; Serra, P.; Krajnović, D.; Duc, P.A. The diversity of atomic hydrogen in slow rotator early-type galaxies. MNRAS 2018, 477, 2741–2759, [arXiv:astro-ph.GA/1802.09495]. https://doi.org/10.1093/mnras/sty536.
- Gasymov and Katkov (2022) Gasymov, D.; Katkov, I. Detailed study of galaxies with the stellar counter-rotation phenomenon. arXiv e-prints 2022, p. arXiv:2209.11240, [arXiv:astro-ph.GA/2209.11240].
- Sil’chenko et al. (2019) Sil’chenko, O.K.; Moiseev, A.V.; Egorov, O.V. The Gas Kinematics, Excitation, and Chemistry, in Connection with Star Formation, in Lenticular Galaxies. ApJS 2019, 244, 6, [arXiv:astro-ph.GA/1907.07261]. https://doi.org/10.3847/1538-4365/ab3415.
- Baldwin et al. (1981) Baldwin, J.A.; Phillips, M.M.; Terlevich, R. Classification parameters for the emission-line spectra of extragalactic objects. PASP 1981, 93, 5–19. https://doi.org/10.1086/130766.
- Kewley et al. (2006) Kewley, L.J.; Groves, B.; Kauffmann, G.; Heckman, T. The host galaxies and classification of active galactic nuclei. MNRAS 2006, 372, 961–976, [arXiv:astro-ph/astro-ph/0605681]. https://doi.org/10.1111/j.1365-2966.2006.10859.x.
- Kewley et al. (2001) Kewley, L.J.; Dopita, M.A.; Sutherland, R.S.; Heisler, C.A.; Trevena, J. Theoretical Modeling of Starburst Galaxies. ApJ 2001, 556, 121–140, [arXiv:astro-ph/astro-ph/0106324]. https://doi.org/10.1086/321545.
- Kauffmann et al. (2003) Kauffmann, G.; Heckman, T.M.; Tremonti, C.; Brinchmann, J.; Charlot, S.; White, S.D.M.; Ridgway, S.E.; Brinkmann, J.; Fukugita, M.; Hall, P.B.; et al. The host galaxies of active galactic nuclei. MNRAS 2003, 346, 1055–1077, [arXiv:astro-ph/astro-ph/0304239]. https://doi.org/10.1111/j.1365-2966.2003.07154.x.
- Thomson (1991) Thomson, R.C. Shell formation in elliptical galaxies. MNRAS 1991, 253, 256. https://doi.org/10.1093/mnras/253.2.256.
- Feldmann et al. (2008) Feldmann, R.; Mayer, L.; Carollo, C.M. Tidal Debris in Elliptical Galaxies as Tracers of Mergers with Disks. ApJ 2008, 684, 1062–1074, [arXiv:astro-ph/0801.4764]. https://doi.org/10.1086/590235.
- Petersson et al. (2022) Petersson, J.; Renaud, F.; Agertz, O.; Dekel, A.; Duc, P.A. From starburst to quenching: merger-driven evolution of the star formation regimes in a shell galaxy. arXiv e-prints 2022, p. arXiv:2210.16333, [arXiv:astro-ph.GA/2210.16333].
- López-Cobá et al. (2020) López-Cobá, C.; Sánchez, S.F.; Anderson, J.P.; Cruz-González, I.; Galbany, L.; Ruiz-Lara, T.; Barrera-Ballesteros, J.K.; Prieto, J.L.; Kuncarayakti, H. The AMUSING++ Nearby Galaxy Compilation. I. Full Sample Characterization and Galactic-scale Outflow Selection. AJ 2020, 159, 167, [arXiv:astro-ph.GA/2002.09328]. https://doi.org/10.3847/1538-3881/ab7848.