Effect of the initial microstructure on the pressure-induced phase transition in Zr and microstructure evolution
Abstract
The effect of initial microstructure and its evolution across the phase transformation in commercially pure Zr under hydrostatic compression has been studied using in situ x-ray diffraction measurements. Two samples were studied: one is plastically pre-deformed Zr with saturated hardness and the other is annealed. Phase transformation initiates at lower pressure for pre-deformed sample, suggesting pre-straining promotes nucleation by producing more defects with stronger stress concentrators. With transformation progress, the promoting effect on nucleation reduces while that on growth is suppressed by producing more obstacles for interface propagation. The crystal domain size reduces and microstrain and dislocation density increase during loading for both and phases in their single-phase regions. For phase, domain sizes are much smaller for prestrained Zr, while microstrain and dislocation densities are much higher. On the other hand, they do not differ much in -Zr for both prestrained and annealed samples, implying that microstructure is not inherited during phase transformation. The significant effect of pressure on the microstructural parameters (domain size, microstrain, and dislocation density) demonstrates that their postmortem evaluation does not represent the true conditions during loading. A simple model for the initiation of the phase transformation involving microstrain is suggested, and a possible model for the growth is outlined. The obtained results suggest an extended experimental basis is required for better predictive models for the pressure-induced and combined pressure- and strain-induced phase transformations.
keywords:
phase transition , Zr , x-ray diffraction , high-pressure , microstructure1 Introduction
It is well known that plastic deformation strongly affects phase transformations in various materials [1, 2, 3, 4, 5, 6, 7], however, its general understanding and quantitative descriptions are still lacking. For example, the well-known hcp () to simple hexagonal () phase transformation of Zr has been reported over a broad pressure range of 1.2 - 7 GPa [8, 9, 10, 11, 12, 3, 13], which shows largely scattered data from various researchers, some results are even contradictory. It is also found for various materials, including Zr, Ti, and Fe, that plastic straining (e.g., by hydroextrusion) prior to transformation increases pressure hysteresis under hydrostatic loading (defined as the difference between pressures for the initiation of the direct and reverse transformations) [3]. However, it is also reported that if transformation occurs during the plastic straining (e.g., during plastic shearing at high pressures), then the pressure hysteresis for phase transformation in Zr and Ti reduces down to zero [8, 3].
The early studies of the effect of plastic strain on phase transformations recognized that there could be different types of phase transformation under high pressure [1, 2], namely pressure-, stress-, and plastic strain-induced phase transformations. Both pressure-induced phase transformations under hydrostatic loading and stress-induced phase transformations under nonhydrostatic loading but below the macroscopic yield strength initiate at pre-existing defects in sample (e.g., dislocations and various tilt boundaries), which represent stress (pressure) concentrators. This implies that the initiation of phase transformation should depend on the initial micro-structure of sample. However, initial microstructure is seldom characterized or reported in high-pressure studies. This could be one of the reasons for the scattered date in the reported transformation pressure for many material (including Zr) by different researchers. Besides, microstructure itself may evolve even under hydrostatic pressures. In particular, dislocation core energy and structure, and elastic moduli change with pressure, which may lead to redistribution of dislocation configurations, increase in dislocation density, domain and grain refinement, etc., which can influence the initiation and progress of phase transformation. Even within liquid or gas pressure transmitting media, internal stresses due to various defects, like dislocations, twins, grain boundaries and their junctions, cause large local internal stresses with deviatoric/shear stress components, which may cause plastic deformations. Change in volume and shape during transformation causes strong internal stresses leading to significant plasticity, which in turn affects the phase transformation progress.
Plastic strain-induced phase transformations under high pressure occur during plastic flow by nucleation at new defects generated during plastic flow [1, 2]. They require completely different experimental characterization and thermodynamic and kinetic treatment, e.g. as described in the four-scale theoretical approaches [7] and the most advanced experimental measurements with rotational diamond anvil cell (DAC) on phase transformation in Zr [13]. Still, kinetic equation for the strain-induced phase transformations contains as a parameter phase transformation pressure under hydrostatic conditions [1, 2, 7]. Currently, the pressure for initiation of transformation under hydrostatic condition is used in this equation for describing experimental data [13] , while it depends on volume fraction of the high-pressure phase , microstructure, and plastic strain. This kinetics has been utilised in the macroscopic finite element analysis of strain-induced phase transformations in rotational DAC [14, 15, 16]. Thus, knowledge of the evolution of kinetics of volume fraction and microstructural parameters under hydrostatic conditions with pressure is important for the description of the strain-induced phase transformations as well.
There is a contradiction in understanding the effect of pre-existing plastic deformation on the pressure-induced transformation. As we mentioned, experiments in [3] report proportionality between the pressure hysteresis and material hardness, which is varied by varying plastic strain prior to transformation. Since plastic deformation increases the yield strength and hardness (which are related by a coefficient in the range from 0.333 to 0.386) with the plastic strain, it should increase pressure hysteresis. Assuming equal deviation of the pressures for direct and reverse transformations from the phase equilibrium pressure, this means that deviation increases with increasing plastic strain. This result was formalized in the theory for pressure- and stress-induced phase transformations in [17, 18, 19] and used there in the analytical solutions and in [20] for the finite element simulations. However, it is also known that dislocations serve as nucleation cites for the initiation of phase transformation [21, 1, 2], which is confirmed by more recent phase-field simulations [22, 23, 24, 25]. Consequently, increase in plastic strain increases number of dislocations and promote nucleation. Recent experiments [26] on phase transformation in Zr show that plastic compression by and prior to transformation shifts the entire kinetic curve to lower pressures with increasing plastic strain which contradicts the expected increase in pressure hysteresis. This was explained by increasing role of stress concentrators due to increasing activation of twinning in -Zr during the plastic compression.
With these motivations, we have studied the effect of the initial microstructure (domain size, microstrain, and dislocation density) produced by severe plastic deformation and annealing, respectively, and its evolution across the phase transformation in Zr under hydrostatic compression. We follow the program presented in the viewpoint article [6] and focus on two initial states: one is severely pre-deformed up to maximum hardness, which does not change with further plastic deformation, and the other is annealed at . To the best of our knowledge, so far there are no reports on the systematic experimental study of the microstructural evolution in Zr under high pressures. Note that studying materials with maximum saturated hardness significantly simplified understanding of strain-induced phase transformations [13].
2 Sample preparation
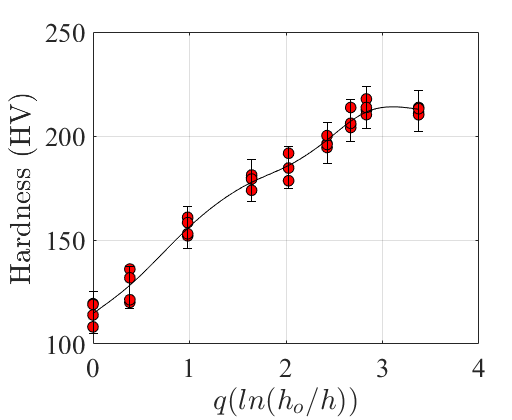
The material studied here is commercially pure (99.8%) Zr (Fe: 330 ppm; Mn: 27 ppm; Hf: 452 ppm; S: ppm; Nd: ppm) with an equiaxed grain size of 13 . Zr samples with varying initial microstructure were prepared from cold-rolled pure-Zr sample plastically deformed to saturated hardness. To achieve saturated hardness, initial sample (in the form of plate mm thick) was cold-rolled in several steps and at each step its Vickers hardness [27] was measured using LECO LM 247AT micro-indentation hardness tester at Metallography Laboratory at Iowa State University. The saturated hardness of was achieved at a final thickness of (Fig. 1). Several small pieces ( cm) were then cut from this cold-rolled thin sheet. Also, powdered sample was prepared by diamond filing of the sheet and subsequent grinding in mortal pastel for about 2 hours. These small pieces of sheets along with some amount of powdered Zr sample were then annealed in several batches to different annealing temperatures ranging from to in inert (Ar) environment and subsequently cooled down to ambient temperature at a rate of 100 per hour for each sample set. After annealing treatment, no further material-processing was done on the powdered sample and small pieces of sheets to avoid any further changes in the microstructure and retain same microstructure in the sheet and the powdered samples in each sample set.
3 Experimental Methods
Characterization of initial microstructure
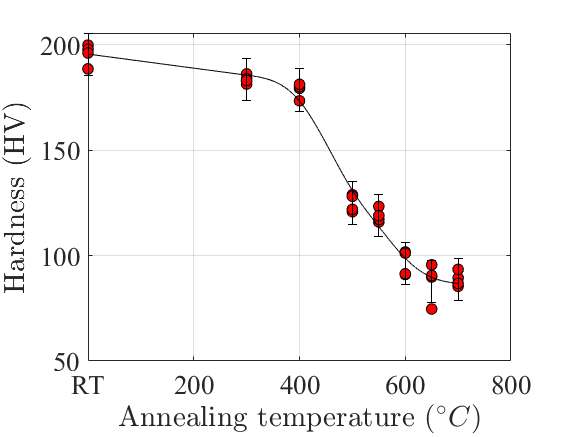
To characterize initial microstructure of each sample set, Vickers hardness measurements were carried out on the small pieces and x-ray diffraction (XRD) measurements were carried out on the powdered sample in each sample set. As shown in Fig. 2, Vickers hardness drastically reduces above annealing temperature and reaches a lowest hardness at annealing temperature above .
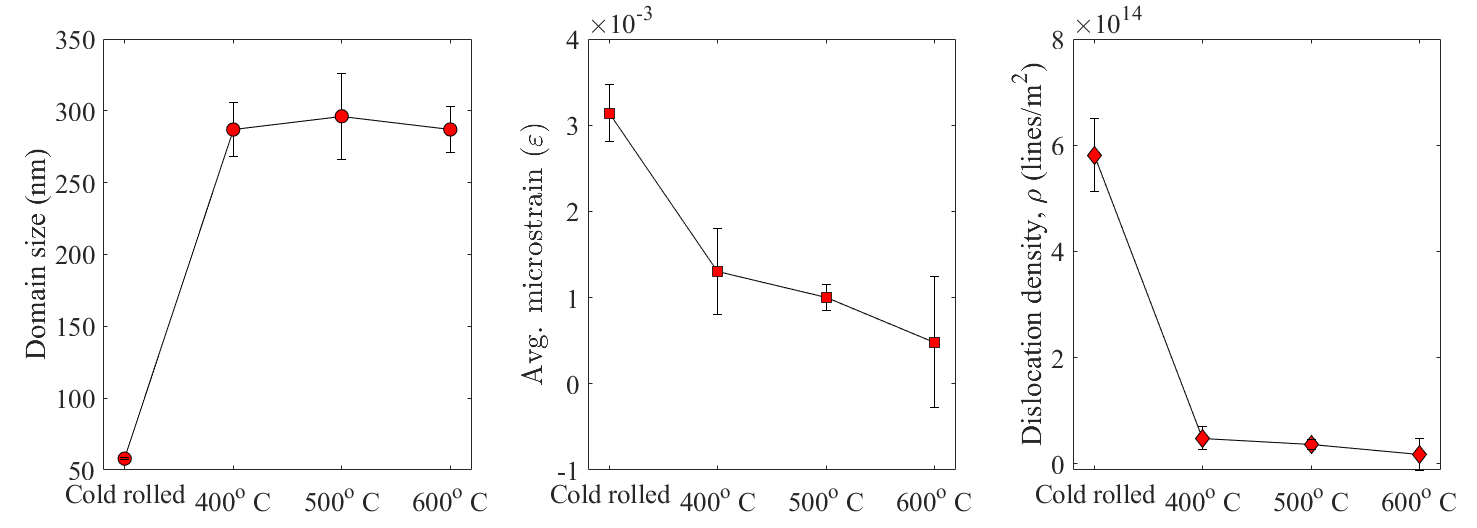
The XRD measurements were carried out on the powdered Zr samples from each sample set using monochromatic X-rays of wavelength at the bending magnet beamline 16-BM-D at Advanced Photon Source at Argonne National Laboratory, USA. The measurements were carried out in transmission geometry using a focused X-ray beam of size . Two-dimensional diffraction images were collected at Perkin Elmer flat panel detector and were coverted to one-dimensional diffraction pattern using FIT2D software [28, 29] and subsequently analyzed using GSAS-II [30] and MAUD [31] softwares. For sample-detector distance calibration and deconvolution of instrumental broadening, XRD data was recorded on NIST standard sample. Details of microstructural analysis using XRD and estimation of dislocation density is described in A. As shown in Fig. 3, the average crystalline domain size increases from to a saturated value of at annealing temperatures above . Average microstrain reduces nearly by an order of magnitude from 0.0031 for cold-rolled sample to 0.00049 for annealed sample at . Estimated dislocation density also reduces from to .
High-pressure studies
To study the effect of initial microstructure and its evolution on the high-pressure phase transition in Zr, we carried out high pressure hydrostatic compression experiments on the end member samples, i. e., the cold-rolled sample and the annealed sample. Silicone oil was used as pressure transmitting medium and Cu was used as pressure marker. Silicone oil is as good as methanol:ethanol mixture for low pressure <20 GPa and even better than methanol:ethanol mixture above 20 GPa [32]. Solidification of silicone oil under high pressures is not precisely reported as the process could be gradual with pressure in this case [33] though Klotz et al [34] have shown slight increase in standard deviation in pressure in DAC at 2.5 GPa which reduced at further higher pressures, which could be a signature of solidification. Torikachvili et al [33] have shown that even methanol:ethanol mixture solidifies at 6 GPa but is considered hydrostatic up to 12 GPa [34]. In the pressure range of our study non-hydrostatic stresses in silicone oil are negligible. Silicone oil can also be relatively easily loaded in diamond anvil cell (DAC) due to non-volatility. For high pressure experiments, sample chamber was prepared by drilling a hole of diameter at the center of pre-indented steel gasket thinned down from to . The culet size of diamond anvils used in high pressure cell was . The sample was loaded along with pressure marker and the pressure transmitting medium in the sample chamber. Pressure at sample was estimated using well-known equation of state of Cu [35]. Experiments were performed in our rotational DAC [36] in compression mode because using motorized loading in rotational DAC system allowed much smaller controllable load steps than membrane system for traditional DACs at beamline 16-BM-D. Thus, XRD images were recorded in pressure steps of 0.2 GPa in order to have sufficient data points across the phase transformation in Zr.
4 Results and discussion
As can be seen in Figs. 4 the , , and data for presure-dependence of the lattice parameters and and the unit cell volume for cold-rolled sample shows relatively lower compressibility as compared to the annealed sample for the Zr phase. For Zr phase, the , and data (Fig. 5), are very close to each other between the cold-rolled and annealed samples within the experimental errors. The lower linear and bulk compressibility of the cold-rolled -Zr could be due to a much smaller grain size (see below), more grain boundaries, and lower compressibility of the grain boundaries in comparison to the bulk crystal. For -Zr, due to the irreversibility of transformation, we were able to determine all the three curves for -Zr during unloading down to zero pressure, i.e., including a metastability region. During loading and unloading, the behavior of , , and are very close.
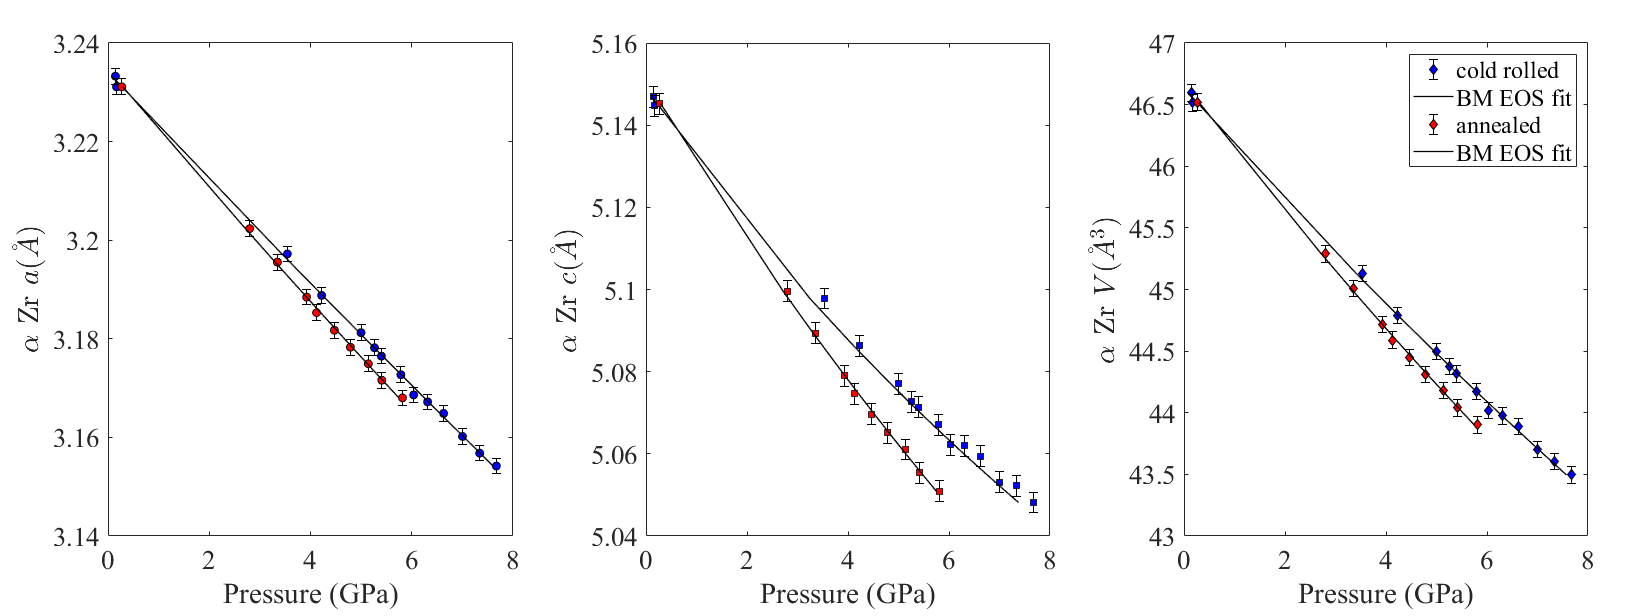
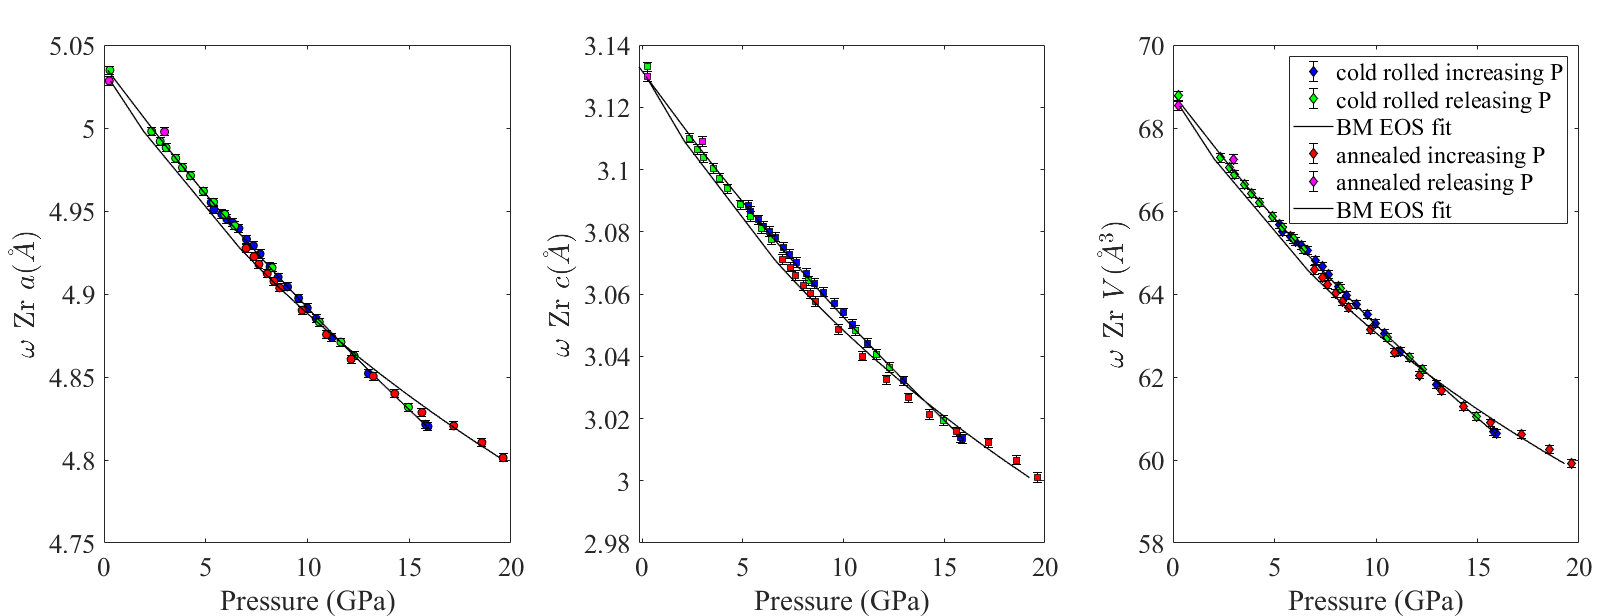
The Birch-Murnaghan equation of state has been fitted to the , and data for both and phases of Zr to obtain bulk and linear moduli and their pressure dependence. The obtained results are given in Table 1. While the , , and behaviors for Zr do not significantly differ visually for the cold-rolled and annealed samples, it turns out the difference in parameters in the Birch-Murnaghan equation is essential.
| Fitted parameters | cold rolled sample | annealed sample |
|---|---|---|
| Zr | ||
| Ambient unit cell volume () | 46.633(6) | 46.677(1) |
| Bulk modulus (GPa) | 99.9(3) | 86.5(1) |
| Pressure derivative | 2.4(9) | 2.6(8) |
| () | 3.234(1) | 3.234(7) |
| Linear modulus (GPa) | 294.2(7) | 264.0(6) |
| Pressure derivative | 3.3(5) | 4.6(4) |
| () | 5.149(0) | 5.151(2) |
| Linear modulus (GPa) | 280.6(8) | 247.5(5) |
| Pressure derivative | 29.8(3) | 16.9(5) |
| Zr | ||
| Ambient unit cell volume () | 68.824(9) | 68.801(3) |
| Bulk modulus (GPa) | 105.4(7) | 81.3(3) |
| Pressure derivative | 2.8(3) | 8.1(3) |
| () | 5.037(8) | 5.034(8) |
| Linear modulus (GPa) | 301.9(4)) | 244.4(4) |
| Pressure derivative | 8.2(2) | 22.0(5) |
| () | 3.131(6) | 3.132(4) |
| Linear modulus (GPa) | 347.3(6) | 253.0(5) |
| Pressure derivative | 9.3(8) | 28.5(7) |
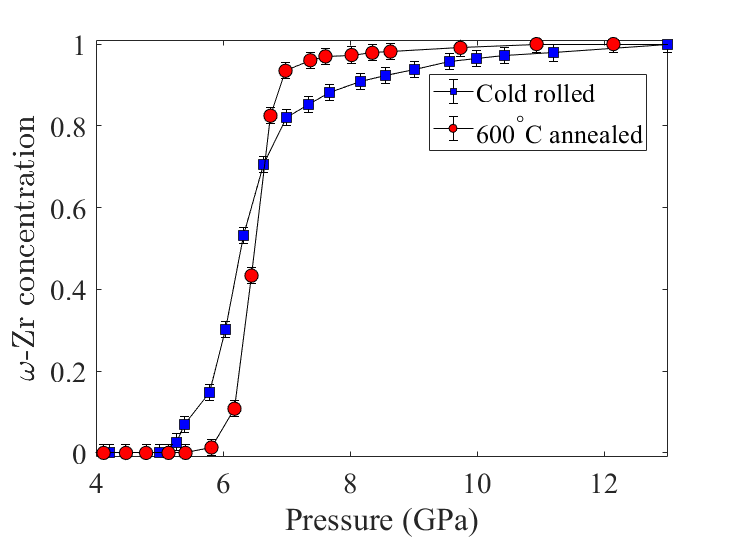
For cold-rolled sample with saturated hardness the phase transformation initiated at GPa and completed at GPa, whereas for the annealed sample, phase transformation initiation and completion pressures were GPa and GPa respectively (Fig. 6). The results suggest that large plastic straining prior to transformation promotes nucleation because of more and stronger stress concentrators (various dislocation configurations, twins, and grain boundaries) but suppresses growth by producing more obstacles (dislocation forest, point defects, grain boundaries) for interface propagation. Reverse phase transformation is not observed down to zero pressure for both samples, therefore the hypothesis of symmetric hysteresis enlargement due to plastic straining cannot be tested here. However, reduction in pressure for initiating the direct transformation clearly contradicts the proportionality of the pressure hysteresis and hardness suggested in [3] for multiple materials. A possible reason for this discrepancy is that results in [3] (see also more experimental detail in [38]) have been obtained in piston-cylinder by recording force-displacement curves without in situ XRD probing. Pressure is determined by force using calibration based on known pressure for phase transformation in bismuth. Thus, nucleation of small amount of high-pressure phase could not be detected and determination of pressure has significant error. Our results on reduction in pressure for initiation of -Zr in commercially pure Zr are similar to those for extra pure Zr in [26] after plastic compression by and prior to transformation. However, in [26] the entire kinetic curve is shifted to lower pressures with increasing plastic strain, i.e., there is not suppression of growth. This shows that the effect of plastic strain is non-monotonous, i.e., the small plastic strain does not produce obstacles for growth, but the large plastic strain, significantly reducing grain size and increasing the dislocation density, suppresses it. Thus, more detailed microstructure-related studies are required.
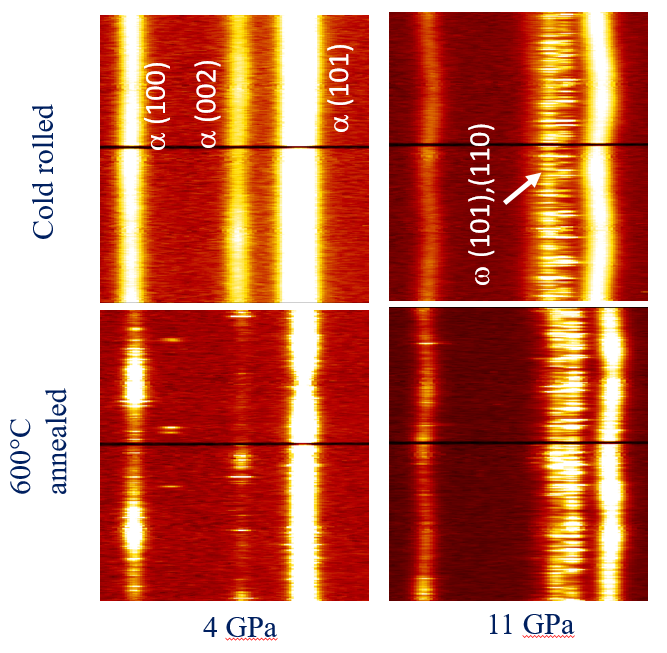
A closer look at the diffraction images (Fig. 7) shows that the diffraction rings are relatively smooth and broad for cold-rolled sample as compared to annealed sample, which suggests finer domain size in cold-rolled sample. For the annealed Zr the diffraction ring becomes smoother, suggesting reduction in domain size with pressure. Spotty data of Zr- phase is suggestive of grain growth across phase transition, in agreement with previous experiments [39].
Fig. 8 shows the results from microstructural analysis of XRD data for both and Zr across phase transition.
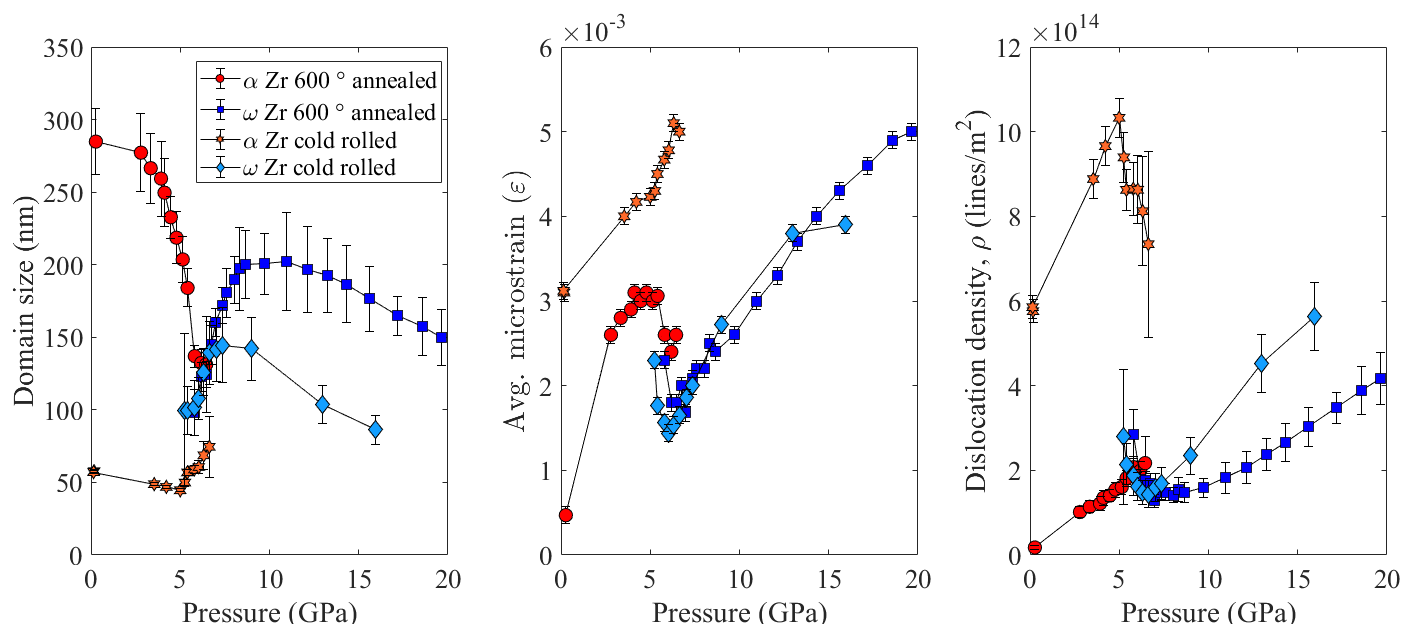
For cold-rolled sample, domain size decreases from to before phase transition whereas substantial reduction in domain size has been observed for the annealed sample from to , with very sharp reduction between 3.5 and 5.9 GPa. The domain size for phase at the initiation of phase transformation is for both the cases and increases to a maximum and for cold-rolled and annealed samples, respectively at 8 GPa pressure. At higher pressures, the domain size monotonously reduces up to the maximum pressure. Thus, in single-phase regions domain size reduces with pressure. The initial domain size of phase, , is independent of the plastic strain prior to transformation and probably characterizes size of operational nucleus, which will grow rather than collapse [21]. Growth of the domain size during phase transformation is probably related to growth of the transformed regions.
The microstrain in phase increases from to at transition point with some saturation near the transition point for the cold-rolled sample, and from to with some saturation and then drop to at the transition point for the annealed sample. The microstrain in phase is nearly same at the transformation initiation pressure for both the cases, for pre-deformed and for annealed samples. It reduces during phase transformation to for the cold-rolled sample and for the annealed sample, demonstrating stress relaxation caused by transformation strain and transformation-induced plasticity. Then it increases to for both samples at 13 GPa (the last available point for pre-deformed sample) and continues growing to for annealed sample at 20 GPa. In phase during the phase transformation, microstrain remains the same for annealed sample and grows in the pre-strained sample, showing that due to smaller yield strength in the annealed sample, stress relaxation is much more pronounced than in the pre-strained sample.
Dislocation density in phase increases linearly with pressure from to for the cold-rolled sample and from to for the annealed sample. During transformation, dislocation density in phase reduces with pressure down to for the cold-rolled sample and practically does not change for the annealed sample. In phase, dislocation density reduces during phase transformation from to for the cold-rolled sample and from to for the annealed sample. Then it increases to for the cold-rolled sample at 15.9 GPa (the last available point for pre-deformed sample) and to at 15.6 GPa and at 19.6 GPa for annealed sample.
All the above result demonstrate essential and complex evolution of microstructure for single phase samples and during phase transformation. Generally, crystal domain size, microstrain, and dislocation density do not differ in -Zr between the cold-rolled and annealed samples, implying that microstructure is not inherited during phase transformation. This may happen if moving - interfaces sweep away the entire microstructure (domains and dislocations) in the phase and new domains and dislocations are formed in the -Zr. The significant pressure effect on the microstructure demonstrates that their postmortem evaluation, e.g., with scanning and transmission electron microscopy, would not represent the true conditions during loading.
In the attempt to rationalize phase transformation initiation conditions using the above results, let us assume that averaged microstrain in phase generates local volumetric strain and maximum internal pressure at the phase transformation point of , for both samples, where is the strain concentration factor. Assuming that the total local pressure at phase transformation point, in both samples is the same,
| (1) |
where subscripts 1 and 2 designate cold-rolled and annealed samples, respectively, and are the applied pressure for the initiation of the phase transformation for these samples. Substituting GPa, GPa, , , , , we obtain , which is reasonable.
Extension of the model based on the microstrain for the growth stage is impossible because microstrain in phase increases for the pre-deformed sample and remains constant in the annealed sample, but growth in the pre-deformed sample is slower than in the annealed sample. The transformation pressure for the growth model can be based on the initial hardness or yield strength (like in [17, 18, 19, 20, 6]). Since , where is the domain size and is the dislocation density, resistance to growth can be connected to the domain size and dislocation density. The second term in the expression for is due to Hall-Patch effect and the third term is the Taylor’s strain hardening. The relationship between the deviation of the actual phase transformation pressure from the phase equilibrium pressure during growth stage and the yield strength seems reasonable because the deviation characterizes the resistance to a moving interface due to material’s microstructure and the yield strength characterizes the resistance to the motion of dislocations through the same microstructure. More experiments are required for calibration of the growth model.
5 Concluding remarks
In this paper, a detailed in situ study of the pressure-induced phase transformation in commercially pure Zr and evolution of microstructural parameters is performed for two initial microstructural states obtained by cold-rolling to the saturated maximum hardness and by annealing at . PT initiates at higher pressure for annealed sample as compared to cold-rolled sample, in agreement with experiments in [26] for small plastic straining prior to transformation and in contrast to general regularity suggested in [3] for multiple materials and used in the models in [17, 18, 19, 20, 6]. This implies that plastic straining prior to transformation promotes nucleation with more and stronger stress concentrators (various dislocation configurations, twins, etc) , in agreement with analytical [21, 1, 2] and computational [22, 23, 24, 25] studies. With phase transformation progress, promoting effect of prior straining reduces with crossover to suppressing effect at (pressure 6.6 GPa), above which volume fraction of -Zr for the same pressure is higher for the annealed sample. Completion pressure for transformation is higher for cold-rolled sample than for the annealed sample by 2 GPa suggesting that prior straining suppresses growth by producing more obstacles (dislocation forest, point defects, domain and grain boundaries) for interface propagation. The microstructure evaluated by averaged crystal domain size, microstrain, and dislocation density in sample evolves even under hydrostatic compression both in a single-phase state and during phase transformation. Domain size reduces, and microstrain and dislocation density increase during loading of both and phases in the single-phase regions. For phase, domain size are much smaller for cold-rolled Zr, while microstrain and dislocation density are much higher. On the other hand, they differ much less in -phase between cold-rolled and annealed Zr, implying that microstructure is not inherited during phase transformation. This may happen if moving - interfaces sweep away the entire microstructure (domains and dislocations) in the phase and new domains and dislocations/twins are formed in the -Zr. A simple model for initiating of the phase transformation involving microstrain is suggested, and possible model for the growth stage is outlined.
It was demonstrated that even under hydrostatic loading within a pressure-transmitting medium, there are various structural changes in single-phase materials and especially during phase transformation. They significantly affect both nucleation and growth and explain significant scatter in phase transformation data for the same material. Also, a significant pressure effect on the microstructural parameters demonstrate that their postmortem evaluation would not represent the true conditions during loading, therefore in-situ studies are of great importance.
The obtained results initiate the experimental basis for future predictive structural models for the pressure-induced phase transformations, and combined pressure- and strain-induced phase transformations. Comparison with results in [26] shows that the effect of pre-straining may be non-monotonous, and more structural states between annealed and maximally hardened should be studied for the same composition.
6 Acknowledgments
Supports of NSF (DMR-1904830 and CMMI-1943710) and the ISU (Vance Coffman Faculty Chair Professorship) are gratefully acknowledged. We thank Drs. M. T. Pérez-Prado and A. P. Zhilyaev for supplying us with commercially pure Zr purchased from Haines and Maassen (Bonn, Germany) that they studied. XRD measurements were performed at HPCAT (Sector 16), APS, Argonne National Laboratory. HPCAT operations are supported by DOE-NNSA Office of Experimental Sciences. The Advanced Photon Source is a U.S. Department of Energy (DOE) Office of Science User Facility operated for the DOE Office of Science by Argonne National Laboratory under Contract No. DE-AC02-06CH11357.
Appendix A
Microstructural analysis was carried out using Modified Rietveld technique [40, 41, 42] on the XRD patterns for each sample and each pressure step of high-pressure experiments. GSAS-II and MAUD softwares were used for the refinement of the crystal structure as well as microstructural parameters. First instrumental parameters viz. X-ray wavelength, sample detector distance, instrumental broadening parameters were obtained using XRD pattern of NIST standard sample. Subsequently microstructural parameters viz. average grain/domain size and microstrain and under isotropic size and strain model were refined for each phase of Zr at each pressure step. Using the obtained domain size and micro strain, dislocation density was estimated as
| (2) |
where and are contributions to dislocation density due to domain size and microstrain respectively [43]. Parameter is estimated as
| (3) |
where is the domain size as estimated from Rietveld refinement. Parameter is estimated as
| (4) |
where is material constant and given as , is lattice strain estimated to be same as average microstrain, is the modulus of the Burger’s vector, and are the Young’s modulus and shear modulus, is the radius of the crystal containing the dislocation, is a suitably chosen integration limit [43], is a factor depending on the shape of strain distribution and lies between the two extremes of a Cauchy () and Gaussian distribution (). For and Zr, moduli and and their pressure dependence has been taken from [44] and [45]. A reasonable value for has been taken as 4 [43].
For hexagonal systems there are thee different major slip systems that are related to the three glide planes: basal, prismatic, and pyramidal [46]. When taking into consideration different slip directions and the character of dislocations (edge and screw) in hcp crystals, there are eleven sub-slip-systems to consider. Generally, more than one sub-slip system is activated during plastic deformation of materials. Dislocations may also be populated in more than one slip system. For hexagonal systems, most populated ( ) is the basal slip system of type Burger’s vector [47, 48, 49]. However for Zr most dominant slip system are prismatic slip system [50, 51, 52, 53], again with Burger’s vector . For Zr, prismatic and basal slip system are the dominant slip system with Burger’s vector [54]. Hence using the Burger’s vectors for the most populated dislocations, overall dislocation density for each phase of Zr at each pressure step was obtained using equations 2,3 and 4. The obtained dislocation densities may not be the most accurate, but the trend of evolution with pressure and across the phase transformation in Zr is expected to be same even if it is estimated using other line profile fitting or whole powder pattern fitting methods.
References
References
- [1] V. I. Levitas, Continuum Mechanical Fundamentals of Mechanochemistry, in High Pressure Surface Science and Engineering, 159-292 (Institute of Physics, Bristol, 2004).
- [2] V. I. Levitas, High-Pressure Mechanochemistry: Conceptual Multiscale Theory and Interpretation of Experiments, Phys. Rev. B 70, 184118 (2004).
- [3] V. D. Blank and E. I. Estrin, Phase Transitions in Solids under High Pressure (CRC Press, Boca Raton, 2014).
- [4] K. Edalati and Z. Horita, A review on high-pressure torsion (HPT) from 1935 to 1988, Mat. Sci. Eng. A. 652, 325-352 (2016).
- [5] Y. Gao, Y. Ma, Q. An, V. I. Levitas, Y. Zhang, B. Feng, J. Chaudhuri, W. A. Goddard III , Shear strain driven formation of nano-diamonds at sub-gigapascals and 300 K, Carbon 146, 364-368 (2019).
- [6] V.I. Levitas, High pressure phase transformations revisited. Journal of Physics: Condensed Matter, 30, 163001 (2018).
- [7] V.I. Levitas, High-Pressure Phase Transformations under Severe Plastic Deformation by Torsion in Rotational Anvils. Material Transactions, 60, 1294-1301 (2019).
- [8] V. A. Zilbershtein, N. P. Chistotina, A. A. Zharov, N. S. Grishina, and E. I. Estrin, Alpha-omega transformation in titanium and zirconium during shear deformation under pressure, Fizika Metallov I Metallovedenie 39, 445–447 (1975).
- [9] S. Banerjee and P. Mukhopadhyay, Phase Transformations: Examples from Titanium and Zirconium Alloys, Pergamon Materials Series, 1st edition (Elsevier, Amsterdam, 2007).
- [10] M. T. Pérez-Prado and A. P. Zhilyaev, First experimental observation of shear induced hcp to bcc transformation in pure Zr, Phys. Rev. Lett. 102, 175504 (2009).
- [11] K. Edalati, Z. Horita, S. Yagi, and E. Matsubara, Allotropic phase transformation of pure zirconium by high-pressure torsion, Mat. Sci. Eng. A 523, 277–281 (2009).
- [12] A. P. Zhilyaev, I. Sabirov, G. González-Doncel, J. Molina-Aldareguía, B. Srinivasarao, and M. T. Pérez-Prado, Effect of Nb additions on the microstructure, thermal stability and mechanical behavior of high pressure Zr phases under ambient conditions, Mat. Sci. Eng. A 528, 3496–3505 (2011).
- [13] K. K. Pandey, V. I. Levitas, In situ quantitative study of plastic strain-induced phase transformations under high pressure: Example for ultra-pure Zr, Acta Materialia, 196, 338-346 (2020).
- [14] V. I. Levitas, O. Zarechnyy, Modeling and simulation of strain-induced phase transformations under compression in a diamond anvil cell. Phys. Rev. B., 82, 174123 (2010).
- [15] V. I. Levitas, O. Zarechnyy, Modeling and simulation of strain-induced phase transformations under compression and torsion in a rotational diamond anvil cell. Phys. Rev. B. 82, 174124 (2010).
- [16] B. Feng,V. I. Levitas, W. Li, FEM modeling of plastic flow and strain-induced phase transformation in BN under high pressure and large shear in a rotational diamond anvil cell. International Journal of Plasticity, 113, 236-254 (2019).
- [17] V.I. Levitas, Phase Transitions in Elastoplastic Materials: Continuum Thermomechanical Theory and Examples of Control. Part I. J. Mech. Phys. Solids, 45, 923-947 (1997).
- [18] V.I. Levitas, Phase Transitions in Elastoplastic Materials: Continuum Thermomechanical Theory and Examples of Control. Part II. J. Mech. Phys. Solids, 45, 1203-1222 (1997).
- [19] V.I. Levitas, Thermomechanical Theory of Martensitic Phase Transformations in Inelastic Materials. Int. J. Solids and Structures, 35, 889-940 (1998).
- [20] V.I. Levitas, A.V. Idesman, G.B. Olson, E. Stein, Numerical Modeling of Martensite Growth in Elastoplastic Material. Philosophical Magazine, A82, 429-462 (2002).
- [21] G .B.Olson, M. Cohen, Dislocation Theory of Martensitic Transformations. in F R N Nabarro (Ed.) Dislocations in Solids 7 , 297-407 (Elsevier Science Publishers BV 1986).
- [22] Y.C. Xu, W.F. Rao, J.W. Morris, A.G. Khachaturyan, Nanoembryonic thermoelastic equilibrium and enhanced properties of defected pretransitional materials, npj Computational Materials, 4, 58 (2018).
- [23] Y.C. Xu, C. Hu, L. Liu, J. Wang, W.F. Rao, J.W. Morris, A.G. Khachaturyan, A nano-embryonic mechanism for superelasticity, elastic softening, invar and elinvar effects in defected pre-transitional materials. Acta. Mater., 171, 240-252 (2019).
- [24] V. I. Levitas, M. Javanbakht, Phase field approach to interaction of phase transformation and dislocation evolution, Appl. Phys. Lett., 102, 251904 (2013).
- [25] M. Javanbakht, V.I. Levitas, Nanoscale mechanisms for high-pressure mechanochemistry: a phase field study. Journal of Materials Science, 53, 13343-13363 (2018).
- [26] M. A. Kumar, N. Hilairet, R.J. McCabe, T. Yu, Y. Wang, I.J. Beyerlein, C.N. Tomé, Role of twinning on the omega-phase transformation and stability in zirconium. Acta Materialia 185, 211–217 (2020).
- [27] R.L. Smith and G.E. Sandland, An Accurate Method of Determining the Hardness of Metals, with Particular Reference to Those of a High Degree of Hardness, Proceedings of the Institution of Mechanical Engineers, 1, 623–641 (1922).
- [28] A. P. Hammersley, Fit2d: An introduction and overview, in ESRF Internal Report, ESRF97HA02T (Institute of Physics, Bristol, 1997).
- [29] A. P. Hammersley, S. O. Svensson, M. Hanfland, A. N. Fitch, and D. Hausermann, Two-dimensional detector software: From real detector to idealised image or two-theta scan. High Press. Res. 14, 235–248 (1996).
- [30] B. H. Toby and R. B. Von Dreele, GSAS-II: the genesis of a modern opensource all purpose crystallography software package, J. Appl. Cryst. 46, 544–549 (2013).
- [31] M. Ferrari and L. Lutterotti, Method for the simultaneous determination of anisotropic residual stresses and texture by X-ray diffraction, J. Appl. Phys., 76, 11, 7246-55 (1994).
- [32] Y. Shen, R.S. Kumar, M. Pravica, and M. F. Nicol, Characteristics of silicone fluid as a pressure transmitting medium in diamond anvil cells, Rev. Sci. Inst. 75, 4450 (2004).
- [33] M. S. Torikachvili, S. K. Kim, E. Colombier, S. L. Bud’ko, and P. C. Canfield, Solidification and loss of hydrostaticity in liquid media, Rev. Sci. Inst. 86, 123904 (2015). used for pressure measurements
- [34] S Klotz, J-C Chervin, P Munsch, and G Le Marchand, Hydrostatic limits of 11 pressure transmitting media, J. Phys. D: Appl. Phys. 42, 075413 (2009).
- [35] A. Dewaele, P. Loubeyre and M. Mezouar, Equations of state of six metals above 94 GPa, Phys. Rev. B 70, 094112 (2004).
- [36] N. V. Novikov, L. K. Shvedov, Yu. N. Krivosheya, V. I. Levitas, New Automated Shear Cell with Diamond Anvils for in situ Studies of Materials Using X-ray Diffraction, Journal of Superhard Materials, 37, 1, 1-7 (2015).
- [37] J. Gonzalez-Platas, M. Alvaro, F. Nestola and R. Angel, EosFit7-GUI: a new graphical user interface for equation of state calculations, analyses and teaching, J. Appl. Cryst. 49, 1377-1382 (2016).
- [38] V. D. Blank, Y. S. Konyaev, V. T. Osipova, E. I. Estrin, Influence of phase hardening and plastic-deformation on the hysteresis of polymorphous transformation in alkali-halide crystals under pressure, Inorganic Materials 19, 72-76 (1983).
- [39] D Popov, N Velisavljevic, W Liu, R Hrubiak, C Park, G Shen, Real time study of grain enlargement in zirconium under room-temperature compression across the to phase transition Scientific reports 9, 1-7 (2019).
- [40] H. M. Rietveld, A profile refinement method for nuclear and magnetic structures, J. Appl. Cryst. 2, 65–71 (1969).
- [41] R. A. Young, The Rietveld Method, (International Union of Crystallography, Oxford University Press, 1993).
- [42] P. Mukherjee, A. Sarkar, M. Bhattacharya, N. Gayathri, P. Barat, Post-irradiated microstructural characterisation of cold-worked SS316L by X-ray diffraction technique, J. Nuclear Materials, 395, 37-44 (2009).
- [43] G. K. Williamson, R. E. Smallman, Dislocation densities in some annealed and cold-worked metals from measurements on the Xray debye-scherrer spectrum, Philos. Mag. 1, 34-46 (1956).
- [44] E. S. Fisher, M. H. Manghnani, T. J. Sokolowski, Hydrostatic Pressure Derivatives of the Single-Crystal Elastic Moduli of Zirconium, J. Appl. Phys. 41, 2991-2998 (1970).
- [45] W. Liu, B. Li, L. Wang, J. Zhang, Y. Zhao, Elasticity of -phase zirconium Phys. Rev. B 76, 144107 (2007).
- [46] G. Lutjering, J. Williams, A. Gysler, Microstructures and Mechanical Properties of Titanium Alloys (World Scientific: Singapore 2002).
- [47] I. C. Dragomir, T. Ungar, Contrast factors of dislocations in the hexagonal crystal system, J. Appl. Cryst. 35, 556-564 (2002).
- [48] Takashi Shintani, Yoshinori Murata, Yoshihiro Terada, Masahiko Morinaga, Evaluation of Dislocation Density in a Mg-Al-Mn-Ca Alloy Determined by X-ray Diffractometry and Transmission Electron Microscopy, Materials Transactions, 51,(6), 1067-1071 (2010).
- [49] Amos Muiruri ,Maina Maringa, Willie du Preez, Evaluation of Dislocation Densities in Various Microstructures of Additively Manufactured Ti6Al4V (Eli) by the Method of X-ray Diffraction, Materials , 13, 5355 (2020).
- [50] L. Capolungo, I. J. Beyerlein, G. C. Kaschner, C. N. Tomé, On the interaction between slip dislocations and twins in HCP Zr, Mater. Sci. Eng., A 513, 42-51 (2009).
- [51] G. C. Kaschner, C. N. Tomé, I. J. Beyerlein, S. C. Vogel, D. W. Brown, R. J. McCabe, Role of twinning in the hardening response of zirconium during temperature reloads, Acta Mater. 54, 2887-2896 (2006).
- [52] C. N. Tomé, P. J. Maudlin, R. A. Lebensohn, G. C. Kaschner, Mechanical response of zirconium-I. Derivation of a polycrystal constitutive law and finite element analysis, Acta Mater. 49, 3085-3096 (2001).
- [53] M. Knezevic, I. J. Beyerlein, T. Nizolek, N. A. Mara, T. M. Pollock, Anomalous Basal Slip Activity in Zirconium under High-strain Deformation, Mater. Res. Lett. 1, 133-140 (2013).
- [54] H. R. Wenk, P. Kaercher, W. Kanitpanyacharoen, E. Zepeda-Alarcon, Y. Wang, Orientation Relations During the Phase Transition of Zirconium: In Situ Texture Observations at High Pressure and Temperature, Phys. Rev. Lett. 111, 195701 (2013).