Long Spin Coherence and Relaxation Times in Nanodiamonds Milled from Polycrystalline 12C Diamond
Abstract
The negatively charged nitrogen-vacancy centre (NV-) in diamond has been utilized in a wide variety of sensing applications. The centre’s long spin coherence and relaxation times (, and ) at room temperature are crucial to this, as they often limit sensitivity. Using NV- centres in nanodiamonds allows for operations in environments inaccessible to bulk diamond, such as intracellular sensing. We report long spin coherence and relaxation times at room temperature for single NV- centres in isotopically-purified polycrystalline ball-milled nanodiamonds. Using a spin-locking pulse sequence, we observe spin coherence times, , up 786 200 s. We also measure times up to 2.06 0.24 s and times up to 4.32 0.60 ms. Scanning electron microscopy and atomic force microscopy measurements show that the diamond containing the NV- centre with the longest time is smaller than 100 nm. EPR measurements give an Ns0 concentration of 0.15 0.02 ppm for the nanodiamond sample.
I Introduction
The NV- centre has proven to be an effective tool in the fields of magnetometry [1, 2, 3, 4], thermometry [5, 6, 7, 8], electrometry [9, 10, 11] and radio-frequency (RF) field sensing [12, 13], amongst other sensing applications. Key properties of the electronic spin-1 system that make it favourable for sensing include optical spin readout, optical initialisation into the state and long spin coherence and relaxation times [14]. Furthermore, as nanodiamonds containing NV- centres are biocompatible [15], they show promise for biosensing, including intracellular imaging and sensing techniques [16, 17, 18, 6, 19, 20].
Of the various sensing methods that the NV- centre has been applied to, many are limited by one (or more) of the centre’s spin relaxation times: the inhomogeneous relaxation time, , the spin coherence time, , and the longitudinal relaxtion time, . For example, can limit the sensitivities of thermometry [21] and DC magnetometry [1, 22] whereas limits relaxometry measurement sensitivity [23, 24]. is not only a key parameter in many sensing schemes [22, 1, 25, 26], but also in the proposed use of nanodiamonds containing a single NV- for tests of fundamental physics [27, 28, 29, 30].
The spin coherence time of the NV- centre is heavily dependent on its host material. In bulk, chemical vapour deposition (CVD), low-nitrogen diamond, 1 s has been reported for a single centre at 3.7 K using a dynamical decoupling scheme tailored to nearby 13C nuclear spins [31]. This sample also yielded = 3.6 s. At room temperature, can be up to 6 ms in bulk CVD diamond [32, 33]. = 730 s, obtained with a Hahn-echo sequence, has been observed for a single centre at room temperature in bulk CVD diamond with natural 13C abundance [34]. This was extended to = 2.4 ms using dynamical decoupling [34], whereas = 1.8 ms has been measured for a single NV- centre using a Hahn-echo sequence in isotopically purified, ultrapure bulk CVD diamond [35].
Spin coherence and relaxation times in nanodiamond have so far been measured to be significantly shorter. This is thought to be due to interaction with spins on the surface of the nanodiamond, as well as the typically higher nitrogen concentration found in nanodiamond [36, 37, 38, 39]. Surface effects are particularly detrimental to the of NV- centres in nanodiamonds [38, 39].
The longest spin coherence time observed in nanodiamond (or microdiamond) to date is 708 s [40]. This measurement was made on a single NV- centre in a single-crystal, isotopically-purified, low-nitrogen, lithographically fabricated nanopillar. The pillars were 300-500 nm in diameter and 0.5-2 m in length. A version of these pillars (diameter = 500 nm and length = 2 m) yielded a single NV- time of 6.42 s [40]. = 468 s has been demonstrated for single NV- centres in smaller, 200 nm diameter, ball-milled nanodiamonds [41]. Milling allows for the quick production of a large mass of nanodiamond as 3D volumes of bulk diamond (e.g. a mass of 0.1 g) can be processed in one go, in contrast to the 2D approach of fabricating pillars. In a different milled nanodiamond sample with a mean diameter of 23 nm, of 0.44 s (extended to 1.27 s using radiowaves to drive substitutional nitrogen groups) has been reported [36]. = 1.25 ms was measured for a single NV- centre in such a nanodiamond [36]. NV- centres in commercial nanodiamonds with diameters of around 100 nm have been found to have times of 100 s or less [24].
We present long spin coherence and relaxation times for single NV- centres in small, 12C-isotopically-purified, polycrystalline, ball-milled nanodiamonds. We use 12C isotopically enriched diamond as our starting material to improve the NV- centres’ spin coherence times. 13C, with a natural isotopic abundance in diamond of 1.1, has a nuclear spin of and so is a source of decoherence to the NV- centre spin [35]. Using spin-locking, a pulse scheme shown to have applications including magnetometry [4], RF field sensing [13], paramagnetic spin bath cooling [42, 43] and dynamic nuclear polarisation (DNP) [44, 45], we observe spin-coherence times, , up to 786 200 s. Furthermore, we report values up to 4.32 0.60 ms and free-induction decay values up to 2.06 0.24 s.
II Methods
The nanodiamonds used in this study were ball-milled with silicon nitride, following the process described in [46]. The starting material was pieces from the edge of a CVD plate grown by Element Six. The plate was a single-crystal sample, grown for NV- magnetometry. The material from the plate’s edges, however, was polycrystalline. The sample was not irradiated or annealed.
Measurements on the single NV- centres were carried out on a home-built room-temperature confocal fluorescence microscope (CFM) running QUDI software [47]. The nanodiamonds were deposited onto an n-type silicon wafer with a coordinate system etched into the surface. The coordinate system allowed a specific nanodiamond, investigated on the CFM, to be located using scanning electron microscopy (SEM), in order to measure its dimensions. To deposit the nanodiamonds onto the surface of the wafer, a suspension of nanodiamonds in methanol was sonicated for thirty minutes before being sprayed into a vial through a nebuliser. The vial, now containing a cloud of nanodiamonds, was upturned over the wafer, allowing the nanodiamonds to fall onto the surface of the silicon. This method was found to give a reasonably even coverage of nanodiamonds across the surface of the wafer.
Microwaves, generated with a Keysight N5172B, were delivered to the NV- centre via a 20 m diameter wire, brought within roughly 20 m of the respective nanodiamond. Only nanodiamonds containing a single NV- centre were investigated. NV- centres were confirmed to be a single centre via Hanbury Brown and Twiss (HBT) experiments, where the second-order correlation function, , was below 0.5 in each case [48].
A static magnetic field was applied to the centre via a neodymium magnet, positioned such that the direction of the magnetic field was aligned with the nitrogen-vacancy axis. Mounting the magnet on a servo-controlled robotic arm allowed for precise control of the position and orientation of the magnet with respect to the nanodiamond. The field was chosen so that the energy gap between the = 0 and = sub-levels was approximately 2 GHz. This frequency was measured using continuous wave ODMR and corresponds to a magnetic field component parallel to the N-V axis, , of 62 mT at the NV- centre.
In a sample where 54 fluorescent sites were examined on the confocal microscope, 16 were confirmed to be single NV- centres via HBT experiments. As single NV- centres were the subject of this study, there was some selection bias in avoiding particularly bright spots that were likely to contain large numbers of NV- centres. It is not known how many nanodiamonds contained zero NV- centres as they do not fluoresce. The centres showed high levels of charge stability, with very few displaying charge state switching. As this was a nanodiamond sample, the N-V axis can lie in any orientation. However, the robotic arm used for aligning the magnet to the N-V axis has a relatively limited range of motion. Therefore, the specific NV- centres selected for spin coherence and relaxation time measurements were chosen because their N-V axis was in an orientation accessible to our magnetic field.
Five NV- centres in five different nanodiamonds were fully characterised in this study. was measured for each nanodiamond, as well as three measurements of using Hahn-echo, XY8-4 and spin-locking pulse sequences. was also measured for each NV-. The pulse sequences used to perform the measurements are displayed in Figure 1.
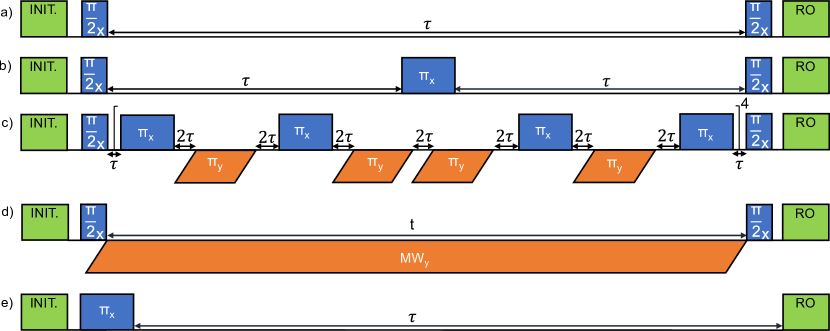
All of the pulse sequences displayed in Figure 1 begin and end with a 532 nm laser pulse. These are the initialisation (into the = 0 state) and readout pulses respectively. Figure 1a shows a Ramsey scheme, used to measure the inhomogeneous dephasing time, , of the NV- centre. The of a single NV- centre is primarily governed by slowly-varying magnetic and electric fields as well as strain and temperature fluctuations [22]. The Hahn-echo sequence, Figure 1b, largely negates these dephasing mechanisms. The pulse inverts the spin’s precession, and so phase accumulated during the first wait period is cancelled in the second [22]. This is provided that the timescale on which the noise varies is long compared to . The resulting decay constant, , is dominated by magnetic interaction with proximate spins.
In Figure 1c, the XY8 sequence, additional refocusing pulses mitigate the dephasing effects of magnetic noise fluctuating on shorter timescales [49]. The phase switching and time symmetry of the sequence means that the scheme is more resistant to errors in pulse length than, for example, a CPMG (Carr-Purcell-Meiboom-Gill) sequence [50, 51].
Figure 1d shows a spin-locking pulse sequence. Also referred to as ( in the rotating frame), it is considered to be the upper limit of that can be measured by a dynamical decoupling sequence, for a given microwave power [52][53]. After initialisation into the = 0 state, a pulse places the spin of the NV- centre into an equal superposition of = 0 and = 1. A long microwave pulse, phase-shifted by 90∘ to the pulse, continuously drives the spin, keeping it aligned along the y-axis of the Bloch sphere. The spin-state is optically read out following a further /2 pulse. Figure 1e shows the sequence.
III Results
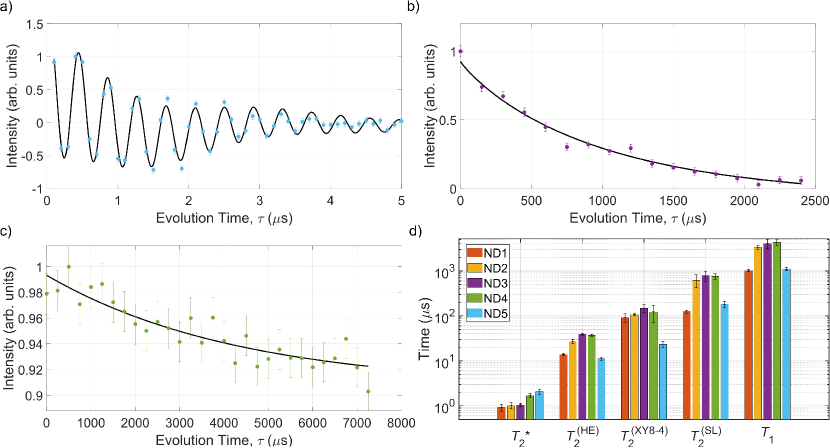
Of the five centres in this study, the longest recorded , and measurements are displayed in Figure 2a-c respectively. The longest measured was obtained via the spin-locking pulse sequence. Figure 2d shows , , , and measurements for each of the five NV- centres. We find that the same NV- centre (ND3) yields the longest times for , and , whereas the longest recorded and were obtained from two other centres (ND5 and ND4 respectively). It was found that spin-locking can increase by up to a factor of 5.7 relative to XY8-4. A sixth single NV- was partially characterised and was found to have = 12.4 0.5 s, comparable to ND1, ND2 and ND3. However, due to a combination of low centre fluorescence, low ODMR contrast and sample drift, it was not possible to make dynamical decoupling measurements at the same microwave power that had been used in measurements on the other five centres, or to measure its . No spin measurements were made for any other NV- centres from this nanodiamond sample.
Due to the aforementioned coordinate system on which the diamonds were deposited, it was possible to locate and measure the dimensions of ND4 ( = 1.71 0.20 s, = 759 s and = 4.32 ms) using atomic force microscopy (AFM) and SEM. The long and short axes of the diamond in the x-y plane were measured to be nm and nm respectively, as shown in Figure 3.
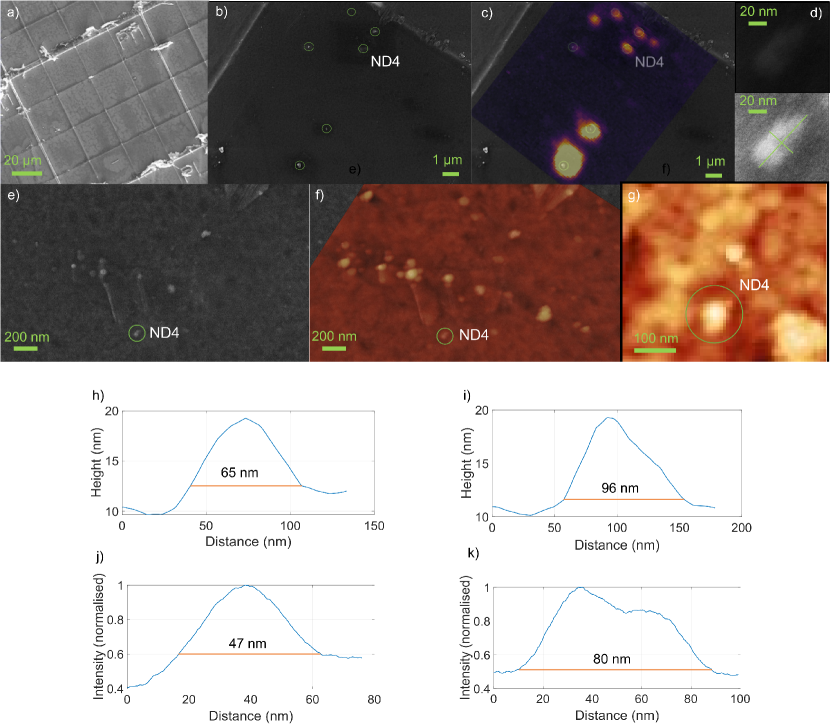
The height of ND4 was measured, using AFM, to be 7.8 1.1 nm. Therefore, the maximum distance that the NV- centre can be from a surface of the diamond is less than 5 nm. This is comparable to the dimensions of the diamonds investigated in [36] and far smaller than those studied in [40]. Unfortunately, due to a combination of surface contamination and nanodiamond agglomeration, it wasn’t possible to locate any of the other four diamonds referenced in Figure 2.
IV Discussion
To our knowledge, the values of s, s and ms are the longest measurements of these three characteristics for an NV- centre in nanodiamond. Furthermore, we believe that s is the longest reported for any electronic spin system in a nanoparticle. Although s has been reported for a single NV- in a high-purity fabricated diamond pillar, the diamond was microscale as opposed to nanoscale [40]. Many sensing applications for NV- centres in nanodiamond require nanodiamonds with diameters of around 100 nm or less, for example, those where the diamonds enter cells [56]. As our nanodiamonds were milled rather than etched, we efficiently created large quantities of nanodiamond, on the order of 0.1 g. On a similar note, polycrystalline CVD diamond is easier to grow than single crystal, as well as being cheaper.
The average (1.35 s) across the five NV- centres included in this study was longer than the average ensemble (1.13 s) measured for a bulk sample of isotopically-purified, electron-irradiated-and-annealed, polycrystalline CVD diamond with a subsititutional nitrogen impurity concentration of 16 ppm [57]. Using EPR, the Ns0 concentration of our sample was measured to be 0.15 0.02 ppm. This lower nitrogen concentration may explain why the NV- centres in these nanodiamonds have a longer average time than NV- centres in the bulk sample characterised in [57]. For this isotopically purified nanodiamond sample, substitutional nitrogen impurities give rise to dephasing due to intrinsic electronic spins [58, 22]. There may also be a significant dephasing contribution from magnetic noise arising from effects at the diamond’s surface [59, 60, 36, 53, 61]. It is not known which of these is the dominant dephasing mechanism. In the event that it is substitutional nitrogen, we would expect to see an increase in spin coherence times by using a starting material with a lower nitrogen concentration, and then irradiating and annealing to create a similar NV- concentration [62, 63].
As NV- sensing techniques are often limited by one or more of , and , as well as how close the NV- centre can be brought to the target, making these times long for NV- centres in nanodiamond is favourable for many sensing applications [22, 64, 65]. Furthermore, cellular uptake and biocompatibility has been demonstrated for nanodiamonds similar in size to ND4 [66, 67], and so such diamonds are favourable for intracellular sensing techniques. An example is NV- relaxometry, which has shown promise for detecting free radicals and measuring pH changes in cells, amongst other things [68, 69, 70, 71, 64, 72]. As the sensitivity is limited by the and proximity to the diamond surface of the NV- centres, the availability of smaller diamonds hosting NV- centres with longer offers new opportunities [64, 65]. The shortest measured in this study ( 0.1 ms) is comparable to the longest currently reported in the literature for a single NV- centre in nanodiamond (1.25 ms)[36].
V Conclusion
We have presented long spin relaxation and coherence times for single NV- centres hosted in nanodiamonds. The nanodiamonds were ball-milled with silicon nitride from polycrystalline, isotopically purified CVD diamond with an Ns0 concentration of 0.15 0.02 ppm. The long axis, short axis and height were measured to be nm, nm and nm respectively for a particular diamond hosting an NV- centre known to have = 1.71 0.20 s, = 759 s and = 4.32 ms. Small diamonds containing NV- centres with good spin coherence properties, that can be produced in large quantities, are favourable for a wide variety of sensing applications [64, 65, 18, 68, 74, 75].
VI Acknowledgements
We would like to thank Ben Green and Steve York for useful discussions. J. E. M’s studentship is supported by the Royal Society. B. D. W’s PhD studentship is supported by the Engineering and Physical Sciences Research Council (EPSRC). G. W. M is supported by the Royal Society. The work is supported by the following grants from the UKRI EPSRC: EP/M013243/1 (UK National Quantum Technologies Programme, NQIT Hub), EP/T001062/1 (QCS Hub), EP/M013294/1 (Quantum Technology Hub for Sensors and Metrology), EP/V056778/1 (Prosperity Partnership) and EP/L015315/1 (EPSRC CDT in Diamond Science and Technology), EP/V007688/1 (Warwick Analytical Science Centre) . The work is supported by a Science and Technologies Facilities Council (STFC) grant with grant number ST/W006561/1.
*
Appendix A
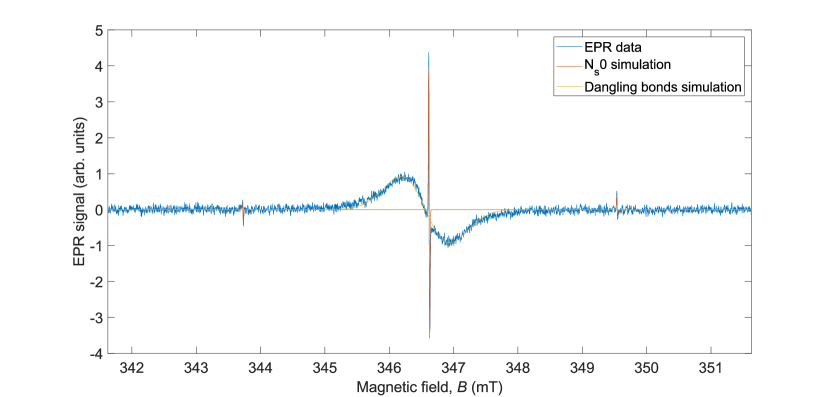
Figure 4 displays data from EPR measurements taken on the nanodiamond sample. The measurements were made on a 40 mg nanodiamond sample using a Bruker EMX spectrometer with a Bruker SHQ-E cavity. The modulation frequency and amplitude were 100 kHz and 0.01 mT respectively. Easyspin was used for the data processing and simulations [73]. The EPR data was compared against a well-characterised Type 1b diamond and the nanodiamond sample used in this study was found to have an N concentration of 150 15 ppb. The EPR signal has a linewidth of 0.011 mT. We attribute the broad features visible in the spectrum to dangling bonds on the nanodiamond surface, for which we measure a concentration of 500 50 ppb [76, 77, 78, 79].
References
- Rondin et al. [2014] L. Rondin, J.-P. Tetienne, T. Hingant, J.-F. Roch, P. Maletinsky, and V. Jacques, Rep. Prog. Phys. 77, 056503 (2014).
- de Lange et al. [2011] G. de Lange, D. Ristè, V. V. Dobrovitski, and R. Hanson, Phys. Rev. Lett. 106, 080802 (2011).
- Wolf et al. [2015] T. Wolf, P. Neumann, K. Nakamura, H. Sumiya, T. Ohshima, J. Isoya, and J. Wrachtrup, Phys. Rev. X 5, 041001 (2015).
- Loretz et al. [2013] M. Loretz, T. Rosskopf, and C. L. Degen, Phys. Rev. Lett. 110, 017602 (2013).
- Toyli et al. [2013] D. M. Toyli, C. F. de las Casas, D. J. Christle, V. V. Dobrovitski, and D. D. Awschalom, Proc. Natl. Acad. Sci. 110, 8417 (2013).
- Kucsko et al. [2013] G. Kucsko, P. C. Maurer, M. K. N. Y. Yao, H. J. Noh, P. K. Lo, H. Park, and M. D. Lukin, Nanotechnology 500, 54 (2013).
- Zhang et al. [2021a] S.-C. Zhang, Y. Dong, S. L. B. Du H-B. Lin, W. Zhu, X.-D. C. G-Z. Wang, G.-C. Guo, and F.-W. Sun, Rev. Sci. Instrum. 92, 044904 (2021a).
- Fujiwara and Shikano [2021] M. Fujiwara and Y. Shikano, Nanotechnology 32, 482002 (2021).
- Dolde et al. [2014] F. Dolde, M. W. Doherty, J. Michl, I. Jakobi, B. Naydenov, S. Pezzagna, J. Meijer, P. Neumann, F. Jelezko, N. B. Manson, and J. Wrachtrup, Phys. Rev. Lett. 112, 097603 (2014).
- Chen et al. [2017] E. H. Chen, H. A. Clevenson, K. A. Johnson, L. M. Pham, D. R. Englund, P. R. Hemmer, and D. A. Braje, Phys. Rev. A 95, 053417 (2017).
- Li et al. [2020] R. Li, F. Kong, P. Zhao, Z. Cheng, Z. Qin, M. Wang, Q. Zhang, P. Wang, Y. Wang, F. Shi, and J. Du, Phys. Rev. Lett. 124, 247701 (2020).
- Wang et al. [2015] P. Wang, Z. Yuan, P. Huang, X. Rong, M. Wang, X. Xu, C. Duan, C. Ju, F. Shi, and J. Du, Nat. Commun. 6, 6631 (2015).
- Nomura et al. [2021] S. Nomura, K. Kaida, H. Watanabe, and S. Kashiwaya, J. Appl. Phys. 130, 024503 (2021).
- Doherty et al. [2013] M. W. Doherty, N. B. Manson, P. Delaney, F. Jelezko, J. Wrachtrup, and L. C. L. Hollenberg, Phys. Rep. 528, 1 (2013).
- V.Vaijayanthimala et al. [2012] V.Vaijayanthimala, P.-Y. Cheng, S.-H. Yeh, K.-K. Liu, C.-H. Hsiao, J.-I. Chao, and H.-C. Chang, Biomaterials 33, 7794 (2012).
- Igarashi et al. [2012] R. Igarashi, Y. Yoshinari, H. Yokota, T. Sugi, F. Sugihara, K. Ikeda, H. Sumiya, S. Tsuji, I. Mori, H. Tochio, Y. Harada, and M. Shirakawa, Nano Lett. 12, 5726-5732 (2012).
- MartÃnez et al. [2020] F. P. Martínez, A. C. Nusantara, M. Chipaux, S. K. Padamati, and R. Schirhagl, ACS Sens. 15, 3862-3869 (2020).
- Fujisaku et al. [2019a] T. Fujisaku, R. Tanabe, S. Onoda, R. Kubota, T. F. Segawa, F. T.-K. So, T. Ohshima, I. Hamachi, M. Shirakawa, and R. Igarashi, ACS Nano 13, 11726-11732 (2019a).
- Waddington et al. [2017] D. E. J. Waddington, M. Sarracanie, H. Zhang, N. Salameh, D. R. Glenn, E. Rej, T. Gaebel, T. Boele, R. L. Walsworth, D. J. Reilly, and M. S. Rosen, Nat. Commun. 8, 15118 (2017).
- Miller et al. [2020] B. S. Miller, L. Bezinge, H. D. Gliddon, D. Huang, G. Dold, E. R. Gray, J. Heaney, P. J. Dobson, E. Nastouli, J. J. L. Morton, and R. A. McKendry, Nature 587, 588-593 (2020).
- Liu et al. [2021] C.-F. Liu, W.-H. Leong, K. Xia, X. Feng, A. Finkler, A. Denisenko, J. Wrachtrup, Q. Li, and R.-B. Liu, Natl. Sci. 8, nwaa194 (2021).
- Barry et al. [2020] J. F. Barry, J. M. Schloss, E. Bauch, M. J. Turner, C. A. Hart, L. M. Pham, and R. L. Walsworth, Rev. Mod. Phys. 92, 015004 (2020).
- Li et al. [2022] R. Li, T. Vedelaar, A. Mzyk, A. Morita, S. K. Padamati, and R. Schirhagl, ACS Sens. 7, 123-130 (2022).
- Barton et al. [2020] J. Barton, M. Gulka, J. Tarabek, Y. Mindarava, Z. Wang, J. Schimer, H. Raabova, J. Bednar, M. B. Plenio, F. Jelezko, M. Nesladek, and P. Cigler, ACS Nano 14, 12938-12950 (2020).
- Holzgrafe et al. [2020] J. Holzgrafe, Q. Gu, J. Beitner, D. M. Kara, H. S. Knowles, and M. Atatüre, Rev. Rev. App. 13, 044004 (2020).
- Cao et al. [2020] Q.-Y. Cao, P.-C. Yang, M.-S. Gong, M. Yu, A. Retzker, M. Plenio, C. Müller, N. Tomek, B. Naydenov, L. McGuinness, F. Jelezko, and J.-M. Cai, Rev. Rev. App. 13, 024021 (2020).
- Scala et al. [2013] M. Scala, M. S. Kim, G. W. Morley, P. F. Barker, and S. Bose, Phys. Rev. Lett. 111, 180403 (2013).
- Yin et al. [2013] Z.-Q. Yin, T. Li, X. Zhang, and L. M. Duan, Phys. Rev. A. 88, 033614 (2013).
- Wood et al. [2022a] B. D. Wood, S. Bose, and G. W. Morley, Phys. Rev. A. 105, 012824 (2022a).
- Bose et al. [2017] S. Bose, A. Mazumdar, G. W. Morley, H. Ulbricht, M. Toroš, M. Paternostro, A. A. Geraci, P. F. Barker, M. S. Kim, and G. Milburn, Phys. Rev. Lett. 119, 240401 (2017).
- Abobeih et al. [2018] M. H. Abobeih, J. Cramer, M. A. Bakker, N. Kalb, M. Markham, D. J. Twitchen, and T. H. Taminiau, Nat. Commun. 9, 2552 (2018).
- Norambuena et al. [2018] A. Norambuena, E. Muñoz, H. T. Dinani, A. Jarmola, P. Maletinsky, D. Budker, and J. R. Maze, Phys. Rev. B 97, 094304 (2018).
- Jarmola et al. [2012] A. Jarmola, V. M. Acosta, K. Jensen, S. Chemerisov, and D. Budker, Phys. Rev. Lett. 108, 197601 (2012).
- Stephen et al. [2019] C. J. Stephen, B. L. Green, Y. N. D. Lekhai, L. Weng, P. Hill, S. Johnson, A. C. Frangeskou, P. L. Diggle, Y.-C. Chen, M. J. Strain, E. Gu, M. E. Newton, J. M. Smith, P. S. Salter, and G. W. Morley, Phys. Rev. Appl. 12, 064005 (2019).
- Balasubramanian et al. [2009] G. Balasubramanian, P. Neumann, D. Twitchen, M. Markham, R. Kolesov, N. Mizuochi, J. Isoya, J. Achard, J. Beck, J. Tissler, V. Jacques, P. R. Hemmer, F. Jelezko, and J. Wrachtrup, Nat. Mat. 8, 383-387 (2009).
- Knowles et al. [2014] H. S. Knowles, D. M. Kara, and M. Atatüre, Nat. Mater. 13, 21 (2014).
- Sangtawesin et al. [2018] S. Sangtawesin, B. L. Dwyer, S. Srinivasan, J. J. Allred, L. V. H. Rodgers, K. D. Greve, A. Stacey, N. Dontschuk, K. M. O’Donnell, D. Hu, D. A. Evans, C. Jaye, D. A. Fischer, M. L. Markham, D. J. Twitchen, H. Park, M. D. Lukin, and N. P. de Leon, Phys. Rev. X 9, 031052 (2018).
- Ryan et al. [2018] R. G. Ryan, A. Stacey, K. M. O’Donnell, T. Ohshima, B. C. Johnson, L. C. L. Hollenberg, P. Mulvaney, and D. A. Simpson, ACS Appl. Mater. Interfaces. 10, 13143-13149 (2018).
- de Guillebon et al. [2020] T. de Guillebon, B. Vindolet, J.-F. Roch, V. Jacques, , and L. Rondin, Phys. Rev. B. 102, 165427 (2020).
- Andrich et al. [2014] P. Andrich, B. J. Alemán, J. C. Lee, K. Ohno, C. F. de las Casas, F. J. Heremans, E. L. Hu, and D. D. Awschalom, Nano Lett. 14, 4959-4964 (2014).
- Wood et al. [2022b] B. D. Wood, G. A. Stimpson, J. E. March, Y. N. D. Lekhai, C. J. Stephen, B. L. Green, A. C. Frangeskou, L. Ginés, S. Mandal, O. A. Williams, and G. W. Morley, Phys. Rev. B 105, 205401 (2022b).
- Laraoui and Meriles [2013] A. Laraoui and C. A. Meriles, ACS Nano 7, 3403-3410 (2013).
- Bar-Gill [2018] N. Bar-Gill, in Thermodynamics in the Quantum Regime: Fundamental Aspects and New Directions, edited by F. Binder, L. Correa, C. Gogolin, J. Anders, and G. Adesso (Springer International Publishing, Cham, 2018) Chap. NV Color Centers in Diamond as a Platform for Quantum Thermodynamics, pp. 983–998.
- Fernández-Acebal et al. [2018] P. Fernández-Acebal, O. Rosolio, J. Scheuer, C. Müller, S. Müller, S. Schmitt, L. McGuinness, I. Schwarz, Q. Chen, A. Retzker, B. Naydenov, F. Jelezko, and M. B. Plenio, Nano Lett. 18, 1882 (2018).
- Scheuer et al. [2017] J. Scheuer, I. Schwartz, S. Müller, Q. Chen, I. Dhand, M. B. Plenio, B. Naydenov, and F. Jelezko, Phys. Rev. B 96, 174436 (2017).
- Ginés et al. [2018] L. Ginés, S. Mandal, D. J. Morgan, R. Lewis, P. R. Davies, P. Borri, G. W. Morley, and O. A. Williams, ACS Omega 3, 16099 (2018).
- Binder et al. [2017] J. M. Binder, A. Stark, N. Tomek, J. Scheuer, F. Frank, K. D. Jahnke, C. Müller, S. Schmitt, M. H. Metsch, T. Unden, T. Gehring, A. Huck, U. L. Andersen, L. J. Rogers, and F. Jelezko, SoftwareX 6, 85 (2017).
- Schröder et al. [2011] T. Schröder, F. Gädeke, M. J. Banholzer, and O. Benson, New J. Phys. 13, 055017 (2011).
- Pham et al. [2012] L. M. Pham, N. Bar-Gill, C. Belthangady, D. L. Sage, P. Cappellaro, M. D. Lukin, A. Yacoby, and R. L. Walsworth, Phys. Rev. B 18, 045214 (2012).
- Souza et al. [2012] A. M. Souza, G. A. Alvarez, and D. Suter, Phys. Rev. A 85, 032306 (2012).
- Souza et al. [2013] A. M. Souza, G. A. Alvarez, and D. Suter, Phys. Rev. A 87, 042309 (2013).
- Naydenov et al. [2011] B. Naydenov, F. Dolde, L. T. Hall, C. Shin, H. Fedder, L. C. L. Hollenberg, F. Jelezko, and J. Wrachtrup, Phys. Rev. B 83, 081201 (2011).
- Rosskopf et al. [2014] T. Rosskopf, A. Dussaux, K. Ohashi, M. Loretz, R. Schirhagl, H. Watanabe, S. Shikata, K. M. Itoh, and C. L. Degen, Phys. Rev. Lett. 112, 147602 (2014).
- Trusheim et al. [2014] M. E. Trusheim, L. Li, A. Laraoui, E. H. Chen, H. Bakhru, T. Schröder, O. Gaathon, C. A. Meriles, and D. Englund, Nano Lett. 14, 32-36 (2014).
- B. A. Myers and Jayich [2017] A. A. B. A. Myers and A. C. B. Jayich, Phys. Rev. Lett. 118, 197201 (2017).
- Claveau et al. [2018] S. Claveau, J.-R. Bertrand, and F. Treussart, Micromachines 9, 247 (2018).
- Edmonds et al. [2021] A. M. Edmonds, C. A. Hart, M. J. Turner, P.-O. Colard, J. M. Schloss, K. S. Olsson, R. Trubko, M. L. Markham, A. Rathmill, B. Horne-Smith, W. Lew, A. Manickam, S. Bruce, P. G. Kaup, J. C. Russo, M. J. DiMario, J. T. South, J. T. Hansen, D. J. Twitchen, and R. L. Walsworth, Mater. Quantum. Technol. 1, 025001 (2021).
- Bauch et al. [2020] E. Bauch, S. Singh, J. Lee, C. A. Hart, J. M. Schloss, M. J. Turner, J. F. Barry, L. M. Pham, N. Bar-Gill, S. F. Yelin, and R. L. Walsworth, Phys. Rev. B 102, 134210 (2020).
- Romach et al. [2015] Y. Romach, C. Müller, T. Unden, L. J. Rogers, T. Isoda, K. M. Itoh, M. Markham, A. Stacey, J. Meijer, S. Pezzagna, B. Naydenov, L. P. McGuinness, N. Bar-Gill, and F. Jelezko, Phys. Rev. Lett. 114, 017601 (2015).
- Myers et al. [2014] B. A. Myers, A. Das, M. C. Dartiailh, K. Ohno, D. D. Awschalom, and A. C. B. Jayich, Phys. Rev. Lett. 113, 027602 (2014).
- Sangtawesin et al. [2019] S. Sangtawesin, B. L. Dwyer, S. Srinivasan, J. J. Allred, L. V. H. Rodgers, K. D. Greve, A. Stacey, N. Dontschuk, K. M. O’Donnell, D. Hu, D. A. Evans, C. Jaye, D. A. Fischer, M. L. Markham, D. J. Twitchen, H. Park, M. D. Lukin, and N. P. de Leon, Phys. Rev. X 9, 031052 (2019).
- Haque and Sumaiya [2017] A. Haque and S. Sumaiya, J. Manuf. Mater. Process. 1, 6 (2017).
- Kennedy et al. [2002] T. A. Kennedy, F. T. Charnock, J. S. Colton, J. E. Butler, R. C. Linares, and P. J. Doering, phys. stat. sol. (b) 223, 416-426 (2002).
- Myzk et al. [2022] A. Myzk, A. Sigaeva, and R. Schirhagl, Acc. Chem. Res. 55, 3572-3580 (2022).
- Wu and Weil [2022] Y. Wu and T. Weil, Sci. Rep. 9, 2200059 (2022).
- Chu et al. [2014] Z. Chu, S. Zhang, B. Zhang, C. Zhang, C.-Y. Fang, I. Rehor, P. Cigler, H.-C. Chang, G. Lin, R. Liu, and Q. Li, Sci Rep 4, 4495 (2014).
- Chipaux et al. [2018] M. Chipaux, K. J. van der Laan, S. R. Hemelaar, M. Hasani, T. Zheng, and R. Schirhagl, Small 14, 1704263 (2018).
- Nie et al. [2022] L. Nie, A. C. Nusantara, V. G. Damle, M. V. Baranov, M. Chipaux, C. Reyes-San-Martin, T. Hamoh, C. P. Epperla, M. Guricova, P. Cigler, G. van den Bogaart, and R. Schirhagl, Nano Lett. 22, 1818-1825 (2022).
- Wu et al. [2022] K. Wu, T. A. Vedelaar, V. G. Damle, A. Morita, J. Mougnaud, C. Reyes-San-Martin, Y. Zhang, D. P. I. van der Pol, H. Ende-Metselaar, I. Rodenhuis-Zybert, and R. Schirhagl, Redox Biol. 52, 102279 (2022).
- T. Rendler et al. [2017] T.Rendler, J. Neburkova, O. Zemek, J. Kotek, A. Zappe, Z. Chu, P. Cigler, and J. Wrachtrup, Nat. Commun. 8, 1470 (2017).
- Fujisaku et al. [2019b] T. Fujisaku, R. Tanabe, S. Onoda, R. Kubota, T. F. Segawa, F. T.-K. So, T. Ohshima, I. Hamachi, M. Shirakawa, and R. Igarashi, ACS Nano 13, 11726-11732 (2019b).
- Zhang et al. [2021b] T. Zhang, G. Pramanik, K. Zhang, M. Gulka, L. Wang, J. Jing, F. Xu, Q. W. Z. Li, P. Cigler, and Z. Chu, ACS Sens. 6, 2077-2107 (2021b).
- Stoll and Schweiger [2006] S. Stoll and A. Schweiger, J. Magn. Reson. 178, 42 (2006).
- [74] M. Hollendonner, S. Sharma, D. B. R. Dasari, A. Finkler, S. V. Kusminskiy, and R. Nagy, arXiv:2301.04427.
- McGuinness et al. [2013] L. P. McGuinness, L. T. Hall, A. Stacey, D. A. Simpson, C. D. Hill, J. H. Cole, K. Ganesan, B. C. Gibson, S. Prawer, and P. Mulvaney, New J. Phys. 15, 073042 (2013).
- Presti et al. [2015] C. Presti, A. S. L. Thankamony, J. G. Alauzun, P. H. Mutin, D. Carnevale, C. Lion, H. Vezin, D. Laurencin, and O. Lafon, J. Phys. Chem. 119, 12408-12422 (2015).
- Panich et al. [2013] A. M. Panich, A. I. Shames, N. A. Sergeev, M. Olszewski, J. K. McDonough, V. N. Mochalin, and Y. Gogotsi, J. Phys.: Condens. Matter 25, 245303 (2013).
- Belobrov et al. [2001] P. I. Belobrov, S. K. Gordeev, É. A. Petrakovskaya, and O. V. Falaleev, Dokl. Phys. 46, 459 (2001).
- Soltamova et al. [2009] A. Soltamova, I. Ilyin, P. Baranov, A. Vul, S. Kidalov, F. Shakhov, G. Mamin, S. Orlinskii, N. Silkin, and M. Salakhov, Physica B 404, 4518-4521 (2009).