First-principles thermodynamics of \chCsSnI3
Abstract
\chCsSnI3 is a promising eco-friendly solution for energy harvesting technologies. It exists at room temperature in either a black perovskite polymorph or a yellow 1D double-chain, which irreversibly deteriorates in the air. In this work, we unveil the relative thermodynamic stability between the two structures with a first-principles sampling of the \chCsSnI3 finite-temperature phase diagram, discovering how it is driven by anomalously large quantum and anharmonic ionic fluctuations. Thanks to a comprehensive treatment of anharmonicity, the simulations deliver a remarkable agreement with known experimental data for the transition temperatures of the orthorhombic, rhombohedral, and cubic perovskite structures and the thermal expansion coefficient. We disclose how the perovskite polymorphs are the ground state above and discover an abnormal decrease in heat capacity upon heating in the cubic black perovskite. Our results also significantly downplay the \chCs^+ rattling modes’ contribution to mechanical instability. The remarkable agreement with experiments validates our methodology, which can be systematically applied to all metal halides.
Abstract
Introduction
Perovskites have an \chABX3 chemical formula, where the B-site cation is octahedrally coordinated in a \chBX6 configuration and the \chA cation sits within the cuboctahedral cavity formed by nearest-neighbor \chX atoms in an \chAX12 polyhedron. Metal-halide perovskites (MHPs), in particular, are typically composed of a divalent B-site metal (e.g., \chPb^2+, \chSn^2+, \chGe^2+, \chCu^2+, \chEu^2+, and \chNi^2+) and monovalent A-site cation. Inorganic MHPs usually employ \chCs+ cations to improve stability. Among all, the inorganic cesium lead halide \chCsPbI3 has been considered the best candidate for solar cells applications due to its suitable bandgap of and excellent optoelectronic properties[1]. First reported in 2014, \chCsPbI3 perovskite solar cells (PSCs) have achieved remarkable progress in stability and power conversion efficiency through additive and composition engineering, interfacial modifications and optimization of the fabrication process[2]. Nevertheless, the presence of toxic lead hampers its deployment into general markets. \chCsSnI3 has established itself as the most promising eco-friendly alternative[3].
CsSnI3 is polymorphic with two different phases coexisting at room temperature. The first black phase (B) is a standard perovskite crystal, which goes through three different phase transitions upon heating: it transforms from B- (orthorhombic Pnma symmetry) to B- (tetragonal P4/mbm) at and then to B- (cubic Pmm) at [4]. The second phase appears when \chCsSnI3 is exposed to air at room temperature; under these conditions, B- transforms instead into a yellow phase (Y) with an orthorhombic Pnma space group, where the \chSnI6- octahedra are connected into one-dimensional chains sharing one edge. In practice, \chCsSnI3 is synthesized at high temperature in the B- phase[4]. Then, when cooled to room temperature and exposed to air, it transforms into the yellow phase Y, suggesting that the perovskite structures (B-, B-, and B-) are metastable under ambient conditions.
All the B phases display excellent optoelectronic properties and are considered the most promising eco-friendly candidates for high-performance PSCs. On the contrary, the Y phase is easily oxidized and irreversibly transforms to \chCs2SnI6 whose absorption coefficient is ten times lower than the black perovskite polymorphs[5, 6]. Notably, also other isostructural tin metal-halides have been found to decompose into the Y phase[3]. Therefore, understanding the mechanical stability between the perovskite polymorphs and the Y phase is a fundamental step to improving the overall stability of the \chCsSnI3 and its practical deployment.
Due to the experimental difficulties in the production of single crystals in the B- phase, the structural characterization through X-ray spectroscopy has been achieved only recently[4], and our understanding of the B perovskite phase diagram is still in the early stages. For example, the isomorph compound \chCsPbI3 was shown to form small domains of the orthorhombic black phase B- within the cubic structure (B-) even at high temperatures[7, 8]. So, it is not clear if the transition between ferroelectric B-, B- and paraelectric B- in \chCsSnI3 is of the second-order displacive kind, where B- is a high symmetry homogeneous crystal; or an order-disorder phase transition, where the crystal displays a local electric dipole even in the paraelectric phase[9]. Moreover, theoretical calculations failed so far in reproducing even qualitatively the phase diagram of \chCsSnI3, with the B- phase predicted in many studies not to exist at any temperature[10, 11]. This contrasts with experiments, which observe the B- phase above . Further studies tried to include anharmonicity in the calculations, which is essential to describe the ferroelectric transition[12], but the lack of algorithms to simulate lower symmetry phases, introduced only recently[13], prevented the simulation of the complete phase diagram. Moreover, the relative stability between Y and perovskite phases is extremely challenging for first-principles molecular dynamics, as the transition involves a macroscopic structural rearrangement of atoms. Thus, the phase diagram of \chCsSnI3 remains largely unknown: Are the transitions between B-, B-, and B- displacive or order-disorder? Is B- or Y the lowest free energy phase at room temperature?
Here, we answer these questions by simulating the complete phase diagram of bulk \chCsSnI3 from first principles using state-of-the-art sampling techniques and disclosing the origins of the formation of the Y phase. In the process, we both elucidate the displacive character of the ferroelectric phase transitions in the black perovskite, highlight its anomalous heat capacity, and show the impact of the tin and cesium rattling motions on mechanical stability.
Results
The importance of anharmonicity has been recently discovered in the isostructural compounds \chCsPbI3[14, 15] and \chCsPbBr3[16]. As will be seen below, anharmonicity in thermal and quantum ionic fluctuations plays a crucial role in the thermodynamic properties and phase diagram of \chCsSnI3. We account for this by employing the stochastic self-consistent harmonic approximation (SSCHA)[17], combined with density-functional theory (DFT) at the PBEsol level[18]. The SSCHA, essential to this work, captures the strongly anharmonic fluctuations of the ions by optimizing a nuclear quantum distribution that minimizes the free energy[19]. Within the SSCHA, one can optimize the average ionic positions (the centroids of the nuclear quantum distribution), the lattice vectors and cell volume as a function of temperature. The method is stochastic and samples the energy landscape extracting configurations with randomly displaced ions and evaluating the respective energies and forces within DFT. The advantages of the SSCHA compared to other state-of-art approaches, like ab initio molecular dynamics, are the direct access to free energies, also exploiting symmetry constraints, and the inclusion of quantum nuclear zero-point motion. Moreover, unlike other approximate methods like the time-dependent energy landscape (TDEP[20]), it is nonempirical and has no internal free parameters that could affect the results (like the choice of the diagrams to include in the phonon self-energy or the order of the fit for the energy landscape).
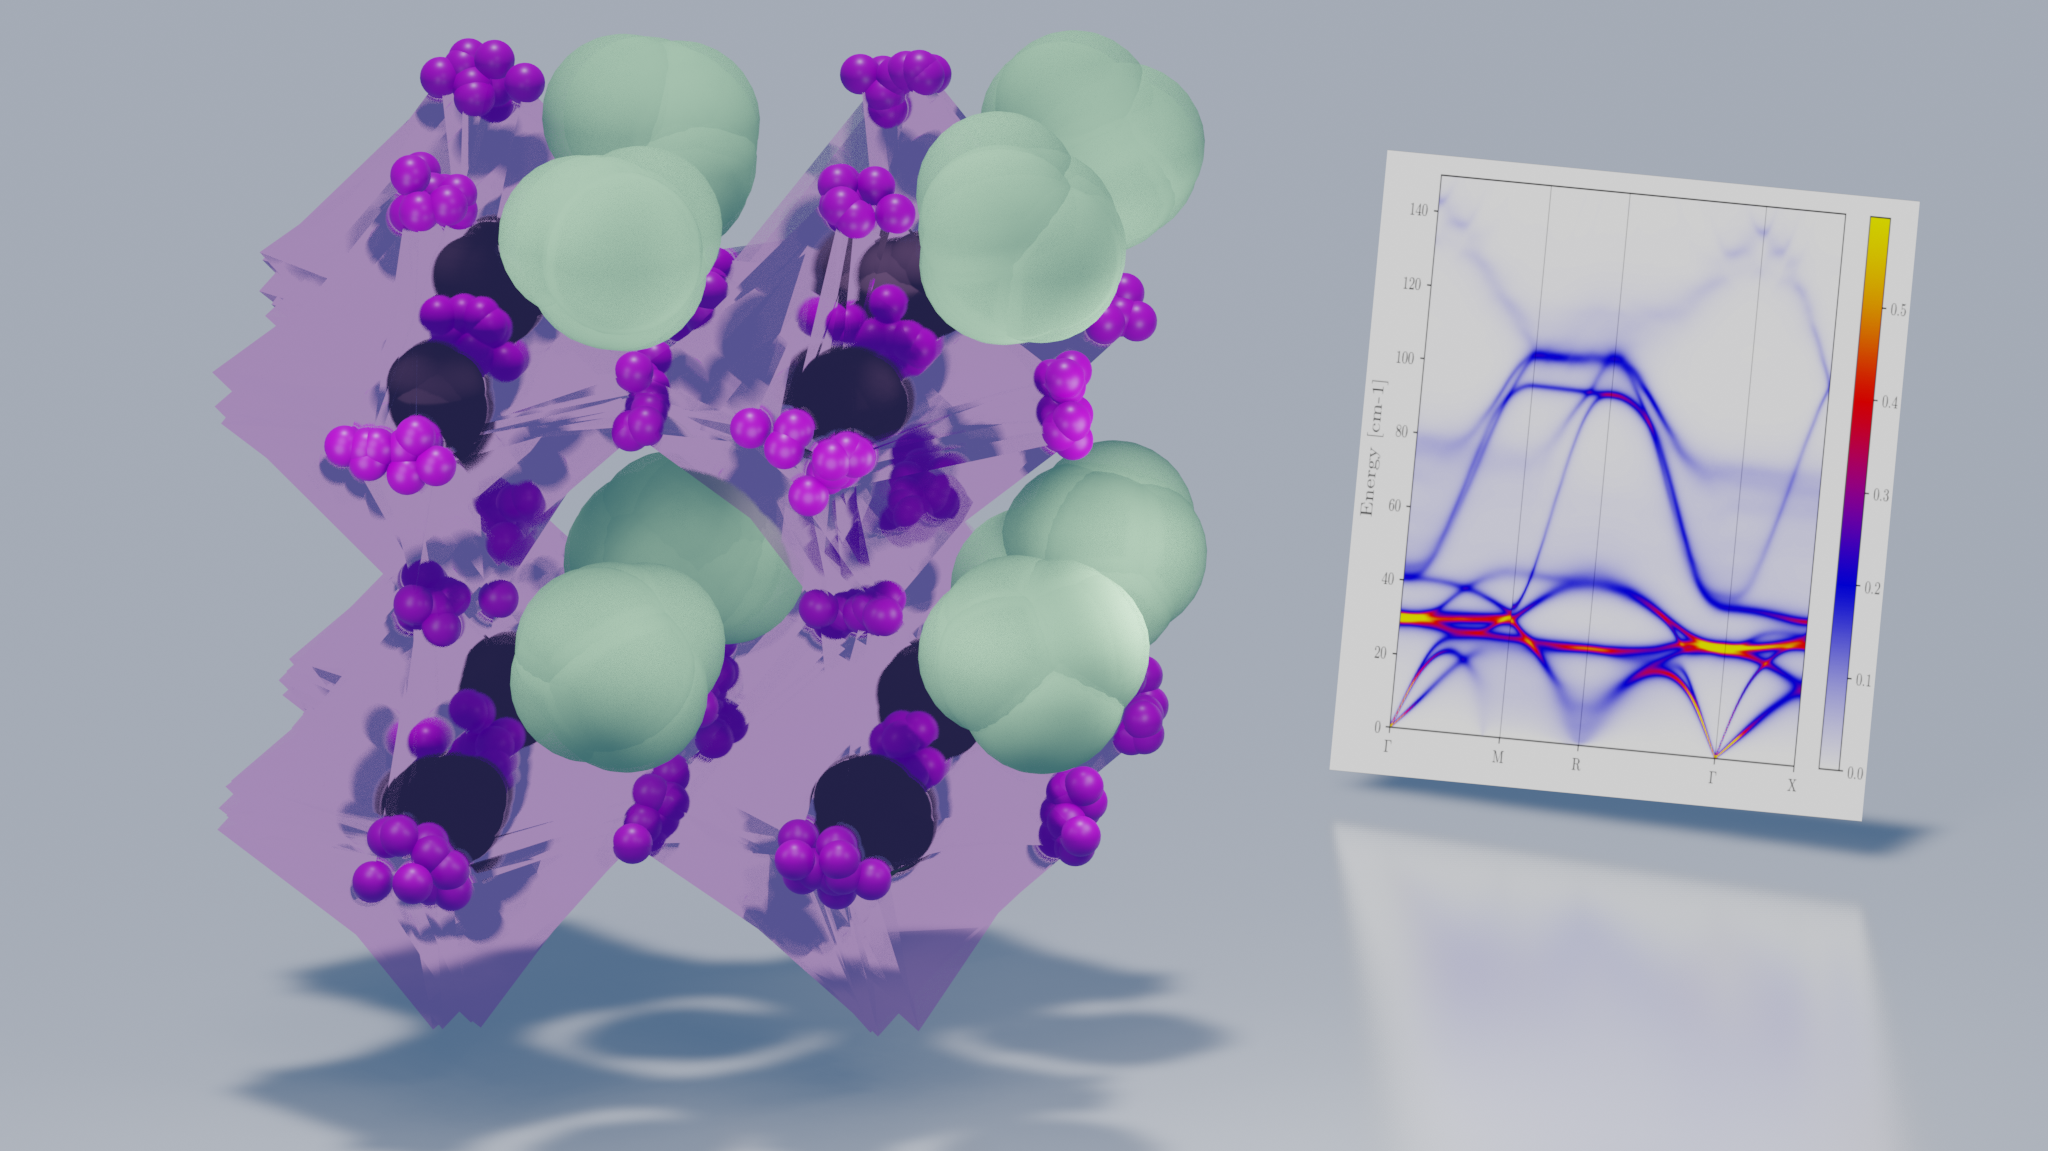
The most simple structure for \chCsSnI3 is the standard cubic perovskite B- (space group Pmm), with five atoms in the primitive cell. Despite its geometrical simplicity, it is a saddle-point of the Born-Oppenheimer energy landscape, and the harmonic phonon dispersion presents imaginary frequencies (Figure 1a). Moreover, extrinsic thermal effects (e.g., volume expansion) further destabilize the structure, introducing an additional imaginary mode at [11]. To assess the stability of the B- phase, we computed the Hessian of the free energy with respect to the centroids[21], which defines an effective anharmonic temperature-dependent static phonon dispersion. The critical temperature at which B- becomes mechanically stable occurs when the phonon dispersion becomes positive in the whole Brillouin zone (Figure 1a); we report more details on the calculations in the Methods section.
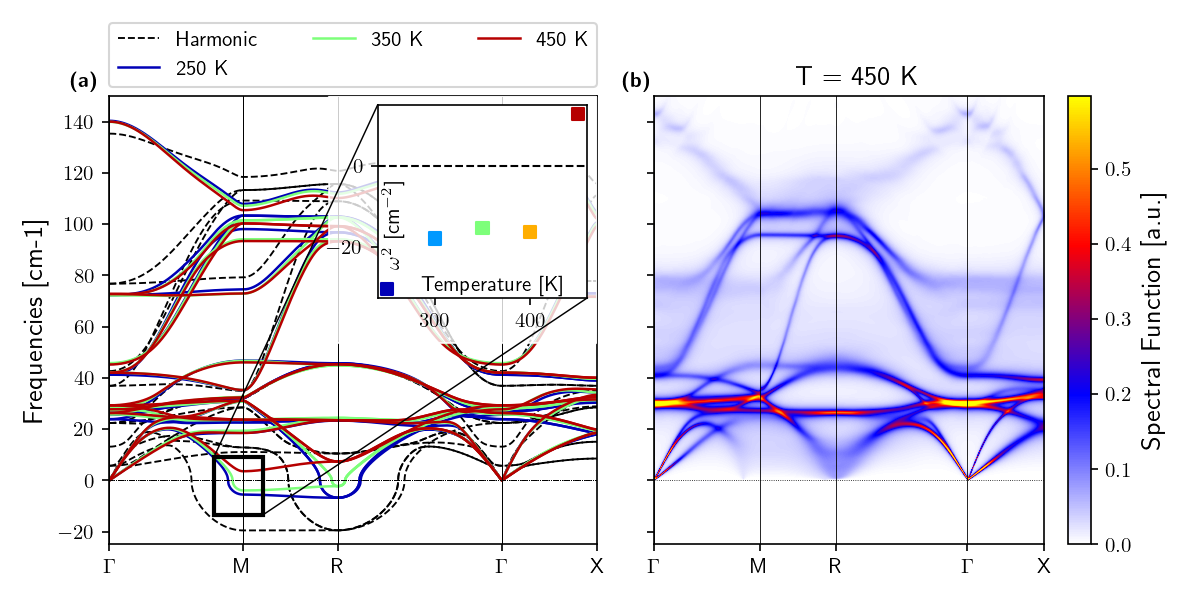
An ionic displacement with imaginary frequency in the M-R region of the Brillouin zone identifies the low-temperature B- instability. The instability disappears at R between and , then at M at as B- becomes stable. This is in very good agreement with experiments that show how the B- phase transforms into the B- between and [4]. At variance with the unstable M-R phonon modes, other frequencies display only a slight variation with temperature, despite their substantial difference with respect to the harmonic spectrum. Such a strongly anharmonic character becomes even more apparent when examining the vibrational spectrum of the B- phase. This is reported in Figure 1(b) and is evaluated as the trace of positions auto-correlation functions within the time-dependent self-consistent harmonic approximation (TD-SCHA)[17] (more details in Methods); the very broad linewidth of the phonon bands points to their short lifetimes. The phonon-phonon scattering is so strong that the character of the dispersion disappears, and almost all phonons merge. This justifies a posteriori the necessity of dealing carefully with such strongly anharmonic crystals, and the overlap between different phonon bands points toward the importance of coherences and Wigner transport for thermal conductivity[22], neglected in the standard Boltzmann theory, and the necessity to account for the overdamped regime of the low-frequency modes.
To further investigate the vibrational properties of the B- phase, we dissected the spectral function separating the contribution of each mode in the , M, R, and X high-symmetry points in Figure 2, including also the effects of four-phonon scattering self-consistently[17] (see Methods).
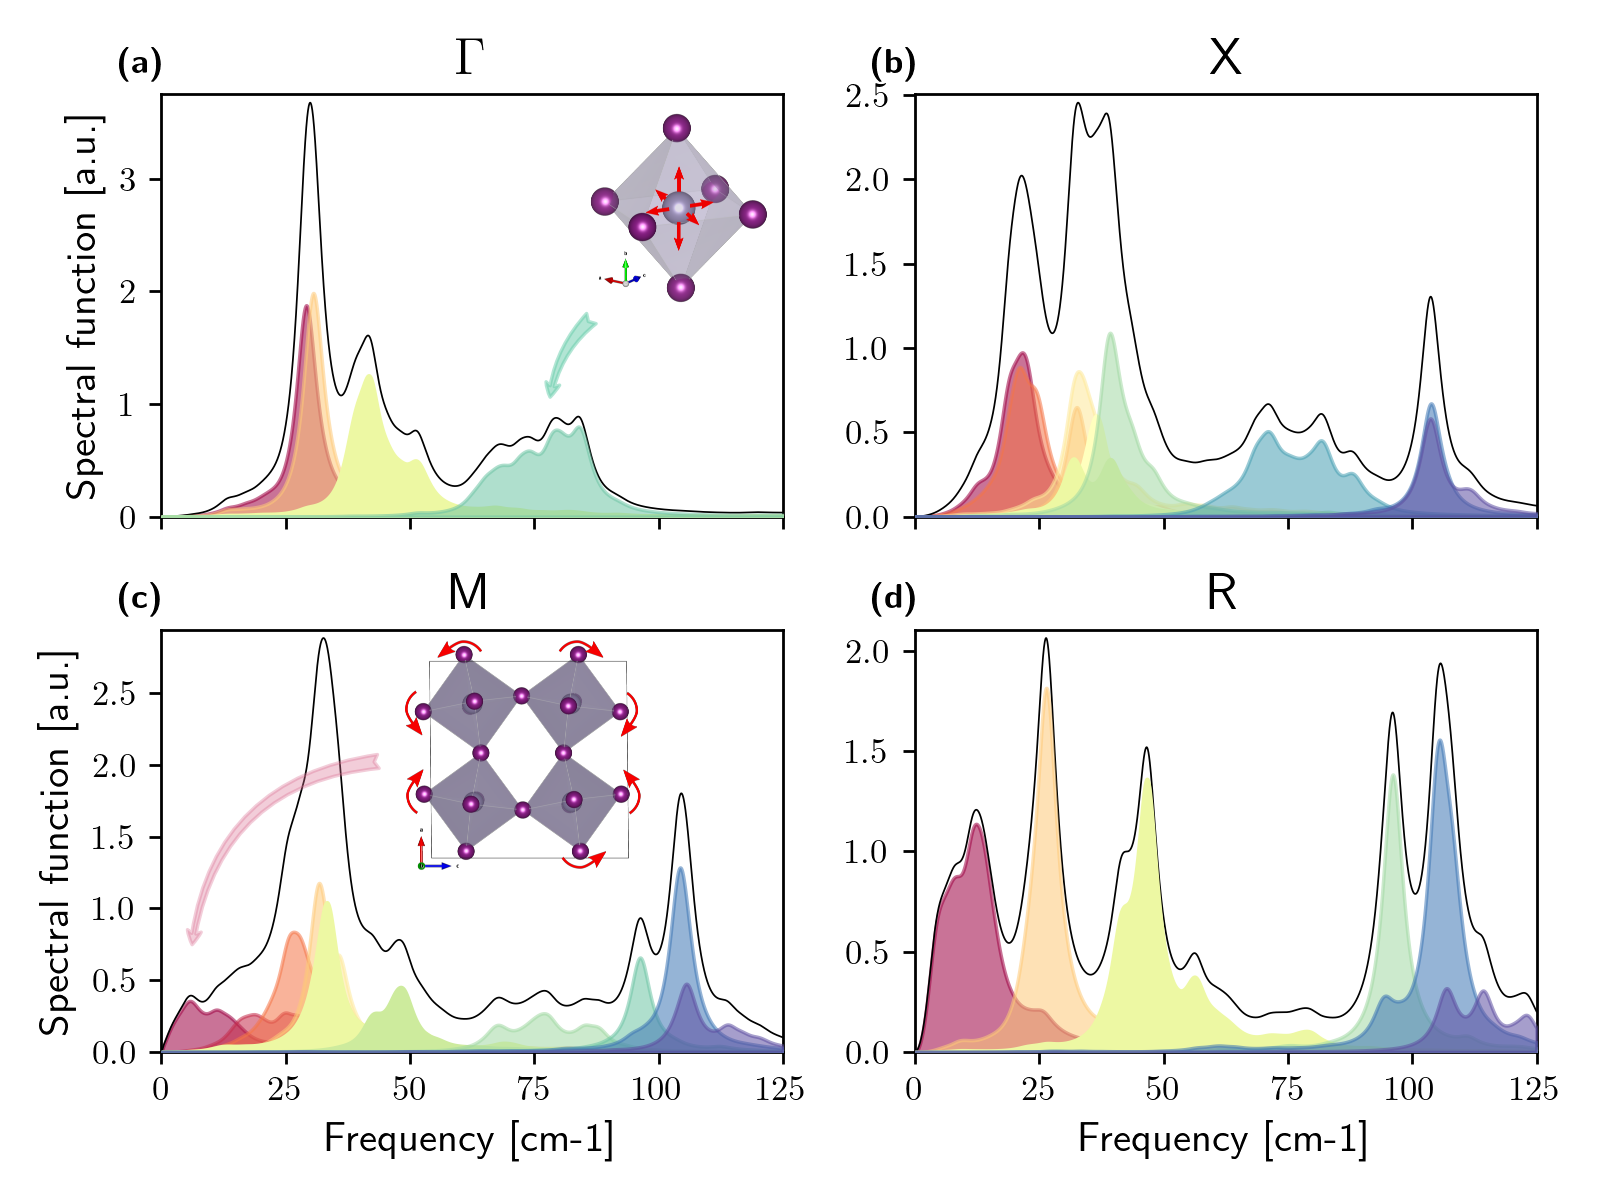
Almost all phonon modes in the Brillouin zone display a peak shape departing from the standard Lorentzian. The mode which drives the phase transition between B- and B- is shown as a dark-red broad band at and (Figure 2c,d). This band represents the tilting of the \chSnI6- octahedra along the different directions; it has a broad featureless spectrum spanning low frequencies up to and is strongly over-damped with a lifetime shorter than the oscillation period. A similarly broad spectrum has already been measured in the isostructural \chCsPbBr3[23]. However, even higher energy modes show nontrivial peak shapes; e.g., the phonon branch around at , , and has a large broadening of . This is the mode for \chSn rattling inside the \chSnI6 cages, underlining how temperature delocalizes the bonding of tin (Figure 2a,bc). In contrast, the modes involving the motion of \chCs+ ions have a Lorentzian shape (e.g., the one marked in red around at , or the one in orange around at R; Figure 2a,d); this is a signature that atoms vibrate similarly to an effective harmonic oscillation.
These observations challenge the common assumption that \chCs+ ions rattle inside the over-sized octahedra of the perovskite structure[4, 24] and that this motion plays a crucial role in the stability of the perovskite structure, an assumption incorrectly corroborated by quasi-harmonic simulations, which show that \chCs^+ vibrations become imaginary at the point upon volume dilation[11, 24]. Indeed, Figure 1(a) shows a relevant frequency shift with respect to the Harmonic value (from to at ); however, \chCs+ motion is stable already at when intrinsic anharmonicity is accounted for and barely depends on temperature. Despite the agreement between our simulations showing the B- phase becoming stable between and and the experimental transition temperature, questions remain regarding the order of the phase transition (first or second) and its character (order-disorder or displacive). To answer these questions, we further investigated the ferroelectric transition in the B- and B- phases: we prepared the starting trial nuclear density matrix in the orthorhombic B- phase and optimized the SSCHA distribution, including the cell shape and centroids within the symmetry constraints of the Pnma orthorhombic group from to (each ). The procedure is repeated with the symmetry constraints of B- (P4/mbm).
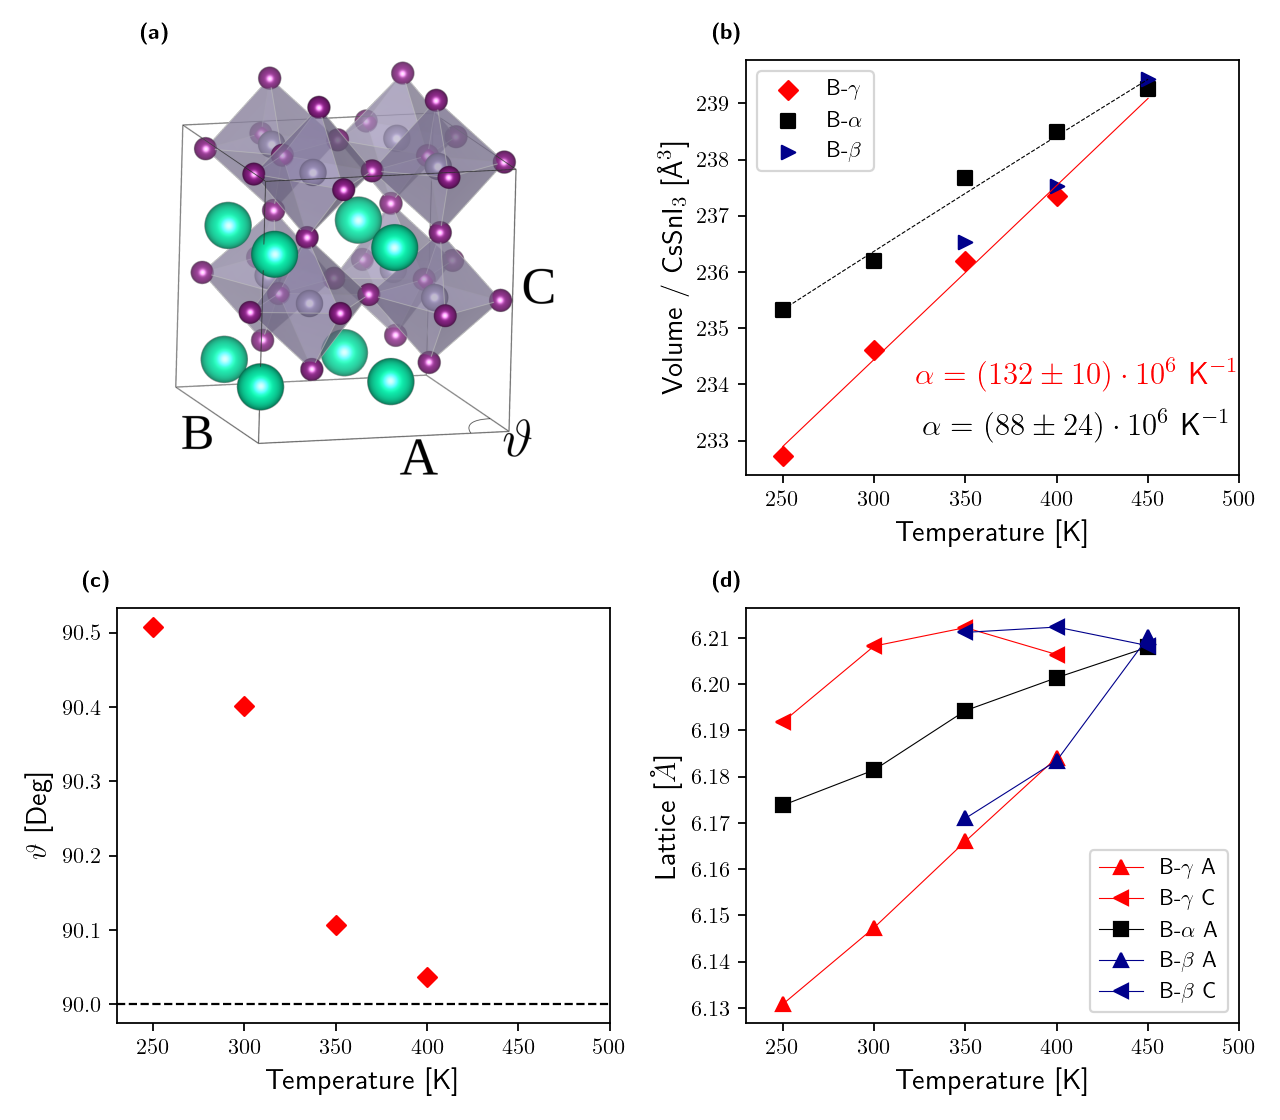
To detect the transition, we measure the distortion of the conventional cell with 48 atoms (commensurate with all the three phases, Figure 3a) in analogy with X-ray diffraction experiments. Namely, the orthorhombic to rhombohedral transition is identified by the angle between the lattice vectors of the almost cubic 48-atom supercell (Figure 3c) and the rhombohedral to cubic transition by the relative size of the lattice parameters and (Figure 3d). The deviation of from (Figure 3c) shows how the B- phase transforms continuously into B- between and . The transition to the cubic B- phase occurs at around , as shown by the value at which the cell becomes cubic (Figure 3d) and the temperature at which the volumes of the simulations constrained along the B- and B- phases intersect the one of the B- phase (Figure 3b). A symmetry analysis of the centroids confirms both transitions. The resulting phase diagram is in excellent agreement with experimental data (B- at and B- at [4]): the match between this simulation and the stability analysis of the phase B- indicates that there is no metastability region for the B- phase (no hysteresis between B- and B-), and it confirms a second-order phase transition supporting the displacive scenario, as the crystal has no local ferroelectricity above the critical temperature.
CsSnI3 displays a remarkably large thermal expansion coefficient at room temperature of in the cubic B- phase and in the orthorhombic B- phase. This latter is in excellent agreement with in situ diffraction experiments ( in the B- phase[4]), validating the accuracy of the PBEsol functional and our treatment of anharmonicity. These values are uncommon when compared with other materials: for example, the isostructural compound \chMgSiO3 has a equal to [26], while \chSrZrO3 and \chBaZrO3 and respectively[27]. The volumetric thermal expansion coefficient of B- \chCsSnI3 is the largest known for a crystal, approaching those of amorphous systems and liquids[4].
Using the SSCHA we can compute the free energy at finite temperatures even in materials with strong intrinsic anharmonicity, as is the case for the B- phase of \chCsSnI3. To shed light on the decomposition of this black perovskite into the orthorhombic yellow phase (Y) when the sample is exposed to air, we run a new SSCHA calculation on the Y phase and compared its free energy and thermodynamic properties as a function of temperature with that of the B- phase (Figure 4). Since the B-, B- and B- phases transform through second-order phase transitions, their free energy differences are below per formula unit in the temperature range studied (-). Therefore, we employed the B- as a prototype for the all three black perovskites when assessing its relative stability with respect to the Y phase, as the SSCHA can reach a lower stochastic error and a better thermolimit extrapolation exploiting the higher number of symmetries of the cubic phase.
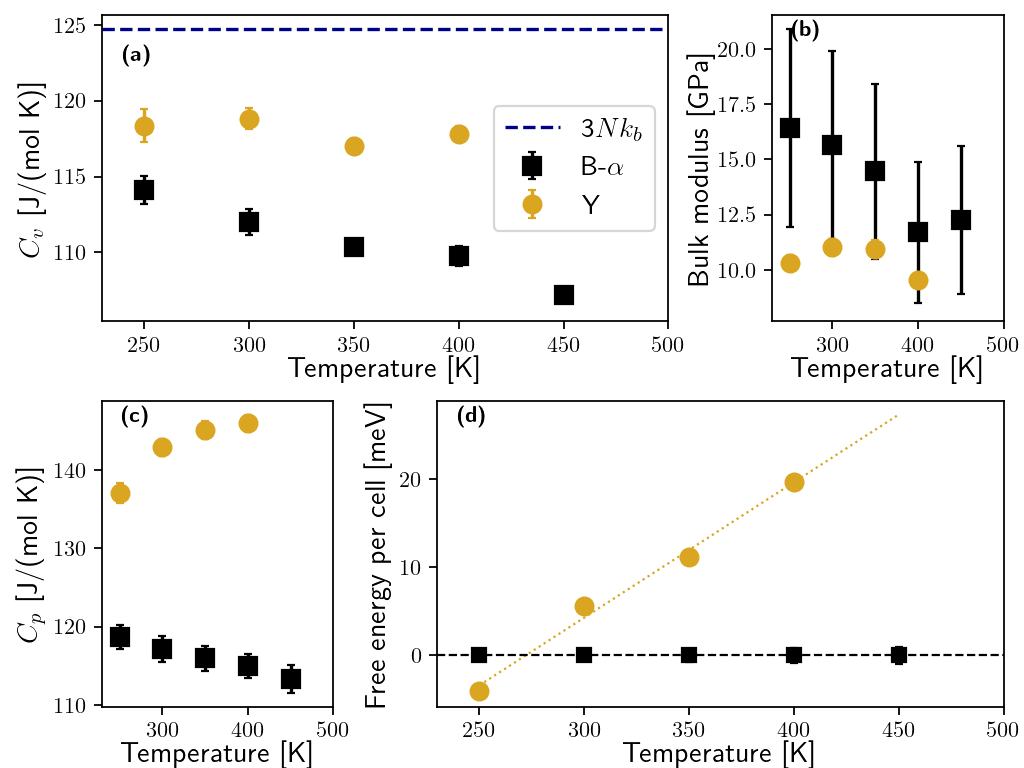
We compare in Figure 4(a,b,c) the constant-volume heat capacity , the bulk modulus, and constant-pressure heat capacity for the B- and Y phases. Notably, as a function of temperature, the constant volume heat capacity (Figure 4a) of the B- decreases anomalously. According to harmonic theory, above the Debye temperature should reach (blue dashed line in Figure 4a). The anomalous thermal dependence of the heat capacity in the B- phase instead further underlines the anharmonicity of the crystal. In fact, according to the SSCHA (see SI, sec. A), the contribution of each phonon to the heat capacity is:
| (1) |
where the first term is the standard Dulong-Petit model for solids (), while the second one accounts for the intrinsic anharmonic shift of frequencies with temperature at constant volume; this is not captured by the quasi-harmonic approximation. The B- phase instability close to (Figure 1a) generates a softening of the full phonon branch between M and R, which, thanks to the factor, enhances the effect of anharmonicity and explains the negative slope of the heat capacity before the phase transition.
The constant-volume heat capacity of the Y phase does not show the same anomaly: it is almost independent of temperature, and it deviates from the value predicted by the harmonic theory by 6%. The difference between the Y and B- phases is further enhanced at constant pressure (Figure 4c), due to the higher thermal expansion coefficient of the Y phase (). The bulk moduli of both phases are very similar, with a softer value for the Y phase at low temperature. The bulk modulus of the cubic perovskite structure shows a slight decrease with temperature and its much smaller value when compared with other perovskite structures (e.g., in \chSrTiO3, about than 15 times larger) is at the root of the remarkable softness of \chCsSnI3 and its sizable thermal expansion coefficient.
The free energy calculations unveil how the B- phase is more stable than the Y above (Figure 4(d)); also note that even if the B- phase is more stable at that temperature, its free energy difference with the B- is negligible ( per formula unit). This result apparently challenges experiments showing a spontaneous transformation of the B- into the Y phase at room temperature. However, such deterioration of the black perovskite has been observed only in samples exposed to air[3]. Since \chCsSnI3 is synthesized as a powder, surface effects can be very sizable, and contamination of the sample with water and oxygen could alter the relative stability between the two phases. Moreover, it is known that the Y phase is easily oxidized and irreversibly transforms into the \chCs2SnI6[5, 6]. Therefore, increasing the volume/surface ratio of the material (i.e., by growing larger crystals) would be a promising route to prevent the formation of the Y phase in the first place. The steep increase in the free energy difference between the two phases also shows how heating could efficiently remove contamination of the Y phase inside the solar cell.
In conclusion, we simulated the complete ambient pressure phase-diagram of \chCsSnI3, showing an excellent agreement within 15 % with the experimental transition temperatures for the black perovskite structures; this accuracy is comparable to the one of SSCHA+DFT (at the PBEsol level) in other materials where ionic fluctuations drive the phase transition rather than electronic processes[28, 29, 30], and achieved only through a complete treatment of anharmonicity. The lower free energy of the black perovskite structure compared to the yellow phase at room temperature is beneficial for the stability of the system, as preventing the formation of the yellow phase is an important step toward the stabilization of the perovskite structure in the air. Our approach is general and can be employed in any other metal halides, paving the way to a reliable high-throughput study of these materials with first-principles simulations.
Acknowledgements
LM acknowledges PRACE for awarding access to Joliot-Curie Rome at TGCC, France; CINECA under the ISCRA initiative for access to MARCONI100, Italy; and CSCS, for sharing the resources of the hybrid partition of Piz Daint, Switzerland (project IDs c29 and s1139). This project was founded by European Union under the Marie Curie Fellowship (project codename THERMOH).
Methods
We studied the structure and the electronic properties of \chCsSnI3 within density-functional theory (DFT) in the PBEsol approximation[18], using the Quantum ESPRESSO distribution [31] employing a plane-wave basis set, norm-conserving pseudopotentials from the Pseudo-Dojo library[32], and a cutoff of 70 Ry. The Brillouin zone for electrons is sampled with an 8x8x8 uniform mesh with respect to the primitive-reciprocal cell of the B- structure; this sampling is appropriately re-scaled in the other phases.
Anharmonicity and phonons are studied with the Stochastic Self-Consistent Harmonic Approximation (SSCHA)[13, 17]. SSCHA calculations are performed on a 2x2x2 supercell of the B- phase containing 40 atoms; their convergence has been verified by comparing the results obtained in a 3x3x3 supercell with 135 atoms at one temperature (), showing no significant differences. To converge the free energy and the thermodynamic properties (heat capacity and bulk modulus) with the supercell, we exploited the natural division of the SSCHA free energy into a long-range harmonic-like term and the short-range anharmonic correction[17]. The harmonic-like free energy has been interpolated into an 8x8x8 supercell containing 2560 atoms, accounting also for long-range electrostatic interactions (LO-TO splitting). The same conditions were also applied to the Y phases.
To evaluate the thermodynamic properties and second derivatives of the free energy within the SSCHA, we introduce a new algorithm. The properties of interest for this work are related to entropy and pressure as:
| (2) |
| (3) |
| (4) |
where is the isothermal compressibility (the inverse of the bulk modulus) and is the volumetric expansion coefficient, shown in Figure 3. Thanks to correlated sampling[19, 33, 34, 35], we can slightly vary the temperature at a fixed volume without the need for any new DFT calculation, obtaining the free energy and its derivatives (the entropy and the pressure ) at temperatures surrounding the simulated one. We estimate the thermodynamic relations in Eqs. (2),(3),(4) by employing a finite-difference approach on the correlated sampling simulations (see SI for more details).
The free energy Hessian needed to study the stability of the B- phase reported in Figure 1 is computed as
| (5) |
where
| (6) |
and is the two-phonon free propagator as described in Refs.[21, 13, 33]. Usually, four-phonon scattering processes can be neglected in the inversion of Eq. (5)[21, 29, 36, 28, 37, 38, 39] as it plays a negligible effect (bubble approximation). However, we found that its inclusion is necessary here to describe the subtle effects involved in the phase transition; otherwise, the B- becomes unstable at all temperatures.
The spectral function reported in Figure 1 and 2 is defined as:
| (7) |
where is the imaginary part of the -th phonon dynamical Green function at , evaluated with the time-dependent self-consistent harmonic approximation (TD-SCHA) nonperturbatively[17]. The factor makes the integral proportional to the total number of modes.
In Figure 2 we report the full spectral function including the term in the self-energy evaluated on the 40-atom supercell; this is made possible by the use of the Lanczos algorithm recently introduced[17]. This cell is sufficient to get converged spectral function due to the short lifetime of phonons in this material. We choose the value of the smearing by checking the convergence with the supercell, possible only when neglecting the four-phonon scattering in the self-energy with the interpolation introduced in Ref.[36].
References
- [1] Z. Li, F. Zhou, Q. Wang, L. Ding, and Z. Jin, “Approaches for thermodynamically stabilized CsPbI3 solar cells,” Nano Energy, vol. 71, p. 104634, may 2020.
- [2] Y. Jiang, J. Yuan, Y. Ni, J. Yang, Y. Wang, T. Jiu, M. Yuan, and J. Chen, “Reduced-dimensional -CsPbX3 perovskites for efficient and stable photovoltaics,” Joule, vol. 2, pp. 1356–1368, jul 2018.
- [3] G. Wang, J. Chang, J. Bi, M. Lei, C. Wang, and Q. Qiao, “Inorganic CsSnI3 perovskite solar cells: The progress and future prospects,” Solar RRL, p. 2100841, Jan. 2022.
- [4] I. Chung, J.-H. Song, J. Im, J. Androulakis, C. D. Malliakas, H. Li, A. J. Freeman, J. T. Kenney, and M. G. Kanatzidis, “CsSnI3: Semiconductor or metal? high electrical conductivity and strong near-infrared photoluminescence from a single material. high hole mobility and phase-transitions,” Journal of the American Chemical Society, vol. 134, pp. 8579–8587, May 2012.
- [5] B. Lee, C. C. Stoumpos, N. Zhou, F. Hao, C. Malliakas, C.-Y. Yeh, T. J. Marks, M. G. Kanatzidis, and R. P. H. Chang, “Air-stable molecular semiconducting iodosalts for solar cell applications: Cs2SnI6 as a hole conductor,” Journal of the American Chemical Society, vol. 136, pp. 15379–15385, Oct. 2014.
- [6] M. M. S. Karim, A. M. Ganose, L. Pieters, W. W. W. Leung, J. Wade, L. Zhang, D. O. Scanlon, and R. G. Palgrave, “Anion distribution, structural distortion, and symmetry-driven optical band gap bowing in mixed halide cs2SnX6 vacancy ordered double perovskites,” Chemistry of Materials, vol. 31, pp. 9430–9444, Nov. 2019.
- [7] G. Volonakis, M. R. Filip, A. A. Haghighirad, N. Sakai, B. Wenger, H. J. Snaith, and F. Giustino, “Lead-free halide double perovskites via heterovalent substitution of noble metals,” The Journal of Physical Chemistry Letters, vol. 7, pp. 1254–1259, Mar. 2016.
- [8] F. Bertolotti, L. Protesescu, M. V. Kovalenko, S. Yakunin, A. Cervellino, S. J. L. Billinge, M. W. Terban, J. S. Pedersen, N. Masciocchi, and A. Guagliardi, “Coherent nanotwins and dynamic disorder in cesium lead halide perovskite nanocrystals,” ACS Nano, vol. 11, pp. 3819–3831, Apr. 2017.
- [9] M. Kotiuga, S. Halilov, B. Kozinsky, M. Fornari, N. Marzari, and G. Pizzi, “Microscopic picture of paraelectric perovskites from structural prototypes,” Phys. Rev. Research, vol. 4, p. L012042, mar 2022.
- [10] C. Yu, Y. Ren, Z. Chen, and K. Shum, “First-principles study of structural phase transitions in CsSnI3,” Journal of Applied Physics, vol. 114, p. 163505, Oct. 2013.
- [11] E. L. da Silva, J. M. Skelton, S. C. Parker, and A. Walsh, “Phase stability and transformations in the halide perovskite CsSnI3,” Physical Review B, vol. 91, p. 144107, Apr. 2015.
- [12] C. E. Patrick, K. W. Jacobsen, and K. S. Thygesen, “Anharmonic stabilization and band gap renormalization in the perovskite cssni3,” Physical Review B, vol. 92, p. 201205, Nov. 2015.
- [13] L. Monacelli, I. Errea, M. Calandra, and F. Mauri, “Pressure and stress tensor of complex anharmonic crystals within the stochastic self-consistent harmonic approximation,” Physical Review B, vol. 98, p. 024106, July 2018.
- [14] A. Marronnier, G. Roma, M. A. Carignano, Y. Bonnassieux, C. Katan, J. Even, E. Mosconi, and F. D. Angelis, “Influence of disorder and anharmonic fluctuations on the dynamical rashba effect in purely inorganic lead-halide perovskites,” The Journal of Physical Chemistry C, vol. 123, pp. 291–298, Dec. 2018.
- [15] W. Kaiser, M. Carignano, A. A. Alothman, E. Mosconi, A. Kachmar, W. A. Goddard, and F. D. Angelis, “First-principles molecular dynamics in metal-halide perovskites: Contrasting generalized gradient approximation and hybrid functionals,” The Journal of Physical Chemistry Letters, vol. 12, pp. 11886–11893, Dec. 2021.
- [16] T. Tadano and W. A. Saidi, “First-principles phonon quasiparticle theory applied to a strongly anharmonic halide perovskite,” Physical Review Letters, vol. 129, p. 185901, Oct. 2022.
- [17] L. Monacelli and F. Mauri, “Time-dependent self-consistent harmonic approximation: Anharmonic nuclear quantum dynamics and time correlation functions,” Physical Review B, vol. 103, p. 104305, Mar. 2021.
- [18] J. P. Perdew, A. Ruzsinszky, G. I. Csonka, O. A. Vydrov, G. E. Scuseria, L. A. Constantin, X. Zhou, and K. Burke, “Restoring the density-gradient expansion for exchange in solids and surfaces,” Phys. Rev. Lett., vol. 100, p. 136406, Apr 2008.
- [19] I. Errea, M. Calandra, and F. Mauri, “Anharmonic free energies and phonon dispersions from the stochastic self-consistent harmonic approximation: Application to platinum and palladium hydrides,” Physical Review B, vol. 89, p. 064302, Feb. 2014.
- [20] O. Hellman, I. A. Abrikosov, and S. I. Simak, “Lattice dynamics of anharmonic solids from first principles,” Phys. Rev. B, vol. 84, p. 180301, nov 2011.
- [21] R. Bianco, I. Errea, L. Paulatto, M. Calandra, and F. Mauri, “Second-order structural phase transitions, free energy curvature, and temperature-dependent anharmonic phonons in the self-consistent harmonic approximation: Theory and stochastic implementation,” Phys. Rev. B, vol. 96, p. 014111, jul 2017.
- [22] M. Simoncelli, N. Marzari, and F. Mauri, “Unified theory of thermal transport in crystals and glasses,” Nature Physics, vol. 15, pp. 809–813, May 2019.
- [23] T. Lanigan-Atkins, X. He, M. J. Krogstad, D. M. Pajerowski, D. L. Abernathy, G. N. M. N. Xu, Z. Xu, D.-Y. Chung, M. G. Kanatzidis, S. Rosenkranz, R. Osborn, and O. Delaire, “Two-dimensional overdamped fluctuations of the soft perovskite lattice in CsPbBr3,” Nature Materials, vol. 20, pp. 977–983, Mar. 2021.
- [24] H. Xie, S. Hao, J. Bao, T. J. Slade, G. J. Snyder, C. Wolverton, and M. G. Kanatzidis, “All-inorganic halide perovskites as potential thermoelectric materials: Dynamic cation off-centering induces ultralow thermal conductivity,” J. Am. Chem. Soc., vol. 142, pp. 9553–9563, apr 2020.
- [25] K. Momma and F. Izumi, “VESTA3 for three-dimensional visualization of crystal, volumetric and morphology data,” Journal of Applied Crystallography, vol. 44, pp. 1272–1276, Oct. 2011.
- [26] Y. Wang, D. J. Weidner, R. C. Liebermann, X. Liu, J. Ko, M. T. Vaughan, Y. Zhao, A. Yeganeh-Haeri, and R. E. G. Pacalo, “Phase transition and thermal expansion of MgSiO3 perovskite,” Science, vol. 251, pp. 410–413, Jan. 1991.
- [27] Y. Zhao and D. Weidner, “Thermal expansion of SrZrO3 and BaZrO3 perovskites,” Physics and Chemistry of Minerals, vol. 18, pp. 294–301, Dec. 1991.
- [28] R. Bianco, I. Errea, L. Monacelli, M. Calandra, and F. Mauri, “Quantum enhancement of charge density wave in NbS2 in the two-dimensional limit,” Nano Lett., vol. 19, pp. 3098–3103, apr 2019.
- [29] J. Diego, A. H. Said, S. K. Mahatha, R. Bianco, L. Monacelli, M. Calandra, F. Mauri, K. Rossnagel, I. Errea, and S. Blanco-Canosa, “van der waals driven anharmonic melting of the 3d charge density wave in VSe2,” Nature Communications, vol. 12, p. 598, jan 2021.
- [30] L. Monacelli, M. Casula, K. Nakano, S. Sorella, and F. Mauri, “Quantum phase diagram of high-pressure hydrogen,” arXiv, vol. 10.48550/arXiv.2202.05740, 2022-02-11.
- [31] P. Giannozzi, S. Baroni, N. Bonini, M. Calandra, R. Car, C. Cavazzoni, D. Ceresoli, G. L. Chiarotti, M. Cococcioni, I. Dabo, A. D. Corso, S. de Gironcoli, S. Fabris, G. Fratesi, R. Gebauer, U. Gerstmann, C. Gougoussis, A. Kokalj, M. Lazzeri, L. Martin-Samos, N. Marzari, F. Mauri, R. Mazzarello, S. Paolini, A. Pasquarello, L. Paulatto, C. Sbraccia, S. Scandolo, G. Sclauzero, A. P. Seitsonen, A. Smogunov, P. Umari, and R. M. Wentzcovitch, “QUANTUM ESPRESSO: a modular and open-source software project for quantum simulations of materials,” J. Phys.: Condens. Matter, vol. 21, p. 395502, sep 2009.
- [32] M. van Setten, M. Giantomassi, E. Bousquet, M. Verstraete, D. Hamann, X. Gonze, and G.-M. Rignanese, “The PseudoDojo: Training and grading a 85 element optimized norm-conserving pseudopotential table,” Computer Physics Communications, vol. 226, pp. 39–54, may 2018.
- [33] L. Monacelli, R. Bianco, M. Cherubini, M. Calandra, I. Errea, and F. Mauri, “The stochastic self-consistent harmonic approximation: calculating vibrational properties of materials with full quantum and anharmonic effects,” Journal of Physics: Condensed Matter, vol. 33, p. 363001, July 2021.
- [34] M. Miotto and L. Monacelli, “Entropy evaluation sheds light on ecosystem complexity,” Physical Review E, vol. 98, p. 042402, Oct. 2018.
- [35] M. Miotto and L. Monacelli, “TOLOMEO, a novel machine learning algorithm to measure information and order in correlated networks and predict their state,” Entropy, vol. 23, p. 1138, Aug. 2021.
- [36] R. Bianco, I. Errea, M. Calandra, and F. Mauri, “High-pressure phase diagram of hydrogen and deuterium sulfides from first principles: Structural and vibrational properties including quantum and anharmonic effects,” Phys. Rev. B, vol. 97, p. 214101, jun 2018.
- [37] U. Aseginolaza, R. Bianco, L. Monacelli, L. Paulatto, M. Calandra, F. Mauri, A. Bergara, and I. Errea, “Phonon collapse and second-order phase transition in thermoelectric SnSe,” Physical Review Letters, vol. 122, p. 075901, Feb. 2019.
- [38] U. Aseginolaza, R. Bianco, L. Monacelli, L. Paulatto, M. Calandra, F. Mauri, A. Bergara, and I. Errea, “Strong anharmonicity and high thermoelectric efficiency in high-temperature SnS from first principles,” Phys. Rev. B, vol. 100, p. 214307, dec 2019.
- [39] I. Errea, F. Belli, L. Monacelli, A. Sanna, T. Koretsune, T. Tadano, R. Bianco, M. Calandra, R. Arita, F. Mauri, and J. A. Flores-Livas, “Quantum crystal structure in the 250-kelvin superconducting lanthanum hydride,” Nature, vol. 578, pp. 66–69, feb 2020.
Appendix A Heat capacity within the SSCHA theory
The heat capacity is the derivative of entropy with respect to temperature:
| (8) |
since the entropy is the derivative of the free energy
| (9) |
the heat capacity is proportional to the second derivative of the free energy with respect to temperature.
The entropy within the SSCHA is the entropy of the auxiliary harmonic Hamiltonian, i.e.
| (10) |
where are the frequencies of the auxiliary harmonic Hamiltonian that solves the SSCHA at each temperature. The heat capacity is therefore
| (11) |
The first term is the standard specific heat of the quantum harmonic oscillator:
| (12) |
whose high-temperature limit does not depend on the frequencies of the harmonic oscillator:
| (13) |
This limit is reached exponentially fast above the Debye temperature of the highest frequency (in \chCsSnI3 it is about , equivalent to ); therefore, in all the simulation reported, this term is constant and equal to the high temperature limit. The intrinsic anharmonic contribution instead is:
| (14) |
| (15) |
This expression gives the Eq. (1) reported in the main text in the limit .
Notably, the frequencies that appear in this equation are the SSCHA auxiliary frequencies, which are positive definite by construction, and never go to 0 (not even at a phase transition). Therefore, what causes the divergence of the specific heat at the phase transition is not the factor, but an inflection in the curve. Thanks to this feature, the heat capacity remains well defined even below the transition, when the structure is metastable.