[1,2]Anastassia M.Makarieva \Author[1]Andrei V.Nefiodov \Author[3]AnjaRammig \Author[4]Antonio DonatoNobre
1]Theoretical Physics Division, Petersburg Nuclear Physics Institute, 188300 Gatchina, St. Petersburg, Russia 2]Institute for Advanced Study, Technical University of Munich, Lichtenbergstraße 2 a, 85748 Garching, Germany 3]Technical University of Munich, School of Life Sciences, Hans-Carl-von-Carlowitz-Platz 2, 85354 Freising, Germany 4]Centro de Ciência do Sistema Terrestre INPE, São José dos Campos, 12227-010 São Paulo, Brazil
A. M. Makarieva (ammakarieva@gmail.com)
Re-appraisal of the global climatic role of natural forests for improved climate projections and policies
Abstract
Along with the accumulation of atmospheric carbon dioxide, the loss of primary forests and other natural ecosystems is a major disruption of the Earth system causing global concern. Quantifying planetary warming from carbon emissions, global climate models highlight natural forests’ high carbon storage potential supporting conservation policies. However, some model outcomes effectively deprioritize conservation of boreal and temperate forests suggesting that increased albedo upon deforestation could cool the planet. Potential conflict of global cooling versus regional forest conservation could harm environmental policies. Here we present theoretical and observational evidence to demonstrate that, compared to the carbon-related warming, the model skills for assessing climatic impacts of deforestation is low. We argue that deforestation-induced global cooling results from the models’ limited capacity to account for the global effect of cooling from evapotranspiration of intact forests. Transpiration of trees can change the greenhouse effect via small modifications of the vertical temperature profile. Due to their convective parameterization (which postulates a certain critical temperature profile), global climate models do not properly capture this effect. This parameterization may lead to underestimation of warming from the loss of evapotranspiration in both high and low latitidues, and therefore, conclusions about deforestation-induced global cooling are not robust. To avoid deepening the environmental crisis, these conclusions should not inform policies of vegetation cover management. Studies are mounting quantifying the stabilizing impact of natural ecosystems evolved to maintain environmental homeostasis. Given the critical state and our limited understanding of both climate and ecosystems, an optimal policy would be a global moratorium on the exploitation of all natural forests.
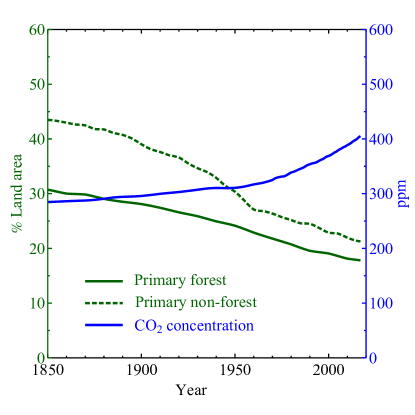
The Earth is suffering from climate destabilization and ecosystem degradation (Fig. 1), and the humanity seeks to stop both (IPBES, 2019). Policies for global climate stabilisation, with the focus on decarbonization, are informed by the outcomes of global climate models that formalize our evolving understanding of the Earth system – currently, by the model simulations from the 6th Coupled Model Intercomparison (CMIP6) for the 6th Assessment Report of the Intergovernmental Panel on Climate Change IPCC (IPCC-AR6; IPCC 2021). With the Intergovernmental Science-Policy Platform on Biodiversity and Ecosystem Services (IPBES) formed twenty four years later than IPCC, the ecosystem preservation narrative is less formally developed (Wilhere, 2021). Proponents of ecosystem preservation often borrow from the decarbonization argumentation and invoke the carbon storage potential of natural forests as a major illustration of their climatic importance. For example, the ground-breaking proforestation initiative in the United States began with emphasizing how much carbon the unexploited forests can remove from the atmosphere if allowed to develop to their full ecological potential (Moomaw et al., 2019).
However, the carbon-storage argument for temperate and boreal forests is undermined by the fact that global climate models suggest that deforestation in these regions could cool the planet. Here increased albedo is estimated to overcome the warming caused by deforestation-induced carbon emissions (Jia et al., 2019, Fig. 2.17), even if the latter can be underestimated (Schepaschenko et al., 2021). These model outcomes have been known for quite a while (e.g, Snyder et al., 2004), but recently these ideas gained prominence approaching implementation. A recent Science commentary warned that regrowing boreal forests would not make the Earth cooler (Pearce, 2022), a conclusion that is purely derived from global climate model simulations (e.g., De Hertog et al., 2022). The World Resources Institute’s report “Not just carbon” noted that the increased albedo from deforestation would cool the Earth and emphasized that the positive climate role of boreal forests is only local (Seymour et al., 2022a, b). Accordingly, a recent study in Nature Ecology and Evolution did not include primary boreal forests into Nature’s critical assets (Chaplin-Kramer et al., 2022). One of the criteria for an ecoregion to be classified as a critical asset, was its proximity to people – and primary boreal forests are often distant from any human settlements (which is a major reason for why they are still primary). Together, these mainstream messages not only de-emphasize the preservation of natural boreal and, to a lesser degree, temperate forests, but implicitly incentivize their destruction.
In this Perspective, we would like to ring an alarm bell by showing that this potentially biased picture of the role of natural forests, in particular boreal forests, for stabilizing Earth’s climate is based on a few model assumptions ruling out important evapotranspiration feedbacks and can result in policies deepening rather than mitigating the climate crisis. We also outline a possible path forward.
1 Global cooling from plant transpiration
1.1 Local versus global cooling
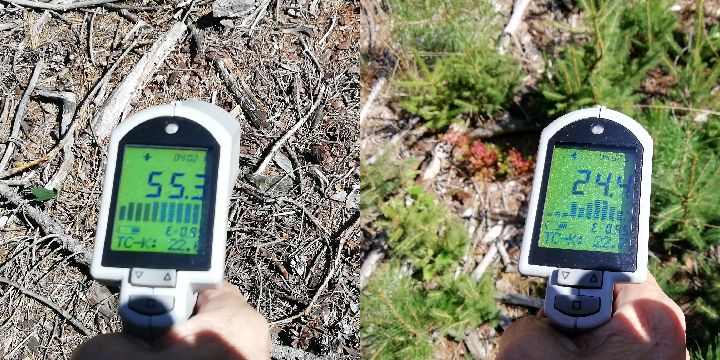
We argue that the conclusion of a cooler Earth upon the loss of boreal forests stems from the limited capacity of global climate models to quantify another effect of the opposite sign: global cooling from forest transpiration. That transpiring plants provide local cooling is well-known (e.g., Huryna and Pokorný, 2016; Alkama and Cescatti, 2016; Ellison et al., 2017; Hesslerová et al., 2018, and see Fig. 2). Instead of converting to heat, a certain part of absorbed solar energy is spent to break the intermolecular (hydrogen) bonds between the water molecules during evapotranspiration. As a result, the evaporating surface cools.
When more sunlight is reflected back to space, the planet receives less energy and it is intuitively clear that it must cool. In comparison, although evaporation does cool locally, the captured energy does not disappear but is released upon condensation elsewhere in the Earth system. In contrast with the well developed methodology of explaining the rising planetary temperature with increasing CO2 (e.g., Benestad, 2017, and references therein), how and whether loss of plant transpiration could warm the planet remains unclear. While the IPCC science does recognize that global cooling from plant transpiration exists (Jia et al., 2019, Fig. 2.17), its description is not to be found in textbooks. However, with the environmental science being inherently transdisciplinary, understanding this effect is important for the broader community of ecosystem researchers and conservationists, as it will enable a critical assessment of model outputs offered to guide large-scale vegetation management.
1.2 Conceptual picture
To illustrate the effect, we will use a simple model of energy transfer (Fig. 3). The greenhouse substances are represented by discrete layers that absorb all incoming thermal radiation and radiate all absorbed energy equally up and down. In the absence of absorbers, the Earth’s surface emits as much thermal radiation as it receives from the Sun (Fig. 3a). Each layer of the greenhouse substances redirects part of the thermal radiation back to the Earth’s surface. As a result, the planetary surface warms, and the more so, the greater the amount of absorbers (cf. Fig. 3b and c).
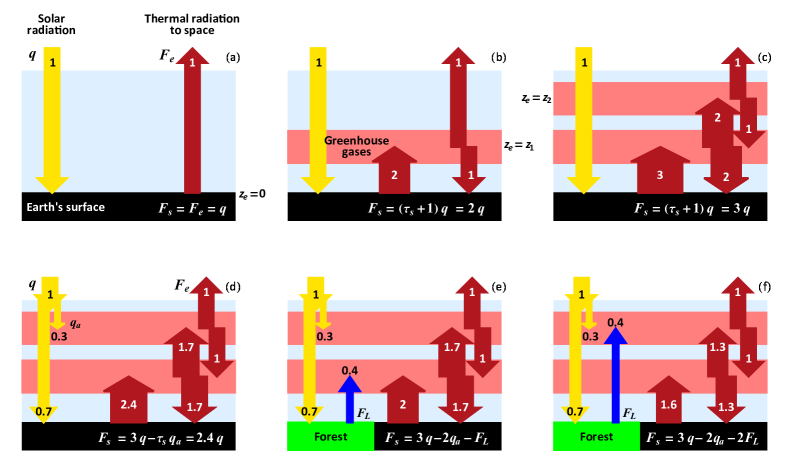
When a certain part of the incoming solar radiation is absorbed in the upper atmosphere (for example, by aerosols or clouds), it escapes interaction with the absorbers beneath. Accordingly, the planetary surface cools by an amount by which the absorbers would multiply this escaping part if it dissipated to thermal radiation at the surface (cf. Fig. 3c and d). This illustrates how where the solar energy dissipates to thermal radiation, with unchanged amount of greenhouse gases and total absorbed solar energy, impacts the planetary surface temperature.
Similarly, in the presence of the non-radiative heat fluxes of sensible and latent heat, the amount of solar energy converted to thermal radiation at the surface diminishes – and so does the amount of thermal radiation redirected by the absorbers back to the surface. Surface thermal radiation and temperature decline (cf. Fig. 3d and e,f). The non-radiative fluxes “hide” a certain part of absorbed solar energy from the greenhouse substances easing its ultimate release to space. Convection, condensation and precipitation “deposit the latent heat removed from the surface above the level of the main water vapor absorbers, whence it is radiated to space” (Bates, 2003). This energy escaping partially from interaction with the absorbers is the cause of global cooling from plant transpiration.
A related process is the atmospheric transport of heat from the equator to higher latitudes, where the water vapor concentration in the colder atmosphere is smaller. This transport likewise “hides” a certain part of solar energy absorbed at the equator from the abundant greenhouse substances (water vapor) in the warm tropical atmosphere. In the result, despite the amount of absorbers does not change, the globally averaged greenhouse effect diminishes and the planetary surface cools (Bates, 1999; Caballero, 2001). Marvel et al. (2013) modeled an idealized atmosphere with two strong circulation cells connecting the equator and the poles. With such a circulation, the Earth’s surface became eleven degrees Kelvin cooler than the modern Earth (Marvel et al., 2013, their Fig. 1e and Fig. 3 bottom).
Increasing the non-radiative flux (from zero in (d) to in (e) and (f)) decreases surface thermal radiation by a magnitude proportional to itself and to the number of absorbing layers beneath the height where this flux dissipates to thermal radiation ( in (e) and in (f)). Historical deforestation affected about of land area (or of planetary surface) (Fig. 1). With the global mean latent flux of W m-2, if deforestation has reduced this flux by thirty per cent (), this could increase the surface radiation by W m-2 (cf. Fig. 3d and e) or twice that value (cf. Fig. 3d and f), Table 1. Given an equilibrium climate sensitivity K/(W m-2) (Zelinka et al., 2020), the latter case corresponds to a warming of about two degrees Kelvin (Table 1). This should be manifested as an increase in the temperature difference between the surface and the upper radiative layer (the mean temperature lapse rate , Fig. 3). If the optical thickness of the atmosphere is greater, the cooling will be proportionally larger.
| Study | Area affected | () | () | (K) | |
|---|---|---|---|---|---|
| Snyder et al. (2004) | Tropical∗ | ||||
| Davin and de Noblet-Ducoudré (2010) | Global∗∗ | ||||
| This work (Fig. 3d,f) | Historical∗∗∗ |
-
∗ Tropical forests replaced by deserts in a coupled atmosphere-biosphere model.
∗∗ Deforestation of a fully forested planet without changing the albedo; is the sum of two effects, change in roughness and change in evapotranspiration efficiency as shown in Table 1 of Davin and de Noblet-Ducoudré (2010).
∗∗∗ Estimated as , assuming that deforestation reduces latent heat flux by of W m-2 (Trenberth et al., 2009) on of land (the area affected by historical deforestation (Fig. 1), is the relative global land area) with as optical depth of the atmosphere (Fig. 3d,f); K/(W m-2) is the assumed equilibrium climate sensitivity to radiative forcing.
1.3 Dependence of global transpirational cooling on atmospheric circulation
The higher up convection transports heat, the more pronounced global cooling it exerts as the energy is radiated more directly to space from the upper atmospheric layer (cf. Fig. 3e and f).
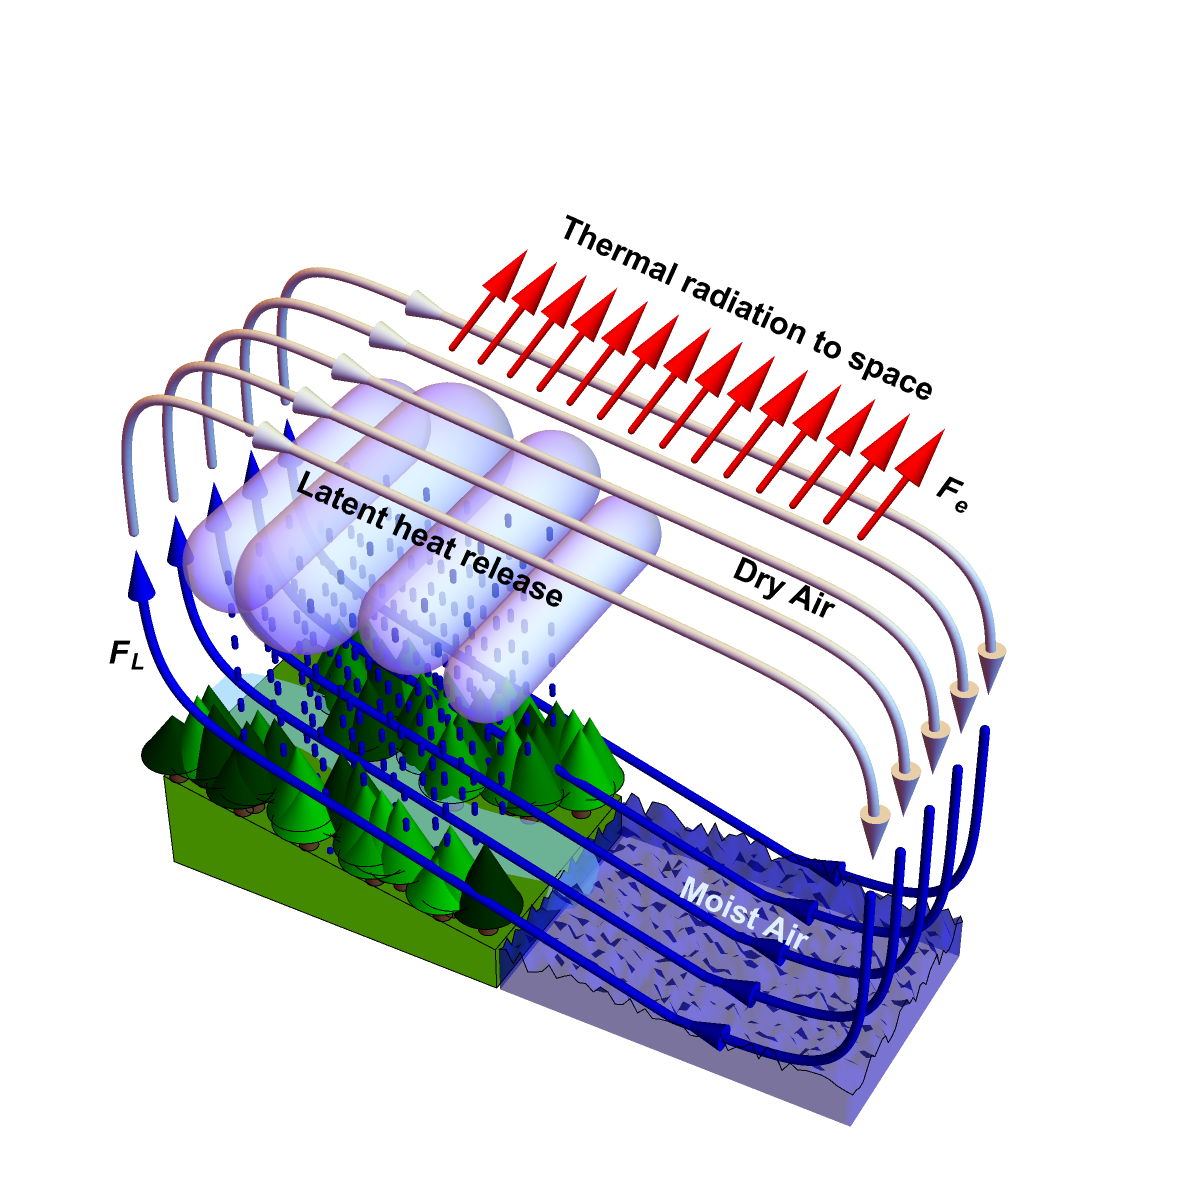
Besides the altitude, it matters how rapidly the air ultimately descends. When the air rises and increases its potential energy in the gravitational field, its internal energy accordingly declines, and it cools. As originally evaporation cooled the evaporating surface, the release of latent heat during condensation in the rising air partially offsets this decline of the internal energy of air molecules making the air warmer than it would be without condensation. Radiating this extra thermal energy to space takes time. The more time the air warmed by latent heat release spends in the upper atmosphere (above the main absorbers), the more energy is radiated unimpeded to space and the stronger the global transpirational cooling. With the characteristic radiative cooling rate of the order of K day-1, it takes about fifteen-thirty days to radiate the latent heat released by tropical moist convection (Goody, 2003).
Therefore, the long-distance moisture transport (including the biotic pump run by forests, Makarieva and Gorshkov, 2007) enhances global transpirational cooling: moist air travels for many days thousands of kilometers from the ocean to land where it ascends and latent heat is released. Then the dry air warmed by latent heat makes the same long way back in the upper atmosphere radiating energy to space (Fig. 4). If, on the contrary, the warmed air descends rapidly and locally, then most heat is brought back to the surface before it is radiated, and the net cooling effect can be nullified. Disruptions in the long-distance moisture transport (e.g., by deforestation) and violent local rains should warm the Earth. In smaller convective clouds up to a quarter of ascending air descends locally at a relatively high vertical velocity (Heus and Jonker, 2008; Katzwinkel et al., 2014).
Global climate models do not correctly reproduce either the long-distance ocean-to-land moisture transport or the moisture transport over the ocean (Sohail et al., 2022). For example, the Amazon streamflow is underestimated by up to 50% (Marengo, 2006; Hagemann et al., 2011, their Fig. 5). This corresponds to a 10% error in the global continental streamflow, the latter being of the same order as global continental evaporation. Nor do global climate models correctly reproduce how the local diurnal cycle of convection changes upon deforestation producing extreme low and high temperatures (Lejeune et al., 2017, their Fig. 7). These are indirect indications of the models’ limited capacity to reproduce global transpirational cooling.
1.4 Global transpirational cooling in global climate models
We have seen that, for a given amount of absorbers, surface temperature is determined by the vertical distribution of the non-radiative heat fluxes (Fig. 3d-f). But these fluxes themselves depend on the vertical temperature gradient: if the air temperature declines with height faster than a certain critical lapse rate111Lapse rate is the absolute magnitude of the vertical temperature gradient, ., the atmosphere is unstable to convection. The non-radiative heat fluxes originate proportional to the difference between the actual and the critical temperature lapse rates (Ramanathan and Coakley Jr., 1978).
Therefore, strictly speaking, it is not justified to freely vary where and how the non-radiative heat fluxes dissipate to thermal radiation, not paying attention to whether the resulting vertical temperature profile is consistent with their specified values. However, since the non-radiative (convective) and net radiative energy fluxes in the Earth’s atmosphere are of the same order of magnitude ( and W m-2, respectively Trenberth et al., 2009), a rough estimate of global transpirational cooling can be obtained from considering the radiative transfer alone as done in Fig. 3d-f. (This would not be possible if the convective fluxes were an order of magnitude higher than the radiative flux). We emphasize that our goal here is not to obtain an accurate estimate of global transpirational cooling, but to present plausible arguments showing that it can be large.
An exact estimate of what happens when the evapotranspiration and the latent heat flux are suppressed on a certain part of land area requires solving the problem simultatenously for the radiative-convective transfer and the temperature profile. This problem is too complicated for modern global climate models, which therefore apply the so-called convective parameterization. The idea is to postulate the (generally unknown) value of a critical temperature lapse rate instead of solving for it. While the numerical simulation is run, “whenever the radiative equilibrium lapse rate is greater than the critical lapse rate, the lapse rate is set equal to the critical lapse rate” (Ramanathan and Coakley Jr., 1978). Therefore, by construction, global climate models cannot provide any independent information about the climatic effect of evapotranspirational cooling – that should be manifested as the change in the global mean lapse rate – besides what was fed into them a priori via convective parameterization.
Global climate models have been built with a major goal to assess radiative forcing from changing carbon dioxide concentrations. They do have this capacity: this forcing can be approximately estimated assuming an unchanged atmospheric temperature profile. It is under this assumption that Arrhenius (1896) obtained the first ever estimate of global warming from CO2 doubling222If the lapse rate is known, an alternative way to calculate how surface temperature rises with increasing concentration of greenhouse substances is to calculate the change of radiative height (cf. Fig. 3b and c) using the hydrostatic equilibrium; then use .. But radiative forcing caused by the suppression of evapotranspiration is a conceptually different problem for which convective parameterization precludes a solution that would be non-zero in the first order. Therefore, in the models, global warming resulting from the loss of transpirational cooling is, for the same deforested area, at least one order of magnitude smaller than our estimate (Table 1). For example, according to global climate models, tropical deforestation on of land area would produce a global warming of K (Snyder et al., 2004), while converting most land from forest to grassland (with unchanged albedo) would warm the Earth by about half a degree Kelvin (Davin and de Noblet-Ducoudré, 2010), see Table 1.
As an illustration of the lack of conceptual clarity with regard to global transpirational cooling, one can refer to the conclusion of Davin and de Noblet-Ducoudré (2010, their Table 1) that modeled global warming due to the loss of evapotranspiration is a “non-radiative” forcing as compared to the change of albedo. This conclusion is reached by noting that loss of evapotranspiration practically does not change the radiation balance at the top of the atmosphere: such that . However, using this logic, CO2 increase would not be a radiative forcing either, because, once the planetary temperature equilibrates, CO2 increase per se (feedbacks absent) does not change the outgoing radiation at the top of the atmosphere. Indeed, Fig. 3 illustrates how the planetary temperature changes due to the radiative forcing from an increased amount of greenhouse substances (a-c) and due to the radiative forcing from changing non-radiative fluxes (d-f). The incoming solar and outgoing longwave radiation remain the same in all cases ( and ).
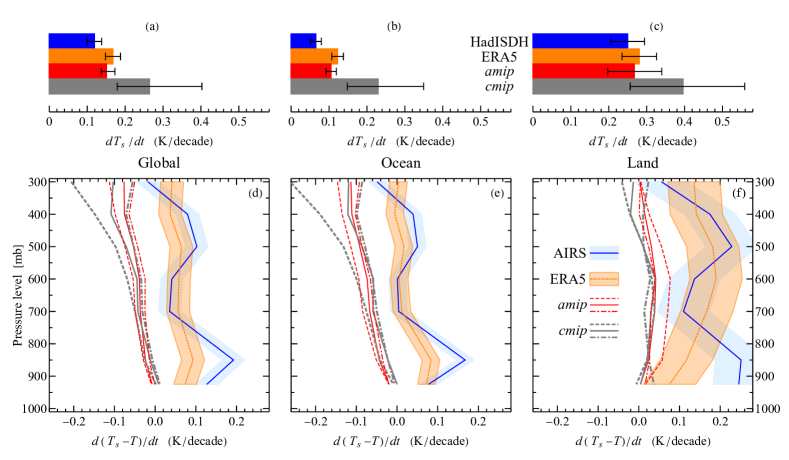
In current models, it is assumed that as the planet warms, the temperature lapse rate should slightly diminish following moist adiabat (the so-called lapse rate feedback, Sejas et al., 2021). This robust model feature is not, however, supported by observations (Fig. 5). Satellite data are consistent with an increase in the lapse rate (Fig. 5). The temperature difference between the surface and the upper radiatve layer (located between and mb, Benestad, 2017) grows at approximately the same rate as the surface temperature itself. This effect is especially pronounced over land (Fig. 5c,f). This is consistent with a radiative forcing imposed by changing non-radiative fluxes, including those due to the land cover change (Fig. 3d-f).
2 Discussion and conclusions
For the ecological audience it could be difficult to assess the credibility of our quantitative estimates, so we would like to emphasize two of the more unequivocal points. First, global climate models do indicate that the regional loss of forest evapotranspiration leads to global warming. Eventhough the effect is small (Table 1), it is of the opposite sign compared to the albedo-related cooling from deforestation that is invoked to argue that certain forests are not globally beneficial in the climate change context. Despite this obvious importance for the policy-relevant model outcomes, a conceptual description of how evapotranspiration cools the Earth, and how its loss would lead to global warming, is absent from the meteorological literature. Conceptual understanding lacking, how can one independently assess whether the models get the effect right?
Second, global warming resulting from the loss of evapotranspiration is to be pronounced as an increase in the vertical lapse rate of air temperature. Due to the convective parameterization, global climate models keep this lapse rate roughly constant as the planet warms (Held and Soden, 2006). However, this robust feature of global climate models does not agree with observations that accommodate a considerable increase in the temperature difference between the surface and the upper radiative layer (Fig. 5).
Policies based on the model outcomes that we have criticized are being shaped right now, and avoiding delays in their re-evaluation is desirable. While the above arguments are percolating the meteorological literature, interested readers can approach their colleagues in the field of meteorology to see how they respond to the above two challenges, and thus get an indirect confirmation (or disproval) of our argumentation.
Our results highlight the importance of a valid concept put in the core of a model. The assumption of an a priori specified critical lapse rate in the convective parameterization yields a negligible global transpirational cooling, which translates into de-emphasizing the preservation of boreal forests. Concepts are powerful; incorrect concepts can be destructive. This brings us to the question, is there a concept that ecology could offer to put in the core of a global climate model, to adequately represent the biosphere?
From our perspective, it is the concept of environmental homeostasis, which is the capacity of natural ecosystems to compensate for environmental disturbances and stabilize a favorable for life environment and climate (Lovelock and Margulis, 1974; Gorshkov, 1995). Recent studies discuss how the biotic control can be evident in the observed dynamics of the Earth’s temperature (Leggett and Ball, 2020, 2021; Arnscheidt and Rothman, 2022). When the information about how the natural ecosystem influences environment is lacking, the best guess could be to assume that they provide a stabilising feedback to the disturbance.
There was already a predicament in climate science that could have been facilitated by such an approach. It was the “missing sink” problem: when the rates of carbon accumulation in the atmosphere and the ocean became known with sufficient accuracy, it turned out that a signifcant part of fossil fuel emissions could not be accounted for. The enigmatic “missing sink” was later assigned to the terrestrial biota (Popkin, 2015). While now it is commonly referred to as plant CO2 fertilization, this is a response at the level of the ecological community as a whole: for there to be a net sink, as the plants synthesize more organic matter, heterotrophs must refrain from decomposing it at a higher rate under the warming conditions (cf. Wieder et al., 2013). Surprisingly, while the idea that ecological succession proceeds in the direction of the ecosystem attaining increased control of the environment and maximum protection from environmental perturbations was dominant in ecology (Odum, 1969), a community’s stabilizing response to the CO2 disturbance was not predicted but rather opposed by ecologists on the basis that undisturbed ecosystems should have a closed matter cycle333This represents what can be called Odum’s paradox, who thought that ecological succession culminates in ecosystem’s maximum control of the environment (Odum, 1969). But if the ecosystem functions on the basis of closed matter cycles, its environmental impact (and, hence, environmental control) is zero by definition. The biotic regulation concept introduced the notion of directed openness of the matter cycles to compensate for environmental disturbances (Gorshkov, 1995). (Hampicke, 1980; Amthor, 1995). However, based on the premises of the biotic regulation concept (Gorshkov, 1995; Gorshkov et al., 2000), and long before the missing sink was assigned to the terrestrial biota, Gorshkov (1986, p. 946) predicted that the undisturbed ecosystems should perform a compensatory response to rising atmospheric CO2 by elevating synthesis of carbohydrates.
Today, climate science faces a new challenge. Global climate models with an improved representation of clouds display a higher sensitivity of the Earth’s climate to CO2 doubling than models with a poorer representation of clouds (Zelinka et al., 2020; Kuma et al., 2022). This implies more dire projections for future climate change, but also poses the problem of how to account for the past temperature changes that are not affected by the model improvements and have been satisfactorily explained assuming a lower climate sensitivity. The concept of the environmental homeostasis and the biotic regulation of the environment provide a possible solution: the climate sensitivity may have been increasing with time – reflecting the decline of natural ecosystems and their global stabilising impact (Fig. 1).
Currently model uncertainties are assessed by comparing outputs from models developed by different research centers (Zelinka et al., 2020). This provides a minimal uncertainty estimate, as the model development may follow universal principles sharing both progress and errors. A distinct approach would be to attempt building a model that departs significantly from the others in its core concept and see if such a model can be plausibly tuned to competitively describe observations. Success of such a model would force the range of model uncertainties to be extended. As global climate models are currently being used to navigate our spacecraft Earth, with its multibillion crew, through the storm of global climate disruption, such a stress test on their performance would not be superfluous.
Such an endeavour requires a plausible alternative concept, and we propose that a global climate model built around the stabilising impact of natural ecosystems can become such an alternative. This will require an interdisciplinary effort and an account of global transpirational cooling, the role of natural ecosystems in the long-distance moisture transport (Makarieva and Gorshkov, 2007; van der Ent et al., 2010; Ellison et al., 2012; Poveda et al., 2014; Molina et al., 2019) and water cycle stabilization (O’Connor et al., 2021; Baudena et al., 2021; Zemp et al., 2017) and the distinct impact of ecosystems at different stages of ecological succession on the surface temperature and fire regime (e.g., Baker and Spracklen, 2019; Aleinikov, 2019; Lindenmayer et al., 2022) and the cloud cover (Cerasoli et al., 2021; Duveiller et al., 2021). Living systems function on the basis of solar energy that under terrestrial conditions can be converted to useful work with a near efficiency. What processes are enacted with use of this energy, is determined by the genetic programs of all the organisms composing the ecological community. Randomly changing the species composition and morphological status of living organisms in the community – for example, by replacing natural forest with a plantation with maximized productivity or by forcing the forest to remain in the early successional state (Kellett et al., 2023) – disturbs the flow of environmental information and disrupts the ecosystem’s capacity to respond to environmental disturbances.
While fundamental science is being advanced, the precautionary principle should be strictly applied. Any control system increases its feedback as the perturbation grows. Therefore, as the climate destabilisation deepens, the remaining natural ecosystems should be exerting an ever increasing compensatory impact per unit area. In other words, the global climate price of losing a hectare of natural forest grows as the climate situation worsens. We call for an urgent global moratorium on the exploitation of the remaining natural ecosystems and a broad application of the proforestation strategy to allow them to restore to their full ecological and climate-regulating potential.
Acknowledgments
The auhors are grateful to Jan Pokorný, David Ellison, Ugo Bardi, Jon Schull and Zuzana Mulkerin for useful discussions. We thank Richard P. Allan for kindly supplying the data for trends in atmospheric and near surface temperature in numerical form. The work of A.M. Makarieva is partially funded by the Federal Ministry of Education and Research (BMBF) and the Free State of Bavaria under the Excellence Strategy of the Federal Government and the Länder, as well as by the Technical University of Munich – Institute for Advanced Study.
References
- Aleinikov (2019) Aleinikov, A.: The fire history in pine forests of the plain area in the Pechora-Ilych Nature Biosphere Reserve (Russia) before 1942: Possible anthropogenic causes and long-term effects, Nat. Conserv. Res., 4, 21–34, 10.24189/ncr.2019.033, 2019.
- Alkama and Cescatti (2016) Alkama, R. and Cescatti, A.: Biophysical climate impacts of recent changes in global forest cover, Science, 351, 600–604, 10.1126/science.aac8083, 2016.
- Allan et al. (2022) Allan, R. P., Willett, K. M., John, V. O., and Trent, T.: Global changes in water vapor 1979–2020, J. Geophys. Res.: Atmos., 127, e2022JD036 728, 10.1029/2022JD036728, 2022.
- Amthor (1995) Amthor, J. S.: Terrestrial higher-plant response to increasing atmospheric [CO2] in relation to the global carbon cycle, Glob. Change Biol., 1, 243–274, 10.1111/j.1365-2486.1995.tb00025.x, 1995.
- Arnscheidt and Rothman (2022) Arnscheidt, C. W. and Rothman, D. H.: Presence or absence of stabilizing Earth system feedbacks on different time scales, Sci. Adv., 8, eadc9241, 10.1126/sciadv.adc9241, 2022.
- Arrhenius (1896) Arrhenius, S.: XXXI. On the influence of carbonic acid in the air upon the temperature of the ground, Lond. Edinb. Dublin Philos. Mag. J. Sci., 41, 237–276, 10.1080/14786449608620846, 1896.
- Baker and Spracklen (2019) Baker, J. C. A. and Spracklen, D. V.: Climate benefits of intact Amazon forests and the biophysical consequences of disturbance, Front. For. Glob. Change, 2, 10.3389/ffgc.2019.00047, 2019.
- Bates (1999) Bates, J. R.: A dynamical stabilizer in the climate system: A mechanism suggested by a simple model, Tellus A: Dyn. Meteorol. Oceanogr., 51, 349–372, 10.3402/tellusa.v51i3.13458, 1999.
- Bates (2003) Bates, J. R.: On climate stability, climate sensitivity and the dynamics of the enhanced greenhouse effect, DCESS REPORT, 3, 1–38, 2003.
- Baudena et al. (2021) Baudena, M., Tuinenburg, O. A., Ferdinand, P. A., and Staal, A.: Effects of land-use change in the Amazon on precipitation are likely underestimated, Glob. Change Biol., 27, 5580–5587, 10.1111/gcb.15810, 2021.
- Benestad (2017) Benestad, R. E.: A mental picture of the greenhouse effect, Theor. Appl. Climatol., 128, 679–688, 10.1007/s00704-016-1732-y, 2017.
- Caballero (2001) Caballero, R.: Surface wind, subcloud humidity and the stability of the tropical climate, Tellus A: Dyn. Meteorol. Oceanogr., 53, 513–525, 10.3402/tellusa.v53i4.12224, 2001.
- Cerasoli et al. (2021) Cerasoli, S., Yin, J., and Porporato, A.: Cloud cooling effects of afforestation and reforestation at midlatitudes, Proc. Natl. Acad. Sci. USA, 118, 10.1073/pnas.2026241118, 2021.
- Chaplin-Kramer et al. (2022) Chaplin-Kramer, R., Neugarten, R. A., Sharp, R. P., Collins, P. M., Polasky, S., Hole, D., Schuster, R., Strimas-Mackey, M., Mulligan, M., Brandon, C., Diaz, S., Fluet-Chouinard, E., Gorenflo, L. J., Johnson, J. A., Kennedy, C. M., Keys, P. W., Longley-Wood, K., McIntyre, P. B., Noon, M., Pascual, U., Reidy Liermann, C., Roehrdanz, P. R., Schmidt-Traub, G., Shaw, M. R., Spalding, M., Turner, W. R., van Soesbergen, A., and Watson, R. A.: Mapping the planet’s critical natural assets, Nat. Ecol. Evol., 10.1038/s41559-022-01934-5, 2022.
- Davin and de Noblet-Ducoudré (2010) Davin, E. L. and de Noblet-Ducoudré, N.: Climatic impact of global-scale deforestation: Radiative versus nonradiative processes, J. Clim., 23, 97–112, 10.1175/2009JCLI3102.1, 2010.
- De Hertog et al. (2022) De Hertog, S. J., Havermann, F., Vanderkelen, I., Guo, S., Luo, F., Manola, I., Coumou, D., Davin, E. L., Duveiller, G., Lejeune, Q., Pongratz, J., Schleussner, C.-F., Seneviratne, S. I., and Thiery, W.: The biogeophysical effects of idealized land cover and land management changes in Earth system models, Earth Syst. Dynam., 13, 1305–1350, 10.5194/esd-13-1305-2022, 2022.
- Duveiller et al. (2021) Duveiller, G., Filipponi, F., Ceglar, A., Bojanowski, J., Alkama, R., and Cescatti, A.: Revealing the widespread potential of forests to increase low level cloud cover, Nat. Commun., 12, 4337, 10.1038/s41467-021-24551-5, 2021.
- Ellison et al. (2012) Ellison, D., N. Futter, M., and Bishop, K.: On the forest cover–water yield debate: from demand- to supply-side thinking, Glob. Change Biol., 18, 806–820, 10.1111/j.1365-2486.2011.02589.x, 2012.
- Ellison et al. (2017) Ellison, D., Morris, C. E., Locatelli, B., Sheil, D., Cohen, J., Murdiyarso, D., Gutierrez, V., van Noordwijk, M., Creed, I. F., Pokorny, J., Gaveau, D., Spracklen, D. V., Tobella, A. B., Ilstedt, U., Teuling, A. J., Gebrehiwot, S. G., Sands, D. C., Muys, B., Verbist, B., Springgay, E., Sugandi, Y., and Sullivan, C. A.: Trees, forests and water: Cool insights for a hot world, Glob. Environ. Change, 43, 51–61, 10.1016/j.gloenvcha.2017.01.002, 2017.
- Eyring et al. (2016) Eyring, V., Bony, S., Meehl, G. A., Senior, C. A., Stevens, B., Stouffer, R. J., and Taylor, K. E.: Overview of the Coupled Model Intercomparison Project Phase 6 (CMIP6) experimental design and organization, Geosci. Model Dev., 9, 1937–1958, 10.5194/gmd-9-1937-2016, 2016.
- Gates et al. (1999) Gates, W. L., Boyle, J. S., Covey, C., Dease, C. G., Doutriaux, C. M., Drach, R. S., Fiorino, M., Gleckler, P. J., Hnilo, J. J., Marlais, S. M., Phillips, T. J., Potter, G. L., Santer, B. D., Sperber, K. R., Taylor, K. E., and Williams, D. N.: An overview of the results of the Atmospheric Model Intercomparison Project (AMIP I), Bull. Amer. Meteor. Soc., 80, 29–56, 10.1175/1520-0477(1999)080<0029:AOOTRO>2.0.CO;2, 1999.
- Goody (2003) Goody, R.: On the mechanical efficiency of deep, tropical convection, J. Atmos. Sci., 60, 2827–2832, 10.1175/1520-0469(2003)060<2827:OTMEOD>2.0.CO;2, 2003.
- Gorshkov et al. (2002) Gorshkov, V., Makarieva, A., and Pujol, T.: Radiative-convective processes and changes of the flux of thermal radiation into space with increasing optical thickness of the atmosphere, pp. 499–525, PNPI RAS, Gatchina, St. Petersburg, Russia, Proceedings of the XXXVI Winter School of Petersburg Nuclear Physics Institute (Nuclear and Particle Physics), February 25 – March 3, 2002.
- Gorshkov (1986) Gorshkov, V. G.: Atmospheric disturbance of the carbon cycle: Impact upon the biosphere, Nuov. Cim. C, 9, 937–952, 10.1007/BF02891905, 1986.
- Gorshkov (1995) Gorshkov, V. G.: Physical and biological bases of life stability. Man, Biota, Environment, Springer, Berlin, Heidelberg, 10.1007/978-3-642-85001-1, 1995.
- Gorshkov et al. (2000) Gorshkov, V. G., Gorshkov, V. V., and Makarieva, A. M.: Biotic regulation of the environment: Key issue of global change, Springer, Berlin, 2000.
- Hagemann et al. (2011) Hagemann, S., Chen, C., Haerter, J. O., Heinke, J., Gerten, D., and Piani, C.: Impact of a statistical bias correction on the projected hydrological changes obtained from three GCMs and two hydrology models, J. Hydrometeor., 12, 556–578, 10.1175/2011JHM1336.1, 2011.
- Hampicke (1980) Hampicke, U.: The effect of the atmosphere-biosphere exchange on the global carbon cycle, Experientia, 36, 776–781, 10.1007/BF01978577, 1980.
- Held and Soden (2006) Held, I. M. and Soden, B. J.: Robust responses of the hydrological cycle to global warming, J. Clim., 19, 5686–5699, 10.1175/JCLI3990.1, 2006.
- Hersbach et al. (2020) Hersbach, H., Bell, B., Berrisford, P., Hirahara, S., Horányi, A., Muñoz-Sabater, J., Nicolas, J., Peubey, C., Radu, R., Schepers, D., Simmons, A., Soci, C., Abdalla, S., Abellan, X., Balsamo, G., Bechtold, P., Biavati, G., Bidlot, J., Bonavita, M., De Chiara, G., Dahlgren, P., Dee, D., Diamantakis, M., Dragani, R., Flemming, J., Forbes, R., Fuentes, M., Geer, A., Haimberger, L., Healy, S., Hogan, R. J., Hólm, E., Janisková, M., Keeley, S., Laloyaux, P., Lopez, P., Lupu, C., Radnoti, G., de Rosnay, P., Rozum, I., Vamborg, F., Villaume, S., and Thépaut, J.-N.: The ERA5 global reanalysis, Quart. J. Roy. Meteor. Soc., 146, 1999–2049, 10.1002/qj.3803, 2020.
- Hesslerová et al. (2018) Hesslerová, P., Huryna, H., Pokorný, J., and Procházka, J.: The effect of forest disturbance on landscape temperature, Ecol. Eng., 120, 345–354, 10.1016/j.ecoleng.2018.06.011, 2018.
- Heus and Jonker (2008) Heus, T. and Jonker, H. J. J.: Subsiding shells around shallow cumulus clouds, J. Atmos. Sci., 65, 1003–1018, 10.1175/2007JAS2322.1, 2008.
- Hurtt et al. (2020) Hurtt, G. C., Chini, L., Sahajpal, R., Frolking, S., Bodirsky, B. L., Calvin, K., Doelman, J. C., Fisk, J., Fujimori, S., Klein Goldewijk, K., Hasegawa, T., Havlik, P., Heinimann, A., Humpenöder, F., Jungclaus, J., Kaplan, J. O., Kennedy, J., Krisztin, T., Lawrence, D., Lawrence, P., Ma, L., Mertz, O., Pongratz, J., Popp, A., Poulter, B., Riahi, K., Shevliakova, E., Stehfest, E., Thornton, P., Tubiello, F. N., van Vuuren, D. P., and Zhang, X.: Harmonization of global land use change and management for the period 850–2100 (LUH2) for CMIP6, Geosci. Model Dev., 13, 5425–5464, 10.5194/gmd-13-5425-2020, 2020.
- Huryna and Pokorný (2016) Huryna, H. and Pokorný, J.: The role of water and vegetation in the distribution of solar energy and local climate: A review, Folia Geobot., 51, 191–208, 10.1007/s12224-016-9261-0, 2016.
- IPBES (2019) IPBES: Global assessment report on biodiversity and ecosystem services of the Intergovernmental Science-Policy Platform on Biodiversity and Ecosystem Services, IPBES secretariat, Bonn, Germany, 10.5281/zenodo.6417333, 1148 pages, 2019.
- IPCC (2021) IPCC: Climate Change 2021: The Physical Science Basis. Contribution of Working Group I to the Sixth Assessment Report of the Intergovernmental Panel on Climate Change, Cambridge University Press, Cambridge, United Kingdom and New York, NY, USA, 10.1017/9781009157896, in press, 2021.
- Jia et al. (2019) Jia, G., Shevliakova, E., Artaxo, P., De Noblet-Ducoudré, N., Houghton, R., House, J., Kitajima, K., Lennard, C., Popp, A., Sirin, A., Sukumar, R., and Verchot, L.: Chapter 2. Land-climate interactions, in: Climate Change and Land: an IPCC special report on climate change, desertification, land degradation, sustainable land management, food security, and greenhouse gas fluxes in terrestrial ecosystems, edited by Shukla, P. R., Skea, J., Calvo Buendia, E., Masson-Delmotte, V., Pörtner, H.-O., Roberts, D. C., Zhai, P., Slade, R., Connors, S., van Diemen, R., Ferrat, M., Haughey, E., Luz, S., Neogi, S., Pathak, M., Petzold, J., Portugal Pereira, J., Vyas, P., Huntley, E., Kissick, K., Belkacemi, M., and Malley, J., URL https://www.ipcc.ch/srccl/cite-report/, in press, 2019.
- Katzwinkel et al. (2014) Katzwinkel, J., Siebert, H., Heus, T., and Shaw, R. A.: Measurements of turbulent mixing and subsiding shells in trade wind cumuli, J. Atmos. Sci., 71, 2810–2822, 10.1175/JAS-D-13-0222.1, 2014.
- Kellett et al. (2023) Kellett, M. J., Maloof, J. E., Masino, S. A., Frelich, L. E., Faison, E. K., Brosi, S. L., and Foster, D. R.: Forest-clearing to create early-successional habitats: Questionable benefits, significant costs, Front. For. Glob. Change, 5, 10.3389/ffgc.2022.1073677, 2023.
- Kuma et al. (2022) Kuma, P., Bender, F. A.-M., Schuddeboom, A., McDonald, A. J., and Seland, Ø.: Machine learning of cloud types shows higher climate sensitivity is associated with lower cloud biases, Atmos. Chem. Phys. Discuss., 2022, 1–32, 10.5194/acp-2022-184, [preprint], 2022.
- Leggett and Ball (2020) Leggett, L. M. W. and Ball, D. A.: Observational evidence that a feedback control system with proportional-integral-derivative characteristics is operating on atmospheric surface temperature at global scale, Tellus A: Dyn. Meteorol. Oceanogr., 72, 1–14, 10.1080/16000870.2020.1717268, 2020.
- Leggett and Ball (2021) Leggett, L. M. W. and Ball, D. A.: Empirical evidence for a global atmospheric temperature control system: physical structure, Tellus A: Dyn. Meteorol. Oceanogr., 73, 1–24, 10.1080/16000870.2021.1926123, 2021.
- Lejeune et al. (2017) Lejeune, Q., Seneviratne, S. I., and Davin, E. L.: Historical land-cover change impacts on climate: Comparative assessment of LUCID and CMIP5 multimodel experiments, J. Clim., 30, 1439–1459, 10.1175/JCLI-D-16-0213.1, 2017.
- Lindenmayer et al. (2022) Lindenmayer, D. B., Bowd, E. J., Taylor, C., and Likens, G. E.: The interactions among fire, logging, and climate change have sprung a landscape trap in Victoria’s montane ash forests, Plant Ecol., 223, 733–749, 10.1007/s11258-021-01217-2, 2022.
- Lovelock and Margulis (1974) Lovelock, J. and Margulis, L.: Atmospheric homeostasis by and for the biosphere: the gaia hypothesis, Tellus, 26, 2–10, 10.3402/tellusa.v26i1-2.9731, 1974.
- Makarieva and Gorshkov (2001) Makarieva, A. and Gorshkov, V.: The greenhouse effect and the stability of the global mean surface temperature, Dokl. Earth Sci., 377, 210–214, 2001.
- Makarieva and Gorshkov (2007) Makarieva, A. M. and Gorshkov, V. G.: Biotic pump of atmospheric moisture as driver of the hydrological cycle on land, Hydrol. Earth Syst. Sci., 11, 1013–1033, 10.5194/hess-11-1013-2007, 2007.
- Marengo (2006) Marengo, J. A.: On the hydrological cycle of the Amazon basin: A historical review and current state-of-the-art, Rev. Bras. Meteorol., 21, 1–19, 2006.
- Marvel et al. (2013) Marvel, K., Kravitz, B., and Caldeira, K.: Geophysical limits to global wind power, Nat. Clim. Change, 3, 118–121, 10.1038/nclimate1683, 2013.
- Molina et al. (2019) Molina, R. D., Salazar, J. F., Martínez, J. A., Villegas, J. C., and Arias, P. A.: Forest-induced exponential growth of precipitation along climatological wind streamlines over the Amazon, J. Geophys. Res.: Atmos., 124, 2589–2599, 10.1029/2018JD029534, 2019.
- Moomaw et al. (2019) Moomaw, W. R., Masino, S. A., and Faison, E. K.: Intact forests in the United States: Proforestation mitigates climate change and serves the greatest good, Front. For. Glob. Change, 2, 10.3389/ffgc.2019.00027, 2019.
- O’Connor et al. (2021) O’Connor, J. C., Dekker, S. C., Staal, A., Tuinenburg, O. A., Rebel, K. T., and Santos, M. J.: Forests buffer against variations in precipitation, Glob. Change Biol., 27, 4686–4696, 10.1111/gcb.15763, 2021.
- Odum (1969) Odum, E. P.: The strategy of ecosystem development: An understanding of ecological succession provides a basis for resolving man’s conflict with nature, Science, 164, 262–270, 10.1126/science.164.3877.262, 1969.
- Pearce (2022) Pearce, F.: The forest forecast, Science, 376, 788–791, 10.1126/science.adc9867, 2022.
- Popkin (2015) Popkin, G.: The hunt for the world’s missing carbon, Nature, 523, 20–22, 10.1038/523020a, 2015.
- Poveda et al. (2014) Poveda, G., Jaramillo, L., and Vallejo, L. F.: Seasonal precipitation patterns along pathways of South American low-level jets and aerial rivers, Water Resour. Res., 50, 98–118, 10.1002/2013WR014087, 2014.
- Ramanathan and Coakley Jr. (1978) Ramanathan, V. and Coakley Jr., J. A.: Climate modeling through radiative-convective models, Rev. Geophys., 16, 465–489, 10.1029/RG016i004p00465, 1978.
- Schepaschenko et al. (2021) Schepaschenko, D., Moltchanova, E., Fedorov, S., Karminov, V., Ontikov, P., Santoro, M., See, L., Kositsyn, V., Shvidenko, A., Romanovskaya, A., Korotkov, V., Lesiv, M., Bartalev, S., Fritz, S., Shchepashchenko, M., and Kraxner, F.: Russian forest sequesters substantially more carbon than previously reported, Sci. Rep., 11, 12 825, 10.1038/s41598-021-92152-9, 2021.
- Sejas et al. (2021) Sejas, S., Hu, X., Cai, M., and Fan, H.: Understanding the differences between TOA and surface energy budget attributions of surface warming, Front. Earth Sci., 9, 10.3389/feart.2021.725816, 2021.
- Seymour et al. (2022a) Seymour, F., Wolosin, M., and Gray, E.: Policies underestimate forests’ full effect on the climate, https://www.wri.org/insights/how-forests-affect-climate, October 23, 2022a.
- Seymour et al. (2022b) Seymour, F., Wolosin, M., and Gray, E.: Not just carbon: Capturing all the benefits of forests for stabilizing the climate from local to global scales, Report, Washington, DC, 10.46830/wrirpt.19.00004, 2022b.
- Snyder et al. (2004) Snyder, P. K., Delire, C., and Foley, J. A.: Evaluating the influence of different vegetation biomes on the global climate, Clim. Dynam., 23, 279–302, 10.1007/s00382-004-0430-0, 2004.
- Sohail et al. (2022) Sohail, T., Zika, J. D., Irving, D. B., and Church, J. A.: Observed poleward freshwater transport since 1970, Nature, 602, 617–622, 10.1038/s41586-021-04370-w, 2022.
- Tian et al. (2019) Tian, B., Fetzer, E. J., and Manning, E. M.: The Atmospheric Infrared Sounder Obs4MIPs Version 2 data set, Earth Space Sci., 6, 324–333, 10.1029/2018EA000508, 2019.
- Trenberth et al. (2009) Trenberth, K. E., Fasullo, J. T., and Kiehl, J.: Earth’s global energy budget, Bull. Amer. Meteor. Soc., 90, 311–324, 10.1175/2008BAMS2634.1, 2009.
- van der Ent et al. (2010) van der Ent, R. J., Savenije, H. H. G., Schaefli, B., and Steele-Dunne, S. C.: Origin and fate of atmospheric moisture over continents, Water Resour. Res., 46, W09 525, 10.1029/2010WR009127, 2010.
- Wieder et al. (2013) Wieder, W. R., Bonan, G. B., and Allison, S. D.: Global soil carbon projections are improved by modelling microbial processes, Nat. Clim. Change, 3, 909–912, 10.1038/nclimate1951, 2013.
- Wilhere (2021) Wilhere, G. F.: A Paris-like agreement for biodiversity needs IPCC-like science, Glob. Ecol. Conserv., 28, 10.1016/j.gecco.2021.e01617, 2021.
- Willett et al. (2014) Willett, K. M., Dunn, R. J. H., Thorne, P. W., Bell, S., de Podesta, M., Parker, D. E., Jones, P. D., and Williams Jr., C. N.: HadISDH land surface multi-variable humidity and temperature record for climate monitoring, Clim. Past, 10, 1983–2006, 10.5194/cp-10-1983-2014, 2014.
- Zelinka et al. (2020) Zelinka, M. D., Myers, T. A., McCoy, D. T., Po-Chedley, S., Caldwell, P. M., Ceppi, P., Klein, S. A., and Taylor, K. E.: Causes of higher climate sensitivity in CMIP6 models, Geophys. Res. Lett., 47, e2019GL085 782, https://doi.org/10.1029/2019GL085782, 2020.
- Zemp et al. (2017) Zemp, D. C., Schleussner, C.-F., Barbosa, H. M. J., and Rammig, A.: Deforestation effects on Amazon forest resilience, Geophys. Res. Lett., 44, 6182–6190, 10.1002/2017GL072955, 2017.