Robust collimated beaming in 3D acoustic sonic crystals
Abstract
We demonstrate strongly collimated beaming, at audible frequencies, in a three-dimensional acoustic phononic crystal where the wavelength is commensurate with the crystal elements; the crystal is a seemingly simple rectangular cuboid constructed from closely-spaced spheres, and yet demonstrates rich wave phenomena acting as a canonical three-dimensional metamaterial. We employ theory, numerical simulation and experiments to design and interpret this collimated beaming phenomenon and use a crystal consisting of a finite rectangular cuboid array of polymer spheres cm in diameter in air, arranged in a primitive cubic cell with the centre-to-centre spacing of the spheres, i.e. the pitch, as cm. Collimation effects are observed in the time domain for chirps with central frequencies at kHz and kHz, and we deployed a laser feedback interferometer or Self-Mixing Interferometer (SMI) – a recently proposed technique to observe complex acoustic fields – that enables experimental visualisation of the pressure field both within the crystal and outside of the crystal. Numerical exploration using a higher-order multi-scale finite element method designed for the rapid and detailed simulation of 3D wave physics further confirms these collimation effects and cross-validates with the experiments. Interpretation follows using High Frequency Homogenization and Bloch analysis whereby the different origin of the collimation at these two frequencies is revealed by markedly different isofrequency surfaces of the sonic crystal.
pacs:
41.20.Jb,42.25.Bs,42.70.Qs,43.20.Bi,43.25.GfI Introduction
A challenge for acoustic phononic crystals is to generate exotic wave phenomena at low-frequencies, i.e. at audible frequencies, and thereby obtain precise control over sound in the human hearing range. Motivated by arrays of closely-spaced two-dimensional crystals Vanel et al. (2017), that have the particularly appealing feature that they operate as subwavelength tuneable metamaterials and allow the cut-off frequency for the acoustic branch to be lowered thereby pulling the entire acoustic branch subwavelength, we explore the potential of closely-packed three dimensional spheres. This closely-packed limit is of interest as, in two-dimensions the analogous cylinder lattices create a network of coupled Helmholtz-like resonators with large voids coupled to each other by narrow gaps and in this way a precise asymptotic approach generates a discrete mass-spring analogy without any need for lumped parameters. A natural extension is to three-dimensions and to see whether closely-packed arrangements of spheres have similar metamaterial behaviours - the situation is considerably more complex as numerical simulations of meaningfully large finite arrays are hampered by the need to resolve the thin air-filled regions between the spheres, the experiments are also difficult as it is hard to image within a crystal, and the asymptotic matching methods Vanel et al. (2017) employed no longer are valid - indeed there are regions where the spheres nearly touch, but equally other regions where the acoustic medium is not as constrained as in two-dimensions - and so there is not a direct analogy with the two-dimensional system of cylinders.
In this article we take a crystal that has close packing, and use a specially designed numerical scheme to overcome the computational issues Gao et al. (2018), an experimental optical interferometry approach Bertling et al. (2014), developed by some of the team, to enable the imaging, and develop the physical modelling and intuition of closely spaced media; bringing all this together then gives a coherent design capability that we use to create collimated beaming and we then demonstrate that closely-packing a simple phononic crystal can enable it to have metamaterial behaviours in the sense that each element within the crystal is subwavelength and yet critically affects the macroscale behaviour. There is a vast literature on acoustic metamaterials, Craster and Guenneau (2012); Kadic et al. (2013); Cummer et al. (2016), including analysis of their 3D effective properties Dupont et al. (2019); Liu and Albert (2006); Yves and Alù (2021) and the fabrication of three dimensional mechanical Bückmann et al. (2012) and acoustic Liu et al. (2020) metamaterials with complex geometry is done routinely nowadays. There is, however, a richness of wave phenomena in simple three-dimensional crystals that has not yet been fully explored, and exploited; an example being the acoustic sonic crystal designed to achieve a flat lens effect Dubois et al. (2019).
We draw upon the extensive literature, primarily in two dimensions and in electromagnetism, using iso-frequency contours to predict extreme dynamic anisotropy; polygonal contours leading to self-collimation Yu and Fan (2003); Chigrin et al. (2003); Prather et al. (2007). Self-collimation is a powerful concept, readily observed in 3D for discrete mass-spring systems Vanel et al. (2016), but apart from some notable examples in electromagnetism, i.e. Lu et al. (2006), its use in three dimensional continuum models has been limited. Prather et al. (2005); Lu et al. (2006) identify degenerate polarised modes in electromagnetism that have distinctive isofrequency surfaces allowing for strong internal beam formation within a crystal and here we identify the existence of acoustic modes, with similar surfaces, that we employ to create collimated beams exiting a phononic crystal. The richness of behaviours possible through dynamic anisotropy is also illustrated in Belov and Simovski (2005) for electromagnetic crystals notably cubic arrays of split ring resonators and also Gralak et al. (2000); Luo et al. (2002); Ceresoli et al. (2015) for dynamic anisotropy in 2D dielectric photonic crystals. We take these approaches into acoustics and demonstrate that, for sources exterior to a crystal, we can use a lattice medium to generate wide or narrow acoustic beams. By doing so we highlight the versatility and tunability that is achievable without introducing complexity to a basic phononic structure and bring numerical, experimental and theoretical analysis to bear to provide a comprehensive analysis of the collimation effects created.
The plan of the article is as follows: The experimental method implemented in this work is based upon the acousto-optic effect that links the refractive index of the medium to the local pressure variations induced by the acoustic waves that propagate Ciddor (1996). A dedicated imaging system has been designed and built that is based on the Self-Mixing Interferometry (SMI) sensing methodology Taimre et al. (2015); Bertling et al. (2014) providing a lightweight, non-intrusive and time-resolved measurement tool; our experimental set-up and results are described in section II.
Our array of spherical rigid spheres of diameter cm for airborne acoustic waves, with a center-to-center spacing cm, are not extremely tightly packed but simulations are none the less challenging in terms of resolving the computations in the narrowest gaps, memory storage constraints, whilst additionally facing the challenge of simulating the fields accurately, and fast, in three-dimensions. Given the challenges this poses for standard finite element methods we opt to use higher-order multi-scale Finite Element Method (HMsFEM Gao et al. (2018); Fu et al. (2019)) that are designed to accurately solve the time-harmonic wave equation with a relatively coarse grid thanks to well-chosen multi-scale basis functions. This makes it possible to rapidly explore wave phenomena for different sonic crystal configurations and for sources at different frequencies: the endoscope phenomenon we illustrate in this article was achieved after fine tuning the geometric and acoustic parameters of a 3D crystal. Section III is devoted to the higher-order Multi-scale Finite Element Method used to numerically solve the scattering problem posed in the whole space, when a source term is present and outgoing wave conditions are enforced with Perfectly Matched Layers (PML). This approach allows us to perform highly accurate numerical simulations rapidly in three-dimensions with a coarse mesh.
In section IV.1 an effective model that works beyond the quasi-static limit is employed to reveal extreme dynamic anisotropy of the crystal at specific frequencies, and this explains the origin of the collimation effect observed at kHz. The experimental characterization of the crystal in the time domain requires a specially designed setup to observe not only the dynamics of the pressure field outside of the crystal, but more importantly, inside of it. For the modelling we use the (non-dimensionalised) Helmholtz equation that holds for time-harmonic acoustic waves:
| (1) |
for with (i.e. everywhere outside of the spheres in the absence of a source) with , with the cubic array pitch (in unit of meters) and where is the angular frequency (in unit of rad/s) and m/s. Consistent with the acoustically sound-hard boundary conditions on each sphere, we take Neumann boundary conditions, the normal derivative of the function being zero, to hold on the surface of each sphere
| (2) |
where denotes the outwards pointing vector to the spheres. Section IV also presents the Bloch eigenvalue problem (1)-(2) posed in a periodic cell with Floquet-Bloch conditions. Here, we use a standard finite element scheme implemented in the Comsol Multiphysics package, since the computational domain is just a cubic cell containing a single sphere.
Plotting the dispersion relations around the edges of the Brillouin zone Brillouin (1953); Kittel (1996) is broadly sufficient to identify the extent of stop-band as the maxima and minima almost always occur there Joannopoulos et al. (2008): some mathematical literature Harrison et al. (2007) explicitly constructs counter-examples, nonetheless it is almost always the case that the edges of the Brillouin zone contain the essential information sufficient for most purposes. However, as we described in our previous work Dubois et al. (2019) one can actually overlook a mode, or modes, that arise from a path within the Brillouin zone and that this missing mode can be of interest: in Dubois et al. (2019) it was shown to be responsible for the lensing effect they found. We therefore analyse the Fermi surfaces to get a fuller picture of the wave phenomena responsible for the observed self-collimation effects at and kHz.
Finally some concluding remarks are drawn together in section V.
II Experiments
The finite crystal used here is a rectangular cuboid array of 400 (41010) 3D-printed polymer spheres 1.38 cm in diameter with a centre-to-centre spacing cm. A commercial loudspeaker (Visaton SC5) is set 16 mm from the crystal – which corresponds roughly to the wavelength of the acoustic wave – and facing the thinner facet of the crystal (see Fig. 1). It is driven with square pulses of sinusoidal signals with frequencies 14 kHz and 18 kHz. The pulses have a duration of 12 periods of the sinus and a spacing in time of 21 ms thus avoiding echoes appearing in the measurements while producing a relatively large frequency band signal.
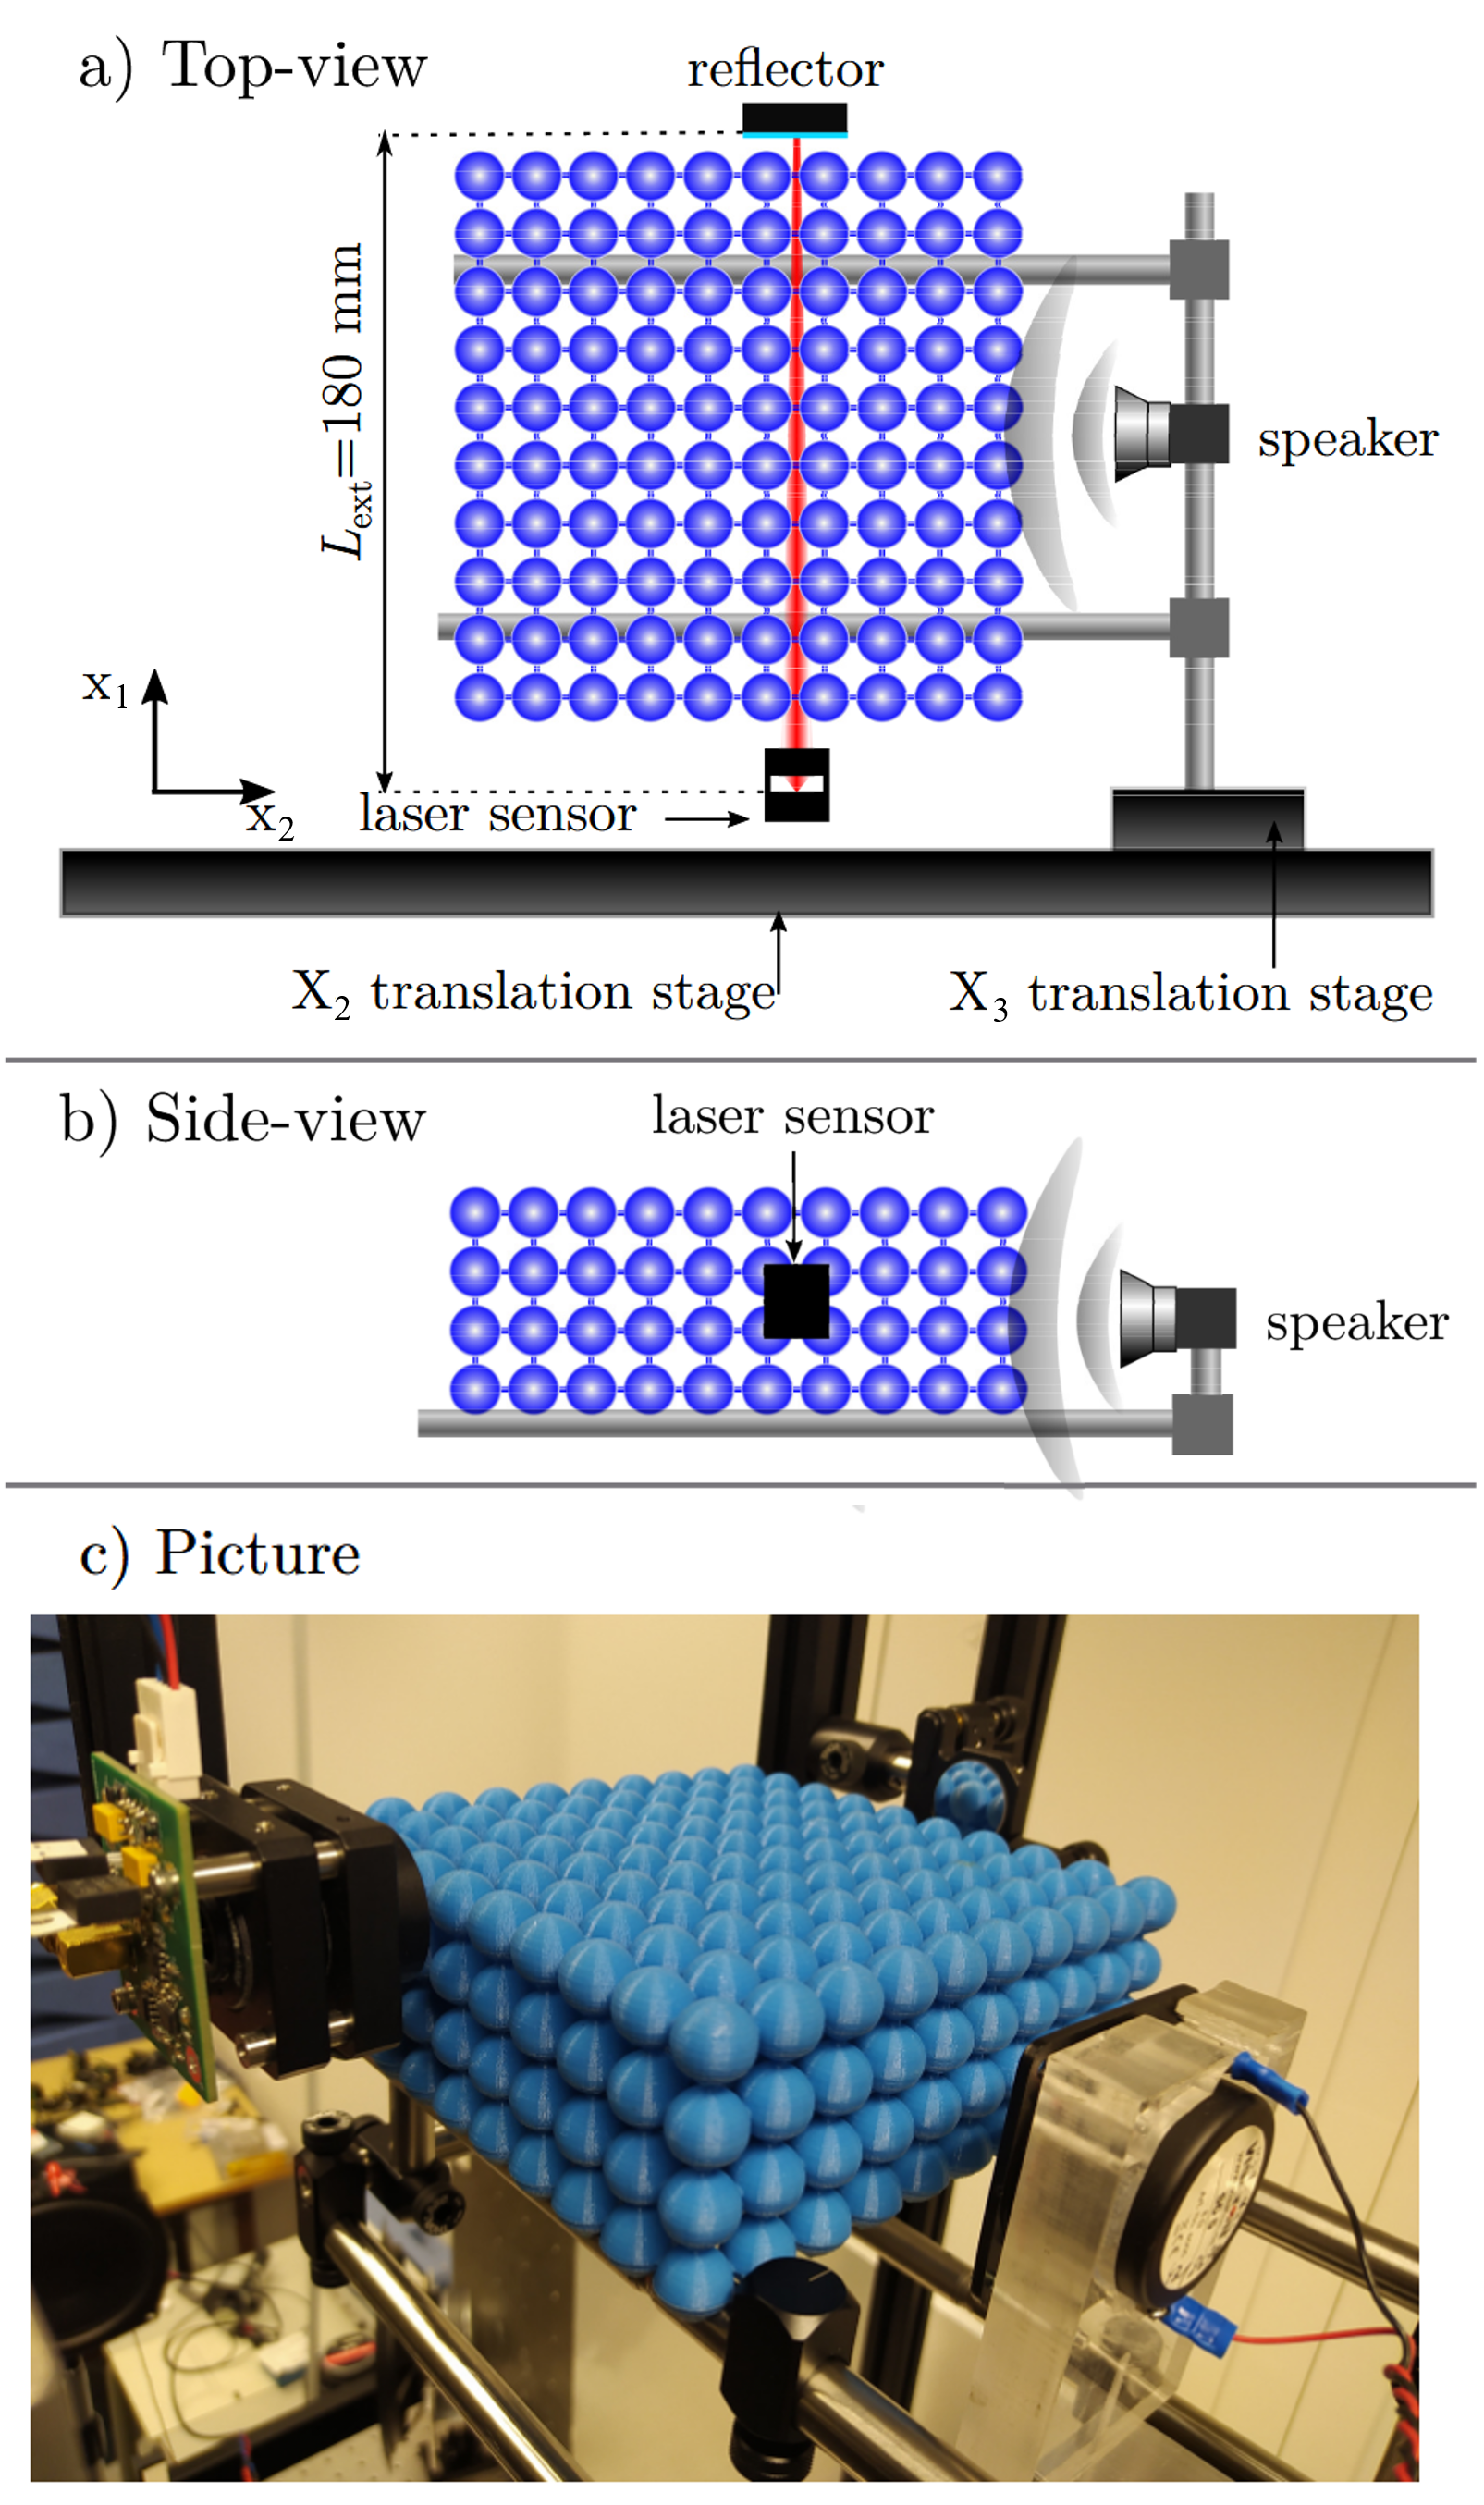
To visualize the acoustic propagation in a non-intrusive manner we use a methodology based on the observation of the refractive index change in the air induced by pressure changes Dubois et al. (2019). This acousto-optic effect is captured through a compact interferometric sensor designed for this measurement with the principle first described in Bertling et al. (2014). It consists of a commercial laser diode (Thorlabs L1550P5DFB) with single-mode emissions at =1550 nm that points at a reflector so that a part of the emitted light re-enters the laser’s cavity producing interferences between the inner optical wave and the back-reflected one. This interferometric approach is known as Self-Mixing Interferometry (SMI) Donati (2011); Taimre et al. (2015) and it is sensitive to any changes in the time of flight in the external cavity that realizes the laser and the reflector. In the context of acoustic sensing, this change is due to the acousto-optic effect that links the refractive index of air to the pressure among other parameters Ciddor (1996). With pressure levels encountered in the acoustic domain, the relationship change in refractive index with pressure can be considered as perfectly linear. As expressed in Bertling et al. (2014) the laser emitted power variations and the refractive index ones along the laser propagation axis are linked as
| (3) |
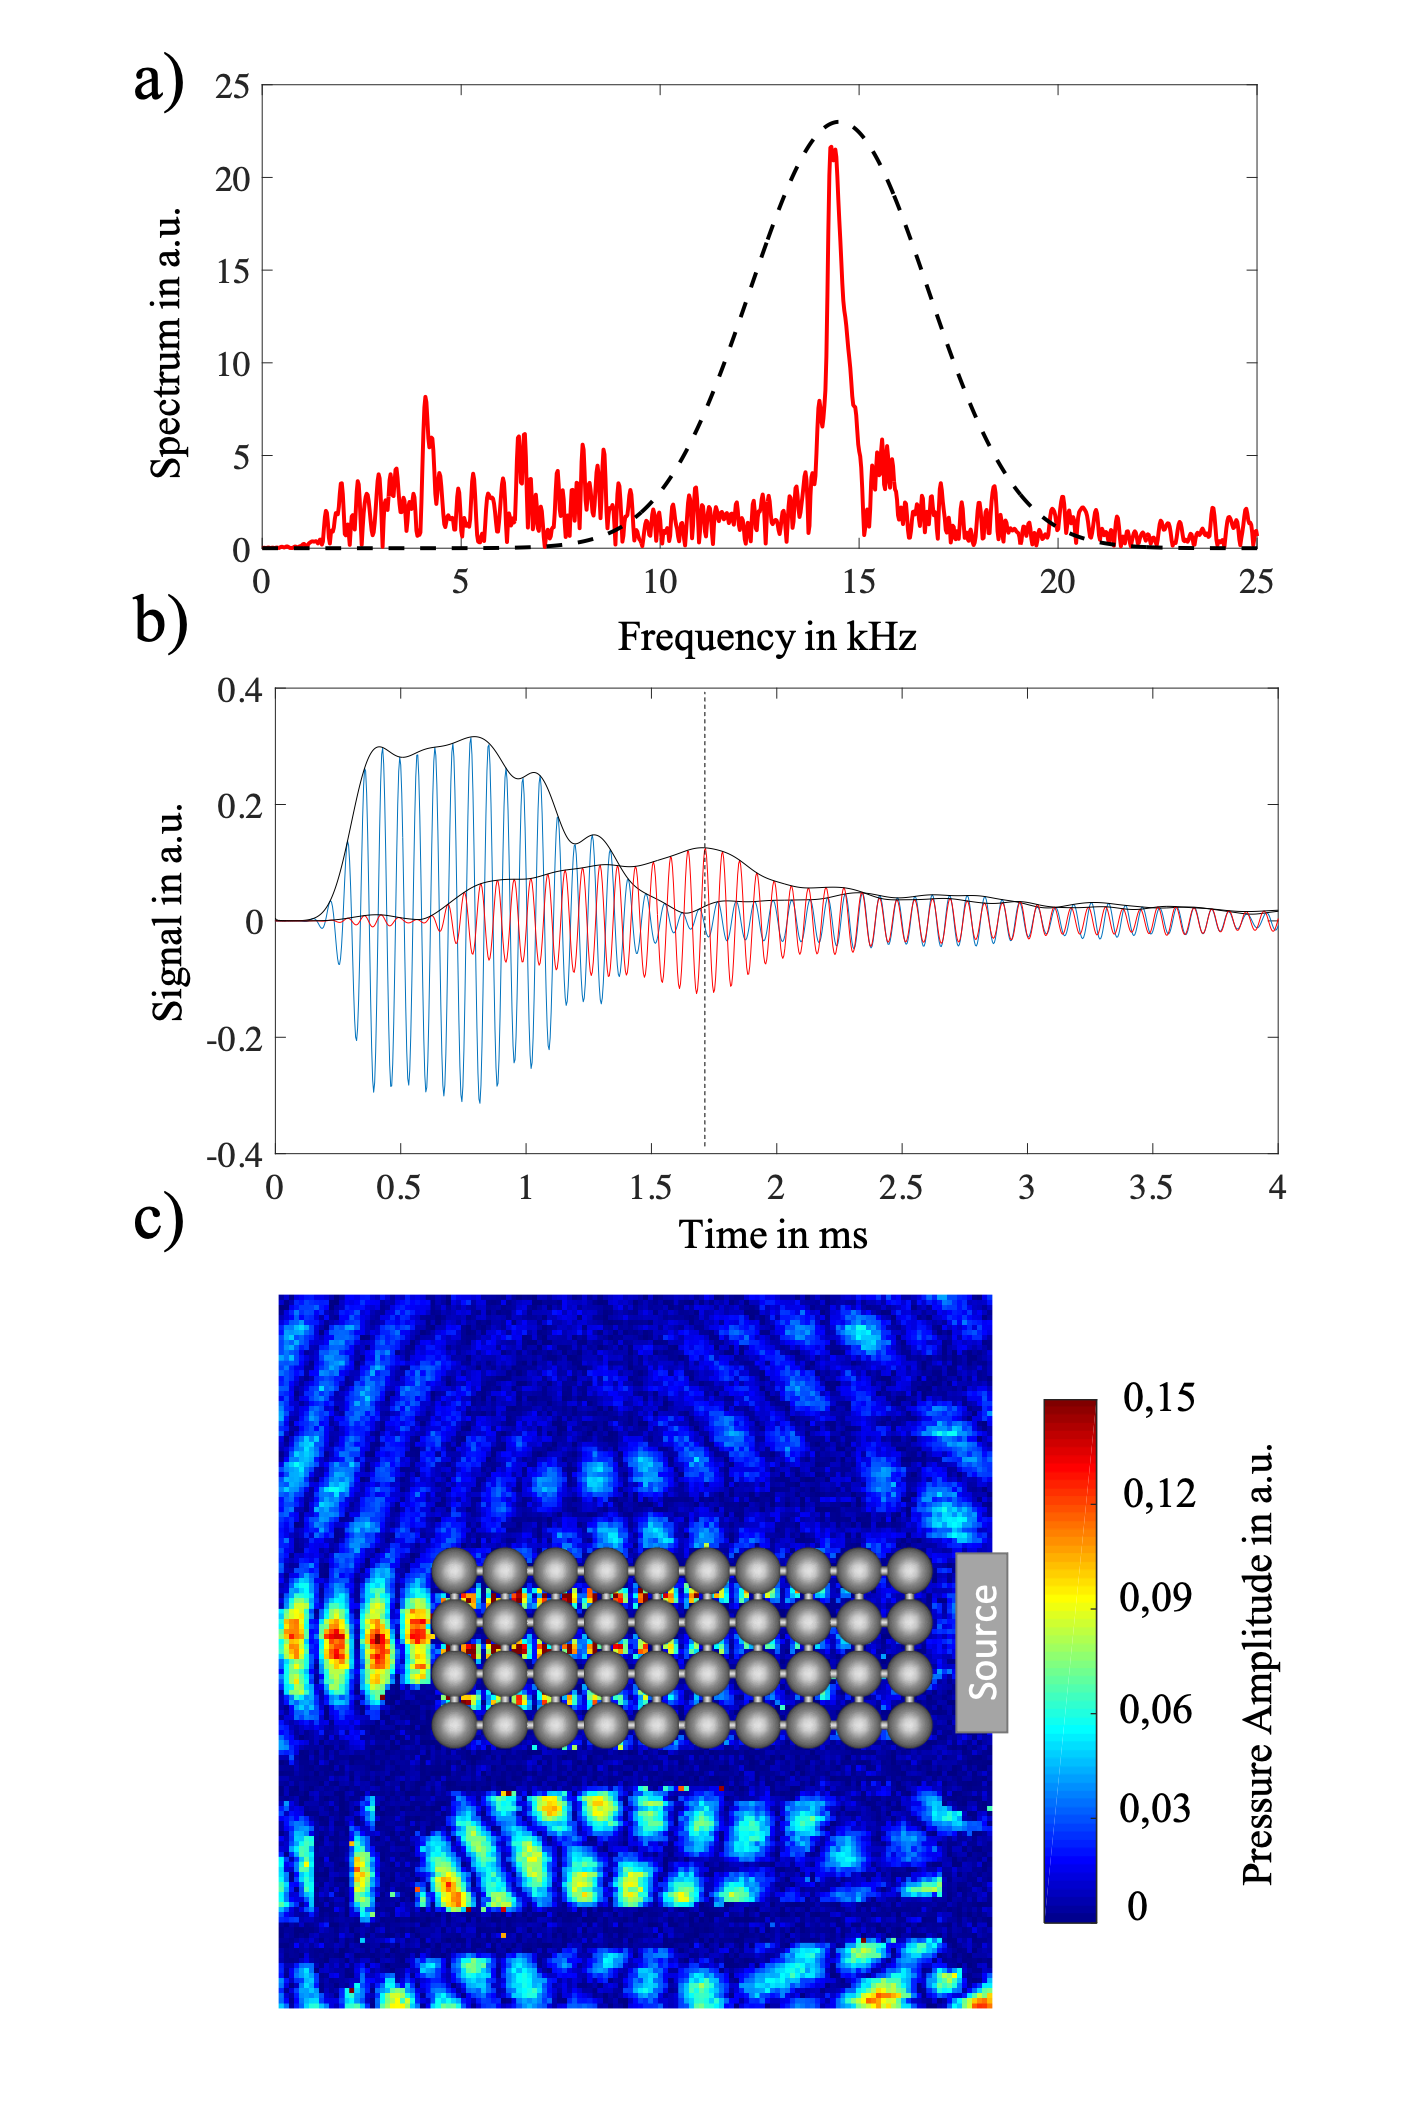
where is the average emitted power, is the laser frequency, is the length of the external cavity and is a constant phase term. A part of the light emitted by the laser diode is collected using the monitoring photodiode that is included in the laser package and the photogenerated current is then amplified and converted to a voltage variation that is acquired using a National Instrument acquisition card. This terminal voltage is then an image of the integration of the pressure field along the laser axis in function of time. Images of the acoustic wave propagation come from the sensor (laser + reflector) which is translated with a fixed step of 1.5 mm on both and axes; each position of the sensor represents a pixel of the image shown in Figs. 2c and 3c. The experiment is repeated for each laser position in order to represent the integrated pressure field in two-dimensional maps.
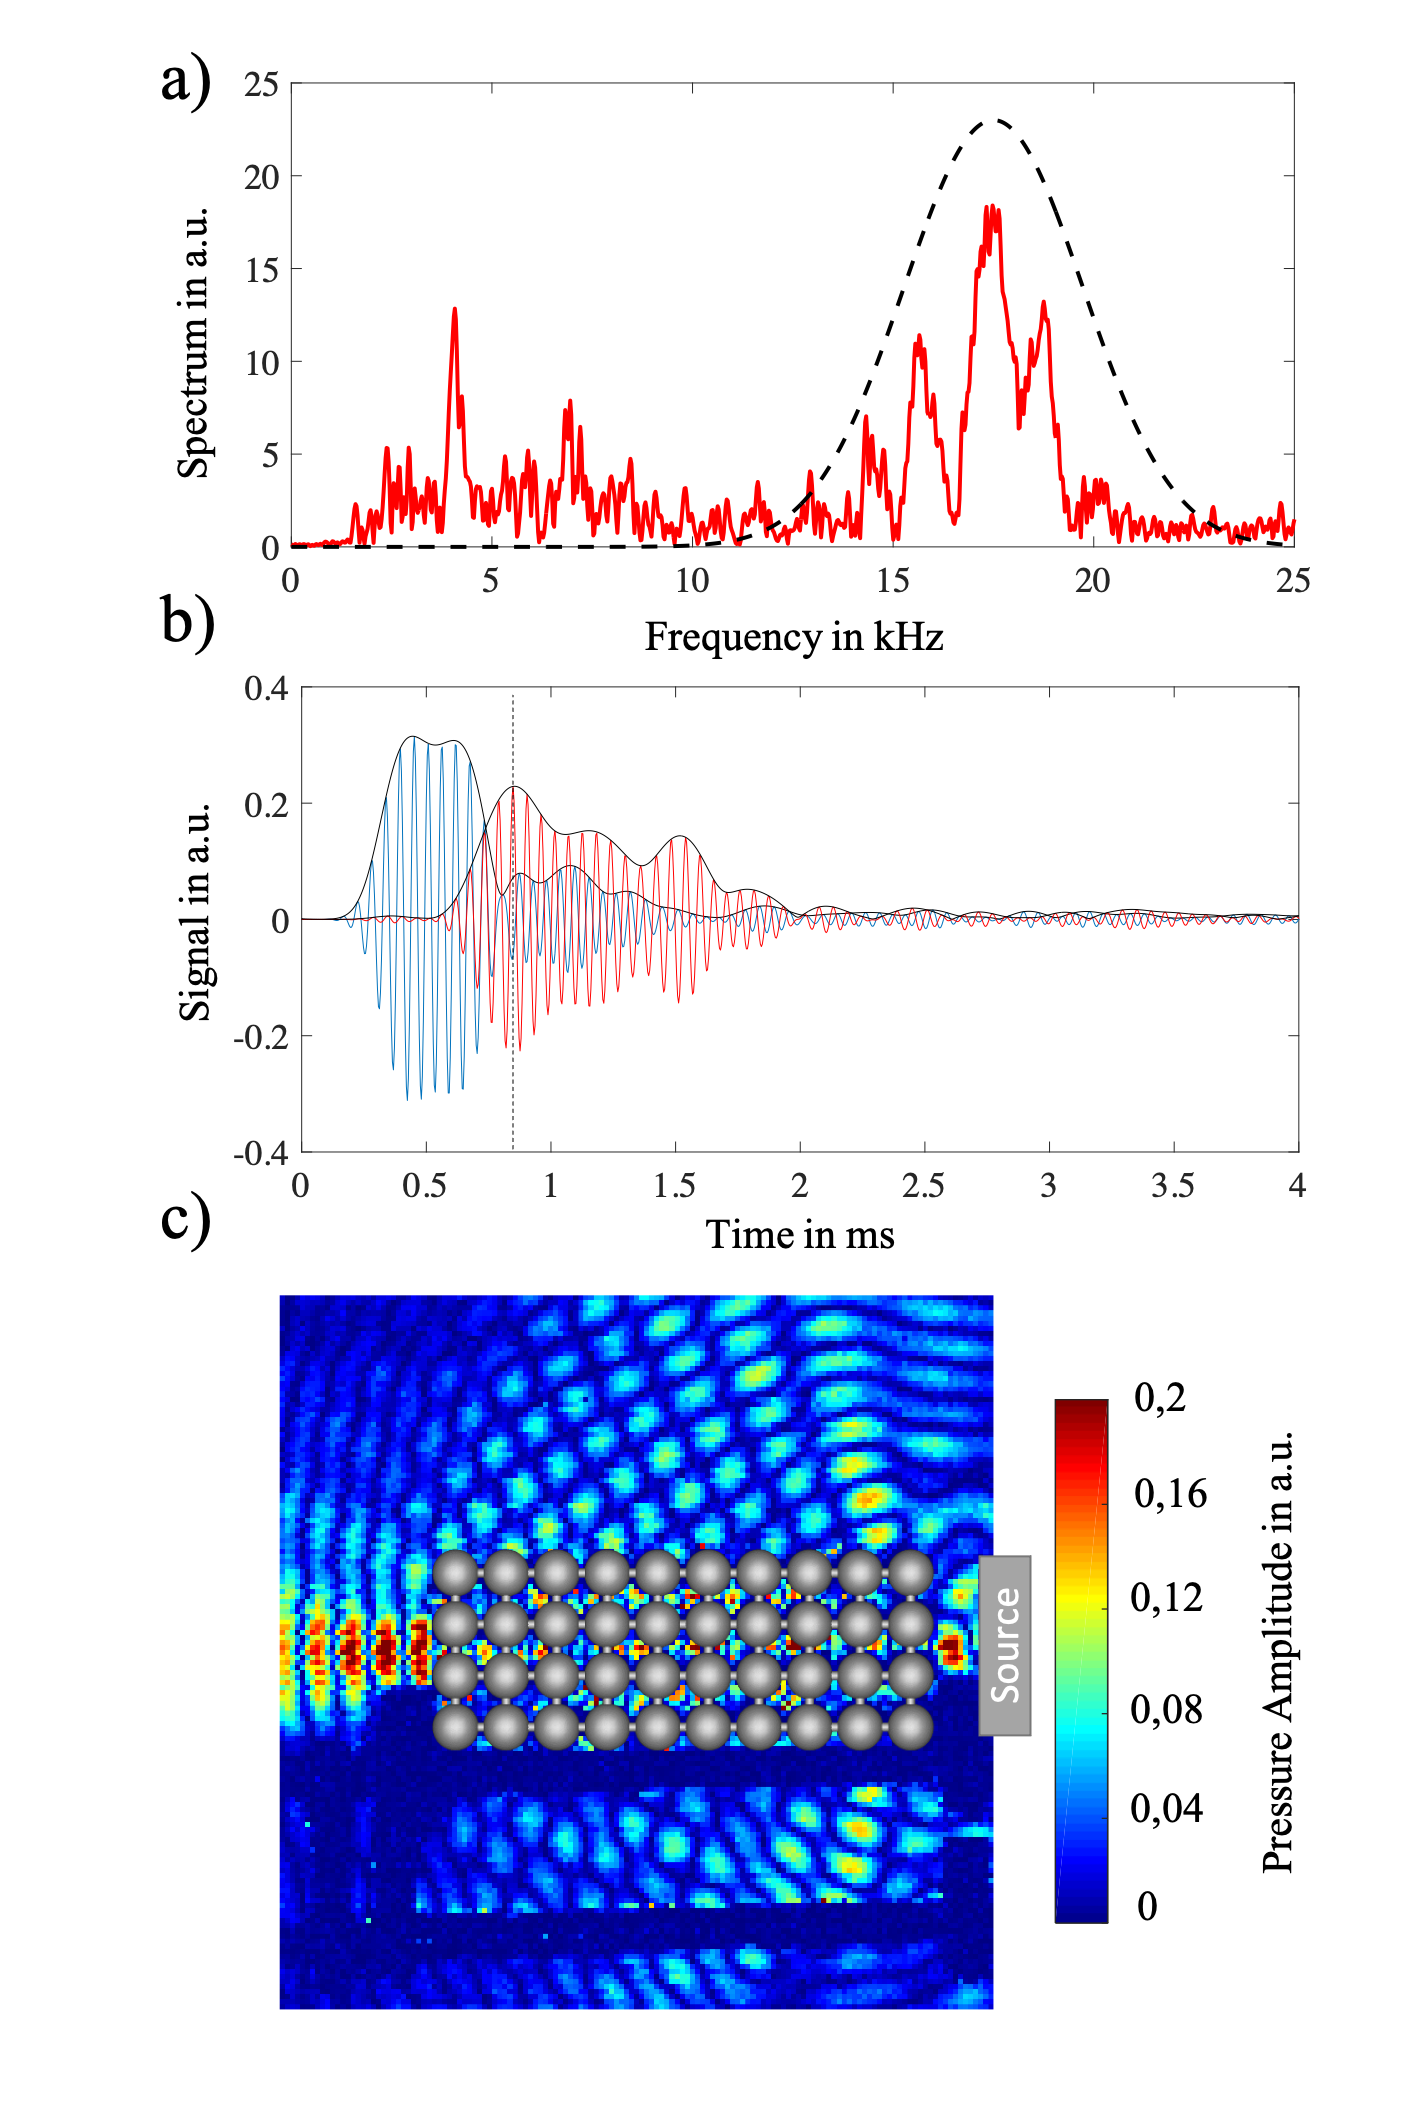
For the temporal results shown in Figs. 2a,b and 3a,b the experimental data is temporally downsampled by a fourfold factor leading to a time resolution of 4 s. It is then filtered spectrally with a Gaussian window to obtain the acoustic response with chosen central frequency and bandwidth. The Gaussian window presents a full width at half maximum of 5.25 kHz and is centered in 14.5 kHz and 17.7 kHz as shown in Figs. 2a and 3a.
III Simulation using a higher-order multi-scale Finite Element Method
III.1 Method
We use the higher-order multi-scale Finite element method (HMsFEM Gao et al. (2018); Fu et al. (2019)) to rapidly solve the three-dimensional Helmholtz equation for the finite array excited by a source. The underlying methodology is to solve the Helmholtz equation in a relatively coarse grid and exploit carefully constructed multi-scale basis functions that capture local heterogeneity information and wavenumber information; Gao et al. (2018); Fu et al. (2019) compare and contrast HMsFEM with classical polynomial-based finite element method (FEM) highlighting the advantages in terms of speed and accuracy. A major advantage of HMsFEM is that it significantly reduces the degrees of freedom of the FEM defined on the fine scale mesh and thereby saves both a huge amount of CPU time and memory. The construction of the multi-scale basis in a coarse element, , for two types of multi-scale basis associated with the boundary and interior interpolation points of the polynomial basis functions is the key building block required for HMsFEM. The first type is obtained by solving
| (4) | ||||
in which (a Dirichlet datum) is the polynomial shape function corresponding to the interpolation point that lies on the boundary of . For the second type of multi-scale basis, one needs to solve
| (5) | ||||
where (now a volumetric forcing) is the interior polynomial shape function associated with the interpolation point that lies inside of .
The power of the HMsFEM approach is that we replace each standard polynomial basis function in the classical FEM with a multi-scale basis function constructed by solving a Helmholtz equation dependent upon the local problem. Since the basis functions are constructed in a local domain, the computational cost is affordable. Importantly, these multi-scale bases are defined in a very coarse mesh, therefore, the degrees of freedom of the resulting linear system with HMsFEM is greatly reduced compared to a classical FEM. This enables us to solve the three-dimensional sphere array, with close spacing, both accurately and rapidly. In our numerical simulations, the size of each coarse element ( cm) is set to be exactly the same as the cubic cell that contains only one polymer sphere and the computational domain consists of coarse elements. Therefore the size of the simulation domain is cm. Here, for simplicity, we use cubic elements to approximate the spheres and the length of the fine-scale cubic element is the length of the coarse-scale element. Perfectly matched layers Berenger (1994) with a thickness of one coarse element are implemented to absorb outgoing waves on all sides of the computational domain. The dimension of the final linear system to be solved is merely 119,629 after utilizing the static condensation algorithm Wilson (1974) and the CPU time for solving this linear system is just under a minute using Matlab.
III.2 Results
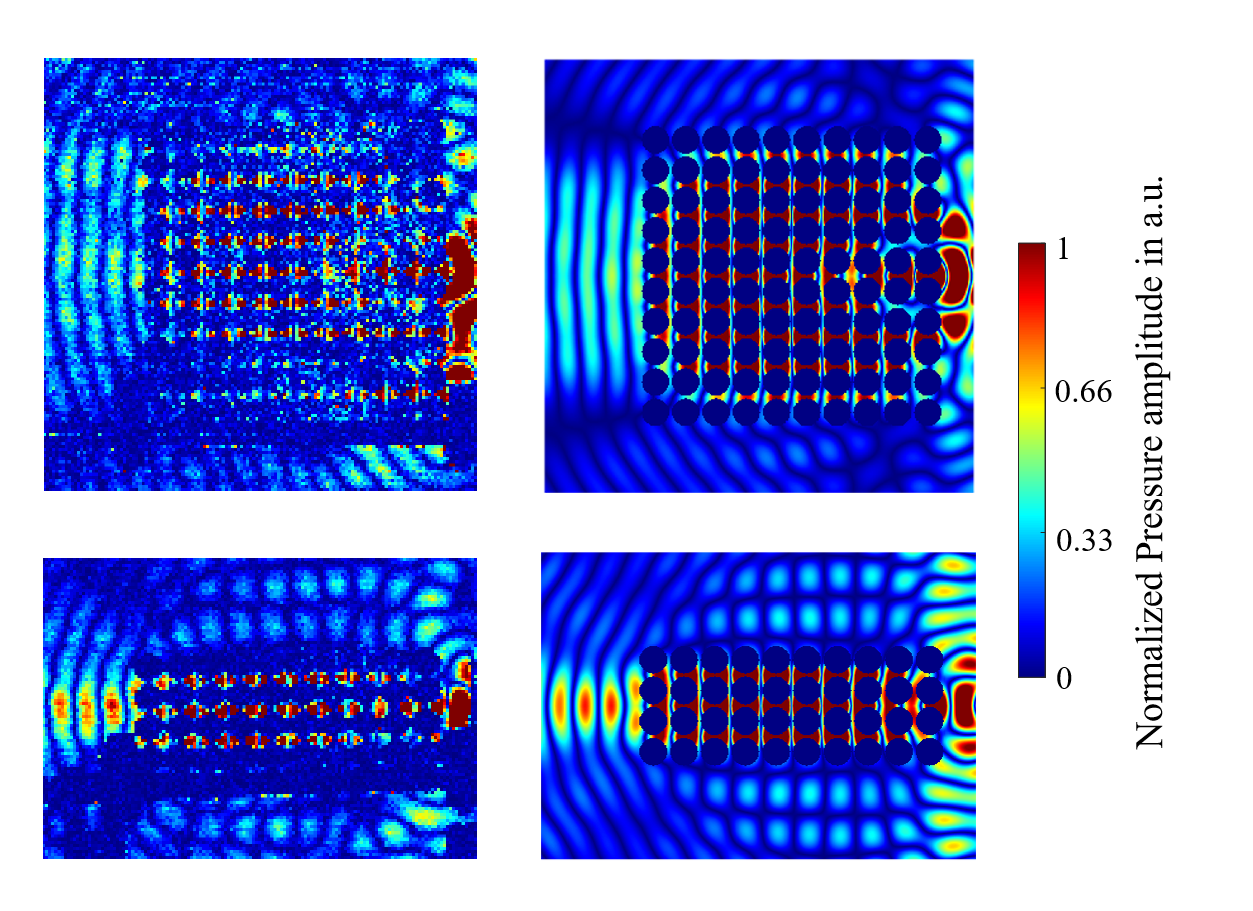
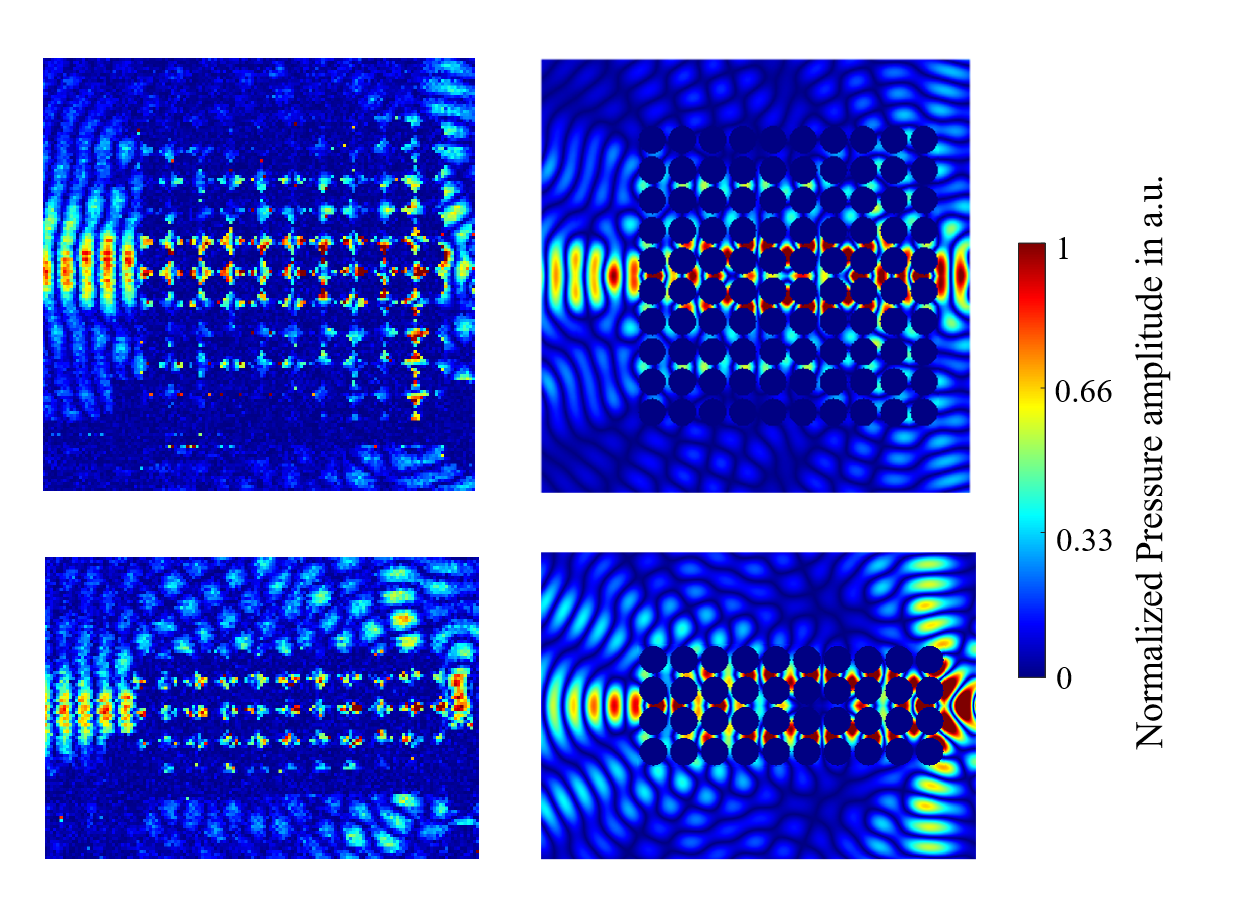
The results of both the physical experiments and the HMsFEM numerical simulations for 14.2 and 18 kHz are shown in Figs 4 and 5, respectively; the left columns correspond to the experiments, whereas the right ones show the numerics. The upper rows correspond to the top view of the crystal ( plane), the lower row to the side view ( plane): there is remarkable agreement between the numerical simulations and the experiments. Both frequencies demonstrate distinctive collimation effects, at 14.2 kHz we see a plane wave exit the crystal that is roughly the width of the crystal, whereas at 18 kHz we have a focused beam exit the crystal.
IV Periodic acoustic wave problem
We now move to investigate the band spectrum of the sonic crystal since these allow us to look at iso-frequency contours and surfaces and hence gain physical understanding and interpretation of the collimation shown in Figs 4 and 5.
For acoustic waves propagating through an infinite, perfect, triply periodic medium, one can invoke the Floquet-Bloch theorem Kittel (1996); Brillouin (1953) and consider the cubic cell, in non-dimensional coordinates, with quasi-periodic conditions applied to the faces. The quasi-periodic Bloch boundary conditions are given as
| (6) |
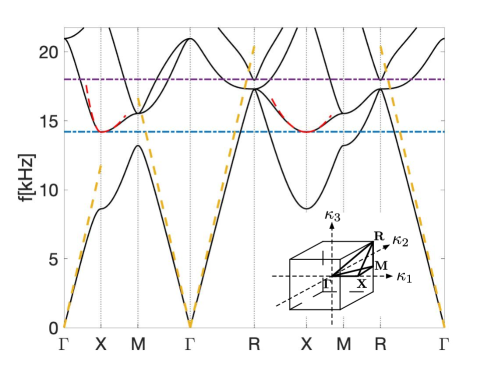
where is the lattice vector along , . For instance . Eq. (6) also involves the Bloch wave-vector characterizing the phase-shift as one moves from one cell to the next. This Bloch problem is solved numerically and the dispersion relations that link the frequency and Bloch wavenumber are deduced; as is conventional in solid state physics Brillouin (1953) only a limited range of wavenumbers need be considered in order to detect band-gaps, namely the wavenumbers along the right-angled tetrahedron shown in the irreducible Brillouin zone (IBZ) in Fig. 6; there are some exceptions to this limitation such as operators on graphs Harrison et al. (2007). The vertex coordinates are , , and .
The dispersion curves for a triply periodic array of rigid spheres, shown in Fig. 6, illustrate several interesting features: a partial stop-band where wave propagation is disallowed along and between and kHz, coalescing bands at high-symmetry points and and regions of flat dispersion curves where the group velocity is zero and features of slow sound occur Figotin and Vitebskiy (2006). One can see that the group velocity is vanishing at the second band near the high-symmetry point in Fig. 6; the frequency kHz indicated by the dash-dotted blue line should thus be associated with an interesting wave phenomenon. Excitation at, or very close, to the frequency predicted would lead to oscillations that resemble a standing wave as it seems to be the case in Fig. 4; crucially this standing wave has directionality that can be identified from the wavenumber description in the Brillouin zone shown in Fig. 6.
To further confirm the physical mechanism leading to the collimation effect experimentally and numerically observed at kHz, we propose to replace the sonic crystal by an effective medium in the high frequency regime. The property of this effective medium should depend both on the frequency and the Bloch wavenumber, as the phenomenon occurs well beyond the quasi-static limit.
IV.1 Interpretation of collimated beaming at 14.2 kHz with High Frequency Homogenization
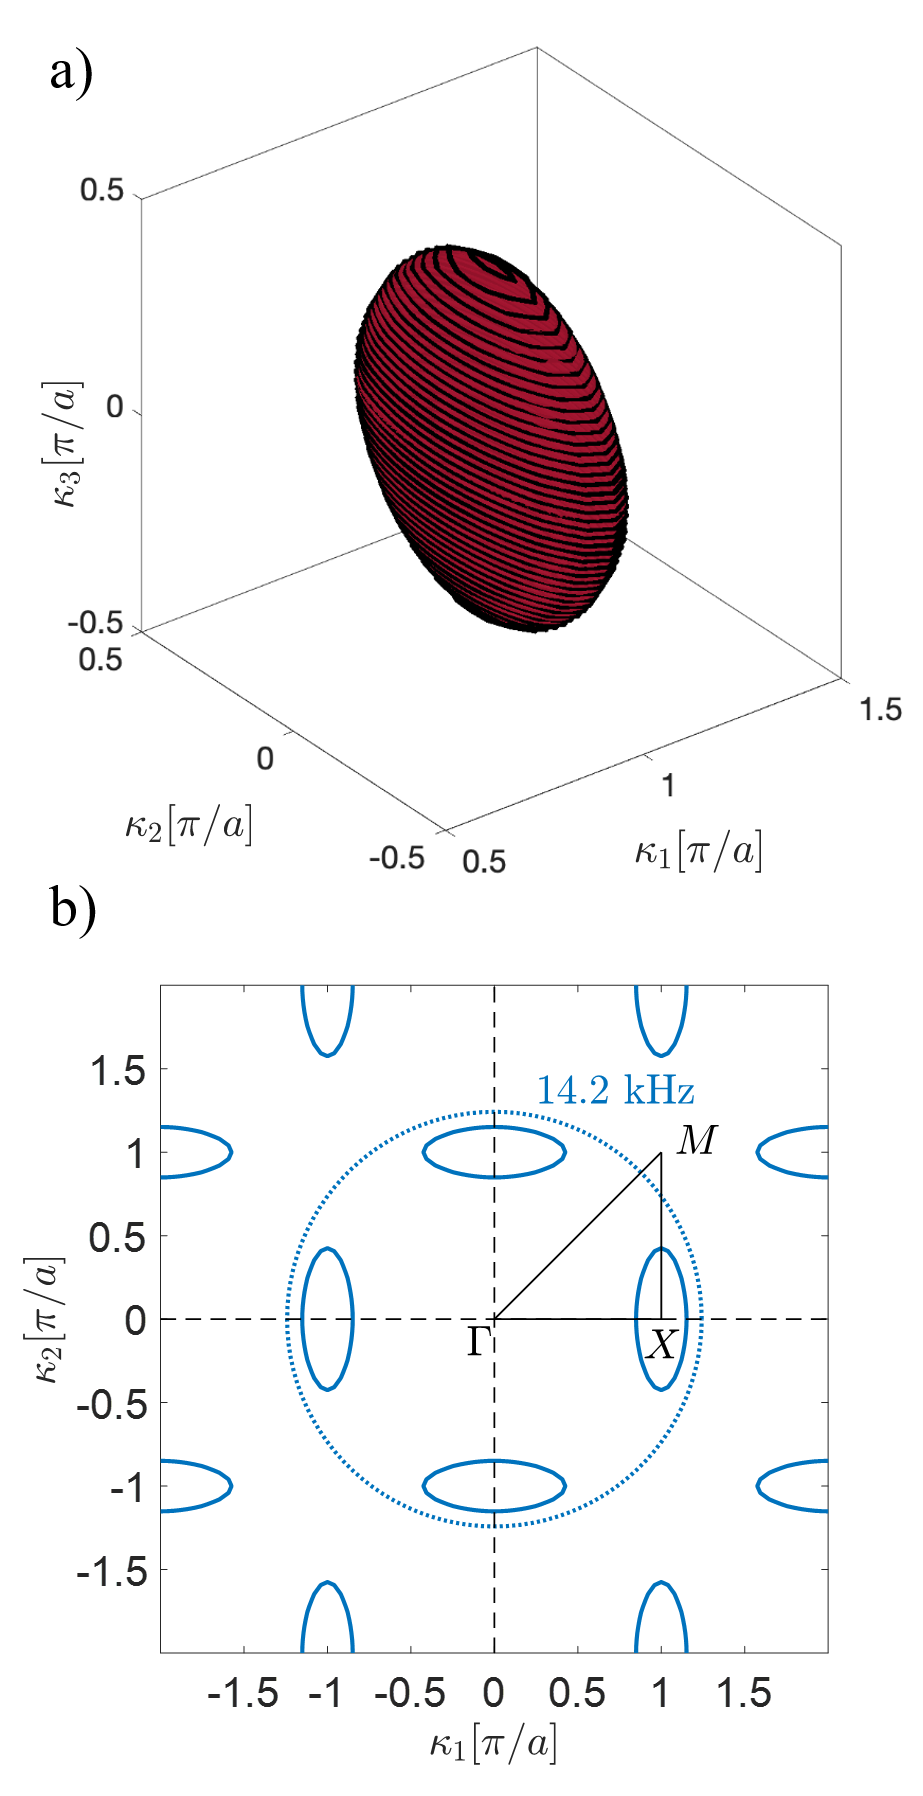
The collimation effect observed at 14.2 kHz is related to strong anisotropy as shown by the equifrequency surface of Fig. 7 which is wrapped around point with strong ellipticity in and directions. The slight mismatch of frequency to kHz for the infinite periodic crystal is attributed the finite size of the crystal used in the experiment and simulations. This leads to a plane wave like behavior in the crystal and results in the wave leaving the crystal with a flat phase profile. This is, in effect, a collimation experiment where the compact source is transformed into a plane wave similar to the Luneburg lens based on index gradient media Climente et al. (2010); Di Falco et al. (2011); Chang et al. (2012); Romero-García et al. (2013); Zhao et al. (2016). The collimation effect is related to the excitation of a single Bloch mode of the crystal leading to a plane wave like propagation in the crystal as illustrated in Fig. 4. This is further confirmed by two experimental observations: (i) we observe a clear single frequency contribution at the exit of the crystal in Fig. 2a and (ii) the group velocity is significantly reduced as observed in Fig. 2b with the pulse delay. The movie of the experiment [Multimedia 1] is instructive in showing the combined effect of the low group velocity and the resultant delay allowing the wavefield to spread across the crystal.
In Fig. 6, we approximate the dispersion curves computed via Finite Elements (Comsol Multiphysics) with asymptotic curves originated in the High-Frequency Homogenization theory (HFH) developed in Craster et al. (2010). The multiple scales used for HFH are a short-scale and a long-scale for where and represent respectively the characteristic small scale (half length of a cell) and the long scale. A small parameter is formed as and expansions of the frequency and the solution are substituted in (1). Here is a standing wave frequency given at the high-symmetry points , , and of the irreducible Brillouin zone and a perturbation scheme can be developed about the band edges. The leading-order term for is where the function representing an envelope of the solution is obtained by an equation only on the long scale: The theory is detailed in Craster et al. (2010). Changing back to the original coordinates the effective medium equation Craster et al. (2010) reads,
| (7) |
’s are integrated quantities of the leading order and first order short scale solutions with for in the present illustrations. As in Craster et al. (2010), assuming Bloch waves, the asymptotic dispersion relation for reads,
| (8) |
where and depending on the band edge in the Brillouin zone about which the asymptotic expansion originates ; these asymptotics give the red dashed curves in Fig. 6. For the case of multiple modes originating from the same point, as is the case for the second and third bands at point and the first and second bands at point , Eq. (8) is no longer valid and one obtains two coupled equations for . This homogenization theory is not limited to long-waves relative to the microstructure, one apparent failing is that the asymptotics appear to be only valid near the band edge frequencies but further refinements are possible, using foldings of the Brillouin zone, that extend the theory to provide complete coverage of the dispersion curves and provide accuracy at all frequencies, see e.g. Antonakakis et al. (2013) and further developments in Guzina et al. (2019); Assier et al. (2020).
Fig. 7 shows an ellipsoid flattened in the direction. The black lines are obtained from direct computation with Comsol Multiphysics. This isofrequency surface is superimposed by a red surface obtained from HFH. We point out that this demonstrates the sharpness of HFH approximation not only along the IBZ boundary as in Fig. 5, but also within the IBZ. The effective medium at kHz is described by the matrix coefficients and , which confirms the large anisotropy along the axis in agreement with the observed guiding effect in that direction with the sonic crystal in Fig. 4. Interestingly, the 2D acoustic magnifying hyperlens of Zhang’s group consisting of brass fins in air embedded on a brass substrate Li et al. (2009) depicts elliptical isofrequency contours similar to those in Fig. 7(b) at a working frequency of 6.6 kHz. When viewed from the point, elliptical contours within the dashed circle in Fig. 7(b) appear locally hyperbolic. One indeed observes a collimated beam on the exit of the hyperlens in Li et al. (2009), analogous to that on the exit of the sonic crystal in Fig. 4. In electromagnetism Lu et al. (2006) demonstrate self-collimation for a source inside a finite crystal in the microwave regime where the isofrequency contours are also hyperbolic and here we see a similar effect, but now for acoustic waves.
IV.2 Interpretation of collimated beaming at 18 kHz with Fermi surfaces and slowness curves
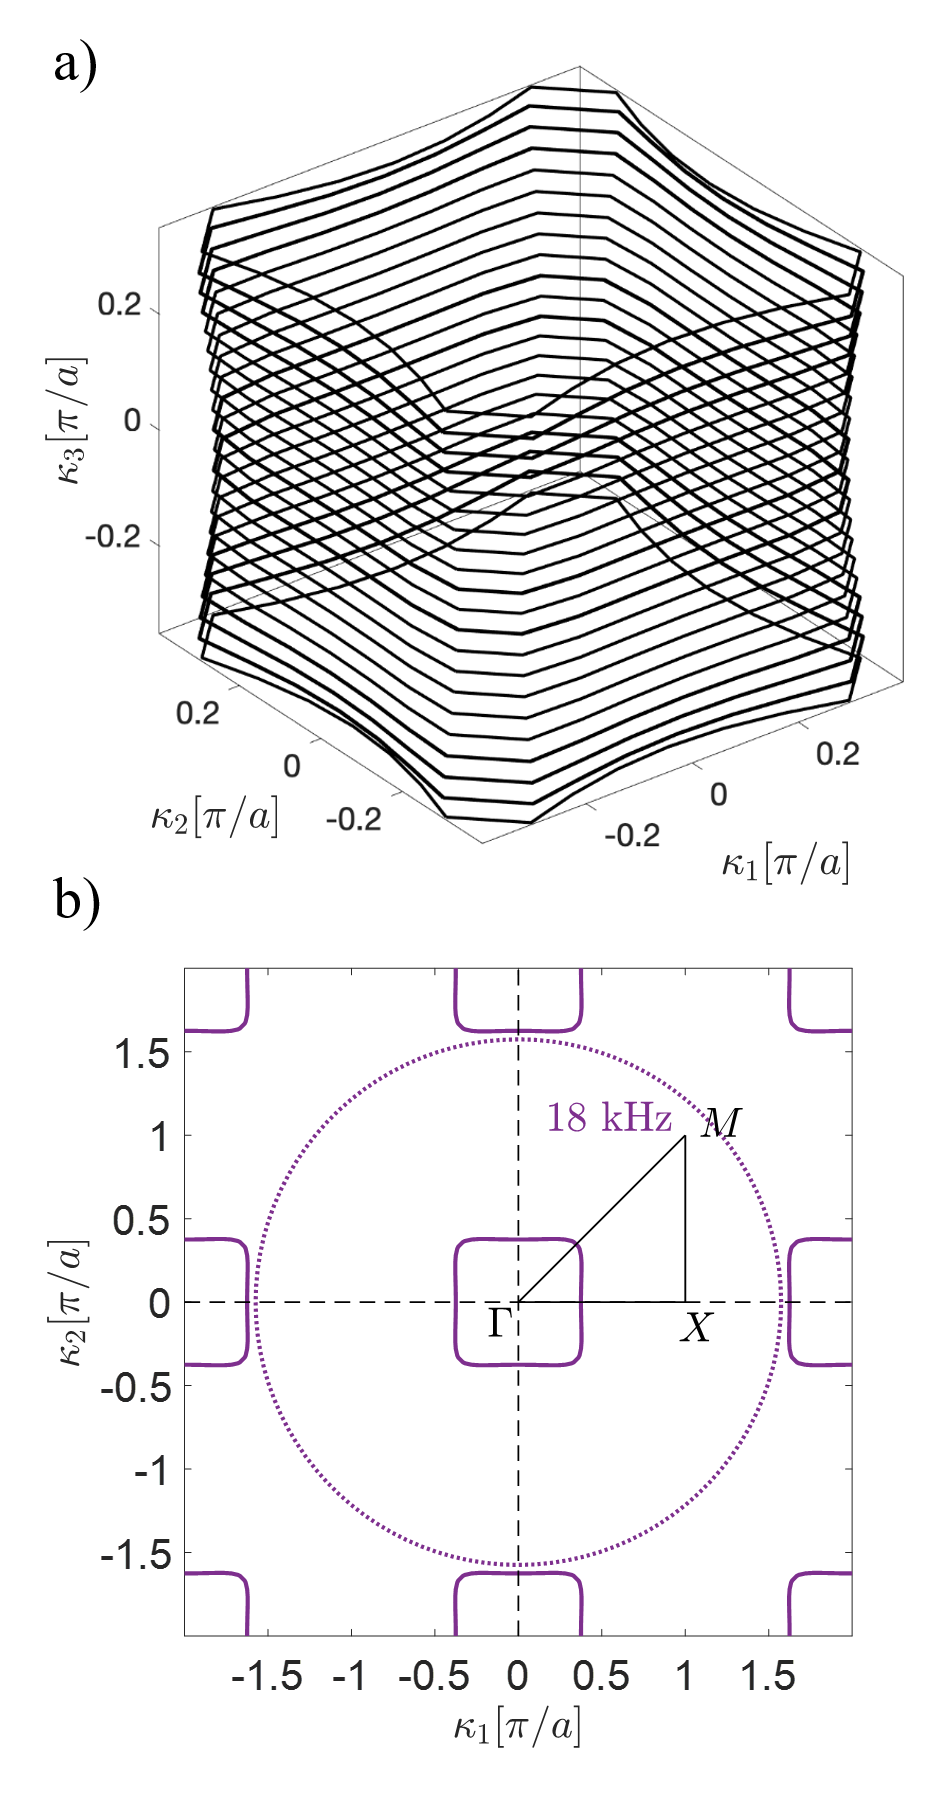
We directly use the isofrequency curves for this case as they give a self-explanatory insight of the physics. Indeed, by looking at the isofrequency surfaces in Fig. 8 we see that they form a slightly deformed cube. The concentric near-squares have almost flat edges in the direction and notably the isofrequency contour in the plane surrounds the point in Fig. 8b leading to anti colinear phase and group velocity (see also movie at [Multimedia 2]). In the crystal this is reminiscent of an endoscope or self-guiding effect where the narrow support of the source is conserved across the crystal and then leaves the crystal as a focused beam.
Unlike the 14.2 kHz observation of collimation, at 18 kHz we experimentally observe the excitation of several Bloch modes in the crystal as expected from Fig. 3a. The field is dominated by the mode giving these cubic equifrequency surfaces that lead to the self-guiding effect in the crystal. We note the similarity of the isofrequency contour at kHz with that in Chigrin et al. (2003) that leads to a self-guiding effect in 2D photonics whereas we propose a 3D experimental realization of the effect in acoustics. We further refer to Prather et al. (2005) for validation in the microwave regime of self-collimation and to Lu et al. (2005) for a 3D focusing effect via all-angle-negative refraction.
V Concluding remarks
We have conclusively shown strongly collimated beaming effects through a three-dimensional acoustic phononic crystal consisting of a finite rectangular cuboid array of polymer spheres cm in diameter in air, arranged in a primitive cubic cell with pitch cm for chirps with central frequencies at kHz and kHz. Our study is making use of three-dimensional higher-order multi-scale finite element simulations that enable us to capture the essence of the wave phenomena for our scattering problem in the time domain. These simulations show excellent agreement with time-domain experiments based on an in-house laser feedback interferometer setup. The prediction of the two frequencies where these effects are achieved requires analysis of band spectra of a three-dimensional periodic structure, that reveals the prominent role played by the Floquet-Bloch waves in the infinite periodic counterpart of the finite rectangular cuboid array of rigid spheres. Visualization of four-dimensional Fermi surfaces in the infinite crystal is somewhat delicate and thus we further analyse effective properties of the periodic structure through the lens of a high-frequency homogenization method. Our analysis shows one needs to be extra-careful when just considering edges of the three-dimensional Brillouin zone instead of its volume. While Fermi surfaces (here 4D dispersion surfaces) contain within them all the information required to completely describe the stop band structure of a 3D periodic structure, dispersion curves such as in Fig. 6 can obscure important features such as the remarkable isofrequency contours in Fig. 7-8, and most notably at kHz wherein the phase and group velocity are anti-linear. This a frequency regime where the dispersion curves in Fig. 6 are difficult to decipher. Moreover, it is not obvious to conclude from Fig. 6 that there should be highly directive wave propagation within the crystal at kHz, as evidenced by Fig. 4. On the other hand, the combination of HFH that reveals strong effective anisotropy of the crystal through inspection of the coefficients deduced from Eq. 7, and of the isofrequency contours that display a remarkably flat isosurface in Fig. 7, sheds light on the waveguiding effect through the phononic crystal at kHz. The sonic crystal can be viewed as a waveguide counterpart to a uni-directive metamaterial antenna with a vanishing effective refractive index such as in Enoch et al. (2002). It is well known that curved wave fronts emanating from a source in free space are transformed into planar ones in a zero index slab Ziolkowski (2004); Liberal and Engheta (2017). In the present case, the combination of low group velocity in the direction and large dynamic anisotropy of the sonic crystal at kHz makes it possible to design an effective highly anisotropic low-index waveguide. Quite unexpectedly for such a simple phononic crystal consisting of a finite rectangular cuboid array of rigid spheres, it turns out that isofrequency contours can design for practically implementable collimated beams at two seemingly non remarkable frequencies, at least according to the dispersion diagram. It is only through further inspection of isofrequency surfaces and contours, in conjunction with high frequency homogenization, that the true nature of the wave propagation within the crystal is unveiled at these frequencies. Our study thus emphasizes the richness of physical phenomena via anomalous dispersion in 3D phononic crystals. We hope our study will foster experimental efforts in manipulation of sound in miscellaneous phononic crystals whose dynamic effective properties of practical importance for wavefront shaping might have been overlooked.
Acknowledgments
K.B. and A.D.R. acknowledge financial support provided by the Australian Research Council (DP210103342). G.L. acknowledges support from Newton International Fellowships Alumni following-on funding awarded by The Royal Society. M.D., R.A. and S.E. acknowledge financial support from the Excellence Initiative of Aix-Marseille University - A*MIDEX, a french “Investissements d’Avenir” programme under the Multiwave chair of Medical Imaging.
MULTIMEDIA link (https://amubox.univ-amu.fr/s/MWfxJG5ZTzaNsnP)
References
- Vanel et al. (2017) A. L. Vanel, O. Schnitzer, and R. V. Craster, Asymptotic network models of subwavelength metamaterials formed by closely packed photonic and phononic crystals, EPL (Europhysics Letters) 119, 64002 (2017).
- Gao et al. (2018) K. Gao, S. Fu, and E. T. Chung, An efficient multiscale finite-element method for frequency-domain seismic wave propagationan efficient multiscale finite-element method for frequency-domain seismic wave propagation, Bulletin of the Seismological Society of America 108, 966 (2018).
- Bertling et al. (2014) K. Bertling, J. Perchoux, T. Taimre, R. Malkin, D. Robert, A. D. Rakić, and T. Bosch, Imaging of acoustic fields using optical feedback interferometry, Optics express 22, 30346 (2014).
- Craster and Guenneau (2012) R. V. Craster and S. Guenneau, Acoustic metamaterials (Springer Verlag, London, 2012).
- Kadic et al. (2013) M. Kadic, T. Bückmann, R. Schittny, and M. Wegener, Metamaterials beyond electromagnetism, Reports on Progress in physics 76, 126501 (2013).
- Cummer et al. (2016) S. A. Cummer, J. Christensen, and A. Alù, Controlling sound with acoustic metamaterials, Nature Reviews Materials 1, 1 (2016).
- Dupont et al. (2019) G. Dupont, A. Movchan, S. Enoch, and S. Guenneau, Analysis of low frequency acoustic stop bands in cubic arrays of thick spherical shells with holes, Frontiers in Materials 6, 50 (2019).
- Liu and Albert (2006) L. B. Liu and D. G. Albert, Acoustic pulse propagation near a right-angle wall, J. Acoust. Soc. Am. 119, 2073 (2006).
- Yves and Alù (2021) S. Yves and A. Alù, Extreme anisotropy and dispersion engineering in locally resonant acoustic metamaterials, The Journal of the Acoustical Society of America 150, 2040 (2021).
- Bückmann et al. (2012) T. Bückmann, N. Stenger, M. Kadic, J. Kaschke, A. Frölich, T. Kennerknecht, C. Eberl, M. Thiel, and M. Wegener, Tailored 3d mechanical metamaterials made by dip-in direct-laser-writing optical lithography, Advanced Materials 24, 2710 (2012).
- Liu et al. (2020) Y. Liu, W. Xu, M. Chen, T. Yang, K. Wang, X. Huang, H. Jiang, and Y. Wang, Three-dimensional fractal structure with double negative and density-near-zero properties on a subwavelength scale, Materials & Design 188, 108470 (2020).
- Dubois et al. (2019) M. Dubois, J. Perchoux, A. Vanel, C. Tronche, Y. Achaoui, G. Dupont, K. Bertling, A. Rakić, T. Antonakakis, S. Enoch, et al., Acoustic flat lensing using an indefinite medium, Physical Review B 99, 100301 (2019).
- Yu and Fan (2003) X. Yu and S. Fan, Bends and splitters for self-collimated beams in photonic crystals, Appl. Phys. Lett. 83, 3251 (2003).
- Chigrin et al. (2003) D. N. Chigrin, S. Enoch, C. M. S. Torres, and G. Tayeb, Self-guiding in two-dimensional photonic crystals, Optics express 11, 1203 (2003).
- Prather et al. (2007) D. W. Prather, S. Shi, J. Murakowski, G. J. Schneider, A. Sharkawy, C. Chen, B. Miao, and R. Martin, Self-collimation in photonic crystal structures: a new paradigm for applications and device development, Journal of Physics D: Applied Physics 40, 2635 (2007).
- Vanel et al. (2016) A. Vanel, R. Craster, D. Colquitt, and M. Makwana, Asymptotics of dynamic lattice green’s functions, Wave Motion 67, 15 (2016).
- Lu et al. (2006) Z. Lu, S. Shi, J. A. Murakowski, G. J. Schneider, C. A. Schuetz, and D. W. Prather, Experimental demonstration of self-collimation inside a three-dimensional photonic crystal, Physical Review Letters 96, 173902 (2006).
- Prather et al. (2005) D. W. Prather, S. Shi, S. Venkataraman, Z. Lu, J. A. Murakowski, and G. J. Schneider, Self-collimation in 3D photonic crystals, in SPIE OPTO (2005).
- Belov and Simovski (2005) P. A. Belov and C. R. Simovski, Homogenization of electromagnetic crystals formed by uniaxial resonant scatterers, Physical Review E 72, 026615 (2005).
- Gralak et al. (2000) B. Gralak, S. Enoch, and G. Tayeb, Anomalous refractive properties of photonic crystals, JOSA A 17, 1012 (2000).
- Luo et al. (2002) C. Luo, S. G. Johnson, J. Joannopoulos, and J. Pendry, All-angle negative refraction without negative effective index, Physical Review B 65, 201104 (2002).
- Ceresoli et al. (2015) L. Ceresoli, R. Abdeddaim, T. Antonakakis, B. Maling, M. Chmiaa, P. Sabouroux, G. Tayeb, S. Enoch, R. V. Craster, and S. Guenneau, Dynamic effective anisotropy: Asymptotics, simulations, and microwave experiments with dielectric fibers, Physical Review B 92, 174307 (2015).
- Ciddor (1996) P. E. Ciddor, Refractive index of air: new equations for the visible and near infrared, Appl. Opt. 35, 1566 (1996).
- Taimre et al. (2015) T. Taimre, M. Nikolić, K. Bertling, Y. L. Lim, T. Bosch, and A. D. Rakić, Laser feedback interferometry: a tutorial on the self-mixing effect for coherent sensing, Advances in Optics and Photonics 7, 570 (2015).
- Fu et al. (2019) S. Fu, K. Gao, R. L. Gibson, and E. T. Chung, An efficient high-order multiscale finite element method for frequency-domain elastic wave modeling, Computational Geosciences 23, 997 (2019).
- Brillouin (1953) L. Brillouin, Wave propagation in periodic structures: electric filters and crystal lattices, 2nd ed. (Dover, New York, 1953).
- Kittel (1996) C. Kittel, Introduction to solid state physics, 7th ed. (John Wiley & Sons, New York, 1996).
- Joannopoulos et al. (2008) J. D. Joannopoulos, S. G. Johnson, J. N. Winn, and R. D. Meade, Photonic Crystals, Molding the Flow of Light, 2nd ed. (Princeton University Press, Princeton, 2008).
- Harrison et al. (2007) J. M. Harrison, P. Kuchment, A. Sobolev, and B. Winn, On occurrence of spectral edges for periodic operators inside the Brillouin zone, J. Phys. A - Math 40, 7597 (2007).
- Donati (2011) S. Donati, Developing self-mixing interferometry for instrumentation and measurements, Laser Photonics Review 2011, 1 (2011).
- Berenger (1994) J.-P. Berenger, A perfectly matched layer for the absorption of electromagnetic waves, Journal of computational physics 114, 185 (1994).
- Wilson (1974) E. L. Wilson, The static condensation algorithm, International Journal for Numerical Methods in Engineering 8, 198 (1974).
- Figotin and Vitebskiy (2006) A. Figotin and I. Vitebskiy, Slow light in photonic crystals, Waves Random Complex Media 16, 293 (2006).
- Climente et al. (2010) A. Climente, D. Torrent, and J. Sánchez-Dehesa, Sound focusing by gradient index sonic lenses, Applied Physics Letters 97, 104103 (2010).
- Di Falco et al. (2011) A. Di Falco, S. C. Kehr, and U. Leonhardt, Luneburg lens in silicon photonics, Optics express 19, 5156 (2011).
- Chang et al. (2012) T. Chang, G. Dupont, S. Enoch, and S. Guenneau, Enhanced control of light and sound trajectories with three-dimensional gradient index lenses, New Journal of Physics 14, 035011 (2012).
- Romero-García et al. (2013) V. Romero-García, A. Cebrecos, R. Picó, V. J. Sánchez-Morcillo, L. Garcia-Raffi, and J. V. Sánchez-Pérez, Wave focusing using symmetry matching in axisymmetric acoustic gradient index lenses, Applied Physics Letters 103, 264106 (2013).
- Zhao et al. (2016) Y.-Y. Zhao, Y.-L. Zhang, M.-L. Zheng, X.-Z. Dong, X.-M. Duan, and Z.-S. Zhao, Anisotropic and omnidirectional focusing in Luneburg lens structure with gradient photonic crystals, Journal of Optics 19, 015605 (2016).
- Craster et al. (2010) R. V. Craster, J. Kaplunov, and A. V. Pichugin, High frequency homogenization for periodic media, Proc R Soc Lond A 466, 2341 (2010).
- Antonakakis et al. (2013) T. Antonakakis, R. Craster, and S. Guenneau, High-frequency homogenization of zero-frequency stop band photonic and phononic crystals, New Journal of Physics 15, 103014 (2013).
- Guzina et al. (2019) B. B. Guzina, S. Meng, and O. Oudghiri-Idrissi, A rational framework for dynamic homogenization at finite wavelengths and frequencies, Proceedings of the Royal Society A 475, 20180547 (2019).
- Assier et al. (2020) R. C. Assier, M. Touboul, B. Lombard, and C. Bellis, High-frequency homogenization in periodic media with imperfect interfaces, Proceedings of the Royal Society A 476, 20200402 (2020).
- Li et al. (2009) J. Li, L. Fok, X. Yin, G. Bartal, and X. Zhang, Experimental demonstration of an acoustic magnifying hyperlens, Nature materials 8, 931 (2009).
- Lu et al. (2005) Z. Lu, S. Shi, C. A. Schuetz, J. A. Murakowski, and D. W. Prather, Three-dimensional photonic crystal flat lens by full 3d negative refraction, Optics Express 13, 5592 (2005).
- Enoch et al. (2002) S. Enoch, G. Tayeb, P. Sabouroux, N. Guérin, and P. Vincent, A metamaterial for directive emission, Phys. Rev. Lett. 89, 213902 (2002).
- Ziolkowski (2004) R. W. Ziolkowski, Propagation in and scattering from a matched metamaterial having a zero index of refraction, Physical Review E 70, 046608 (2004).
- Liberal and Engheta (2017) I. Liberal and N. Engheta, Near-zero refractive index photonics, Nature Photonics 11, 149 (2017).