The fraction and kinematics of broad absorption line quasars across cosmic time
Abstract
Luminous quasars are powerful targets to investigate the role of feedback from supermassive black-holes (BHs) in regulating the growth phases of BHs themselves and of their host galaxies, up to the highest redshifts. Here we investigate the cosmic evolution of the occurrence and kinematics of BH-driven outflows, as traced by broad absorption line (BAL) features, due to the C IV ionic transition. We exploit a sample of 1935 quasars at with bolometric luminosity log(erg s, drawn from the Sloan Digital Sky Survey and from the X-shooter legacy survey of Quasars at Reionisation (XQR-30). We consider rest-frame optical bright quasars to minimise observational biases due to quasar selection criteria. We apply a homogeneous BAL identification analysis, based on employing composite template spectra to estimate the quasar intrinsic emission. We find a BAL quasar fraction close to 20% at , while it increases to almost 50% at . The velocity and width of the BAL features also increase at . We exclude that the redshift evolution of the BAL properties is due to differences in terms of quasar luminosity and accretion rate. These results suggest significant BH feedback occurring in the 1 Gyr old Universe, likely affecting the growth of BHs and, possibly, of their host galaxies, as supported by models of early BH and galaxy evolution.
1 Introduction
Quasars are the brightest, non-transient sources in the Universe. They are powered by accretion onto super-massive black holes (BHs), whose emission typically dominates over the host-galaxy emission in the rest-frame UV and optical bands. High-redshift quasars at provide a unique window on the growth phases during which the most massive BHs and their host-galaxies assembled the bulk of their mass (Marconi et al., 2004; Volonteri & Rees, 2006). Luminous quasars at , with bolometric luminosity erg/s, are typically powered by BHs with masses of M⊙ yr-1 and high accretion rates (e.g. Kurk et al., 2007; Shen et al., 2011; Mazzucchelli et al., 2017), where is the Eddington luminosity. The large radiative output of these BHs is expected to drive powerful outflows, able to regulate the BH and host-galaxy growth, by injecting large amounts of energy and momentum in the galaxy interstellar medium (ISM, Zubovas & King, 2012; Gaspari & Sadowski, 2017; Menci et al., 2019).
BH-driven outflows in high-redshift quasars are often revealed by blueshifts of high-ionization emission lines with respect to the quasar systemic redshift (Shen et al., 2019; Meyer et al., 2019; Schindler et al., 2020) and from broad/asymmetric wings in the emission line profiles (e.g. Zakamska et al., 2016; Kakkad et al., 2020). Another powerful tracer of BH-driven outflows are broad ( km s-1) absorption line (BAL) systems occurring in the rest-frame UV spectrum (Weymann et al., 1991), blueward of high-ionisation emission lines such as C IV Å, Si IV Å, N V Å (HiBAL), and of low-ionisation emission lines such as Mg II Å(LoBAL). BAL features have been indeed identified in quasars at all redshifts up to (Wang et al., 2018, 2021a). Observational studies, mostly based on spectra from the Sloan Digital Sky Survey (SDSS), found that BAL outflows are observed in 10-17% of quasars, and have typical velocities of 5,000-10,000 km/s (Gibson et al., 2009; Pâris et al., 2018), although a few percent of them can reach % of the light speed (Hamann et al., 2018; Bruni et al., 2019; Rodríguez Hidalgo et al., 2020). LoBAL outflows are typically observed in a small fraction ( %) of BAL quasars.
In luminous quasars at , BAL outflows have been found to carry kinetic power values in the range 0.1-10% of (Dunn et al., 2010; Borguet et al., 2013; Byun et al., 2022), consistent with expectations for an efficient BH-feedback mechanism (Fiore et al., 2017). Similarly, galaxy evolution models identify BAL outflows as an important source of feedback (e.g. Costa et al., 2014; Torrey et al., 2020). Different scenarios for the launching and geometry of BAL outflows have been proposed (Elvis, 2000; Proga et al., 2000; Proga & Kallman, 2004; Xu et al., 2020; Zeilig-Hess et al., 2020). Although these winds are expected to originate within a pc from the BH (Sadowski & Gaspari, 2017), close to the accretion disc, observations indicate that BAL absorption in luminous quasars often occurs at much larger distances from the BH, that is 100-1,000 pc (Arav et al., 2018; Hemler et al., 2019). This suggests that these ionised outflows represent an important source of BH feedback on the growth of the BH itself and of the host-galaxy.
At very high redshift (), the occurrence and properties of BAL quasar outflows are much less explored. The number of discovered BAL quasars has kept increasing with the growing number of quasars with spectroscopic observations of sufficient quality to probe at least the most prominent BAL features. A first guess for a BAL quasar fraction as high as 50% at had been previously suggested by Maiolino et al. (2004), based on a very small sample of eight quasars. A BAL fraction of 16-24 % was later reported by Shen et al. (2019); Schindler et al. (2020); Yang et al. (2021), although the BAL identification was mostly based on visual inspection and/or limited spectral range and SNR of the quasar spectra. In Bischetti et al. (2022), we performed the first systematic investigation of BAL outflows in 30 quasars at from the X-shooter legacy survey of Quasars at the Reionisation epoch (XQR-30, Zhu et al., 2021, 2022; Bosman et al., 2021; Lai et al., 2022; Chen et al., 2022), finding that about 47% of XQR-30 quasars show BAL features associated with C IV, a fraction that is 2.4 times higher than what observed in quasars. The majority of BAL outflows at also show extreme velocities of 20,000-50,000 km s-1, rarely observed at lower redshift. These findings are indication of an evolution in BAL properties between and quasars.
However, different factors such as or are believed to affect the fraction of BAL quasars and their kinematics (e.g. Dai et al., 2008; Allen et al., 2011; Bruni et al., 2019). In this paper we investigate the BAL fraction and the BAL kinematics dependence on redshift and on quasar nuclear properties (, ), with the goal of identifying the main driver of the varying BAL properties. To this purpose, we measure the occurrence and kinematic properties of BAL outflows associated with the C IV ionic species in a sample of luminous quasars in the redshift range , with matched selection criteria, and by adopting a homogeneous BAL identification analysis.
The paper is structured as follows. In Sect. 2, we describe the quasar sample, including quasar selection criteria (Sect. 2.1). Section 3 details the BAL identification analysis and compares it with previous approaches. The main results on the BAL fraction and on the BAL kinematics are presented in Sect. 4 and Sect. 5, respectively. We discuss the cosmic evolution of the BAL properties and its implications for BH and galaxy evolution in Sect. 6. A summary and the main conclusions are given in Sect. 7. Throughout this paper, we adopt a cosmology with km s-1, and (Planck Collaboration et al., 2016).
| Reference | ||
|---|---|---|
| UV selected quasars | ||
| Reichard et al. (2003) | 14.0% | 13.41.2% |
| Knigge et al. (2008) | 13.7% | % |
| Gibson et al. (2009) | 15.10.6% | 18.50.7% |
| Allen et al. (2011) | 8.00.1% | 40.7% |
| Hewett & Foltz (2003) | 153% | 224% |
| Optically selected quasars | ||
| Dai et al. (2008) | % | 233% |
| Ganguly & Brotherton (2008) | 23% | |
| Maddox et al. (2008) | 17.5 | 18.5% |
Note. — (1) Reference, (2) observed BAL fraction, (3) intrinsic BAL fraction (see Sect. 2.1).
2 Quasar sample
2.1 Quasar selection
The observed fraction of BAL with respect to non-BAL quasars is the convolution of the intrinsic BAL quasar occurrence and a quasar selection function. Standard quasar selection algorithms in optical surveys rely on multicolor imaging data which probe the rest-frame UV quasar spectrum at (e.g. Richards et al., 2002). These UV colors can be affected by BAL troughs associated with high-ionisation species such as C IV. In addition, BAL quasars typically show redder UV continua than non-BAL quasars (e.g. Reichard et al., 2003; Gibson et al., 2009). Depending on redshift, BAL quasars may thus show UV colors resembling those of stars, and may be more easily missed by spectroscopic samples than non-BAL quasars.
Aiming to measure the intrinsic fraction of BAL quasars across cosmic time, two main approaches can be followed. One possibility is to translate the observed BAL fraction () into an intrinsic fraction () by correcting for selection effects. Previous attempts to correct for these effects, however, resulted in very different (by a factor of three), and different to corrections (by a factor of five), even considering the same set of selection effects, and similar redshift intervals. When considering quasars from SDSS and from the Large Bright Quasar Survey, () values in the range 13.4(8.0)% to 40.7(23%) have been reported, as summarised in Table 1. In all these cases, the derived mostly depends on the adopted assumptions on the input BAL properties, such as the distributions of the velocity, width and depth of the absorption, and on the relation between the above quantities and reddening. The spread of plausible assumptions naturally leads to large uncertainties. The true could in principle be derived by quantifying the selection effects on a set of synthetic spectra based on a physical model of BAL quasar outflows. Such an approach would nonetheless suffer from large uncertainties, due to the lack of a self-consistent physical model, able to widely reproduce the properties of the BAL quasar population (e.g. Elvis, 2000; Xu et al., 2020).
In this work, we follow a different approach that allows us to bypass the above issues. As we are mainly interested in the redshift evolution of the BAL fraction and kinematic properties, we apply a similar selection function at all redshifts. In particular, we consider rest-frame optically bright quasars to measure the BAL fraction in the redshift interval . At , the rest-frame optical band is probed by near-infrared surveys such as 2MASS (Skrutskie et al., 2006) and UKIDSS (Warren et al., 2007) in the H and K bands. For higher redshift quasars (), a similar spectral coverage is provided by WISE (Wright et al., 2010) in the W1 and W2 bands (see Bischetti et al., 2022, for details). The rest-frame optical selection allows us to minimise selection effects by avoiding those biases generated by UV absorption troughs in the colour selection. The -to- correction in rest-frame optical selected quasars is indeed expected to be modest (10-20%): Dai et al. (2008) found a =23±3% in SDSS and 2MASS, K-band bright quasars at (%). This fraction is similar to that found by Ganguly et al. (2007) and Ganguly & Brotherton (2008) when combining SDSS and 2MASS catalogs (23%). Again, Maddox et al. (2008) reported a = 18.5% in SDSS and UKIDSS bright quasars, considering the fraction of quasars missed by the UKIDSS survey (= 17.5%). As a general trend, the observed BAL fraction calculated in rest-frame optical selected quasars is roughly 50% higher than the BAL fraction observed in quasars selected only in the rest-frame UV: . In addition, the observed and intrinsic BAL fraction calculated in rest-frame optical selected quasars are similar. They are also similar to the intrinsic BAL fraction calculated in quasars selected only in the rest-frame UV: .
The of quasar samples selected from X-ray to radio surveys, affected by a variety of different selection effects, is typically lower or similar to 20% (e.g. Giustini et al., 2008; Becker et al., 2000), supporting the fact that an optical rest-frame selection limits selection biases against BAL quasars. In general, BAL fractions higher than 20% have been reported only i) when considering the absorption index (AI, Hall et al., 2002) criterion to identify BAL quasars, instead of the balnicity index criterion considered in this work (BI, Weymann et al., 1991, see Sect. 3.2). The AI criterion identifies as BAL troughs the absorption features that are wider than 1,000 km/s, and typically results in a two times higher BAL fraction than using (Dai et al., 2008). Although the AI criterion can be used to identify the shallowest absorption features, it results in a large fraction of false BAL identifications when applied to spectroscopic data with modest spectral resolution (Knigge et al., 2008). ii) in the reddest quasars (Urrutia et al., 2008; Glikman et al., 2012), which however constitute a minority (10%) of the rest-frame optical selected quasars.
Given the above evidence, the BAL fractions presented in this work and their redshift evolution are robust against selection effects.
.
2.2 sample
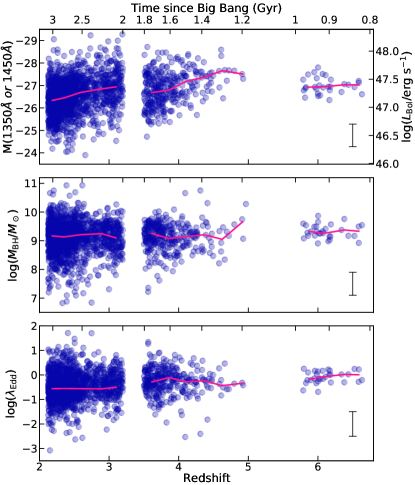
The low-redshift sample consists of 1578 quasars at from the catalogue of SDSS DR7 quasars by Shen et al. (2011), selected to be detected by 2MASS in the H(1.7m) and K(2.2m) bands, which cover rest-frame optical regions of the quasar spectrum, similar to those probed by W1 and W2 in the high-redshift sample. We also include 327 SDSS DR7 quasars at from the Shen et al. (2011) catalogue, requiring them to be detected in the 2MASS K band (which correspond to W1 at ). These quasars are about a factor of ten more luminous than the average SDSS quasar at , with a median magnitude of ( at , at , Fig. 1). Their spectra have a typical SNR per 70 km s-1 pixel in the Å range. We derive by applying a bolometric correction to the monochromatic luminosity of the rest-frame UV continuum (Fig. 1, with a typical scatter of dex, Richards et al., 2006; Runnoe et al., 2012). This sample benefits from measured black hole masses (Shen et al., 2011), which are based on the Mg II line for quasars (349 quasars) and on the C IV emission line (1160 quasars) at , including the empirical correction for non-virial motions by Coatman et al. (2017). We verified that MgII and C IV BH masses are consistent, for the 340 quasars in which both tracers are available, within the respective dex uncertainties (e.g. Vestergaard & Osmer, 2009), in agreement with the results of Shen et al. (2011). For the subsample of quasars already discovered by SDSS DR5, the occurrence and properties of BAL outflows were investigated by Gibson et al. (2009), providing us with a reference analysis to test our BAL identification method. For the remaining quasars, BAL identification in the catalogue was based on visual inspection (Shen et al., 2011). In this work and in Bischetti et al. (2022), we have re-analysed all SDSS quasars in the sample, following the approach described in Sect. 3.
2.3 sample
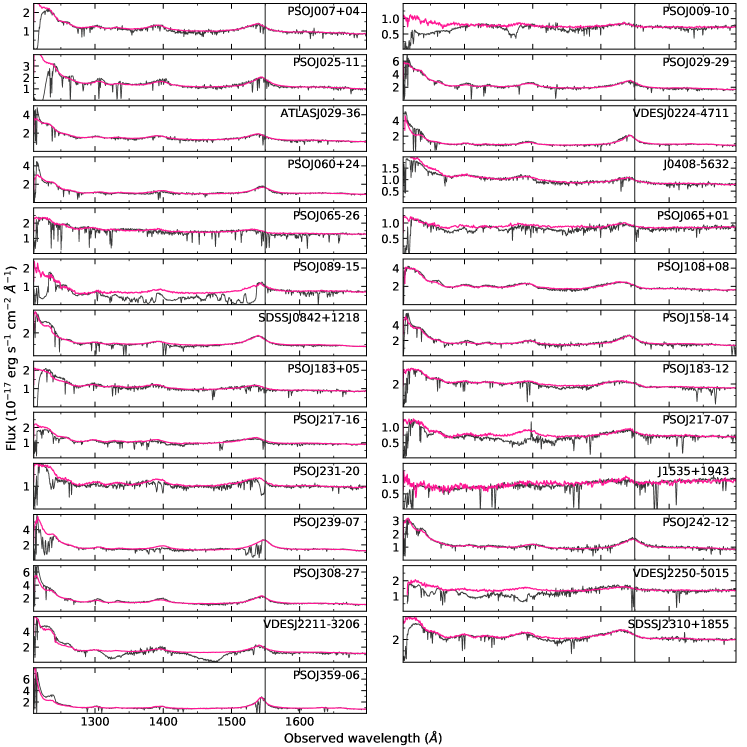
The high-redshift sample used in this work consists of 30 luminous quasars (median AB magnitude ) at from the XQR-30 survey. Their magnitude and redshift distributions are shown in Fig. 1 (Bañados et al., 2016; Mazzucchelli et al., 2017; Reed et al., 2017; Decarli et al., 2018; Wang et al., 2019; Eilers et al., 2020). These quasars are selected to be bright in both the rest-frame UV (AB magnitude for sources and for quasars at ) and in the rest-frame optical, being all detected by WISE in the W1(3.4m) and W2(4.6m) bands (Bañados et al., 2016; Ross & Cross, 2020). Further details about the selection of XQR-30 quasars, data reduction of the X-shooter spectra, and the target list are given in Bischetti et al. (2022). This sample benefits from deep X-shooter observations (SNR 25 per 50 km s-1 pixel in the rest-frame spectral range 1600-1700 Å), and robust, Mg II-based black hole masses (Lai et al., 2022). As for the low-redshift sample, we verified the consistency between Mg II and C IV-based black hole masses. Bolometric luminosities are computed via rest-frame UV bolometric correction using the same method applied to the low-redshift sample (Runnoe et al., 2012).
A systematic search and characterisation of C IV BAL outflows in XQR-30 was performed in Bischetti et al. (2022), based on the same approach used in this work (Sect. 3). Although X-shooter spectra of similar quality (SNR 10) exist to date for several luminous quasars at , we do not consider them in this work as they have been mostly selected for studies of intervening absorbers and are therefore biased against the presence of BAL features (Becker et al., 2019).
. Labels indicate the Ly and C IV emission lines.
3 Identification of BAL quasars
3.1 Reconstruction of quasar continuum emission
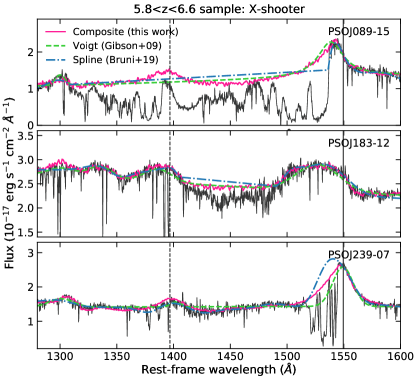
To search for BAL absorption troughs, the first step is to model the intrinsic continuum emission in the rest-frame UV. A possible approach is to fit the spectra with a quasar emission model accounting for continuum and line emission, and extrapolating this model to the spectral region affected by the BAL (Fig. 2). Models typically include a power-law component to reproduce the quasar continuum emission, and Voigt or gaussian profiles to account for emission lines (Gibson et al., 2009; Shen et al., 2011, 2019). Alternatively, more complex, non-physically motivated functions such as splines are sometimes used, as they can be more flexible in reproducing a variety of quasar spectra (e.g. Bruni et al., 2019). Both approaches require that a sufficiently large portion of the quasar spectrum is free from both absorption and emission lines, allowing to anchor the fit. However, this condition is often unsatisfied in the spectral region between Ly- and C IV, resulting in large uncertainties (Fig. 2). In addition, both methods are largely dependent on the regions of the spectrum that are masked prior to fitting, especially in those cases where BAL features cover a wide spectral range or affect emission line profiles.
These uncertainties can be minimised using composite templates built from observed quasar spectra. Quasar spectra can be combined via different techniques such as principal component analysis (Trump et al., 2006; Pâris et al., 2018; Guo & Martini, 2019) or non-negative matrix factorisation (Allen et al., 2011). Here we build, for each quasar of the sample, a composite template based on a large number of SDSS quasar spectra classified as non-BAL in Gibson et al. (2009), each matching within 20% its color and the equivalent width (EW) of the C IV line (Shen et al., 2011). Given the anti-correlation between the EW of C IV and its blueshift with respect to the quasar redshift due to outflowing gas motions (Coatman et al., 2017; Vietri et al., 2018), the latter criterion allows us to reproduce all levels of asymmetry in the C IV line profile. A similar approach was recently adopted by Wang et al. (2018, 2021a), who created composite templates based on matching C IV blueshift of two BAL quasars. The C IV EW or the blueshift criteria should in principle produce similar composite templates. However, SDSS quasar redshifts rely on automatic fitting procedures based on a limited spectral coverage, and are therefore affected by uncertainties on the C IV blueshift that can reach thousands of km s-1, leading to an inaccurate selection of the quasar spectra contributing to the template. We find that a better spectrum-template agreement can be achieved by using the C IV EW during the selection of the quasar spectra.
Concerning the quasar colours, we consider the F(1700Å)/F(2100Å) flux ratio to reproduce the continuum slope redwards of C IV, and the F(1290Å)/F(1700Å) flux ratio, to account for a change in the continuum slope as observed in red quasar spectra (e.g. Trump et al., 2006; Shen et al., 2019). We calculate F(1700Å) and F(2100Å) as median flux values over 100 Å and F(1290Å) over 30 Å in the rest-frame. The underlying assumption is that the observed and intrinsic continuum emission do not differ around 1290 Å that is the bluest spectral region, redward of Ly-, free from strong emission lines. In fact, Ly- forest absorption complicates our measure of the Å quasar continuum, owing to the absorption becoming stronger with increasing redshift. In the case that BAL absorption troughs affect the spectral region close to 1290 Å, our approach would provide a lower limit on the intrinsic quasar continuum emission and on the absorption (Sect. 2).
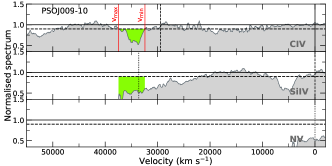
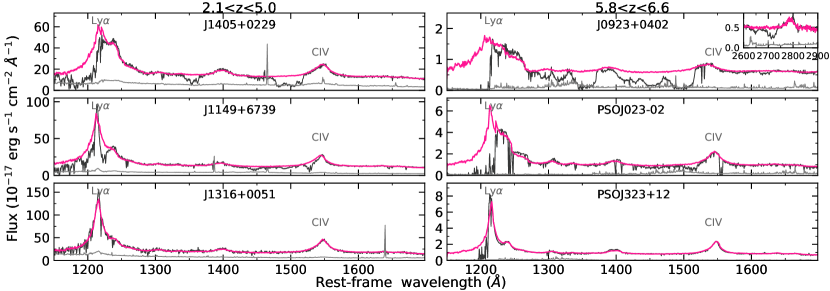
Starting from the total Shen et al. (2011) catalogue of 11800 SDSS quasars in the redshift range , for which SDSS spectroscopy probes the Å wavelength range, the composite template spectrum is built as the median of a hundred randomly selected, non-BAL (Gibson et al., 2009; Shen et al., 2011) quasar spectra. The above number is a trade-off between using stringent selection criteria and ensuring that the composite template is not affected by individual quasar spectra. The composite template is normalised to the median flux value of the quasar spectrum in the rest-frame 1650-1750 Å spectral interval, avoiding prominent emission lines and strong telluric absorption for the redshift interval covered by our sample (Smette et al., 2015). Figure 2 shows that the above approach provides us with (i) a solid reconstruction of the C IV profile even when affected by strong absorption features, (ii) a reasonable estimate of the quasar emission blueward of C IV also in the most absorbed spectra, (iii) a conservative estimate of the continuum emission, typically lower or similar to the continuum reproduced by the Gibson et al. (2009), Bruni et al. (2019) models. Figure 3 shows examples of the SDSS and X-shooter spectra for the quasars belonging to the and samples, respectively. The X-shooter spectra and composite templates for the remaining quasars are shown in Fig. 11. Normalised spectra are obtained by dividing each spectrum by its matched composite template (Fig. 4).
3.2 Characterisation of BAL troughs
The standard indicator used to identify absorption features in quasar spectra due to BAL outflows is the balnicity index (BI), firstly introduced by Weymann et al. (1991), which is a modified equivalent width of the BAL absorption and is less affected by false BAL identification than the AI criterion (Knigge et al., 2008). Here we adopt the balnicity index definition by (Gibson et al., 2009):
| (1) |
where is the normalised spectrum, if for contiguous troughs of km s-1, otherwise. The threshold identifies as BAL features only the spectral regions dipping by 10% or more below the quasar continuum level, and represents a trade-off between taking into account typical uncertainties on the level of the modelled quasar continuum and including shallow absorption features (Weymann et al., 1991).
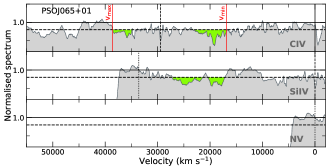
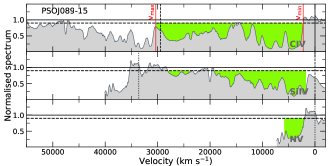
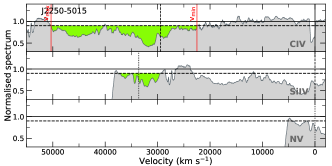
We search the normalised spectra for BAL features in the region between Ly- and C IV, that is corresponding to km s-1 for C IV BAL outflows, km s-1 for Si IV and km s-1 for N V, respectively. We do not extend the search to smaller wavelengths due to the stronger intergalactic medium absorption blueward of Ly- with increasing redshift, preventing us from a homogeneous BAL identification at different epochs. We identify the minimum () and maximum () BAL velocity for a given transition, as the lowest and highest velocity for which in Eq. 1, respectively. Previous studies were typically limited to km s-1 (Trump et al., 2006; Gibson et al., 2009; Guo & Martini, 2019), to avoid discriminating between BAL outflows associated with C IV and Si IV ions. Here we exploit the fact that the C IV optical depth is usually similar or larger than the Si IV depth in BAL quasars (Dunn et al., 2012). This allows us to use the velocity range of the C IV BAL troughs to identify absorption associated with Si IV (Fig. 4, see also Wang et al., 2018; Bruni et al., 2019). This implies that absorption features blueward of Si IV are due to a low velocity Si IV BAL if a C IV BAL with similar velocity is observed. Otherwise, these features are considered to be produced by a high-velocity ( km s-1) C IV BAL (see also Rodríguez Hidalgo et al., 2020). We similarly assume that the C IV optical depth is larger than those of Mg II and N V and apply the methodology above to identify Mg II and BAL features. We measure the BAL width, defined as = . The distributions of , and for the C IV BAL quasars identified in our sample are shown in Fig. 2 of Bischetti et al. (2022), and values for individual quasars at are listed in their Table E1. Uncertainties on the BAL parameters have been computed taking into account the uncertainty on both slope and normalisation of the best-fit composite template, following the method in (Bischetti et al., 2022). Briefly, we created for each quasar a bluer and a redder template as the median of the 33% bluest and the 33% reddest spectra contributing to the best-fit template, and we used them to create new normalised spectra, from which the range of variation of the BAL parameters is calculated. The median uncertainties (68% confidence level) on , , and are 310, 200, 380, and 340 km s-1, respectively, while uncertainties for individual quasars in the sample are given in Table 2. We note that adopting a lower threshold of in Eq. 1 would identify as BAL only the deepest absorption features (corresponding to a km s-1), and would typically imply lower (higher ) by km s-1.
| Name | Species | |||
|---|---|---|---|---|
| PSOJ00910 | Si IV | 2,880 | 33,040 | 38,360 |
| PSOJ06501 | Si IV | 660 | 17,240 | 27,190 |
| PSOJ08915 | Si IV | 8,150 | 2,280 | 28,040 |
| N V | 2,280 | 2,270 | 5,870 | |
| J09230402 | Si IV | 7,970 | 6,110 | 24,330 |
| PSOJ21707 | Si IV | 440 | 30,460 | 35,000 |
| PSOJ23120 | N V | 630 | 140 | 2,350 |
| PSOJ23907 | Si IV | 230 | 830 | 3,360 |
| N V | 1,810 | 820 | 5,720 | |
| J22113206 | Si IV | 3,420 | 9,550 | 19,120 |
| J22505015 | Si IV | 1,320 | 29,460 | 37,540 |
.
Note. — 1) quasar ID, (2) Ionic species of the BAL, (3-5) balnicity index, minimum and maximum velocity of the Si IV BAL outflows, in units of km s-1. Positive and values indicate blue-shifted absorption. (∗) We assume the same range of and of the C IV BAL (Bischetti et al., 2022). (∗∗) corresponds to rest-frame Å, below which the spectrum is dominated by Ly- forest absorption (Sect. 3)
3.3 Non-C IV BALs in the XQR-30 sample
Although the identification of BAL features in high-redshift quasars is mostly based on C IV, due to its high optical depth, the combined study of several other ionic species can be used to investigate the ionisation level, kinematic structure and column density of the outflow (e.g. Filiz Ak et al., 2014; Baskin et al., 2015). However, only a few cases of non-CIV BAL outflows at have been reported so far (Wang et al., 2018, 2021a).
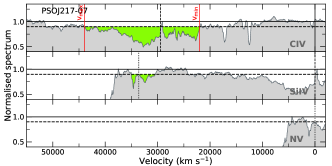
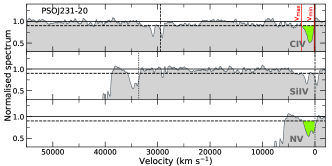
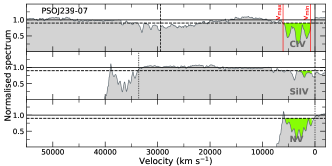
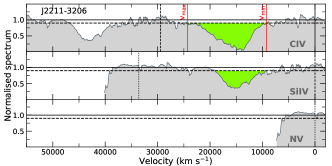
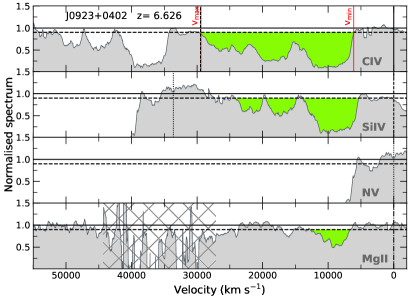
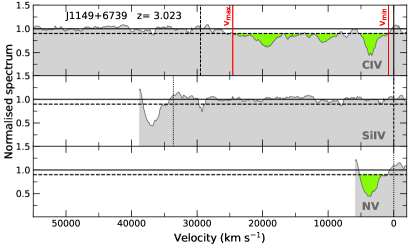
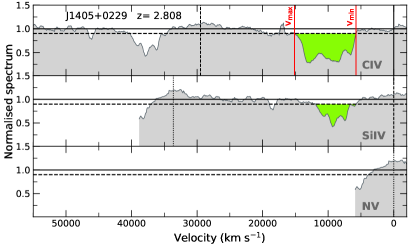
Here we find that, of the 14 C IV BAL quasars identified in (Bischetti et al., 2022), eight also show a BAL system associated with the Si IV ion (namely PSOJ009-10, PSOJ065+01, PSOJ089-15, J0923+0402, PSOJ217-07, PSOJ239-07, J2211-3206, J2250-5015), three show a N V BAL (namely PSOJ089-15, PSOJ231-20, PSOJ239-07), and one (J0923+0402) shows a Mg II BAL. Figure 4 shows as an example the normalised spectrum of quasar J0923+0402 at , for which we identify strong BAL systems associated with C IV, Si IV, and Mg II ions. The C IV BAL is characterised by a (C IV) km s-1 and extends between (C IV) km s-1 and (C IV) km s-1 (Bischetti et al., 2022). We identify a Si IV BAL spanning a similar velocity range, with (Si IV) km s-1, and a less prominent Mg II BAL with (Mg II) km s-1. We cannot assess the presence of a N V BAL in this quasar, because of almost no transmitted flux blueward of Ly-.
We thus classify 12 quasars as HiBALs, and quasar J0923+0402 () as a LoBAL. In the case of PSOJ189-15 (), strong telluric contamination affecting the spectral region blueward of Mg II does not allow us to validate/rule out the presence of a Mg II BAL. Our results increases by a factor of about four the number of Si IV BAL quasars identified at (Wang et al., 2021a). The presence of a Si IV BAL in J2211-3206 () was previously suggested by Chehade et al. (2018). A few hints of Mg II absorption in quasars have been reported so far (e.g. Maiolino et al., 2004; Wang et al., 2021a).
. In all panels, the dashed line indicates a 1:1 relation and the error bar represents the typical uncertainty on the BAL parameters (Sect. 3.2).
The BAL parameters measured for the Si IV and N V BAL outflows are listed in Table 2, and their residual spectra are shown in Fig. 12. The Si IV BAL features are characterised by km s-1, which are typically smaller (10-60%) than those measured in C IV, consistently with what has been found for SDSS quasars (Gibson et al., 2009). The only exception is PSOJ009-10, for which (C IV) = 1,110 km s-1 (Bischetti et al., 2022) and (Si IV)=2,880 km s-1. However, this quasar shows a very red spectrum with almost no Ly- and N V emission, overfitted by the composite template at Å (Fig. 11). This suggests strong absorption, consistent with the presence of a Si IV BAL outflow, whose properties are nevertheless highly uncertain. For the N V BALs, we measure km s-1.
3.4 Re-analysis of SDSS quasar spectra
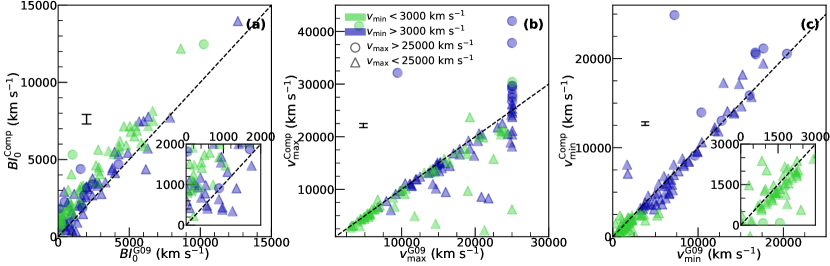
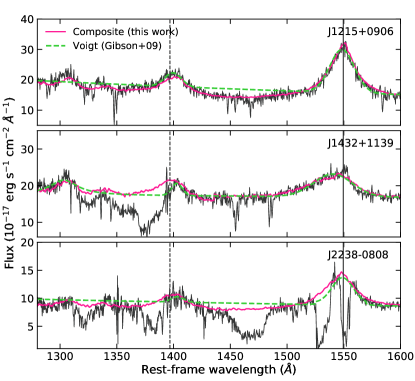
Given that the quasars in our sample did not benefit from a homogeneous identification and characterisation of BAL outflows from the literature (Sect. 2.2), we have re-analysed their spectra following the approach described in Sect. 3. In Fig. 5 we compare our results with those by Gibson et al. (2009), who provided , and for the 1317 SDSS DR5 quasars in our sample (Schneider et al., 2007). We identify as BALs 162 out of the 207 BAL quasars found by Gibson et al. (2009). The remaining quasars, classified as non-BAL quasars in our analysis, have only very weak BAL absorption in Gibson et al. (2009) (all but 5 have km s-1), likely owing to the flat continuum emission in the C IV-Si IV spectral region not well reproduced by the reddened power-law continuum model used by Gibson et al. (2009), introducing a small systematic on the true continuum level. One example is shown in Fig. 6 top panel for quasar SDSSJ12150906 (), previously classified as a BAL quasar with km s-1 by Gibson et al. (2009), which we instead identify as a non-BAL. In addition, small differences between the DR5 and DR7 spectra can easily produce variations of a few hundred km s-1 (e.g. Byun et al., 2022; Vietri et al., 2022). On the other hand, we identify 39 new BAL quasars that were classified as non-BALs by Gibson et al. (2009). One example is SDSS quasar J1432+1139 (, Fig. 6 middle panel), showing high-velocity C IV BAL features with km s-1, that is outside the spectral range investigated by Gibson et al. (2009). When comparing the properties of the BAL quasars identified in both our work and Gibson et al. (2009), we find on average no systematic difference in , with a significant scatter at km s-1 (Fig. 5a). We measure higher for those quasars in which the BAL absorption reaches km s-1, as Gibson et al. (2009) did not account for absorption troughs beyond this threshold. We typically measure larger in those cases in which the absorption has km s-1 and thus affects the blue side of the C IV line, as it can be seen for SDSS J2238-0808 (z=3.17) in Fig. 6 bottom panel. This is due to the fact that our composite templates better reproduce the asymmetric C IV profiles, typically showing a more prominent blue wing due to ionised outflows, than the Voigt profiles in Gibson et al. (2009).
The majority of the C IV BAL outflows show and velocities similar to those measured by Gibson et al. (2009). In a few cases, we measure lower because of the different continuum treatments, and we identify a subsample of BAL quasars with extremely fast BAL outflows ( km s-1), missed by Gibson et al. (2009). These high-velocity BAL outflows are visible as a cut-off around km s-1 in Figure 5b. Our findings are consistent with the results of Bruni et al. (2019); Rodríguez Hidalgo et al. (2020), who reported the presence of BAL outflows reaching velocities of 10-15% of the light speed in a small fraction of SDSS quasars at . In the case of absorption with km s-1 (Fig. 5c), we typically measure lower by a factor of about two with respect to Gibson et al. (2009) estimates, likely because the Voigt profiles employed in their modelling underestimate the intrinsic emission of the C IV blue wing (Fig. 6 bottom).
.
4 BAL quasar fraction
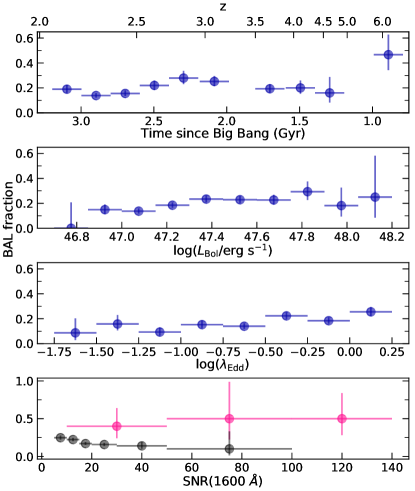
Figure 7 shows the evolution of the BAL quasar fraction across a cosmic time interval of about Gyr, corresponding to the redshift range probed by our sample. We find the BAL fraction to be almost constant at with a median value of %. The oscillations around this value are likely due to the SDSS quasar selection systematics, affecting differently BAL and non-BAL quasars as a function of redshift, that are minimised but not totally removed by our sample selection (Sect. 2.1). Indeed, BAL quasars are expected to be less-efficiently selected than non-BALs at , more efficiently selected at , while no significant difference in the selection efficiency is predicted for (Reichard et al., 2003). The BAL fraction is instead significantly higher at , by a factor of about 2.5 (Bischetti et al., 2022). The lack of data at does not allow us to assess whether the decrease in the BAL fraction at is smooth, consistently with secular evolution of the BH accretion properties, or whether it rapidly drops after , due to efficient BH feedback at early epochs (see Sect. 6.1).
| Correlation | -value | -valueS |
|---|---|---|
| (1) | (2) | |
| BAL fraction vs. | 0.05[0.03-0.08] | 0.09[0.02-0.52] |
| BAL fraction vs. | 0.009[0.002-0.05] | 0.03[0.008-0.11] |
| vs | ||
| vs | 0.025 | 0.016 |
| vs | ||
| vs | 0.16[0.06-0.43] | 0.045[0.009-0.24] |
| vs | 0.81 [0.61-1.0] | 0.45[0.28-0.71] |
| vs | 0.03 [0.004-0.1] | 0.01[0.002-0.07] |
.
Note. — (1) values associated with the difference between a constant and a linear-relation fit. (2) values for a Spearman rank’s correlation test. Square brackets correspond to the standard deviation on taking into account the 0.2(0.5)dex uncertainty on ()
To investigate whether the BAL fraction depends on nuclear properties of the quasar, Figure 7 also shows the BAL fraction as a function of and . Bischetti et al. (2022) found no significant increase in the BAL fraction of quasars in the luminosity range log(/erg s-1), even after correcting the UV-continuum level for the BAL absorption. However, because BAL quasars typically show redder slopes of the UV continuum (Trump et al., 2006; Gibson et al., 2009; Allen et al., 2011) also in the high-luminosity regime spanned by our sample, using a common bolometric correction may result in an underestimate of in BAL quasars. We do not correct the continuum luminosity for dust extinction because of the limited spectral range covered by the SDSS spectra, resulting in substantial degeneracy between the UV continuum shape and the magnitude of intrinsic reddening (e.g. Gibson et al., 2009). Also, one would need to assume an extinction law and possibly also its evolution with redshift (e.g. Gallerani et al., 2010), increasing the uncertainties on . Instead, because all quasars in our sample are detected in the rest-frame optical, we derive an independent estimate of by applying the Å bolometric correction by Runnoe et al. (2012) to the 2MASS H(K) fluxes for the () subgroups in our low-z sample, and to the WISE fluxes for the high-z sample. The optical-based and UV-based bolometric luminosities are consistent for non-BAL quasars, while the optical-based are typically higher by a factor of two for BAL quasars. Figure 7 shows the BAL fraction as a function of the optical-based . We find a marginal correlation (-value , Table 3) with a BAL fraction increase from to 25%. A clearer trend (-value ) is observed between the BAL fraction and , with a factor of two increase in the BAL fraction for log up to although we caution that most of the BH masses for our are based on the C IV line width, which can be significantly altered by the presence of BAL absorption with velocities of a few thousands km s-1. This is consistent with the results from previous studies focusing on luminous quasars at (Dai et al., 2008; Bruni et al., 2019). Nevertheless, neither the nor the trends can account for the BAL fraction measured for the sample (median log()=47.3, median ).
.
Finally, we investigate the dependence of the BAL fraction on the SNR of the quasar spectra. To this purpose, we homogeneously compute the SNR as the ratio between the median quasar continuum emission in the rest-frame interval 1650-1750 Å and the spectral noise, defined as the median rms in the same spectral region for a 70 km s-1 pixel (Sect. 3.1). Figure 7 (bottom) shows no trend of the BAL with SNR for the sample, while it decreases with increasing SNR for the sample. This is likely due to the combination of (i) a similar rms sensitivity for the spectra, and (ii) bluer continuum slopes, translating into higher SNR for the non-BAL quasars in our sample. Previous studies of BAL quasars in SDSS reported no or little increasing trend (a few %) of the BAL fraction with SNR, for a similar range of SNR (Gibson et al., 2009; Allen et al., 2011), likely reflecting the mild trend with , due to the wider (by about one order of magnitude) quasar luminosity range sampled by these works. We conclude that the increasing trend of the BAL fraction at is a genuine cosmic evolution and does not depend either on trends with nuclear properties or on the SNR of the spectra.
5 Kinematic properties of BAL outflows
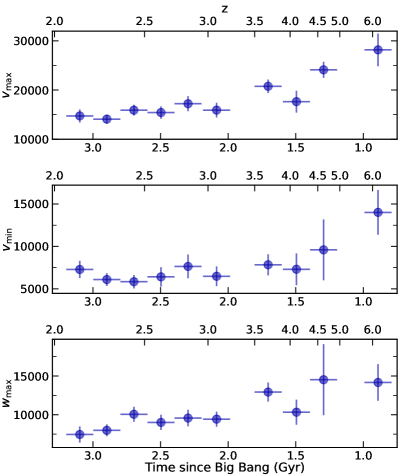
Here we investigate the evolution of the BAL kinematics across cosmic time, as traced by , and (Sect. 3.2). Top panel of Fig. 8 shows that the maximum velocity of BAL outflows significantly increases by a factor of about two between and (-value , Table 3), from to km s-1. A similar trend is observed also for the minimum BAL velocity, reaching a typical value of at . An increased fraction of BAL quasars with km s-1 at was recently suggested by Rodríguez Hidalgo et al. (2020). Because of the larger increase of with respect to as a function of redshift, the width of the BAL features also increases between (9,000 km s-1) and (15,000 km s-1).
.
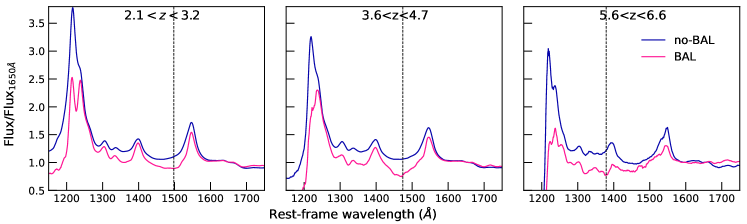
Figure 9 shows that, because of the combination of the above trends, the composite spectrum of BAL quasars is differently affected by absorption features in three intervals of increasing redshift. The lowest redshift bin () shows that the absorption typically affects the blue side of C IV and the deepest absorption is located at Å (i.e. blueshifted by km s-1). At intermediate redshift () the C IV wing is still partially altered by the absorption, which affects the whole spectral range between C IV and Si IV. The deepest absorption is blueshifted by km s-1. In the highest redshift interval () the absorption is even broader and extends blueward of Si IV, down to Å. The deepest absorption is blueshifted by km s-1. We note that, owing to the very broad distributions of , in combination with the small sample size in this high-redshift bin, we include in Fig. 9 only BALs with the most prominent features ( km s-1, Bischetti et al., 2022). These results, together with the higher BAL fraction observed in quasars at , suggest an evolution of the BAL properties with cosmic time.
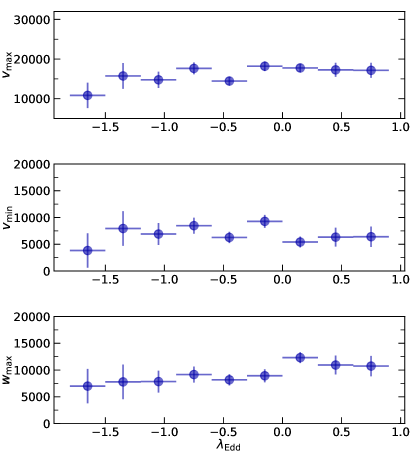
To test whether there is a dependence of the BAL kinematics on nuclear quasar properties, we show in Figure 10 the relations between , and , as a function of the BH accretion rate. We find no evident increase of either and with increasing over about two orders of magnitude, with an almost constant km s-1 and km s-1 (Table 3). There is a hint for a higher (-value ) at high accretion rates, likely due to the lower observed in the three bins with the highest . Similarly, we observe no significant trend of the BAL kinematics with , likely due to the limited luminosity range spanned by our sample. Indeed, no or only mild trends of increasing with , were suggested by previous works studying BAL quasars in SDSS in a wider range of (Ganguly et al., 2007; Gibson et al., 2009; Bruni et al., 2019). Previous studies at reported tentative evidence of different properties in BAL quasars with low/high , in terms of steepness of the X-ray to UV spectral energy distribution or emission line properties, although no significant relation between and quasar luminosity or accretion rate was found (Gibson et al., 2009; Turnshek et al., 1988). We agree with previous results finding no significant correlation between and (Table 3). These findings confirm that the trend of increasing , , and with redshift in our quasar sample cannot be explained by variations in the quasar nuclear properties, but rather points to an evolutionary effect.
6 Discussion
6.1 Cosmic evolution of BAL outflow properties
Our results indicate an evolution with redshift of the properties of BAL outflows in luminous quasars at . We find that the BAL fraction below is almost constant and close to (Fig. 7), while it significantly increases up to almost at . The trend at is consistent with the results of previous studies focusing on rest-frame optical luminous quasar samples (Maddox et al., 2008; Dai et al., 2008), which reported a modest evolution of the BAL fraction with redshift. However, heavily-reddened broad-line quasars are expected to represent a high fraction of the bright quasar population at (Banerji et al., 2015; Glikman et al., 2018), and may be missed by SDSS, from which our sample is drawn. Several recent surveys (e.g. Schindler et al., 2019; Boutsia et al., 2021; Grazian et al., 2022) have indeed shown that the SDSS selection of bright quasars at high redshift could possibly suffer from incompleteness by up to at , and up to a factor of a few at (Wolf et al., 2020; Onken et al., 2022), plausibly affecting also quasars. Our quasar sample is limited to magnitudes and probes similar depths in the and WISE bands (see Table ED1 in Bischetti et al., 2022). Accordingly, we may miss red BAL quasars at , detected by WISE but too faint in the rest-frame UV to match our selection (e.g. Kato et al., 2020). Due to the above limitations and to the limited number of quasars in our sample, we cannot accurately probe the BAL fraction evolution in the highest redshift bins. Nevertheless, we can safely assess that the increase in the BAL fraction between and is a robust evolutionary trend, and that selection effects (e.g. including dust-reddened quasars) would increase this difference even further.
By investigating the dependence of the BAL fraction on quasar nuclear properties, we can safely exclude that the large difference between the BAL fraction at and is due to differences in quasar luminosity and accretion rate. Instead, the higher BAL fraction at can be explained either with wider angle outflows or as a result of longer blow-out phases of BH-driven outflows compared with (Bischetti et al., 2022). A redshift evolution of the BAL geometry is indeed suggested by the increase with redshift of the velocity range spanned by the BAL troughs, as traced by (Murray & Chiang, 1998; Elvis, 2000; Hall et al., 2002). Although the link of to the velocity dispersion of the outflowing gas is not straightforward, as we mostly observe blends of outflowing components (e.g. Borguet et al., 2013), the increase of may be interpreted as stronger turbulence in the higher redshift BAL outflows. In a scenario of Chaotic Cold Accretion (CCA), gas turbulence on scales similar to those of BALs (100 pc, Arav et al., 2018) is linked to the condensation and funnelling of the cold gas phase toward the BH, higher turbulence implying stronger inflows and, in turn, triggering more efficient phases of BH feedback (Gaspari et al., 2020).
We find that the BAL velocity (either and ) typically increases with redshift, suggesting that BAL outflows in the high-z Universe might be more easily accelerated to very high velocity than at later cosmic epochs. A viable explanation might be the presence of dust mixed with the ionised gas in the BAL clouds, which would significantly increase the radiation boost efficiency (Ishibashi et al., 2017; Costa et al., 2018) and accelerate the BAL outflows to the observed extreme km s-1 (Bischetti et al., 2022). At later cosmic epochs, although BAL quasars are known to show relatively redder UV colours (Reichard et al., 2003; Trump et al., 2006; Gibson et al., 2009), no strong difference in the optical colours of BAL and non-BAL quasars is typically observed, at least in optically-bright sources (e.g. Dai et al., 2008).
Alternative scenarios that could explain the higher BAL velocities at early epochs might be related to different properties of BH accretion at different redshift. CCA toward the BH is expected to be favoured at higher redshift, because of a larger fraction of a clumpy cold gas phase in the quasar hosts, boosting BH-driven outflows to higher velocities (Gaspari & Sadowski, 2017). Also, BALs could be launched with higher velocities if BHs are spinning more rapidly at high redshift (King et al., 2008; Zubovas & King, 2021). High BAL velocities have been more commonly found in sources with softer spectral energy distributions, that is lower X-ray to optical luminosity ratios, either from direct X-ray observations of low-z quasars (Laor & Brandt, 2002) or using indirect tracers such as the EW of the He II Å emission line in SDSS quasars, (Richards et al., 2011; Baskin et al., 2015; Rodríguez Hidalgo et al., 2020). For the highest redshift bins in which we observe the largest values of , (see Fig. 8), there is very limited information on the X-ray properties. Only a few tens of quasars have been targeted with sensitive observations at , including only a few BAL quasars, some of which do exhibit the softest optical-to-X-ray slopes (Nanni et al., 2017; Vito et al., 2019; Wang et al., 2021b). The weakness of the He II emission line makes its detection very challenging at these redshifts (e.g. Shen et al., 2019). The characterisation of the He II emission in the sample, enabled by the high-SNR of the X-shooter spectra from the XQR-30 survey, will be presented in a forthcoming paper.
6.2 Impact of BAL outflows on BH and galaxy-evolution
The broad and often saturated BAL profiles associated with CIV prevent us from an accurate measurement of the outflowing gas mass and hence of the energy injected by the outflow into the galaxy medium (Dunn et al., 2012; Borguet et al., 2013). Nevertheless, assuming that BAL outflow masses at are similar to those measured using unsaturated absorption lines in quasars (Moe et al., 2009; Dunn et al., 2010), we can estimate that BAL quasars at globally inject about 20 times more energy with respect to quasars (Bischetti et al., 2022). Indeed, the outflow kinetic power linearly scales with the BAL fraction and with the third power of (Eq. 5 and 6 in Bischetti et al., 2017). This result strongly points towards a phase of efficient BH feedback occurring at , as the energy injected by these BAL outflows will likely suppress gas accretion and slow down BH growth (e.g Torrey et al., 2020). This likely represents the first observational evidence of what has been so far only predicted by cosmological simulations of the early assembly of bright quasars. BHs at the centre of bright quasars are indeed expected to grow exponentially at very high redshift (), with accretion rates close to the Eddington limit or beyond (Inayoshi et al., 2016; Pezzulli et al., 2016), while around BH growth is expected to significantly slow down because BH feedback has become strong enough to remove gas from the central galaxy regions and to prevent further accretion onto the BH (Costa et al., 2014; van der Vlugt & Costa, 2019). BHs powering bright quasars at , with typical masses of M⊙ (Mazzucchelli et al., 2017; Shen et al., 2019; Farina et al., 2022), have been found to be typically over-massive by a factor of with respect to the mass of their host-galaxies, when compared to the BH mass vs galaxy dynamical mass relation observed in the low-redshift Universe (Gaspari et al., 2019; Pensabene et al., 2020; Neeleman et al., 2021). State-of-the-art measurements of the BH mass (based on the Mg II line), and of the dynamical mass (based on spatially-resolved C II m observations) for the quasars in our sample confirm this result, indicating that BH growth must have dominated over the host-galaxy growth at and that a transition epoch during which BH growth decelerates must occur at , leading toward the symbiotic BH and galaxy growth (e.g. Lamastra et al., 2010; Zubovas & King, 2021; Inayoshi et al., 2022). An early BH mass assembly in bright quasars occurring at is also supported by the fact that the largest BH masses measured at and at only differ by a factor of a few (Trakhtenbrot, 2021) and by the increase of the median BH accretion rate with redshift for a given quasar luminosity (Yang et al., 2021; Farina et al., 2022).
The above scenario points toward BH feedback as a likely driver of BH growth suppression, but other physical processes might be in place. The cosmic evolution of the BAL fraction is key to identify the dominant mechanism responsible for slowing down BH growth. A sharp decrease of the BAL fraction occurring between and would strongly point toward a phase of efficient BH feedback occurting on a short timescale (few tens of Myrs Negri & Volonteri, 2017) and quickly removing gas from the central regions of the galaxy (Zubovas & King, 2013). Conversely, a smooth decrease of the BAL fraction from to , would rather indicate that several processes may be at play in the transition, including a (less efficient) BH feedback and secular processes, such as a change in the merger rate or in the gas condensation rate, reducing the active phase duty cycle on a timescale of several hundreds of Myrs (Gaspari et al., 2019; O’Leary et al., 2021). To discriminate between these competing scenarios, a crucial step is to obtain a reliable measure of the evolution of the BAL fraction with redshift in representative samples, with a cosmic time sampling Myr. Currently, the sample presented in this work and, particularly, the lack of sources at do not allow us to accurately probe the high-redshift evolution of the BAL fraction between and . New high quality spectroscopic observations of an absorption-unbiased sample of rest-frame optical bright quasars are necessary to fill this gap and test whether efficient BH feedback is the dominant mechanism leading to the symbiotic BH-galaxy growth phase.
On the other hand, it is unclear whether and on what timescales BAL outflows can affect the evolution of the host-galaxies of quasars. Observations of BAL quasars at intermediate redshift report mass outflow rates up to several hundreds of M⊙/yr (e.g Fiore et al., 2017; Bruni et al., 2019), consistent with theoretical expectations from models of BH-driven outflows for an efficient feedback mechanism (Faucher-Giguère & Quataert, 2012; Zubovas & King, 2012) and outflow sizes based on photo-ionisation analysis that can reach kpc scales (Arav et al., 2018; Byun et al., 2022), suggesting that BAL outflows may also affect the physical properties of the galaxy medium and, in turn, the galaxy growth.
If the effect of BAL feedback extends to kpc scales, host-galaxy properties such as the star formation rate (SFR) would be expected to be different in BAL and non-BAL quasars. If conflicting results have been reported at (e.g. Zhang et al., 2014; Wethers et al., 2020), and at large uncertainties affect SFR measurements (Wang et al., 2019; Tripodi et al., 2022; Di Mascia et al., 2023) and do not allow us to investigate differences within our sample. A correlation is also expected between the strength of BH feebdack and the cooling rate of the hot and warm gas phases in the quasar host galaxies, due to heating and turbulence injection into the ISM (e.g. Gaspari, 2015).
7 Conclusion
In this work we analyse a sample of 1935 luminous (bolometric luminosity erg s-1) quasars at , drawn from the Sloan Digital Sky Survey (Shen et al., 2011) and from the X-shooter legacy survey of Quasars at Reionisation (Bischetti et al., 2022), to investigate the evolution with cosmic time of the BAL fraction and of the kinematics of BH-driven outflows, as traced by BAL features. Targeting rest-frame optical bright quasars allows us to to reduce biases due to quasar selection criteria (Sect. 2.1).
We apply a homogeneous BAL identification method to the total sample, based on composite template spectra to estimate the intrinsic quasar continuum and line emission (Sect. 3). This approach allows us to well reproduce the spectral region between Ly- and C IV for a variety of BAL shapes, without any assumptions on the continuum shapes, nor on the spectral regions in which absorption might occur. At the same time, it takes into account the asymmetry often observed in the C IV profile due to the presence of outflowing gas.
We find that the BAL fraction is about 20% and does not vary strongly across this redshift range, in agreement with previous works (Dai et al., 2008; Maddox et al., 2008), while it increases to almost 50% at (Bischetti et al., 2022). We also investigate the dependence of the BAL fraction with quasar nuclear properties such as , , and we observe only weak correlations given the ranges of luminosity and accretion rate probed by our sample, in agreement with previous results for SDSS quasars (e.g. Gibson et al., 2009; Bruni et al., 2019). These trends cannot account for the increase in the BAL fraction observed in the sample (Sect. 4).
We also observe a redshift evolution of the BAL kinematics. Both and increases at , the typical BAL velocities at being a factor of 2-3 higher than what observed at (Sect. 5). The width of the BAL features also likely increases at . These trends suggest a possible evolution of the BAL geometry and are consistent with BALs being more easily accelerated at early cosmic epochs (Sect. 6.1). By investigating the dependence of the BAL kinematics with , , we were able to exclude that the redshift evolution is due to different luminosity and/or accretion properties within the sample.
BAL outflows being more common and faster at imply that strong BH feedback is likely occurring around this epoch, owing to the injection of large amounts of energy into the BH surroundings and in the galaxy medium, in agreement with expectations from galaxy evolution models (van der Vlugt & Costa, 2019; Inayoshi et al., 2022). However, the limited number of high-redshift quasars in our sample does not allow us to accurately probe the evolution of the BAL fraction on a timescale of 100-200 Myr. This hampers us from discriminating between a sudden or a smooth change of the BAL fraction with increasing redshift and, in turn, from assessing whether BH feedback is driving this evolution. Building a larger, absorption-unbiased sample of rest-frame optical bright quasars with high-quality optical and near-IR spectroscopy will be fundamental to observationally quantify the impact of BH feedback on early BH growth. By complementing this sample with high-frequency ALMA and JWST observations we will be able to measure the host-galaxy growth and to assess whether quasar feedback at drives the onset of the symbiotic BH-and-galaxy evolution observed in the lower redshift Universe.
References
- Allen et al. (2011) Allen, J. T., Hewett, P. C., Maddox, N., Richards, G. T., & Belokurov, V. 2011, MNRAS, 410, 860, doi: 10.1111/j.1365-2966.2010.17489.x
- Arav et al. (2018) Arav, N., Liu, G., Xu, X., et al. 2018, ApJ, 857, 60, doi: 10.3847/1538-4357/aab494
- Astropy Collaboration et al. (2013) Astropy Collaboration, Robitaille, T. P., Tollerud, E. J., et al. 2013, A&A, 558, A33, doi: 10.1051/0004-6361/201322068
- Astropy Collaboration et al. (2018) Astropy Collaboration, Price-Whelan, A. M., Sipőcz, B. M., et al. 2018, AJ, 156, 123, doi: 10.3847/1538-3881/aabc4f
- Bañados et al. (2016) Bañados, E., Venemans, B. P., Decarli, R., et al. 2016, ApJS, 227, 11, doi: 10.3847/0067-0049/227/1/11
- Banerji et al. (2015) Banerji, M., Alaghband-Zadeh, S., Hewett, P. C., & McMahon, R. G. 2015, MNRAS, 447, 3368, doi: 10.1093/mnras/stu2649
- Baskin et al. (2015) Baskin, A., Laor, A., & Hamann, F. 2015, MNRAS, 449, 1593, doi: 10.1093/mnras/stv406
- Becker et al. (2019) Becker, G. D., Pettini, M., Rafelski, M., et al. 2019, ApJ, 883, 163, doi: 10.3847/1538-4357/ab3eb5
- Becker et al. (2000) Becker, R. H., White, R. L., Gregg, M. D., et al. 2000, ApJ, 538, 72, doi: 10.1086/309099
- Bischetti et al. (2017) Bischetti, M., Piconcelli, E., Vietri, G., et al. 2017, A&A, 598, A122, doi: 10.1051/0004-6361/201629301
- Bischetti et al. (2022) Bischetti, M., Feruglio, C., D’Odorico, V., et al. 2022, Nature, 605, 244, doi: 10.1038/s41586-022-04608-1
- Borguet et al. (2013) Borguet, B. C. J., Arav, N., Edmonds, D., Chamberlain, C., & Benn, C. 2013, ApJ, 762, 49, doi: 10.1088/0004-637X/762/1/49
- Bosman et al. (2021) Bosman, S. E. I., Davies, F. B., Becker, G. D., et al. 2021, arXiv e-prints, arXiv:2108.03699. https://arxiv.org/abs/2108.03699
- Boutsia et al. (2021) Boutsia, K., Grazian, A., Fontanot, F., et al. 2021, ApJ, 912, 111, doi: 10.3847/1538-4357/abedb5
- Bruni et al. (2019) Bruni, G., Piconcelli, E., Misawa, T., et al. 2019, A&A, 630, A111, doi: 10.1051/0004-6361/201834940
- Byun et al. (2022) Byun, D., Arav, N., & Hall, P. B. 2022, ApJ, 927, 176, doi: 10.3847/1538-4357/ac503d
- Chehade et al. (2018) Chehade, B., Carnall, A. C., Shanks, T., et al. 2018, MNRAS, 478, 1649, doi: 10.1093/mnras/sty690
- Chen et al. (2022) Chen, Z., He, Z., Ho, L. C., et al. 2022, Nature Astronomy, 6, 339, doi: 10.1038/s41550-021-01561-3
- Coatman et al. (2017) Coatman, L., Hewett, P. C., Banerji, M., et al. 2017, MNRAS, 465, 2120, doi: 10.1093/mnras/stw2797
- Costa et al. (2018) Costa, T., Rosdahl, J., Sijacki, D., & Haehnelt, M. G. 2018, MNRAS, 473, 4197, doi: 10.1093/mnras/stx2598
- Costa et al. (2014) Costa, T., Sijacki, D., Trenti, M., & Haehnelt, M. G. 2014, MNRAS, 439, 2146, doi: 10.1093/mnras/stu101
- Dai et al. (2008) Dai, X., Shankar, F., & Sivakoff, G. R. 2008, ApJ, 672, 108, doi: 10.1086/523688
- Decarli et al. (2018) Decarli, R., Walter, F., Venemans, B. P., et al. 2018, ApJ, 854, 97, doi: 10.3847/1538-4357/aaa5aa
- Di Mascia et al. (2023) Di Mascia, F., Carniani, S., Gallerani, S., et al. 2023, MNRAS, 518, 3667, doi: 10.1093/mnras/stac3306
- Dunn et al. (2012) Dunn, J. P., Arav, N., Aoki, K., et al. 2012, ApJ, 750, 143, doi: 10.1088/0004-637X/750/2/143
- Dunn et al. (2010) Dunn, J. P., Crenshaw, D. M., Kraemer, S. B., & Trippe, M. L. 2010, ApJ, 713, 900, doi: 10.1088/0004-637X/713/2/900
- Eilers et al. (2020) Eilers, A.-C., Hennawi, J. F., Decarli, R., et al. 2020, ApJ, 900, 37, doi: 10.3847/1538-4357/aba52e
- Elvis (2000) Elvis, M. 2000, ApJ, 545, 63, doi: 10.1086/317778
- Farina et al. (2022) Farina, E. P., Schindler, J.-T., Walter, F., et al. 2022, arXiv e-prints, arXiv:2207.05113. https://arxiv.org/abs/2207.05113
- Faucher-Giguère & Quataert (2012) Faucher-Giguère, C.-A., & Quataert, E. 2012, MNRAS, 425, 605, doi: 10.1111/j.1365-2966.2012.21512.x
- Filiz Ak et al. (2014) Filiz Ak, N., Brandt, W. N., Hall, P. B., et al. 2014, ApJ, 791, 88, doi: 10.1088/0004-637X/791/2/88
- Fiore et al. (2017) Fiore, F., Feruglio, C., Shankar, F., et al. 2017, A&A, 601, A143, doi: 10.1051/0004-6361/201629478
- Gallerani et al. (2010) Gallerani, S., Maiolino, R., Juarez, Y., et al. 2010, A&A, 523, A85, doi: 10.1051/0004-6361/201014721
- Ganguly & Brotherton (2008) Ganguly, R., & Brotherton, M. S. 2008, ApJ, 672, 102, doi: 10.1086/524106
- Ganguly et al. (2007) Ganguly, R., Brotherton, M. S., Cales, S., et al. 2007, ApJ, 665, 990, doi: 10.1086/519759
- Gaspari (2015) Gaspari, M. 2015, MNRAS, 451, L60, doi: 10.1093/mnrasl/slv067
- Gaspari & Sadowski (2017) Gaspari, M., & Sadowski, A. 2017, ApJ, 837, 149, doi: 10.3847/1538-4357/aa61a3
- Gaspari et al. (2020) Gaspari, M., Tombesi, F., & Cappi, M. 2020, Nature Astronomy, 4, 10, doi: 10.1038/s41550-019-0970-1
- Gaspari et al. (2019) Gaspari, M., Eckert, D., Ettori, S., et al. 2019, ApJ, 884, 169, doi: 10.3847/1538-4357/ab3c5d
- Gehrels (1986) Gehrels, N. 1986, ApJ, 303, 336, doi: 10.1086/164079
- Gibson et al. (2009) Gibson, R. R., Jiang, L., Brandt, W. N., et al. 2009, ApJ, 692, 758, doi: 10.1088/0004-637X/692/1/758
- Giustini et al. (2008) Giustini, M., Cappi, M., & Vignali, C. 2008, A&A, 491, 425, doi: 10.1051/0004-6361:200810363
- Glikman et al. (2012) Glikman, E., Lacy, M., Urrutia, T., Djorgovski, G., & Mahabal, A. 2012, in American Astronomical Society Meeting Abstracts, Vol. 219, American Astronomical Society Meeting Abstracts #219, 209.03
- Glikman et al. (2018) Glikman, E., Lacy, M., LaMassa, S., et al. 2018, ApJ, 861, 37, doi: 10.3847/1538-4357/aac5d8
- Grazian et al. (2022) Grazian, A., Giallongo, E., Boutsia, K., et al. 2022, ApJ, 924, 62, doi: 10.3847/1538-4357/ac33a4
- Guo & Martini (2019) Guo, Z., & Martini, P. 2019, ApJ, 879, 72, doi: 10.3847/1538-4357/ab2590
- Hall et al. (2002) Hall, P. B., Anderson, S. F., Strauss, M. A., et al. 2002, ApJS, 141, 267, doi: 10.1086/340546
- Hamann et al. (2018) Hamann, F., Chartas, G., Reeves, J., & Nardini, E. 2018, MNRAS, 476, 943, doi: 10.1093/mnras/sty043
- Harris et al. (2020) Harris, C. R., Millman, K. J., van der Walt, S. J., et al. 2020, Nature, 585, 357, doi: 10.1038/s41586-020-2649-2
- Hemler et al. (2019) Hemler, Z. S., Grier, C. J., Brandt, W. N., et al. 2019, ApJ, 872, 21, doi: 10.3847/1538-4357/aaf1bf
- Hewett & Foltz (2003) Hewett, P. C., & Foltz, C. B. 2003, AJ, 125, 1784, doi: 10.1086/368392
- Hunter (2007) Hunter, J. D. 2007, Computing in science & engineering, 9, 90
- Inayoshi et al. (2016) Inayoshi, K., Haiman, Z., & Ostriker, J. P. 2016, MNRAS, 459, 3738, doi: 10.1093/mnras/stw836
- Inayoshi et al. (2022) Inayoshi, K., Nakatani, R., Toyouchi, D., et al. 2022, ApJ, 927, 237, doi: 10.3847/1538-4357/ac4751
- Ishibashi et al. (2017) Ishibashi, W., Banerji, M., & Fabian, A. C. 2017, MNRAS, 469, 1496, doi: 10.1093/mnras/stx921
- Kakkad et al. (2020) Kakkad, D., Mainieri, V., Vietri, G., et al. 2020, A&A, 642, A147, doi: 10.1051/0004-6361/202038551
- Kato et al. (2020) Kato, N., Matsuoka, Y., Onoue, M., et al. 2020, PASJ, 72, 84, doi: 10.1093/pasj/psaa074
- King et al. (2008) King, A. R., Pringle, J. E., & Hofmann, J. A. 2008, MNRAS, 385, 1621, doi: 10.1111/j.1365-2966.2008.12943.x
- Knigge et al. (2008) Knigge, C., Scaringi, S., Goad, M. R., & Cottis, C. E. 2008, MNRAS, 386, 1426, doi: 10.1111/j.1365-2966.2008.13081.x
- Kurk et al. (2007) Kurk, J. D., Walter, F., Fan, X., et al. 2007, ApJ, 669, 32, doi: 10.1086/521596
- Lai et al. (2022) Lai, S., Bian, F., Onken, C. A., et al. 2022, MNRAS, doi: 10.1093/mnras/stac1001
- Lamastra et al. (2010) Lamastra, A., Menci, N., Maiolino, R., Fiore, F., & Merloni, A. 2010, MNRAS, 405, 29, doi: 10.1111/j.1365-2966.2010.16439.x
- Laor & Brandt (2002) Laor, A., & Brandt, W. N. 2002, ApJ, 569, 641, doi: 10.1086/339476
- Maddox et al. (2008) Maddox, N., Hewett, P. C., Warren, S. J., & Croom, S. M. 2008, MNRAS, 386, 1605, doi: 10.1111/j.1365-2966.2008.13138.x
- Maiolino et al. (2004) Maiolino, R., Oliva, E., Ghinassi, F., et al. 2004, A&A, 420, 889, doi: 10.1051/0004-6361:20035704
- Marconi et al. (2004) Marconi, A., Risaliti, G., Gilli, R., et al. 2004, MNRAS, 351, 169, doi: 10.1111/j.1365-2966.2004.07765.x
- Mazzucchelli et al. (2017) Mazzucchelli, C., Bañados, E., Venemans, B. P., et al. 2017, ApJ, 849, 91, doi: 10.3847/1538-4357/aa9185
- McKinney et al. (2010) McKinney, W., et al. 2010, in Proceedings of the 9th Python in Science Conference, Vol. 445, Austin, TX, 51–56
- Menci et al. (2019) Menci, N., Fiore, F., Feruglio, C., et al. 2019, ApJ, 877, 74, doi: 10.3847/1538-4357/ab1a3a
- Meyer et al. (2019) Meyer, R. A., Bosman, S. E. I., & Ellis, R. S. 2019, MNRAS, 487, 3305, doi: 10.1093/mnras/stz1504
- Moe et al. (2009) Moe, M., Arav, N., Bautista, M. A., & Korista, K. T. 2009, ApJ, 706, 525, doi: 10.1088/0004-637X/706/1/525
- Murray & Chiang (1998) Murray, N., & Chiang, J. 1998, ApJ, 494, 125, doi: 10.1086/305183
- Nanni et al. (2017) Nanni, R., Vignali, C., Gilli, R., Moretti, A., & Brandt, W. N. 2017, A&A, 603, A128, doi: 10.1051/0004-6361/201730484
- Neeleman et al. (2021) Neeleman, M., Novak, M., Venemans, B. P., et al. 2021, ApJ, 911, 141, doi: 10.3847/1538-4357/abe70f
- Negri & Volonteri (2017) Negri, A., & Volonteri, M. 2017, MNRAS, 467, 3475, doi: 10.1093/mnras/stx362
- O’Leary et al. (2021) O’Leary, J. A., Moster, B. P., Naab, T., & Somerville, R. S. 2021, MNRAS, 501, 3215, doi: 10.1093/mnras/staa3746
- Onken et al. (2022) Onken, C. A., Wolf, C., Bian, F., et al. 2022, MNRAS, 511, 572, doi: 10.1093/mnras/stac051
- Pâris et al. (2018) Pâris, I., Petitjean, P., Aubourg, É., et al. 2018, A&A, 613, A51, doi: 10.1051/0004-6361/201732445
- Pensabene et al. (2020) Pensabene, A., Carniani, S., Perna, M., et al. 2020, A&A, 637, A84, doi: 10.1051/0004-6361/201936634
- Pezzulli et al. (2016) Pezzulli, E., Valiante, R., & Schneider, R. 2016, MNRAS, 458, 3047, doi: 10.1093/mnras/stw505
- Planck Collaboration et al. (2016) Planck Collaboration, Ade, P. A. R., Aghanim, N., et al. 2016, A&A, 594, A13, doi: 10.1051/0004-6361/201525830
- Proga & Kallman (2004) Proga, D., & Kallman, T. R. 2004, ApJ, 616, 688, doi: 10.1086/425117
- Proga et al. (2000) Proga, D., Stone, J. M., & Kallman, T. R. 2000, ApJ, 543, 686, doi: 10.1086/317154
- Reback et al. (2020) Reback, J., McKinney, W., jbrockmendel, et al. 2020, pandas-dev/pandas: Pandas 1.1.3, v1.1.3, Zenodo, doi: 10.5281/zenodo.4067057
- Reed et al. (2017) Reed, S. L., McMahon, R. G., Martini, P., et al. 2017, MNRAS, 468, 4702, doi: 10.1093/mnras/stx728
- Reichard et al. (2003) Reichard, T. A., Richards, G. T., Hall, P. B., et al. 2003, AJ, 126, 2594, doi: 10.1086/379293
- Richards et al. (2002) Richards, G. T., Fan, X., Newberg, H. J., et al. 2002, AJ, 123, 2945, doi: 10.1086/340187
- Richards et al. (2006) Richards, G. T., Lacy, M., Storrie-Lombardi, L. J., et al. 2006, ApJS, 166, 470, doi: 10.1086/506525
- Richards et al. (2011) Richards, G. T., Kruczek, N. E., Gallagher, S. C., et al. 2011, AJ, 141, 167, doi: 10.1088/0004-6256/141/5/167
- Rodríguez Hidalgo et al. (2020) Rodríguez Hidalgo, P., Khatri, A. M., Hall, P. B., et al. 2020, ApJ, 896, 151, doi: 10.3847/1538-4357/ab9198
- Ross & Cross (2020) Ross, N. P., & Cross, N. J. G. 2020, MNRAS, 494, 789, doi: 10.1093/mnras/staa544
- Runnoe et al. (2012) Runnoe, J. C., Brotherton, M. S., & Shang, Z. 2012, MNRAS, 426, 2677, doi: 10.1111/j.1365-2966.2012.21644.x
- Sadowski & Gaspari (2017) Sadowski, A., & Gaspari, M. 2017, MNRAS, 468, 1398, doi: 10.1093/mnras/stx543
- Schindler et al. (2019) Schindler, J.-T., Fan, X., McGreer, I. D., et al. 2019, ApJ, 871, 258, doi: 10.3847/1538-4357/aaf86c
- Schindler et al. (2020) Schindler, J.-T., Farina, E. P., Bañados, E., et al. 2020, ApJ, 905, 51, doi: 10.3847/1538-4357/abc2d7
- Schneider et al. (2007) Schneider, D. P., Hall, P. B., Richards, G. T., et al. 2007, AJ, 134, 102, doi: 10.1086/518474
- Shen et al. (2011) Shen, Y., Richards, G. T., Strauss, M. A., et al. 2011, ApJS, 194, 45, doi: 10.1088/0067-0049/194/2/45
- Shen et al. (2019) Shen, Y., Wu, J., Jiang, L., et al. 2019, ApJ, 873, 35, doi: 10.3847/1538-4357/ab03d9
- Skrutskie et al. (2006) Skrutskie, M. F., Cutri, R. M., Stiening, R., et al. 2006, AJ, 131, 1163, doi: 10.1086/498708
- Smette et al. (2015) Smette, A., Sana, H., Noll, S., et al. 2015, A&A, 576, A77, doi: 10.1051/0004-6361/201423932
- Torrey et al. (2020) Torrey, P., Hopkins, P. F., Faucher-Giguère, C.-A., et al. 2020, MNRAS, 497, 5292, doi: 10.1093/mnras/staa2222
- Trakhtenbrot (2021) Trakhtenbrot, B. 2021, in Nuclear Activity in Galaxies Across Cosmic Time, ed. M. Pović, P. Marziani, J. Masegosa, H. Netzer, S. H. Negu, & S. B. Tessema, Vol. 356, 261–275, doi: 10.1017/S1743921320003087
- Tripodi et al. (2022) Tripodi, R., Feruglio, C., Fiore, F., et al. 2022, arXiv e-prints, arXiv:2207.03314. https://arxiv.org/abs/2207.03314
- Trump et al. (2006) Trump, J. R., Hall, P. B., Reichard, T. A., et al. 2006, ApJS, 165, 1, doi: 10.1086/503834
- Turnshek et al. (1988) Turnshek, D. A., Foltz, C. B., Grillmair, C. J., & Weymann, R. J. 1988, ApJ, 325, 651, doi: 10.1086/166036
- Urrutia et al. (2008) Urrutia, T., Lacy, M., & Becker, R. H. 2008, ApJ, 674, 80, doi: 10.1086/523959
- van der Vlugt & Costa (2019) van der Vlugt, D., & Costa, T. 2019, MNRAS, 490, 4918, doi: 10.1093/mnras/stz2944
- Van Rossum & Drake (2009) Van Rossum, G., & Drake, F. L. 2009, Python 3 Reference Manual (Scotts Valley, CA: CreateSpace)
- Vestergaard & Osmer (2009) Vestergaard, M., & Osmer, P. S. 2009, ApJ, 699, 800, doi: 10.1088/0004-637X/699/1/800
- Vietri et al. (2018) Vietri, G., Piconcelli, E., Bischetti, M., et al. 2018, A&A, 617, A81, doi: 10.1051/0004-6361/201732335
- Vietri et al. (2022) Vietri, G., Misawa, T., Piconcelli, E., et al. 2022, arXiv e-prints, arXiv:2205.06832. https://arxiv.org/abs/2205.06832
- Vito et al. (2019) Vito, F., Brandt, W. N., Bauer, F. E., et al. 2019, A&A, 630, A118, doi: 10.1051/0004-6361/201936217
- Volonteri & Rees (2006) Volonteri, M., & Rees, M. J. 2006, ApJ, 650, 669, doi: 10.1086/507444
- Wang et al. (2018) Wang, F., Yang, J., Fan, X., et al. 2018, ApJ, 869, L9, doi: 10.3847/2041-8213/aaf1d2
- Wang et al. (2019) —. 2019, ApJ, 884, 30, doi: 10.3847/1538-4357/ab2be5
- Wang et al. (2021a) —. 2021a, ApJ, 907, L1, doi: 10.3847/2041-8213/abd8c6
- Wang et al. (2021b) Wang, F., Fan, X., Yang, J., et al. 2021b, ApJ, 908, 53, doi: 10.3847/1538-4357/abcc5e
- Warren et al. (2007) Warren, S. J., Hambly, N. C., Dye, S., et al. 2007, MNRAS, 375, 213, doi: 10.1111/j.1365-2966.2006.11284.x
- Wethers et al. (2020) Wethers, C. F., Kotilainen, J., Schramm, M., & Schulze, A. 2020, MNRAS, 498, 1469, doi: 10.1093/mnras/staa2017
- Weymann et al. (1991) Weymann, R. J., Morris, S. L., Foltz, C. B., & Hewett, P. C. 1991, ApJ, 373, 23, doi: 10.1086/170020
- Wolf et al. (2020) Wolf, C., Hon, W. J., Bian, F., et al. 2020, MNRAS, 491, 1970, doi: 10.1093/mnras/stz2955
- Wright et al. (2010) Wright, E. L., Eisenhardt, P. R. M., Mainzer, A. K., et al. 2010, AJ, 140, 1868, doi: 10.1088/0004-6256/140/6/1868
- Xu et al. (2020) Xu, X., Zakamska, N. L., Arav, N., Miller, T., & Benn, C. 2020, MNRAS, 495, 305, doi: 10.1093/mnras/staa1142
- Yang et al. (2021) Yang, J., Wang, F., Fan, X., et al. 2021, ApJ, 923, 262, doi: 10.3847/1538-4357/ac2b32
- Zakamska et al. (2016) Zakamska, N. L., Hamann, F., Pâris, I., et al. 2016, MNRAS, 459, 3144, doi: 10.1093/mnras/stw718
- Zeilig-Hess et al. (2020) Zeilig-Hess, M., Levinson, A., Xu, X., & Arav, N. 2020, MNRAS, 491, 4325, doi: 10.1093/mnras/stz3352
- Zhang et al. (2014) Zhang, S., Wang, H., Wang, T., et al. 2014, ApJ, 786, 42, doi: 10.1088/0004-637X/786/1/42
- Zhu et al. (2022) Zhu, Y., Becker, G. D., Bosman, S. E. I., et al. 2022, ApJ, 932, 76, doi: 10.3847/1538-4357/ac6e60
- Zhu et al. (2021) Zhu, Y. L., Lund, K. A., Barnes, J., et al. 2021, ApJ, 906, 94, doi: 10.3847/1538-4357/abc69e
- Zubovas & King (2012) Zubovas, K., & King, A. 2012, ApJ, 745, L34, doi: 10.1088/2041-8205/745/2/L34
- Zubovas & King (2013) —. 2013, ApJ, 769, 51, doi: 10.1088/0004-637X/769/1/51
- Zubovas & King (2021) —. 2021, MNRAS, 501, 4289, doi: 10.1093/mnras/stab004