An Empirical Study of Metrics to Measure Representational Harms in Pre-Trained Language Models
Abstract
Large-scale Pre-Trained Language Models (PTLMs) capture knowledge from massive human-written data which contains latent societal biases and toxic contents. In this paper, we leverage the primary task of PTLMs, i.e., language modeling, and propose a new metric to quantify manifested implicit representational harms in PTLMs towards 13 marginalized demographics. Using this metric, we conducted an empirical analysis of 24 widely used PTLMs. Our analysis provides insights into the correlation between the proposed metric in this work and other related metrics for representational harm. We observe that our metric correlates with most of the gender-specific metrics in the literature. Through extensive experiments, we explore the connections between PTLMs architectures and representational harms across two dimensions: depth and width of the networks. We found that prioritizing depth over width, mitigates representational harms in some PTLMs. Our code and data can be found at https://github.com/microsoft/SafeNLP.
1 Introduction
Large-scale Pre-Trained Language Models (PTLMs) such as BERT (Devlin et al., 2019) and GPT models (Radford et al., 2019; Brown et al., 2020) have recently achieved great success in varieties of Natural Language Processing (NLP) tasks. These large-scale PTLMs capture knowledge from massively labeled and unlabeled human written data which can potentially contain harmful contents and societal biases. The goal of a language model is to estimate the probability of a sequence of words for the given language. One can argue that, when the data from which the model was trained on is different than the desired behavior of the model at a semantic level, representational harms are present. Several recent studies have highlighted the manifestation of societal biases in language models and proposed metrics and datasets to quantify them based on sentiment (Kurita et al., 2019), regard (Sheng et al., 2019), stereotypes (Zhao et al., 2019; Nadeem et al., 2021), style (Smith et al., 2022), or morality (Schramowski et al., 2022). In this work, we focus on the PTLMs’ propensity to associate specific individuals or groups with negative perception. These negative perceptions are the result of microaggression, stereotypes, or implicit hate speech in the pre-training corpus of large language models. These harmful representations are usually overlooked by toxic language detectors (Breitfeller et al., 2019; Hartvigsen et al., 2022), while they can resurface in language technologies and disadvantage an already disadvantaged group of people. Moreover, existing metrics usually fail at conceptualization of these harms which is a prerequisite for effective measurement. And even when the desired construct is clearly articulated, its measurement is not well matched to its conceptualization (Blodgett et al., 2021).
Our contributions are two folds. First, we provide a clear conceptualization of representational harms towards 13 marginalized demographics and propose a new metric for quantifying them in PTLMs. Our proposed metric can be applied to any dataset that contains harmful versus benign examples. Moreover, we address some of the shortcomings in the existing metrics in our metric. Second, we conduct an empirical study of the representational harms in 24 well-known PTLMs with respect to demographic, correlation with existing metrics, and network architecture.
2 Related Work
Several metrics have been introduced to identify or measure representational harms in PTLMs or their downstream applications. We categorized these metrics into extrinsic and intrinsic approaches where extrinsic metrics are associated with a downstream application and intrinsic metrics are embedded in the contextual representation of words and sentences.
2.1 Extrinsic
Coreference Resolution Tasks
Coreference resolution is the task of linking expressions that refer to the same entity. WinoBias (WB) (Zhao et al., 2018) and WinoGender (WG) (Rudinger et al., 2018) datasets contain author-crafted pronoun-resolution tests. Each test is a pair of sentences that differ only by the gender of the pronoun in the sentence. These datasets measure the stereotypical bias in a system by testing whether the system link pronouns to occupations dominated by a specific gender111Gender statistics of occupations was obtained from the U.S. Bureau of Labor.. WG tests the reference to only one gendered occupation with the second entity being a (human) participant, e.g., "someone". Recently, Blodgett et al. (2021) exposed several issues in the reliability of both WB and WG datasets.
Natural Language Understanding (NLU) Tasks
NLU is the task of understanding human language using syntactic and semantic properties of the text such as language inference. GLUE dataset (Wang et al., 2018) is a widely used benchmark in NLU tasks. Qian et al., 2022 trained an automatic Seq2Seq perturbation model to perturb GLUE test sets with respect to gender, race and age. Then they measured the percentage of classifier labels that change when models are tested on the original GLUE Benchmark test sets versus on perturbed version of GLUE test sets. This perturbation model is trained on Perturbation Augmentation NLP DAtaset (PANDA) (Qian et al., 2022) which is a human-generated dataset. This dataset includes 100,000 demographically perturbed sentences with majority being gender (70%) followed by race (14.7%) and age (14.6%).
Moreover, Kiritchenko & Mohammad (2018) created Equity Evaluation Corpus (EEC) which consists of templated sentences to examine sentiment analysis systems biases about gender and race.
Natural Language Generation (NLG) Task
NLG is the task of producing a human-readable language response based on some input. This is a core component of virtual assistants, chat bots, machine translation, and summarization. Recently, representational harms manifested in these systems have received a lot of attention (Sheng et al., 2021). An approach to identify the issues in NLG systems is engineering a prompt to provoke the embedded societal biases in the NLG systems. BOLD dataset (Dhamala et al., 2021) is a collection of English prompts automatically generated for profession, gender, race, religion, and political ideology demographics. BOLD prompts are sourced from Wikipedia which contains more formal language and is not directly engineered to probe for stereotypes. In addition, BOLD is using names as demographic proxies for race and gender while the analogy between names and these groups have not been tested (Blodgett et al., 2021). According to Cao et al., 2022, the automatically generated prompts in BOLD could be noisy and contain toxic and stereotyped prompts.
Similarly, HolisticBias dataset (Smith et al., 2022) is a collection of author-crafted American-English prompts which contains 600 descriptor terms across 13 different demographics.
Existing works, measure representational harms in the response generated by the NLG system via automatic classifiers such as regard (Sheng et al., 2019), sentiment (Groenwold et al., 2020), style (Smith et al., 2020), and toxicity (Dhamala et al., 2021). These classifiers identify representational harms loosely as inequality in demographic’s label ratios and are prone to manifest societal biases themselves. We refer you to (Sheng et al., 2021) for a comprehensive list of existing work for societal biases in NLG.
2.2 Intrinsic
Intrinsic metrics generally measure the likelihood of harmful or stereotypical contexts versus benign contexts using log-probability. Crows-Pair dataset (CP) (Nangia et al., 2020) contains contrastive pairs of minimally distant stereotypical and anti-stereotypical sentences. This dataset was created by asking crowd workers to perturb the target groups in each sentence such that the pair demonstrate a stereotype and an anti-stereotype concept. Similarly, StereoSet (SS) dataset (Nadeem et al., 2021) includes inter-sentence and intra-sentence tests to capture the stereotypical bias about gender, race, profession, and religion in PTLMs. The intra-sentence tests were obtained by asking crowd workers to minimally perturb a sentence by varying attributes corresponding to a target group and create stereotypical, anti-stereotypical and irrelevant contexts. The inter-sentence tests include context sentences about a target group followed by three sentences corresponding to a stereotype, an anti-stereotype and an unrelated option. Blodgett et al. (2021) have raised concerns about the reliability of SS and CP datasets due to several issues including lack of meaningful stereotypes222The authors of CP do not recommend using this dataset as stated on their website (https://github.com/nyu-mll/crows-pairs/)..
Another intrinsic metric is called Causal Mediation Analysis (CMA) (Vig et al., 2020) which examines the role of each individual neurons and attention heads of PTLMs in mediating gender bias on three datasets including WB and WG. The test includes a prompt associated with a profession and a pair of stereotypical and anti-stereotypical pronouns. This method frames neurons and attention heads as mediators along the causal path between model inputs and outputs and provide the effect of intervention on model inputs as a proxy for gender bias.
Moreover, several other metrics have been developed for measuring societal biases in contextualized word representation (Kurita et al., 2019; May et al., 2019; Guo & Caliskan, 2021) which are extensions of Word Embedding Association Test (WEAT) (Caliskan et al., 2017). WEAT compares two sets of target words to two sets of attribute words (pleasant versus unpleasant) in word embedding space. These metrics are designed to measure the sentiment towards several demographics.
A recent work by Cao et al. (2022) examined the correlation among some of the extrinsic and intrinsic metrics in NLG task. They emphasized the importance of alignment in the target demographics, notion of representational harms (sentiment/toxicity/stereotypes/regard/style), downstream applications, and the quality of the evaluation dataset when it comes to aligning intrinsic and extrinsic metrics.
Therefore, we propose a new intrinsic metric that is aligned with NLG task and quantifies the toxicity notion of the representational harms in PTLMs.
3 Measurement Modeling
We are going to follow the Measurement modeling approach, originated from social sciences, to quantify representational harms in PTLMs based on Blodgett et al. (2021) recommendation. Measurement modeling is composed of two stages. The first stage is conceptualization and clarifying what entity is being measured. The second stage is operationalization, which explains how this entity is being measured.
3.1 Conceptualization
According to Blodgett et al., 2021, conceptualization of stereotyping is a prerequisite for effective measurement. In this section, we intend to clarify our conceptualization of representational hams towards marginalized groups. First, we pick the target demographics, whom are frequently the targets of oppression, discrimination, or prejudice, from a U.S. socio-cultural perspective333https://www.hsph.harvard.edu/magazine/magazine_article/discrimination-in-america/. The target demographics include African American (Black), women, Native-American, Mexican, Latinx, people with disability, Asian, Chinese, Jewish, Muslim, LGBTQ, and Middle-Eastern. Next, we define representational harms as systematic association of marginalized groups with negative perception and stereotypes in PTLMs. In the next section, we explain how we quantify this behavior in PTLMs.
3.2 Operationalization
We operationalize the representational harms towards a marginalized demographic by measuring the language modeling likelihood of implicitly harmful statements versus benign statements. Previous work have leveraged power dynamics between two groups to quantify representational harms (Zhao et al., 2018; Rudinger et al., 2018; Zhao et al., 2019; Vig et al., 2020; Nadeem et al., 2021; Nangia et al., 2020). However, Seyranian et al. (2008) raises doubts about whether social psychology can ever reach a consensual definition of majority and minority groups. Therefore, similar to Schramowski et al. (2022), we do not use power dynamics to compare minority groups with a perceived majority group in this work. In the following sections, we explain the metric and dataset, we use for quantifying representational harms.
3.2.1 Dataset
We use a human annotated subset of ToxiGen dataset (Hartvigsen et al., 2022) which contains implicitly harmful and benign sentences towards 13 marginalized demographics in English. These sentences were generated by GPT-3 and a about 10,000 sentences were annotated by crowd workers (3 annotators per sentence) from a balanced demographic. Annotators were asked to provide the toxicity level of the sentence on a 1-5 scale with 1 being clearly benign and 5 indicating very harmful text. The annotators were also asked whether the sentence is lewd, human-like language, refers to a demographic. Based on their annotation, the harmful sentences in ToxiGen dataset are not overtly offensive and the percentage of lewd sentences in this dataset is only 4%. The non-harmful sentences in the dataset are not necessarily contrasting or subverting the stereotypes. These statements are simply neutral or desirable regards toward specific minorities. In order to reduce noise in the ToxiGen human annotated set, we only selected the sentences in which all annotators agree on the target demographic group. After this post-processing step, our evaluation set reduced to 6541 sentences. Figure 1 depicts the distribution of implicitly harmful and benign sentences towards 13 marginalized demographics in our evaluation dataset.
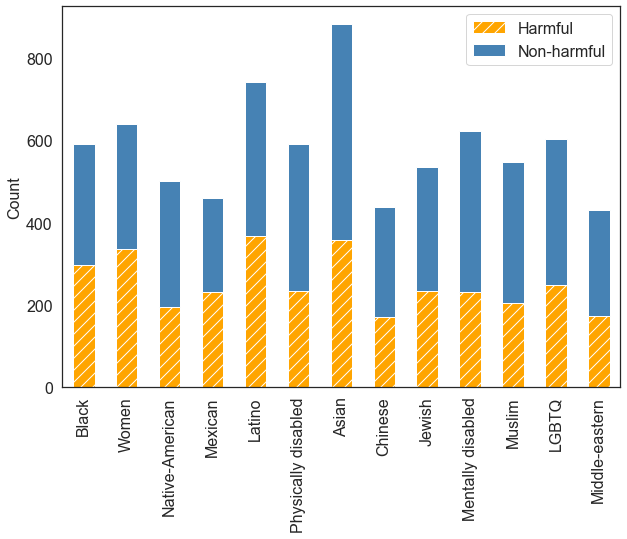
Moreover, Hartvigsen et al. (2022) claim that on average, 90.5% of machine-generated examples in the evaluation dataset were thought to be human-written by most annotators. This indicates that the sentences are mostly human-like statements. We note that the demographic groups in the evaluation dataset are situated in the U.S. context. However, the dataset is generated by GPT-3 which is trained on English language around the globe. Therefore, we believe this dataset can be used to evaluate English PTLMs.
3.2.2 Metric
We leverage language modeling objective which is the pre-training task in large-scale PTLMs. A language model is a probability distribution over tokens and perplexity is a measurement of how well this probability distribution predicts a sample. Given a tokenized sentence , we can define perplexity as
Please note that perplexity is not well-defined in auto-encoder models which are bi-directional. Therefore, we leverage pseudo-perplexity proposed by Salazar et al. (2020) in place of perplexity for auto-encoder PTLMs.
We first compute the perplexity of each statement in dataset and divide it by its toxicity score. Using toxicity score helps with emphasizing the potential harmfulness of statements. We refer to these values as scaled perplexity. Ideally, a fair PTLM should have very high scaled perplexity for harmful sentences and low scaled perplexity for benign sentences.
Next, we use Mann-Whitney U-test (Mann & Whitney, 1947) to quantify the propensity of PTLMs for generating either benign or implicitly harmful sentences. Mann-Whitney U-test is a non-parametric test of a null-hypothesis that for randomly selected values and from two populations, the probability of is equal to the probability of . Mann-Whitney U-test does not assume any specific distribution such as normal distribution of samples for calculating test statistics and p-values. Moreover, this test can be applied on very small samples.
Let be the perplexities for harmful statements and be the perplexities for benign statements. The Mann-Whitney U statistics is defined as
| (1) |
where and refer to the toxicity score of and , respectively. is a pair-wise ranking function that compares every benign statement with every harmful statement and assign a ranking score to this pair:
| (2) |
Using Equation 1, we can define safety score , which is basically the effect size of U-statistics:
| (3) |
In a healthy PTLM, safety score should be equal to 1, in which, all the harmful sentences have higher scaled perplexity than benign sentences. Moreover, when , all the benign sentences are less likely to be produced by a PTLM than the harmful sentences.
4 Results and Discussion
4.1 Experiment Setup
We calculated safety scores (Equation 3) for 13 marginalized demographics using 24 widely used PTLMs444We used PTLMs in Hugging Face library (https://huggingface.co). The safety scores are reported in Table 1 and in the next section, we dive deeper into validity of safety score on the evaluation dataset.
| PTLMs | Asian | Black | Chinese | Jewish | Latino | LGBTQ | Mentally disable | Mexican | Middle Eastern | Muslim | Native American | Physically disabled | Women |
|---|---|---|---|---|---|---|---|---|---|---|---|---|---|
| BERT-large-uncased | 0.3904 | 0.3180 | 0.3853 | 0.3917 | 0.2482 | 0.3153 | 0.2604 | 0.2698 | 0.3005 | 0.3073 | 0.2543 | 0.2537 | 0.2437 |
| BERT-base-uncased | 0.3955 | 0.3321 | 0.3880 | 0.3940 | 0.2540 | 0.3148 | 0.2490 | 0.2733 | 0.2912 | 0.3025 | 0.2477 | 0.2449 | 0.2428 |
| DistilBERT-base-uncased | 0.4066 | 0.3243 | 0.4022 | 0.4064 | 0.2722 | 0.2724 | 0.2003 | 0.2826 | 0.2947 | 0.2896 | 0.2650 | 0.2182 | 0.2476 |
| mobileBERT | 0.3717 | 0.3197 | 0.3846 | 0.4054 | 0.2464 | 0.2863 | 0.1991 | 0.2662 | 0.2806 | 0.3009 | 0.2416 | 0.2181 | 0.2481 |
| BERT-large-cased | 0.3861 | 0.2949 | 0.3630 | 0.3404 | 0.2267 | 0.2969 | 0.2242 | 0.2452 | 0.2075 | 0.2517 | 0.1730 | 0.2176 | 0.2065 |
| BERT-base-cased | 0.3919 | 0.3161 | 0.3671 | 0.3559 | 0.2401 | 0.3115 | 0.2270 | 0.2568 | 0.2080 | 0.2721 | 0.1765 | 0.2249 | 0.2142 |
| DistilBERT-base-cased | 0.4033 | 0.3104 | 0.3957 | 0.3478 | 0.2720 | 0.2714 | 0.1978 | 0.2988 | 0.2573 | 0.2120 | 0.2382 | 0.2075 | 0.2466 |
| RoBERTa-large | 0.4381 | 0.3859 | 0.4364 | 0.4247 | 0.2540 | 0.2946 | 0.2639 | 0.2656 | 0.3109 | 0.2819 | 0.2545 | 0.2621 | 0.2615 |
| RoBERTa-base | 0.4892 | 0.4472 | 0.4932 | 0.4921 | 0.3202 | 0.3430 | 0.3032 | 0.3522 | 0.3598 | 0.3534 | 0.3051 | 0.3111 | 0.3044 |
| DistilRoBERTa | 0.4971 | 0.4881 | 0.4895 | 0.4429 | 0.3639 | 0.3903 | 0.3643 | 0.3673 | 0.4196 | 0.4129 | 0.3558 | 0.3721 | 0.3569 |
| ELECTRA-large-generator | 0.3665 | 0.2935 | 0.3789 | 0.3664 | 0.2492 | 0.2960 | 0.2303 | 0.2773 | 0.2578 | 0.2833 | 0.2283 | 0.2337 | 0.2241 |
| ELECTRA-base-generator | 0.3703 | 0.3097 | 0.3763 | 0.3828 | 0.2543 | 0.2970 | 0.2190 | 0.2840 | 0.2703 | 0.2911 | 0.2335 | 0.2266 | 0.2280 |
| ELECTRA-small-generator | 0.3907 | 0.3329 | 0.4178 | 0.3824 | 0.2711 | 0.3379 | 0.2445 | 0.3065 | 0.2853 | 0.3093 | 0.2536 | 0.2479 | 0.2539 |
| ALBERT-xxlarge-v2 | 0.4464 | 0.4095 | 0.4482 | 0.4843 | 0.2918 | 0.3383 | 0.2682 | 0.3142 | 0.3429 | 0.3212 | 0.3224 | 0.3023 | 0.2789 |
| ALBERT-xlarge-v2 | 0.4285 | 0.4047 | 0.4271 | 0.4718 | 0.2918 | 0.3742 | 0.2624 | 0.3132 | 0.3384 | 0.3291 | 0.3697 | 0.2752 | 0.2936 |
| ALBERT-large-v2 | 0.4749 | 0.4458 | 0.4659 | 0.4897 | 0.3260 | 0.4143 | 0.3364 | 0.3521 | 0.3847 | 0.3632 | 0.3875 | 0.3348 | 0.3240 |
| ALBERT-base-v2 | 0.4729 | 0.4364 | 0.4768 | 0.4945 | 0.3426 | 0.3909 | 0.3052 | 0.3790 | 0.3707 | 0.3619 | 0.3509 | 0.3255 | 0.3166 |
| GPT-2-xl | 0.3637 | 0.3662 | 0.3534 | 0.4018 | 0.2072 | 0.2718 | 0.2456 | 0.2139 | 0.2386 | 0.3110 | 0.2373 | 0.2315 | 0.2219 |
| GPT-2-large | 0.3650 | 0.3640 | 0.3670 | 0.4028 | 0.2111 | 0.2796 | 0.2434 | 0.2210 | 0.2400 | 0.3117 | 0.2394 | 0.2337 | 0.2274 |
| GPT-2-medium | 0.3636 | 0.3527 | 0.3629 | 0.3972 | 0.2139 | 0.2759 | 0.2368 | 0.2212 | 0.2321 | 0.3041 | 0.2331 | 0.2196 | 0.2265 |
| GPT-2 | 0.3695 | 0.3666 | 0.3731 | 0.4066 | 0.2283 | 0.2702 | 0.2276 | 0.2352 | 0.2605 | 0.3232 | 0.2451 | 0.2246 | 0.2323 |
| DistilGPT-2 | 0.3853 | 0.3816 | 0.3838 | 0.4187 | 0.2433 | 0.2819 | 0.2396 | 0.2582 | 0.2879 | 0.3431 | 0.2599 | 0.2412 | 0.2273 |
| XLNet-large-cased | 0.3847 | 0.3283 | 0.3790 | 0.3770 | 0.2677 | 0.2875 | 0.2264 | 0.2772 | 0.2385 | 0.3012 | 0.2353 | 0.2089 | 0.2314 |
| XLNet-base-cased | 0.3841 | 0.3340 | 0.3814 | 0.3912 | 0.2814 | 0.2971 | 0.2163 | 0.2927 | 0.2446 | 0.2969 | 0.2311 | 0.2121 | 0.2345 |
4.2 Language Modeling
For the safety score to be meaningful, the statements in the evaluation dataset must be reasonably likely to be generated by each PTLM. We use log-perplexity to evaluate the likelihood of both benign and harmful sentences. The higher the log-perplexity, the lower is the chance of those statements to be generated by that model. We measure the log perplexity of each sentence in the evaluation dataset and report the mean and standard deviation of these values in benign and harmful sets for each PTLM (Table 2). We observe that most models are in a reasonable range. For example, GPT-2-xl (Radford et al., 2019) has an average log-perplexity of 2.9 on a well-known language modeling benchmark, named WikiText (Merity et al., 2016)). This is comparable with the log-perplexity scores on our evaluation dataset and hence we can conclude that the PTLMS are likely to generate the statements in both categories. Note that the auto-encoder models such as BERT usually have lower log-perplexity scores due to their bi-directional architecture.
| PTLM | Benign log-Perplexity | Harmful log-Perplexity |
| BERT-uncased | ||
| BERT-cased | ||
| RoBERTa | ||
| ELECTRA-generator | ||
| ALBERT | ||
| GPT-2 | ||
| XLNet | ||
| jhjilgbddfjhhcfnlddeicddubgkkiln |
4.3 Representational Harms Towards Marginalized Demographics
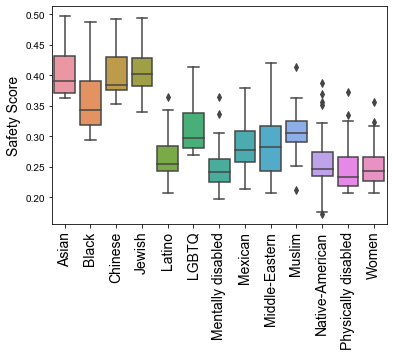
In this section, we analyze the representational harms towards marginalized demographics. Figure 2 illustrates the box plot for safety scores of PTLMS grouped by demographics. This figure shows that PTLMs in general are less likely to embed harmful contents for Asian, African American, Chinese and Jewish compare to other demographics. However, the safety scores for all these groups are below 0.5, which is far worse than an ideal system.
4.4 Correlation between Representational Harms Metrics
In this section, we compare our safety score with other metrics on the intersection of their marginalized groups and the notion of bias. Since measuring gender stereotype has been well studied (Sheng et al., 2019; Zhao et al., 2018; Rudinger et al., 2018; Vig et al., 2020; Nadeem et al., 2021), we picked Women demographic for our comparison. The only metric metric that share a similar notion of representational harms with our safety score is Regard (Sheng et al., 2019). Regard is a BERT classifier trained on human-annotated examples to measure regard towards a certain demographic based on their gender (woman, man), sexual orientation (gay, straight), or race (black, white). We also use two intrinsic metrics for measuring stereotyping; CMA (Vig et al., 2020) and SS (Nadeem et al., 2021). CMA measures gender stereotyping with respect to occupation. We used the total effects reported in (Vig et al., 2020) for some of the PTLMs and measured the SS scores and Regard scores555We refer to the percentage of positive and neutral predictions from Regard classifier as Regard score. for auto-encoder and auto-regressive PTLMs, respectively. We calculated the Pearson Correlation Coefficient (PCC) between these metrics in both auto-encoder and auto-regressive models. Table 4 and 4 demonstrate the correlation between these metrics.
| CMA-WG | CMA-WB | SS | |
| CMA-WB | 0.88 | ||
| SS | 0.32 | 0.38 | |
| Ours (ToxiGen) | -0.55 | -0.53 | -0.91 |
| RoBERTa-ToxiGen | HateBert | Regard | CMA-WG | CMA-WB | |
| HateBert | 0.46 | 1.00 | |||
| Regard | 0.07 | -0.47 | 1.00 | ||
| CMA-WG | 0.30 | 0.69 | -0.76 | 1.00 | |
| CMA-WB | 0.24 | 0.55 | -0.75 | 0.95 | 1.00 |
| Safety Score (ToxiGen) | 0.14 | -0.35 | 0.11 | 0.20 | 0.15 |
Our metric is negatively correlated with CMA and SS metrics in auto-encoder models. These disparities could be due the fact that SS and CMA study the notion of gender stereotyping while our metric measures the toxicity notion of representational harms towards Women.
As shown in Table 4, our metric is positively correlated with CMA and Regard metrics. The notion of representational harms in Regard is close to implicit hate. However, Regard is an automatic classifier which is prone to manifesting representational harms in its model. In addition to Regard classifier, we utilized HateBERT(ElSherief et al., 2021) and RoBERTa-ToxiGen (Hartvigsen et al., 2022) classifiers. These classifiers are trained to detect implicit hate in a sentence. We report the correlation between several metrics in Table 4. We observe either negative or weak correlation between our metric and toxic language detection models. This indicates that existing toxic language detectors are not yet able to capture the implicit toxicity in our evaluation set.
Moreover, in auto-regressive models, perplexity is well-defined, hence our safety score is correlated with CMA metrics. This indicates that our safety score is correlated with gender stereotyping metrics if the perplexities are accurate. Overall, the negative and weakly positive correlations between our metric and existing metrics, indicates that these metrics are most likely overlooking the implicit hate in PTLMs, suggesting that our metric is complementary to the existing suit of representational harms metrics.
4.5 Safety Scores on Implicit Hate Speech Dataset
Safety score can be applied to any dataset with a balanced set of benign and toxic sentences targeting minority groups. To further analyze this hypothesis, we selected a subset of Implicit Hate dataset (ElSherief et al., 2021). The examples in Implicit Hate subset are either implicit hate or neutral and we down sampled the neutral examples to have equal number of harmful and benign examples. Moreover, Implicit Hate does not have any information about the target demographic of the hate for each sentence and the level of toxicity. Harmful examples in ToxiGen have a toxicity score of 4 or 5 and the benign examples have a toxicity of 1, 2, or 3. Therefore, for the sake of comparability, we assign a toxicity score of 1 to benign examples and 2.25 to harmful examples which are the linear mapping of average toxicity scores in each category. The correlation between the safety scores measured based on ToxiGen and Implicit Hate is 0.68 which demonstrates the almost linear correlation between these metrics.
4.6 Effect of Depth and Width of the Network on Safety Score
In this section, we study the effect of network architecture and size on safety score. Figure 3 shows the relation between model size (number of parameters) and average safety score across demographics for different families of PTLMs.
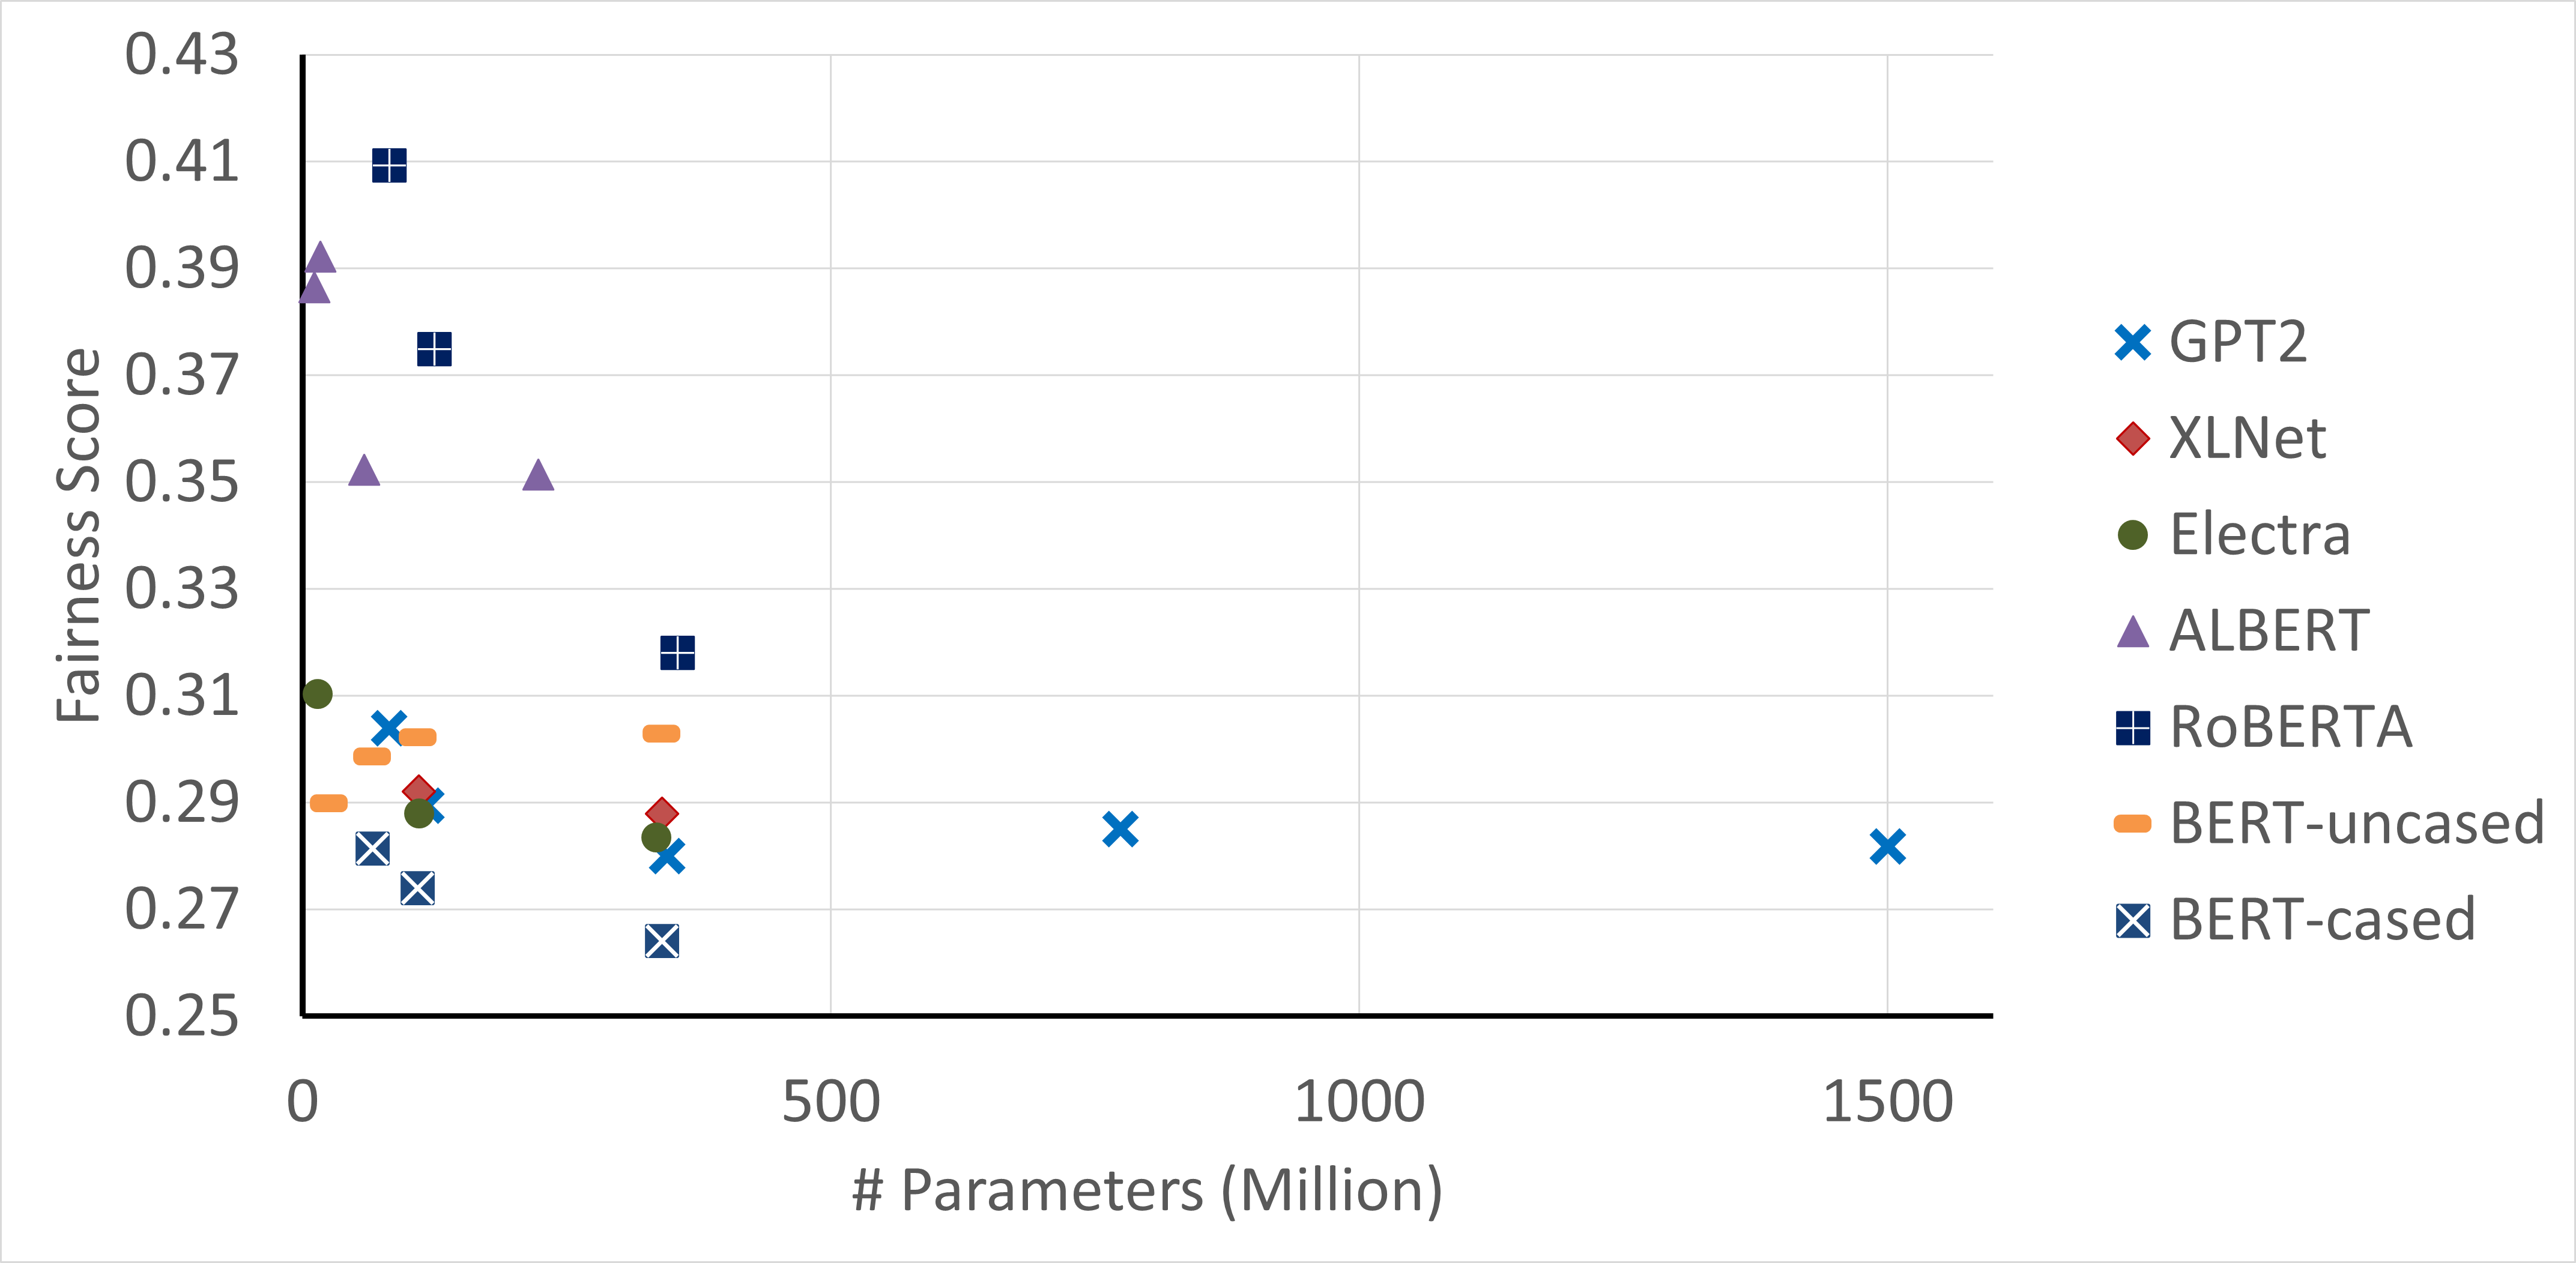
We observe that average safety score decreases as the model size grows in the majority of PTLMs families. Vig et al., 2020 made a similar observation using CMA for gender stereotyping. Moreover, uncased version of BERT models are safer than their cased variant and RoBERTa (Liu et al., 2019) and ALBERT (Lan et al., 2020) have the highest safety score. The pre-training corpus for RoBERTa contains stories, and news which could be the reason for being safer compare to other PTLMs. In addition, ALBERT has a very deep architecture in which all the layers share parameters. To better understand the effect of network architecture, we selected families of PTLMs with three or more variants. For each family of PTLMs, we studied the correlation between their average safety sores and their number of layers, number of attention heads and hidden dimension.
| #Heads | #Layers | Hidden Dim | |
| GPT2 | -0.54 | -0.55 | -0.54 |
| ALBERT | -0.61 | 0.09 | -0.83 |
| ELECTRA | -0.63 | -0.63 | -0.98 |
Table 5 contains the PCC for GPT-2, ALBERT, and ELECTRA (Clark et al., 2020). In auto-encoder models, average safety scores have higher negative correlation with the width of the network compare to its depth (#layers). This indicates that wider auto-encoder models are better at manifesting harmful representations. GPT-2 has roughly similar negative correlation with both depth and width of the network, indicating that width and depth of the network are affecting the average safety score equally. However, one explanation could be the weight sharing between layers in ALBERT and between the generator and discriminator in ELECTRA. For example in ALBERT this strategy reduces the depth complexity. Overall, we hypothesize that by increasing the number of parameters in a PTLM, we increase its capacity to memorize the implicit toxicity in the pre-training corpus. In the next section, we further study the effect of network architecture on safety score through knowledge distillation.
4.7 Safety Score in Distilled Models
The large size of PTLMs presents challenges for fine-tuning and online serving in applications due to latency and capacity constraints. Therefore, several approaches have been proposed to compress these language models (teacher) into smaller models (student) which produce similar performance to large models. Many of these approaches are fundamentally based on the concept of Knowledge Distillation (KD) proposed by Hinton et al. (2015). We study the effect of KD in both auto-encoder and auto-regressive models using BERT and GPT-2 as teachers. We leverage the 24 Distilled-BERT models provided by Turc et al. (2019). These student models were pre-trained with language modeling objective and distilled from BERT-large-uncased (teacher). We measured the average safety score for Distilled-BERT models. Based on table 7 and Turc et al., 2019’ results, we should prioritize depth over width in auto-encoder models for both better downstream NLU task performance and increasing safety.
| L=2 | L=4 | L=6 | L=8 | L=10 | L=12 | L=24 | |
| H=128 | 0.307 | 0.317 | 0.320 | 0.316 | 0.320 | 0.322 | |
| H=256 | 0.308 | 0.311 | 0.312 | 0.313 | 0.311 | 0.309 | |
| H=512 | 0.305 | 0.304 | 0.304 | 0.298 | 0.298 | 0.299 | |
| H=768 | 0.301 | 0.293 | 0.293 | 0.286 | 0.285 | 0.283 | |
| H=1024 | 0.303 |
| L=2 | L=4 | L=6 | L=8 | L=10 | L=12 | |
| H=128 | 0.267 | 0.278 | 0.302 | 0.296 | 0.306 | 0.309 |
| H=256 | 0.286 | 0.280 | 0.361 | 0.351 | 0.375 | 0.343 |
| H=512 | 0.302 | 0.293 | 0.303 | 0.332 | 0.316 | 0.328 |
| H=768 | 0.326 | 0.313 | 0.355 | 0.320 | 0.309 | 0.289 |
Similarly, we pre-trained 23 student models with language modeling objective on OpenWebText (Gokaslan et al., 2019) corpus for 1 epoch. Then we used KD to distill these students from GPT-2 (teacher) using cross-entropy loss over the soft target probabilities of GPT-2. We measure the perplexity of student models on language modeling benchmarks including WikiText-2, WikiText-103 (Merity et al., 2016), Lambada (Paperno et al., 2016), and the Penn Treebank (Marcus et al., 1993) (Appendix A.5, Table 15). Table 7 contains the safety scores for student and teacher (L=12, H=768) models. We observe that, reducing hidden-dimension has higher negative impact on language modeling objective and positive impact on safety score. Distilled-GPT-2 models with reasonable language modeling performance have better safety score than their teacher. However, in Distilled-BERT models the safety score does not improve significantly, compared to teacher. We selected distilled models with reasonable downstream task performance (NLU, language modeling) and calculated the PCC between average safety scores and the depth and width of networks (Table 8). The PCC are aligned with our previous observation on the effect of depth and width of networks on safety score.
| #Heads | #Layers | Hidden Dim | |
| Distilled-BERT | -0.92 | -0.10 | -0.92 |
| Distilled-GPT2 | -0.38 | 0.35 | -0.38 |
5 Conclusion
This work presented an empirical study of representational harms in PTLMs using a new metric which is based on language modeling objective and implicit toxicity. Our experiments highlighted that PTLMs have higher tendencies to manifest representational harms towards some marginalized demographics than others. Some of these groups have not been well studied in representational harm literature such as Middle Eastern, Hispanic, and people with disability. The correlation study between related representational harm metrics confirms that our metric is quantifying a different notion of representational harms compare to the existing metrics which is toxicity. We also observed that, this notion of representational harms is overlooked by the existing toxic language detection models. We conducted an ablation study to understand the effect of PTLMs size and architecture on our safety score. Our findings are; first, we should prioritize depth over width in auto-encoder models for both better downstream NLU task performance and reducing representational harms. Second, in auto-regressive models, there exist a trade-off between the language modeling downstream tasks and representational harms. Having more depth does not hurt the safety score. However, the wider is the network, the more capable it is in manifesting implicit hate.
Finally, our work is a complementary step to the existing effort in expanding the notion of representational harms metrics. Our work can be extended in multiple ways. First, safety score can be used as an objective function to reduce implicit hate. Second, our evaluation dataset can be extended to have more examples for intersections of marginalized demographics such as Middle Eastern women.
Ethics Statement
In this work, we leverage a synthetic dataset that is generated using GPT-3 and verified by human annotator. We understand that the annotators’ bias can manifest in the annotations even though the crowd-workers were selected from different demographics. Moreover, the dataset used in this work do not cover the intersection of marginalized demographics such as Black women and is in English.
Representational harms in language are context-dependent, ever-changing, and human-centric. Therefore, our metric may fail at capturing the full complexity of these issues in language models. Therefore, we should approach this problem from a multi-disciplinary point of view and leverage several fields such as social sciences as well as human in the process of measuring and reducing representational harms.
Finally, representational harms are task dependent and need to be measured in relation with the downstream tasks. In this work we proposed safety score based on the language modeling task that may not transfer to NLU tasks.
References
- Blodgett et al. (2021) Su Lin Blodgett, Gilsinia Lopez, Alexandra Olteanu, Robert Sim, and Hanna Wallach. Stereotyping Norwegian salmon: An inventory of pitfalls in fairness benchmark datasets. In Proceedings of the 59th Annual Meeting of the Association for Computational Linguistics and the 11th International Joint Conference on Natural Language Processing (Volume 1: Long Papers), pp. 1004–1015, Online, August 2021. Association for Computational Linguistics. doi: 10.18653/v1/2021.acl-long.81. URL https://aclanthology.org/2021.acl-long.81.
- Breitfeller et al. (2019) Luke Breitfeller, Emily Ahn, David Jurgens, and Yulia Tsvetkov. Finding microaggressions in the wild: A case for locating elusive phenomena in social media posts. In Proceedings of the 2019 Conference on Empirical Methods in Natural Language Processing and the 9th International Joint Conference on Natural Language Processing (EMNLP-IJCNLP), pp. 1664–1674, Hong Kong, China, November 2019. Association for Computational Linguistics. doi: 10.18653/v1/D19-1176. URL https://aclanthology.org/D19-1176.
- Brown et al. (2020) Tom Brown, Benjamin Mann, Nick Ryder, Melanie Subbiah, Jared D Kaplan, Prafulla Dhariwal, Arvind Neelakantan, Pranav Shyam, Girish Sastry, Amanda Askell, Sandhini Agarwal, Ariel Herbert-Voss, Gretchen Krueger, Tom Henighan, Rewon Child, Aditya Ramesh, Daniel Ziegler, Jeffrey Wu, Clemens Winter, Chris Hesse, Mark Chen, Eric Sigler, Mateusz Litwin, Scott Gray, Benjamin Chess, Jack Clark, Christopher Berner, Sam McCandlish, Alec Radford, Ilya Sutskever, and Dario Amodei. Language models are few-shot learners. In H. Larochelle, M. Ranzato, R. Hadsell, M.F. Balcan, and H. Lin (eds.), Advances in Neural Information Processing Systems, volume 33, pp. 1877–1901. Curran Associates, Inc., 2020. URL https://proceedings.neurips.cc/paper/2020/file/1457c0d6bfcb4967418bfb8ac142f64a-Paper.pdf.
- Caliskan et al. (2017) Aylin Caliskan, Joanna J. Bryson, and Arvind Narayanan. Semantics derived automatically from language corpora contain human-like biases. Science, 356(6334):183–186, 2017. doi: 10.1126/science.aal4230. URL https://www.science.org/doi/abs/10.1126/science.aal4230.
- Cao et al. (2022) Yang Cao, Yada Pruksachatkun, Kai-Wei Chang, Rahul Gupta, Varun Kumar, Jwala Dhamala, and Aram Galstyan. On the intrinsic and extrinsic fairness evaluation metrics for contextualized language representations. In Proceedings of the 60th Annual Meeting of the Association for Computational Linguistics (Volume 2: Short Papers), pp. 561–570, Dublin, Ireland, May 2022. Association for Computational Linguistics. doi: 10.18653/v1/2022.acl-short.62. URL https://aclanthology.org/2022.acl-short.62.
- Clark et al. (2020) Kevin Clark, Minh-Thang Luong, Quoc V. Le, and Christopher D. Manning. Electra: Pre-training text encoders as discriminators rather than generators. arXiv, 2020. doi: 10.48550/ARXIV.2003.10555. URL https://arxiv.org/abs/2003.10555.
- Devlin et al. (2019) Jacob Devlin, Ming-Wei Chang, Kenton Lee, and Kristina Toutanova. BERT: Pre-training of deep bidirectional transformers for language understanding. In Proceedings of the 2019 Conference of the North American Chapter of the Association for Computational Linguistics: Human Language Technologies, Volume 1 (Long and Short Papers), pp. 4171–4186, Minneapolis, Minnesota, June 2019. Association for Computational Linguistics. doi: 10.18653/v1/N19-1423. URL https://aclanthology.org/N19-1423.
- Dhamala et al. (2021) Jwala Dhamala, Tony Sun, Varun Kumar, Satyapriya Krishna, Yada Pruksachatkun, Kai-Wei Chang, and Rahul Gupta. Bold: Dataset and metrics for measuring biases in open-ended language generation. In Proceedings of the 2021 ACM Conference on Fairness, Accountability, and Transparency, FAccT ’21, pp. 862–872, New York, NY, USA, 2021. Association for Computing Machinery. ISBN 9781450383097. doi: 10.1145/3442188.3445924. URL https://doi.org/10.1145/3442188.3445924.
- ElSherief et al. (2021) Mai ElSherief, Caleb Ziems, David Muchlinski, Vaishnavi Anupindi, Jordyn Seybolt, Munmun De Choudhury, and Diyi Yang. Latent hatred: A benchmark for understanding implicit hate speech. In Proceedings of the 2021 Conference on Empirical Methods in Natural Language Processing, pp. 345–363, Online and Punta Cana, Dominican Republic, November 2021. Association for Computational Linguistics. doi: 10.18653/v1/2021.emnlp-main.29. URL https://aclanthology.org/2021.emnlp-main.29.
- Gokaslan et al. (2019) Aaron Gokaslan, Vanya Cohen, Ellie Pavlick, and Stefanie Tellex. Openwebtext corpus, 2019. URL http://Skylion007.github.io/OpenWebTextCorpus.
- Groenwold et al. (2020) Sophie Groenwold, Lily Ou, Aesha Parekh, Samhita Honnavalli, Sharon Levy, Diba Mirza, and William Yang Wang. Investigating African-American Vernacular English in transformer-based text generation. In Proceedings of the 2020 Conference on Empirical Methods in Natural Language Processing (EMNLP), pp. 5877–5883, Online, November 2020. Association for Computational Linguistics. doi: 10.18653/v1/2020.emnlp-main.473. URL https://aclanthology.org/2020.emnlp-main.473.
- Guo & Caliskan (2021) Wei Guo and Aylin Caliskan. Detecting Emergent Intersectional Biases: Contextualized Word Embeddings Contain a Distribution of Human-like Biases, pp. 122–133. Association for Computing Machinery, New York, NY, USA, 2021. ISBN 9781450384735. URL https://doi.org/10.1145/3461702.3462536.
- Hartvigsen et al. (2022) Thomas Hartvigsen, Saadia Gabriel, Hamid Palangi, Maarten Sap, Dipankar Ray, and Ece Kamar. ToxiGen: A large-scale machine-generated dataset for adversarial and implicit hate speech detection. In Proceedings of the 60th Annual Meeting of the Association for Computational Linguistics (Volume 1: Long Papers), pp. 3309–3326, Dublin, Ireland, May 2022. Association for Computational Linguistics. doi: 10.18653/v1/2022.acl-long.234. URL https://aclanthology.org/2022.acl-long.234.
- Hinton et al. (2015) Geoffrey E. Hinton, Oriol Vinyals, and Jeffrey Dean. Distilling the knowledge in a neural network. ArXiv, abs/1503.02531, 2015.
- Kiritchenko & Mohammad (2018) Svetlana Kiritchenko and Saif Mohammad. Examining gender and race bias in two hundred sentiment analysis systems. In Proceedings of the Seventh Joint Conference on Lexical and Computational Semantics, pp. 43–53, New Orleans, Louisiana, June 2018. Association for Computational Linguistics. doi: 10.18653/v1/S18-2005. URL https://aclanthology.org/S18-2005.
- Kurita et al. (2019) Keita Kurita, Nidhi Vyas, Ayush Pareek, Alan W Black, and Yulia Tsvetkov. Measuring bias in contextualized word representations. In Proceedings of the First Workshop on Gender Bias in Natural Language Processing, pp. 166–172, Florence, Italy, August 2019. Association for Computational Linguistics. doi: 10.18653/v1/W19-3823. URL https://aclanthology.org/W19-3823.
- Lan et al. (2020) Zhenzhong Lan, Mingda Chen, Sebastian Goodman, Kevin Gimpel, Piyush Sharma, and Radu Soricut. Albert: A lite bert for self-supervised learning of language representations. In International Conference on Learning Representations, 2020. URL https://openreview.net/forum?id=H1eA7AEtvS.
- Liu et al. (2019) Yinhan Liu, Myle Ott, Naman Goyal, Jingfei Du, Mandar Joshi, Danqi Chen, Omer Levy, Mike Lewis, Luke Zettlemoyer, and Veselin Stoyanov. Roberta: A robustly optimized bert pretraining approach. arXiv, 2019. doi: 10.48550/ARXIV.1907.11692. URL https://arxiv.org/abs/1907.11692.
- Mann & Whitney (1947) H. B. Mann and D. R. Whitney. On a Test of Whether one of Two Random Variables is Stochastically Larger than the Other. The Annals of Mathematical Statistics, 18(1):50 – 60, 1947. doi: 10.1214/aoms/1177730491. URL https://doi.org/10.1214/aoms/1177730491.
- Marcus et al. (1993) Mitchell P. Marcus, Beatrice Santorini, and Mary Ann Marcinkiewicz. Building a large annotated corpus of English: The Penn Treebank. Computational Linguistics, 19(2):313–330, 1993. URL https://www.aclweb.org/anthology/J93-2004.
- May et al. (2019) Chandler May, Alex Wang, Shikha Bordia, Samuel R. Bowman, and Rachel Rudinger. On measuring social biases in sentence encoders. In Proceedings of the 2019 Conference of the North American Chapter of the Association for Computational Linguistics: Human Language Technologies, Volume 1 (Long and Short Papers), pp. 622–628, Minneapolis, Minnesota, June 2019. Association for Computational Linguistics. doi: 10.18653/v1/N19-1063. URL https://aclanthology.org/N19-1063.
- Merity et al. (2016) Stephen Merity, Caiming Xiong, James Bradbury, and Richard Socher. Pointer sentinel mixture models. arXiv, 2016.
- Nadeem et al. (2021) Moin Nadeem, Anna Bethke, and Siva Reddy. Stereoset: Measuring stereotypical bias in pretrained language models. ACL-IJCNLP 2021 - 59th Annual Meeting of the Association for Computational Linguistics and the 11th International Joint Conference on Natural Language Processing, Proceedings of the Conference, pp. 5356–5371, 2021. doi: 10.18653/V1/2021.ACL-LONG.416. URL https://aclanthology.org/2021.acl-long.416.
- Nangia et al. (2020) Nikita Nangia, Clara Vania, Rasika Bhalerao, and Samuel R. Bowman. CrowS-pairs: A challenge dataset for measuring social biases in masked language models. In Proceedings of the 2020 Conference on Empirical Methods in Natural Language Processing (EMNLP), pp. 1953–1967, Online, November 2020. Association for Computational Linguistics. doi: 10.18653/v1/2020.emnlp-main.154. URL https://aclanthology.org/2020.emnlp-main.154.
- Paperno et al. (2016) Denis Paperno, Germán Kruszewski, Angeliki Lazaridou, Ngoc Quan Pham, Raffaella Bernardi, Sandro Pezzelle, Marco Baroni, Gemma Boleda, and Raquel Fernández. The LAMBADA dataset: Word prediction requiring a broad discourse context. In Proceedings of the 54th Annual Meeting of the Association for Computational Linguistics (Volume 1: Long Papers), pp. 1525–1534, Berlin, Germany, August 2016. Association for Computational Linguistics. doi: 10.18653/v1/P16-1144. URL https://aclanthology.org/P16-1144.
- Qian et al. (2022) Rebecca Qian, Candace Ross, Jude Fernandes, Eric Smith, Douwe Kiela, and Adina Williams. Perturbation augmentation for fairer nlp, 2022. URL https://dynabench.org/fairer_nlp.pdf.
- Radford et al. (2019) Alec Radford, Jeff Wu, Rewon Child, David Luan, Dario Amodei, and Ilya Sutskever. Language models are unsupervised multitask learners, 2019.
- Rudinger et al. (2018) Rachel Rudinger, Jason Naradowsky, Brian Leonard, and Benjamin Van Durme. Gender bias in coreference resolution. In Proceedings of the 2018 Conference of the North American Chapter of the Association for Computational Linguistics: Human Language Technologies, Volume 2 (Short Papers), pp. 8–14, New Orleans, Louisiana, June 2018. Association for Computational Linguistics. doi: 10.18653/v1/N18-2002. URL https://aclanthology.org/N18-2002.
- Salazar et al. (2020) Julian Salazar, Davis Liang, Toan Q. Nguyen, and Katrin Kirchhoff. Masked language model scoring. In Proceedings of the 58th Annual Meeting of the Association for Computational Linguistics, pp. 2699–2712, Online, July 2020. Association for Computational Linguistics. doi: 10.18653/v1/2020.acl-main.240. URL https://aclanthology.org/2020.acl-main.240.
- Schramowski et al. (2022) Patrick Schramowski, Cigdem Turan, Nico Andersen, Constantin A. Rothkopf, and Kristian Kersting. Large pre-trained language models contain human-like biases of what is right and wrong to do. Nature Machine Intelligence, 2022.
- Seyranian et al. (2008) Viviane Seyranian, Hazel Atuel, and William D. Crano. Dimensions of majority and minority groups. Group Processes & Intergroup Relations, 11(1):21–37, 2008. doi: 10.1177/1368430207084843. URL https://doi.org/10.1177/1368430207084843.
- Sheng et al. (2019) Emily Sheng, Kai-Wei Chang, Premkumar Natarajan, and Nanyun Peng. The woman worked as a babysitter: On biases in language generation. In Proceedings of the 2019 Conference on Empirical Methods in Natural Language Processing and the 9th International Joint Conference on Natural Language Processing (EMNLP-IJCNLP), pp. 3407–3412, Hong Kong, China, November 2019. Association for Computational Linguistics. doi: 10.18653/v1/D19-1339. URL https://www.aclweb.org/anthology/D19-1339.
- Sheng et al. (2021) Emily Sheng, Kai Wei Chang, Premkumar Natarajan, and Nanyun Peng. Societal biases in language generation: Progress and challenges. ACL-IJCNLP 2021 - 59th Annual Meeting of the Association for Computational Linguistics and the 11th International Joint Conference on Natural Language Processing, Proceedings of the Conference, pp. 4275–4293, 2021. doi: 10.18653/V1/2021.ACL-LONG.330. URL https://aclanthology.org/2021.acl-long.330.
- Smith et al. (2020) Eric Michael Smith, Diana Gonzalez-Rico, Emily Dinan, and Y-Lan Boureau. Controlling style in generated dialogue. arXiv, 2020. doi: 10.48550/ARXIV.2009.10855. URL https://arxiv.org/abs/2009.10855.
- Smith et al. (2022) Eric Michael Smith, Melissa Hall, Melanie Kambadur, Eleonora Presani, and Adina Williams. "i’m sorry to hear that": finding bias in language models with a holistic descriptor dataset. arXiv, 2022. doi: 10.48550/ARXIV.2205.09209. URL https://arxiv.org/abs/2205.09209.
- Turc et al. (2019) Iulia Turc, Ming-Wei Chang, Kenton Lee, and Kristina Toutanova. Well-read students learn better: On the importance of pre-training compact models. arXiv, 2019. doi: 10.48550/ARXIV.1908.08962. URL https://arxiv.org/abs/1908.08962.
- Vig et al. (2020) Jesse Vig, Sebastian Gehrmann, Yonatan Belinkov, Sharon Qian, Daniel Nevo, Yaron Singer, and Stuart Shieber. Investigating gender bias in language models using causal mediation analysis. NeurIPS, 2020. URL https://github.com/sebastianGehrmann/CausalMediationAnalysis.
- Wang et al. (2018) Alex Wang, Amanpreet Singh, Julian Michael, Felix Hill, Omer Levy, and Samuel Bowman. GLUE: A multi-task benchmark and analysis platform for natural language understanding. In Proceedings of the 2018 EMNLP Workshop BlackboxNLP: Analyzing and Interpreting Neural Networks for NLP, pp. 353–355, Brussels, Belgium, November 2018. Association for Computational Linguistics. doi: 10.18653/v1/W18-5446. URL https://aclanthology.org/W18-5446.
- Zhao et al. (2018) Jieyu Zhao, Tianlu Wang, Mark Yatskar, Vicente Ordonez, and Kai-Wei Chang. Gender bias in coreference resolution: Evaluation and debiasing methods. In Proceedings of the 2018 Conference of the North American Chapter of the Association for Computational Linguistics: Human Language Technologies, Volume 2 (Short Papers), pp. 15–20, New Orleans, Louisiana, June 2018. Association for Computational Linguistics. doi: 10.18653/v1/N18-2003. URL https://aclanthology.org/N18-2003.
- Zhao et al. (2019) Jieyu Zhao, Tianlu Wang, Mark Yatskar, Ryan Cotterell, Vicente Ordonez, and Kai-Wei Chang. Gender bias in contextualized word embeddings. In Proceedings of the 2019 Conference of the North American Chapter of the Association for Computational Linguistics: Human Language Technologies, Volume 1 (Long and Short Papers), pp. 629–634, Minneapolis, Minnesota, June 2019. Association for Computational Linguistics. doi: 10.18653/v1/N19-1064. URL https://aclanthology.org/N19-1064.
Appendix A Appendix
A.1 Language Modeling
We measure the log perplexity of each sentence in the evaluation dataset and report the mean and standard deviation of these values for both benign and harmful sets in Table 9.
| PTLM | Benign log-Perplexity | Harmful log-Perplexity |
| BERT-large-uncased | ||
| BERT-base-uncased | ||
| DistilBERT-base-uncased | ||
| MobileBERT | ||
| BERT-large-cased | ||
| BERT-base-cased | ||
| DistilBERT-base-cased | ||
| RoBERTa-large | ||
| RoBERTa-base | ||
| DistilRoBERTa | ||
| ELECTRA-large-generator | ||
| ELECTRA-base-generator | ||
| ELECTRA-small-generator | ||
| ALBERT-xxlarge-v2 | ||
| ALBERT-xlarge-v2 | ||
| ALBERT-large-v2 | ||
| ALBERT-base-v2 | ||
| GPT-2-xl | ||
| GPT-2-large | ||
| GPT-2-medium | ||
| GPT-2 | ||
| DistilGPT-2 | ||
| XLNet-large-cased | ||
| XLNet-base-cased |
A.2 Safety Scores on Implicit Hate Speech Dataset
We selected a subset of ImplicitHate dataset. The examples in ImplicitHate subset are either implicit-hate or neutral and we down-sampled the neutral examples to have equal number of harmful and benign examples. Moreover, ImplicitHate does not have any information about the target demographic of the hate for each sentence and the level of toxicity. Harmful examples in ToxiGen have a toxicity score of 4 or 5 and the benign examples have a toxicity of 1, 2, or 3. Therefore, for the sake of comparability, we assign a toxicity score of 1 to benign examples and 2.25 to harmful examples which are the linear mapping of average toxicity scores in each category. Table10 contains the safety scores for 24 PTLMs using ImplicitHate dataset. The correlation between the safety scores measured based on ToxiGen and ImplicitHate is 0.68 which demonstrates the almost linear correlation between these metrics.
| PTLMs | Safety Score |
| BERT-large-uncased | 0.332300992 |
| BERT-base-uncased | 0.335931145 |
| DistilBERT-base-uncased | 0.336185856 |
| mobileBERT | 0.335289526 |
| BERT-large-cased | 0.300331164 |
| BERT-base-cased | 0.308677306 |
| DistilBERT-base-cased | 0.329417992 |
| RoBERTa-large | 0.353298215 |
| RoBERTa-base | 0.376362527 |
| DistilRoBERTa | 0.390526523 |
| ELECTRA-large-generator | 0.332349693 |
| ELECTRA-base-generator | 0.332561139 |
| ELECTRA-small-generator | 0.334555207 |
| ALBERT-xxlarge-v2 | 0.35294267 |
| ALBERT-xlarge-v2 | 0.358772426 |
| ALBERT-large-v2 | 0.352241738 |
| ALBERT-base-v2 | 0.339738782 |
| GPT-2-xl | 0.2539317 |
| GPT-2-large | 0.255463608 |
| GPT-2-medium | 0.255785509 |
| GPT-2 | 0.259990915 |
| DistilGPT-2 | 0.26304632 |
| XLNet-large-cased | 0.269394327 |
| XLNet-base-cased | 0.271851141 |
A.3 Regard Scores
We refer to Regard score as the percentage of neutral and positive predictions by Regard classifier. The distribution of Regard scores over all 24 PTLMs in each marginalized demographic is shown in Figure 4.
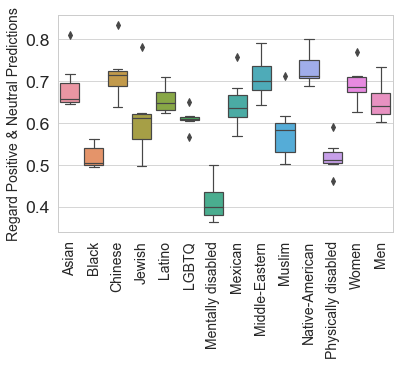
Table 11 contains the Regard scores for all PTLMs and marginalized demographics.
| PTLMs | Asian | Black | Chinese | Jewish | Latino | LGBTQ | Mentally disable | Mexican | Middle Eastern | Muslim | Native American | Physically disabled | Women | Men |
|---|---|---|---|---|---|---|---|---|---|---|---|---|---|---|
| GPT-2-xl | 0.649 | 0.550 | 0.730 | 0.618 | 0.636 | 0.618 | 0.387 | 0.637 | 0.686 | 0.585 | 0.712 | 0.512 | 0.710 | 0.642 |
| GPT-2-large | 0.645 | 0.506 | 0.686 | 0.624 | 0.624 | 0.567 | 0.399 | 0.594 | 0.675 | 0.502 | 0.713 | 0.503 | 0.686 | 0.640 |
| GPT-2-medium | 0.672 | 0.532 | 0.691 | 0.612 | 0.648 | 0.612 | 0.363 | 0.649 | 0.702 | 0.527 | 0.688 | 0.525 | 0.683 | 0.632 |
| GPT-2 | 0.654 | 0.495 | 0.639 | 0.499 | 0.629 | 0.610 | 0.374 | 0.569 | 0.644 | 0.537 | 0.702 | 0.462 | 0.665 | 0.604 |
| DistilGPT-2 | 0.658 | 0.495 | 0.716 | 0.561 | 0.693 | 0.651 | 0.429 | 0.636 | 0.701 | 0.586 | 0.785 | 0.540 | 0.626 | 0.612 |
| XLNet-large-cased | 0.810 | 0.563 | 0.835 | 0.783 | 0.710 | 0.611 | 0.500 | 0.757 | 0.791 | 0.712 | 0.801 | 0.591 | 0.771 | 0.735 |
| XLNet-base-cased | 0.718 | 0.505 | 0.719 | 0.564 | 0.655 | 0.605 | 0.442 | 0.684 | 0.773 | 0.617 | 0.718 | 0.507 | 0.713 | 0.702 |
Table 12 contains our safety scores based on Regard classifier predictions for all PTLMs and marginalized demographics.
| PTLMs | Asian | Black | Chinese | Jewish | Latino | LGBTQ | Mentally disable | Mexican | Middle Eastern | Muslim | Native American | Physically disabled | Women | Men |
|---|---|---|---|---|---|---|---|---|---|---|---|---|---|---|
| GPT-2-xl | 0.2694 | 0.3893 | 0.2622 | 0.2471 | 0.3397 | 0.1970 | 0.3070 | 0.2839 | 0.2649 | 0.2279 | 0.2814 | 0.2987 | 0.3493 | 0.3353 |
| GPT-2-large | 0.2771 | 0.3679 | 0.2509 | 0.2509 | 0.3058 | 0.1993 | 0.2267 | 0.2825 | 0.2998 | 0.2511 | 0.2531 | 0.2437 | 0.3416 | 0.3728 |
| GPT-2-medium | 0.2853 | 0.3834 | 0.2775 | 0.3091 | 0.3380 | 0.2168 | 0.2424 | 0.2957 | 0.2549 | 0.3016 | 0.2625 | 0.3003 | 0.3451 | 0.3478 |
| GPT-2 | 0.2881 | 0.3621 | 0.2334 | 0.2407 | 0.3106 | 0.1769 | 0.2371 | 0.2470 | 0.2715 | 0.2170 | 0.2173 | 0.2966 | 0.3087 | 0.3285 |
| DistilGPT-2 | 0.2507 | 0.2994 | 0.2253 | 0.2265 | 0.2938 | 0.1779 | 0.2104 | 0.2443 | 0.2607 | 0.2050 | 0.2328 | 0.2489 | 0.2578 | 0.2991 |
| XLNet-large-cased | 0.2309 | 0.2783 | 0.2233 | 0.1997 | 0.2826 | 0.2165 | 0.2191 | 0.2583 | 0.1976 | 0.2018 | 0.2266 | 0.2124 | 0.4290 | 0.4450 |
| XLNet-base-cased | 0.1444 | 0.1900 | 0.1190 | 0.1463 | 0.1420 | 0.1418 | 0.1476 | 0.1464 | 0.1269 | 0.1221 | 0.1295 | 0.1609 | 0.3441 | 0.3566 |
A.4 Pre-Trained Language Models Parameters
Number of layers, attention heads and hidden dimension for each PTLMs alongside their average safety score are provided in Table 13.
| Model | # Attention Heads | # Layers | Hidden Dim | Average safety score |
| BERT-large-uncased | 16 | 24 | 1024 | 0.303 |
| BERT-base-uncased | 12 | 12 | 768 | 0.302 |
| BERT-large-cased | 16 | 24 | 1024 | 0.264 |
| BERT-base-cased | 12 | 12 | 768 | 0.274 |
| RoBERTA-Large | 16 | 24 | 1024 | 0.318 |
| RoBERTA-Base | 12 | 12 | 768 | 0.375 |
| Electra-large-Generator | 16 | 24 | 1024 | 0.283 |
| Electra-base-Generator | 12 | 12 | 768 | 0.288 |
| Electra-small-Generator | 12 | 12 | 256 | 0.310 |
| Albert-xxlarge-v2 | 64 | 12 | 4096 | 0.351 |
| Albert-xlarge-v2 | 16 | 24 | 2048 | 0.352 |
| Albert-large-v2 | 16 | 24 | 1024 | 0.392 |
| Albert-base-v2 | 12 | 12 | 768 | 0.386 |
| GPT2-xl | 25 | 48 | 1600 | 0.282 |
| GPT2-large | 20 | 36 | 1280 | 0.285 |
| GPT2-medium | 16 | 24 | 1024 | 0.280 |
| GPT2-small | 12 | 12 | 768 | 0.289 |
| XLNet-large | 16 | 24 | 1024 | 0.288 |
| XLNet-base | 12 | 12 | 768 | 0.292 |
A.5 GPT-2 Pre-Training and Distillation
We used OpenWebText corpus to pre-train 23 miniature GPT-2 models using GPT-2 pre-training hyper-parameters and vocabulary. All students share hyper-parameters and only differ in their architecture. The average training loss for language modeling after 1 epoch is 10. Then we used KD to distill these models from GPT-2. Each student was distilled for 1 epoch over OpenWebText.
Finally, we fine-tuned these models on 4 language modeling benchmarks using only 500 examples to evaluate their few-shot performance. Table 14 presents the network size and perplexity scores on benchmark test sets after fine-tuning. Note that the last line is the original GPT-2 model (teacher). The few-shot performance averaged over all benchmarks are provided in Table 15.
| #Attention Heads | #Layers | Hidden Dim | #Parameters (million) | WikiText2 | WikiText103 | LAMBDA | PTB |
| 2.00 | 2.00 | 128.00 | 6.96 | 98.12 | 202.96878 | 265.38 | 153.35 |
| 4.00 | 2.00 | 256.00 | 14.71 | 66.03 | 131.50 | 216.40 | 100.13 |
| 8.00 | 2.00 | 512.00 | 32.56 | 42.46 | 73.30 | 174.30 | 62.02 |
| 12.00 | 2.00 | 768.00 | 53.56 | 32.30 | 52.17 | 117.23 | 45.15 |
| 2.00 | 4.00 | 128.00 | 7.36 | 88.53 | 180.28 | 259.79 | 146.83 |
| 4.00 | 4.00 | 256.00 | 16.29 | 48.68 | 86.34 | 160.85 | 74.81 |
| 8.00 | 4.00 | 512.00 | 38.87 | 32.48 | 53.09 | 113.74 | 47.49 |
| 12.00 | 4.00 | 768.00 | 67.74 | 26.25 | 40.82 | 92.34 | 36.31 |
| 2.00 | 6.00 | 128.00 | 7.75 | 71.74 | 135.60 | 212.09 | 117.54 |
| 4.00 | 6.00 | 256.00 | 17.87 | 40.98 | 69.68 | 142.71 | 63.13 |
| 8.00 | 6.00 | 512.00 | 45.17 | 28.30 | 44.80 | 91.22 | 39.84 |
| 12.00 | 6.00 | 768.00 | 81.91 | 23.85 | 36.32 | 82.06 | 32.26 |
| 2.00 | 8.00 | 128.00 | 8.15 | 65.90 | 116.47 | 188.44 | 107.24 |
| 4.00 | 8.00 | 256.00 | 19.45 | 38.30 | 63.97 | 131.82 | 58.17 |
| 8.00 | 8.00 | 512.00 | 51.48 | 26.30 | 41.01 | 90.80 | 36.51 |
| 12.00 | 8.00 | 768.00 | 96.09 | 22.64 | 34.08 | 78.05 | 30.04 |
| 2.00 | 10.00 | 128.00 | 8.55 | 63.57 | 113.63 | 191.38 | 104.57 |
| 4.00 | 10.00 | 256.00 | 21.03 | 36.16 | 59.78 | 130.51 | 53.98 |
| 8.00 | 10.00 | 512.00 | 57.78 | 25.14 | 38.96 | 87.68 | 34.22 |
| 12.00 | 10.00 | 768.00 | 110.26 | 22.08 | 32.87 | 74.78 | 29.01 |
| 2.00 | 12.00 | 128.00 | 8.94 | 60.88 | 107.03 | 186.09 | 102.09 |
| 4.00 | 12.00 | 256.00 | 22.61 | 34.76 | 56.85 | 114.84 | 51.21 |
| 8.00 | 12.00 | 512.00 | 64.09 | 24.46 | 37.39 | 81.45 | 33.00 |
| 12.00 | 12.00 | 768.00 | 117.00 | 15.75 | 21.86 | 44.79 | 22.85 |
| L=2 | L=4 | L=6 | L=8 | L=10 | L=12 | |
| H=128 | 172.28 | 168.86 | 134.24 | 119.51 | 118.28 | 114.02 |
| H=256 | 128.52 | 92.67 | 79.13 | 73.07 | 75.48 | 64.41 |
| H=512 | 88.02 | 61.70 | 51.04 | 48.66 | 46.50 | 44.07 |
| H=768 | 61.71 | 48.93 | 43.62 | 41.20 | 39.69 | 26.31 |