Stability of the In-Plane Room Temperature van der Waals Ferromagnet Chromium Ditelluride and Its Conversion to Chromium-Interleaved CrTe2 Compounds
Abstract
Van der Waals magnetic materials are building blocks for novel kinds of spintronic devices and playgrounds for exploring collective magnetic phenomena down to the two-dimensional limit. Chromium-tellurium compounds are relevant in this perspective. In particular, the 1 phase of CrTe2 has been argued to have a Curie temperature above 300 K, a rare and desirable property in the class of lamellar materials, making it a candidate for practical applications. However, recent literature reveals a strong variability in the reported properties, including magnetic ones. Using electron microscopy, diffraction and spectroscopy techniques, together with local and macroscopic magnetometry approaches, our work sheds new light on the structural, chemical and magnetic properties of bulk 1-CrTe2 exfoliated in the form of flakes having a thickness ranging from few to several tens of nanometers. We unambiguously establish that 1-CrTe2 flakes are ferromagnetic above room temperature, have an in-plane easy axis of magnetization, low coercivity, and we confirm that their Raman spectroscopy signatures are two modes, (103.5 cm-1) and (136.5 cm-1). We also prove that thermal annealing causes a phase transformation to monoclinic Cr5Te8 and, to a lesser extent, to trigonal Cr5Te8. In sharp contrast with 1-CrTe2, none of these compounds have a Curie temperature above room temperature, and they both have perpendicular magnetic anisotropy. Our findings reconcile the apparently conflicting reports in the literature and open opportunities for phase-engineered magnetic properties.
keywords:
van der Waals ferromagnets, two-dimensional materials, stability, room temperature ferromagnetism, CrTe2, Cr5Te8Contributed equally to this work \altaffiliationContributed equally to this work \alsoaffiliationInstitute of Physical Engineering, Brno University of Technology, Brno 616 69, Czech Republic
Introduction
Crystalline magnetic materials with layered structure, preferably held together by interlayer van der Waals forces, have been arousing considerable interest since it was realised they can be thinned down to single layers and still host (sometimes unusual) ordered magnetic phases 1, 2, 3, 4, 5, 6. These materials can be used as stamps to assemble new spintronic architectures 5, 6, with which concepts originally introduced for conventional magnets (i.e. not van der Waals) can be revisited. This includes chiral magnetization textures 7, 8, 9, 10, magnonic excitations 11, and interface effects controlled with electric fields 12, 13, 14, 15, 16 or using the proximity to other functional materials 17, 18.
Practical spintronic applications generally require materials with Curie temperature, , above 300 K, which is not the case for most van der Waals ferromagnets. One strategy is to increase of known materials by modifying their structure/composition via chemical substitution 19 or ion implantation 20, or by influencing them by proximity effect 21. Complementary to this strategy, the search for alternative materials is another, potentially guided by predictions of ad hoc chemical compositions and structures. This implies the exploration of sometimes complex alloy phase diagrams using various synthesis methods and multi-technique characterisations. In this context Fe-Ge-Te and Cr-Te compounds have attracted most attention, and we address the latter category in the present work.
Structure and composition control in the Cr-Te binary system is a known delicate problem. Indeed a variety of compounds with different stoichiometry can be formed, including CrTe 22 (200 K), Cr2Te3 23, 24, 25 (170 K), Cr1+1/3Te2 26 (160-190 K), Cr3Te4 27, 28 (240-320 K), Cr3Te5 29, Cr4Te5 30 (both with a 320 K), and Cr5Te8 31, 32, 33 (100-220 K). None of these binary alloys are lamellar per se, but are thought to consist of CrTe2 layers where Cr atoms have octahedral local environment with covalent Cr bridges between these layers. The magnetic properties might be strongly affected by the density of such bridges, and so should exfoliation, which is expectedly easier in the case of van der Waals interlayer interactions.
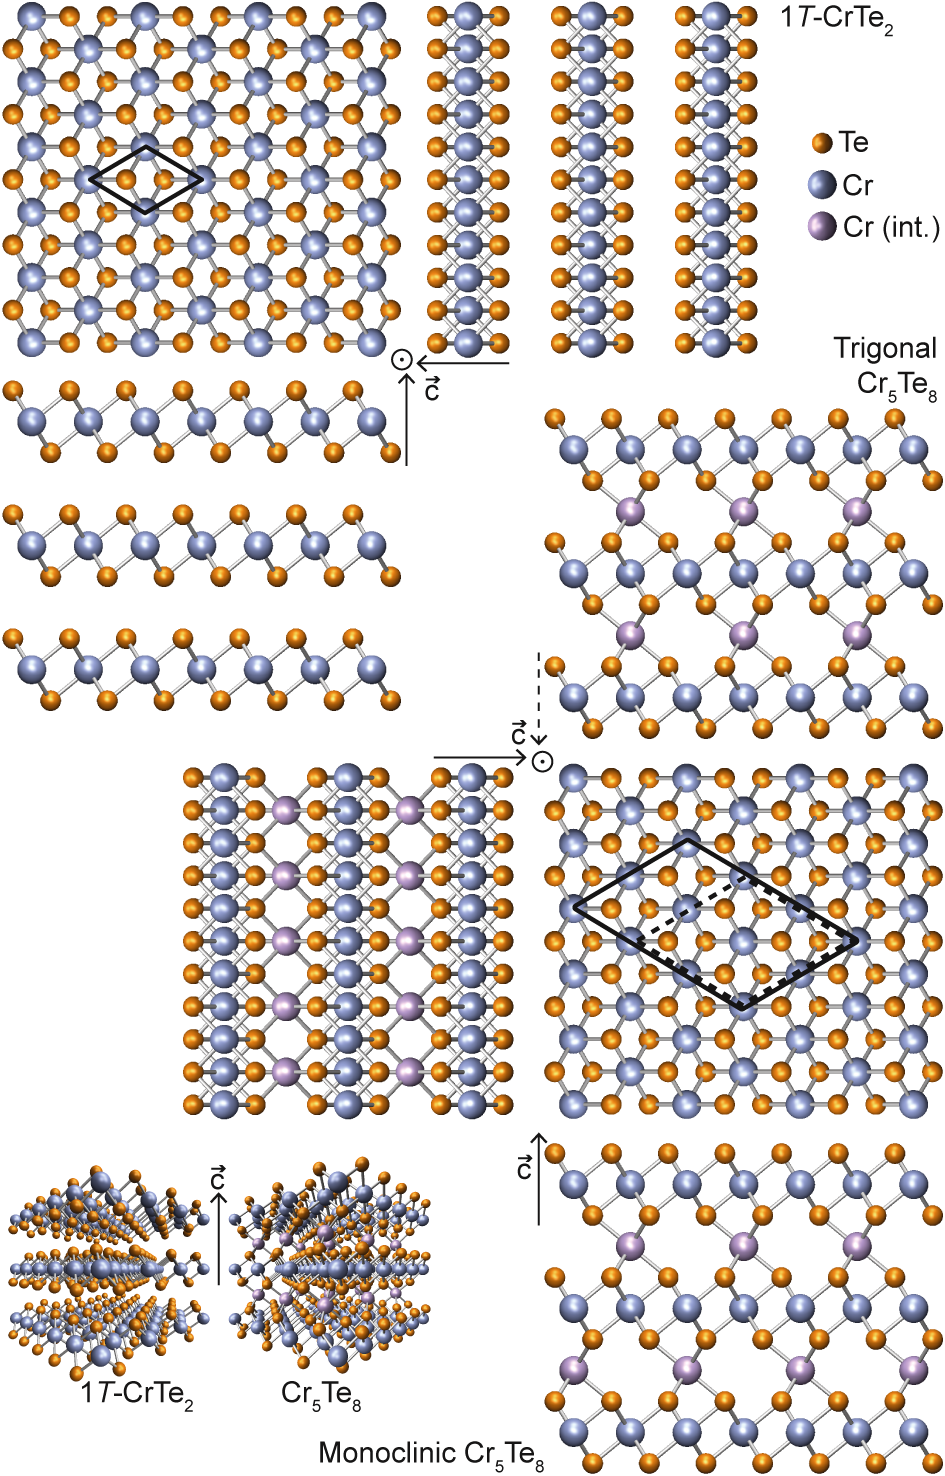
This weak interaction should prevail only for the 1:2 Cr:Te composition, in CrTe2 crystallised in the polytype (Figure 1). Several attempts have been made recently to prepare this compound in the form of (ultra)thin films. High temperature synthesis of the potassium-intercalated bulk material, followed by de-intercalation and mechanical exfoliation 34, 35, 36, large-area bottom-up growth by molecular beam epitaxy on GaAs 37 and graphene 38, and chemical vapour deposition on SiO239, have been reported. Variations of the magnetic properties as function of the thickness of the material have been observed: decrease of of the order of 10 K (around few nanometers to few tens of nanometers 35, 36, 40, 39, 37) and even 100 K (for the single-layer 38), reorientation of the magnetization easy axis (in-plane to out-of-plane below 10 nm 39), reduction of the coercivity 37, 35, transition to an antiferromagnetic order for a single layer 41. This could signal a transition from a bulk to a two-dimensional character; unfortunately this corpus of recent results is not consistent.
Beyond this, puzzling discrepancies and even contradictions have appeared, although they are sometimes difficult to spot because different sizes, shapes and thicknesses are considered in the reports. In the case of the thick material produced by each method however, the variability is better identified. The state of affairs is indeed confusing: slightly above 300 K 34, 35, 36, 40, 38 or 200 K 39, 37, in-plane 34, 35, 36, 40, 39 and out-of-plane 37, 38 easy magnetization axis, and (in-plane) coercivity of several 1 mT 35, 36 and several 100 mT 39, have been reported. Why should the preparation method influence these properties?
Here, we address this question under the prism of the material stability, which is a major issue for almost all van der Waals magnetic materials so far. We consider the impact of sample annealing on its structure, composition and magnetic properties, while the effect of air exposure is marginal for timescales of at least hours. We first thoroughly and quantitatively characterize pristine -CrTe2 synthesised at high temperature in the bulk form and subsequently exfoliated, with diffraction and element-sensitive micro-analysis tools. Next, we relate these analyses to a detailed Raman spectroscopy characterization, in an attempt to clarify the rather contradicting results found in the literature. We further quantitatively show that thermal annealing at 500 K and 800 K induces a change of the structural and chemical composition, to Cr5Te8. We correlate this information to drastic changes of the magnetic properties. This allows us to rationalise the various behaviours reported in the existing literature: the variability in the observed magnetic properties can be ascribed to varying Cr:Te compositions. Our work shows that while pristine -CrTe2 is a room temperature ferromagnet with in-plane easy axis in the form of macroscopic grains and thin flakes, it transforms into other Cr-Te compounds upon thermal annealing, concomitantly loosing room temperature ferromagnetism and exhibiting an out-of-plane magnetic anisotropy.
Results and Discussion
Methodology and strategy
We study materials synthesized via prolonged high temperature treatment of a 1:1:2 mixture of K, Cr, Te, and subsequent slow cool down. As described in Materials and Methods and Refs. 34, 36, special attention was paid to prevent oxydation by using an Ar-filled glove box, both to fill the quartz cell used for growth and to de-intercalate the grown material from K atoms. In the following we discuss results obtained (i) on bulk samples, i.e. macroscopic millimeter-sized grains of thickness of the order of hundreds of micrometers, and (ii) on flakes having an extension of the order of 10 m and thicknesses in the range of few tens of nanometers, which we deposited on Pt thin films (see Table 1 and Materials and Methods). Macroscopic samples were used to explore the magnetic properties as a function of temperature, down to 10 K with a superconducting quantum interference device (SQUID). Micro-flakes were probed at room temperature, in a local fashion under the objectives of optical (Raman spectroscopy and focussed Kerr magnetometry) and electron (energy-dispersive X-ray spectroscopy – EDS – and electron backscatter diffraction – EBSD –) microscopes. This allowed us to correlate complementary observations unambiguously.
First, our goal was to resolve the crystal symmetry and composition, as a function of an annealing temperature (500 K, 650 K and 800 K, annealing time: 30 min at each temperature). Second, we determined the magnetic properties of the sample in its pristine form (un-annealed) and after successive annealings. We then compare our observations to those found in the literature.
| \rowcolorgraySample | Dimensions | Annealing | Raman | EBSD | SQUID | Kerr | Figure # |
| \rowcolorgraytype | +EDS | ||||||
| Macro. | 100 m | none | yes | no | yes | no | 4,5 |
| 1 mm2 | 500 K | yes | no | yes | no | ||
| 650 K | yes | no | yes | no | |||
| 800 K | yes | no | yes | no | |||
| \rowcolorlightgrayMicro- | 85 nm2 | none | yes | yes | no | yes | 2,3,4,5 |
| \rowcolorlightgrayflake | 35 m2 | 500 K | yes | no | no | yes | |
| \rowcolorlightgray | 800 K | yes | yes | no | yes | ||
| Micro- | 53 nm2 | none | yes | yes | no | yes | 2,4,5 |
| flake | 80 m2 | 500 K | yes | yes | no | yes | |
| 800 K | yes | yes | no | yes | |||
| \rowcolorlightgrayMicro- | 150 nm2 | 500 K | no | yes | no | yes | S3,S4 |
| \rowcolorlightgrayflake | 12 m2 |
Crystallography and chemical analysis of pristine 1-CrTe2 micro-flakes
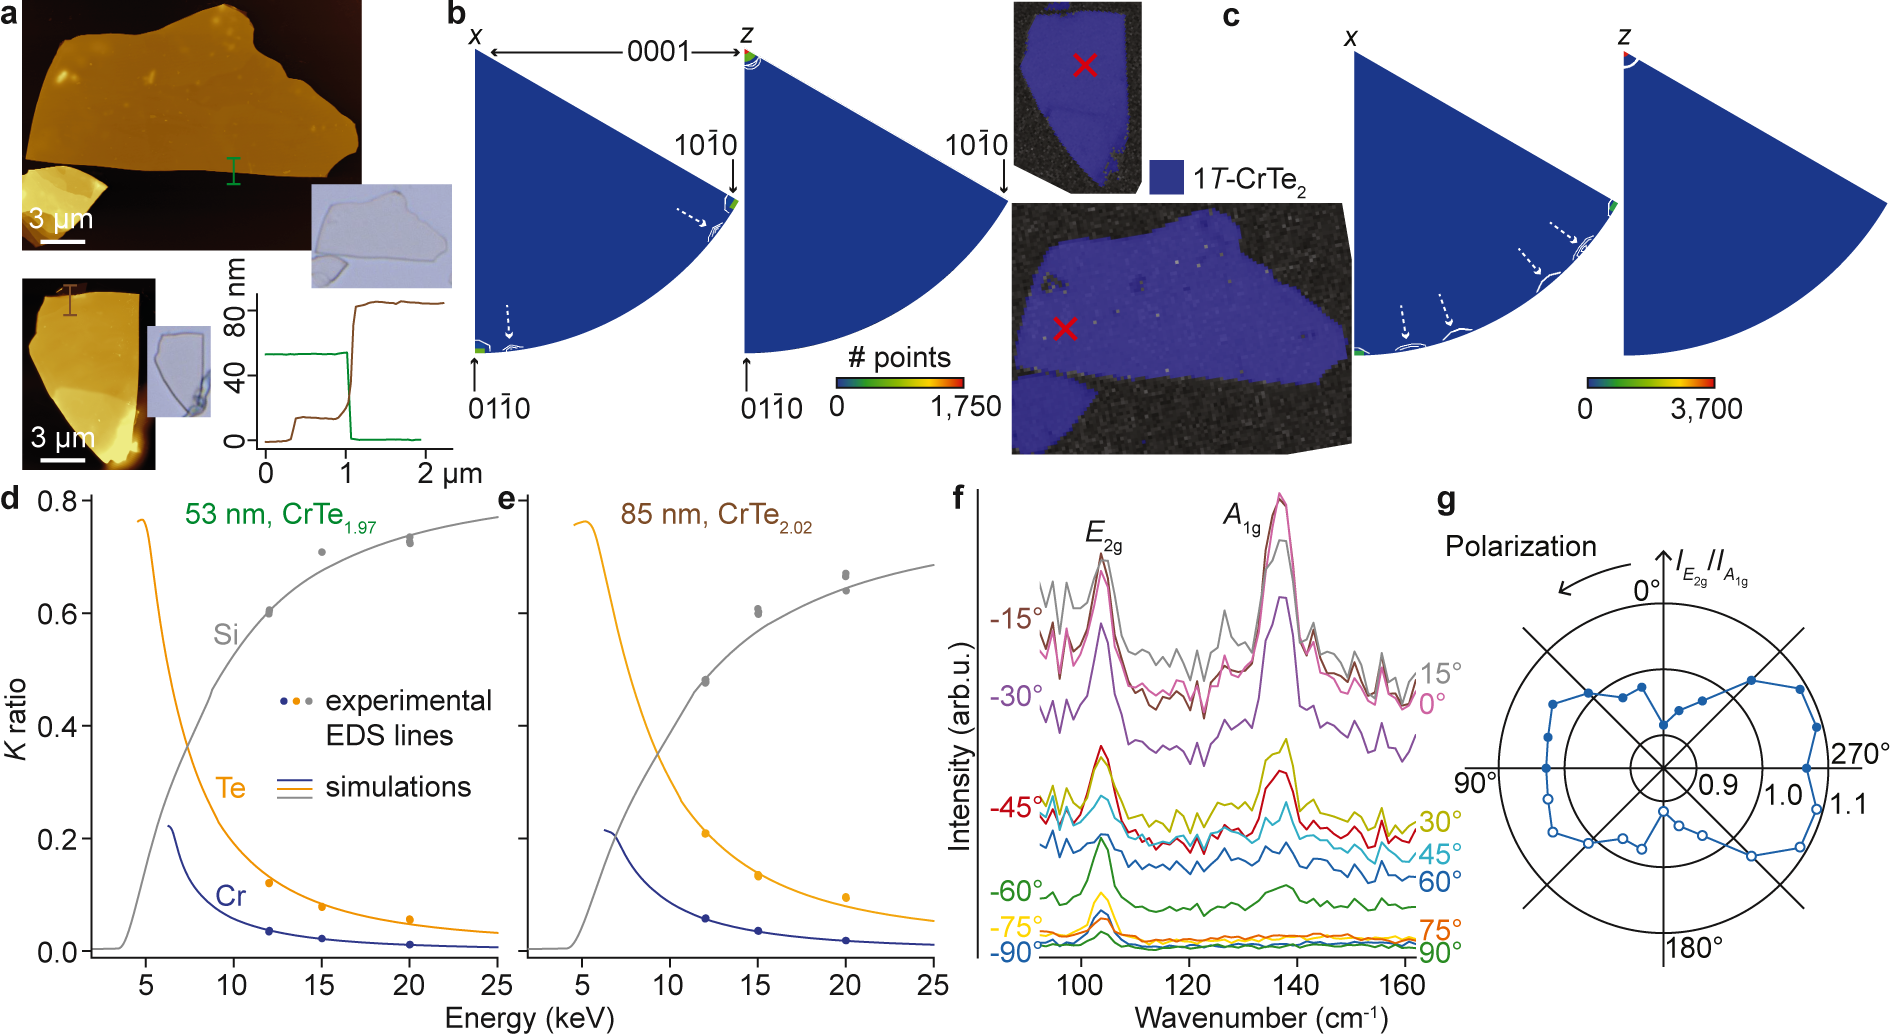
Freshly exfoliated micro-flakes (see two examples in Figure 2a, 53 nm- and 85 nm-thick flakes as measured with atomic force microscopy – AFM) were introduced in a scanning electron microscope (SEM). Inverse pole figures deduced from electron backscatter diffraction (EBSD, see Materials and Methods and an example pattern in Supporting Information Figure S1) reveal a perfect orientation of the crystal’s direction perpendicular to the flakes’ surface (i.e., to the layers) and overall patterns (Figure 2b, for two axes) indexed assuming a P1 (#164) space group. In these patterns, two main contributions are observed in the directions ( axis) and a single one in the direction ( axis) (see Supporting Information, note in Section S1). The patterns correspond to the expected polytype of CrTe2. The nature of the crystallographic phase can be determined point-by-point across the flakes’ surface within the SEM image: our pristine flakes are all uniformly indexed with the same structure (uniform color on the flakes’ mapping presented in Figure 2b,c, see Supporting Information Table S1 for details about alternative candidate phases considered). Note that the crystal lattice of other Cr-Te compounds shares several symmetry elements and might not seem straightforwardly different in diffraction experiments. Careful analysis of the local lattice constants is necessary to draw conclusions, which we did here. The issue of structure resolution of Cr-Te compounds is all the more important as direct observation of the atomic structure by plane-view high-resolution transmission electron microscopy (see e.g. Refs. 36, 32) can in principle not differentiate the various compounds since Cr interlayer bridges, when they are present, are aligned with the Cr atoms within the CrTe2 layers.
As already stressed in recent reports 29, 32, extensive composition analysis is crucial. For that purpose EDS was used, via datasets acquired at random locations on the flakes (five to 10 per flake). In our EDS analysis, given their relatively low thickness the micro-flakes are semi-transparent to the electron beam, which therefore is scattered by the substrate. To evaluate this effect and take into account the finite thickness of the flakes we acquired data at three different electron energies, extracted the so called -ratios of intensities from individual EDS spectra such as the one shown in Figure S1, relative to standard values (see Materials and Methods) for different X-ray emission lines (Figure 2d,e). Next, the -ratios were simulated for varying compositions at the different energies, and best fit to the experimental -ratios was sought for considering all energy values simultaneously (see Figure 2d,e for examples of the outcome of local analysis performed at the spots marked with crosses in Figure 2b,c). The most prominent emission lines are those of Cr, Te, and Si. We also sought for a potassium signature, indicative of partial de-intercalation of the bulk compound. However, sensitivity is not optimal given the close proximity of the Te emission line. Yet, our analysis indicates that the K content is at most 1% (mass percent), possibly even less. The analysis of ten flakes yields a characteristic Te/Cr ratio of atomic percentage composition of 2.000.03, in remarkable agreement with the independent assignment made based on inverse pole figures. This ratio represents a so far unreported (to our best knowledge) clear evidence of a 1:2 Cr:Te composition. Note that our analysis revealed no substantial presence of oxygen.
Raman spectroscopy of pristine 1-CrTe2 micro-flakes
Having determined the structure and composition of the material, we now provide a Raman characterisation that will be used to track possible changes in the nature of the material. As shown in our previous work 35, two peaks are observed in the spectra, centered at 103.5 cm-1 and 136.5 cm-1, whatever the flake thickness in the range we explored (10-150 nm). The spectra are identical for flakes exfoliated within a glove box and then sealed within a quartz cell filled with Ar (for Raman spectroscopy measurements) and samples probed in atmospheric conditions even after prolonged exposure to air.
Based on a coarse analysis of the polarization of the two peaks, we previously ascribed the two peaks to the (103.5 cm-1) and (136.5 cm-1) modes 35. Here we provide a more detailled analysis, by continuously varying the polarization angle (Figure 2f). The intensity ratio between the and modes is found to vary with a 180∘ periodicity (Figure 2g). The highest-wavenumber peak having maximum intensity in the polarization configuration and vanishing completely in the configuration. The lowest-wavenumber peak also looses intensity in the latter configuration, but does not vanish. This behaviour is reminiscent of that observed in other transition metal dichalcogenide (e.g. WS2 42), and allows us to discriminate the two modes, here in-plane and out-of-plane ).
We note that Meng et al. observed two peaks, centered at 124 cm-1 and 144 cm-1, which they assigned to and modes in CrTe2 39. This is inconsistent with our measurements and phase assignment. Also interesting is the observation of two peaks centered around 124 cm-1 and 144 cm-1 in Raman spectra measured for CrTe 22, Cr5Te8 32, 43, and Cr2Te3 25. We will shortly come back to this point.
Thermally-induced transformation of 1-CrTe2
The Raman spectrum drastically changes when the pristine material is annealed (see Supporting Information, note in Section S2). Annealing to 500 K under Ar atmosphere leads to the appearance of two strong peaks, centered at 125.6 cm-1 and 144.3 cm-1 (Figure 3a, Supporting Information Figure S2). The initial peak is also observed together with a broad feature spanning about 20 cm-1 on its low wavenumber side. Besides, to account for the observed line-shapes of the spectra, especially for the relatively strong signal at 136.5 cm-1, it seems reasonable that the peak is also present. This indicates a coexistence of at least two phases in the material, presumably with different Cr:Te composition (see Supporting Information, note in Section S3). Annealing at 800 K, still under Ar atmosphere, further changes the Raman spectrum. The initial and peaks have now disappeared, and peaks centered at 61.4 cm-1, 74.9 cm-1, 100.5 cm-1, 114.0 cm-1, 127.4 cm-1, and 145.0 cm-1 are observed (Figure 3a, Supporting Information Figure S2). Some of these new peaks (114.0 cm-1, 127.4 cm-1, 145.0 cm-1) have already been reported for a Cr-Te compound whose composition was estimated, based on a basic analysis of the relative intensity of peaks appearing in EDS, to 5:8 43. Our Raman spectroscopy data hence shows that annealing pogressively transforms 1-CrTe2 into a compound that could be Cr5Te8 (see sketches of the structure in Figure 1).
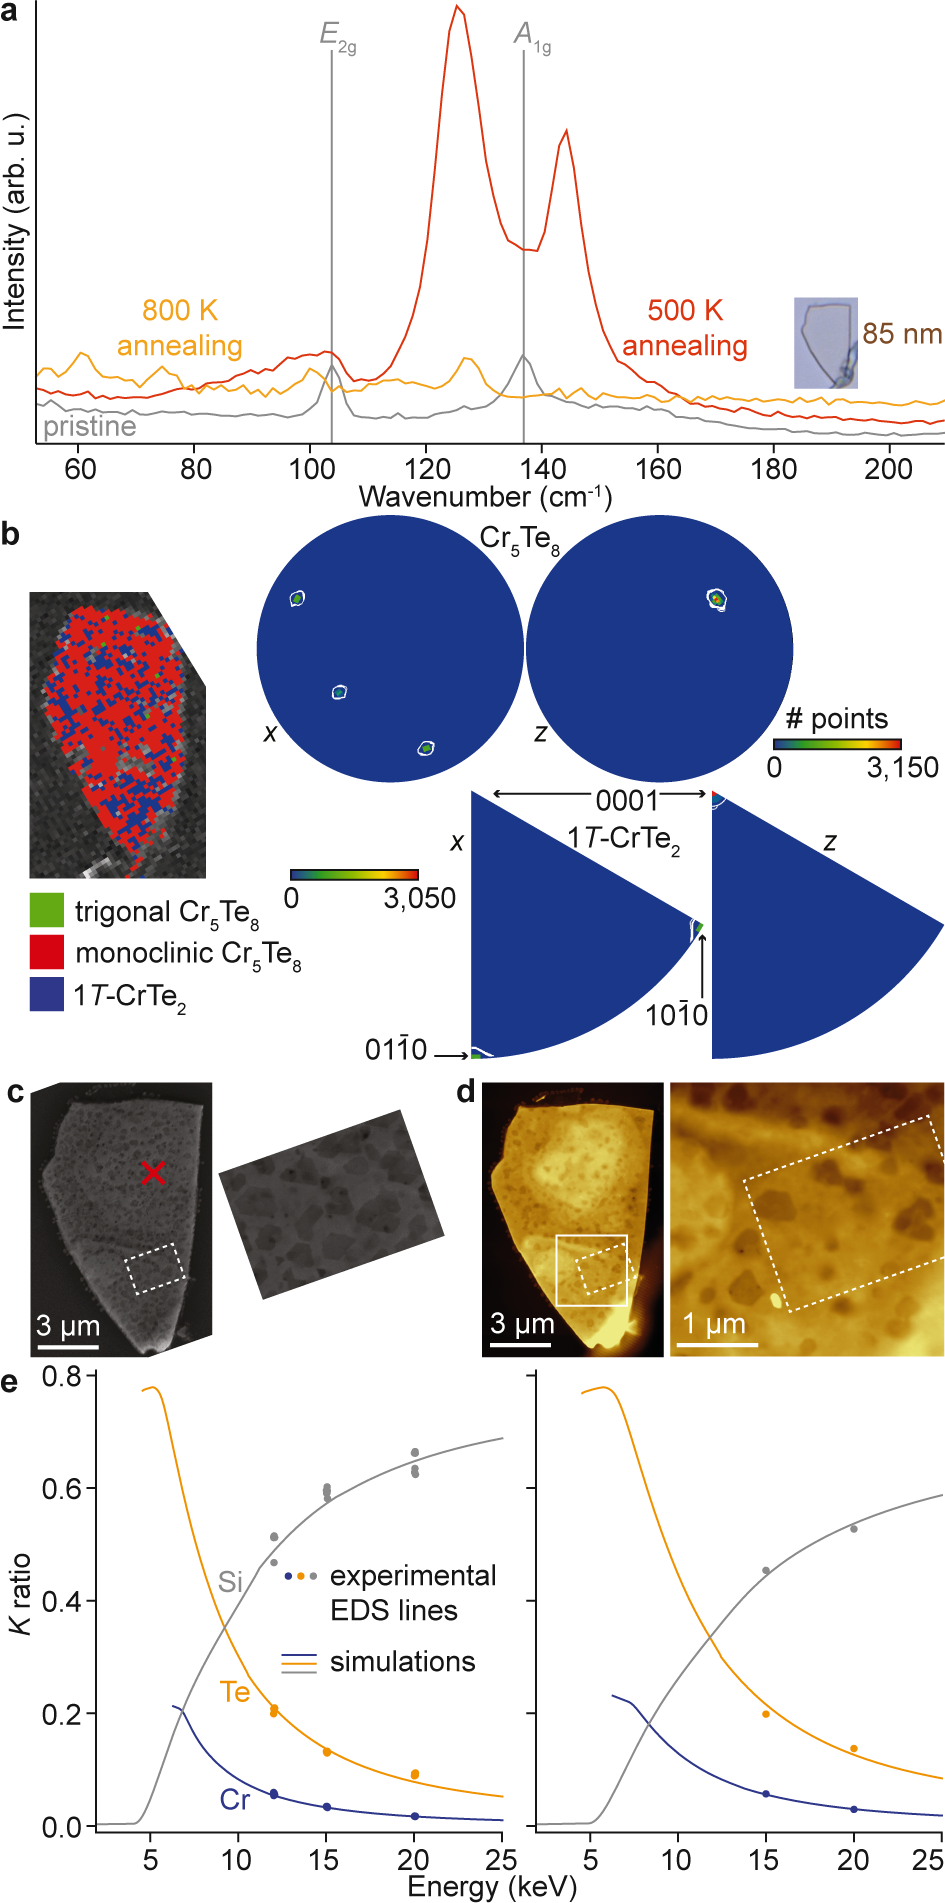
To interpret these observations we apply the careful micro-analysis procedure we used to characterise the structure and composition of pristine 1-CrTe2. After 500 K annealing, the local phase assignment we can perform with SEM-EBSD is not, globally, as straightforward as it was for the pristine flakes. An example is shown in Figure S3 of the Supporting Information for a 150 nm-thick flake: we resolve two contributions in the inverse pole figures within a single flake. This reflects in the spatially-resolved phase assignment, which still identifies 1-CrTe2 over a large fraction of the flakes, as well as occasionally a Cr5Te8 phase with a fraction of the order of 1%, and other regions (few 1% to several 10%, cf. Figure S3 of the Supporting Information) with unknown structure (Supporting Information, Section S7). After 800 K annealing, the situation is clearer: only few 1% of 1-CrTe2 are left, the rest being transformed into Cr5Te8 (see sketch of the structure in Figure 1) crystallized in the monoclinic system ( 50% of the material), to a lesser extent (few 1%) into trigonal Cr5Te8, and into ( 10%) other (unknown) phases (Figure 3b). The inverse pole figures for the 1-CrTe2 and monoclinic Cr5Te8 phases reveal that the highest symmetry Cr planes are parallel to the surface (Figure 3b).
The inhomogeneity is actually directly apparent, and better resolved spatially, in SEM images acquired with secondary electrons (Figure 3c). We observe lower intensity features with well-defined edges forming 120∘ angles, all with the same orientation, embedded within a matrix of higher-intensity-material. In the Cr5Te8 structure, the presence of Cr atoms forming bridges between the CrTe2 planes corresponds to a higher atomic density than in 1-CrTe2; hence it should have a higher secondary electron yield and should appear brighter than 1-CrTe2 in the images. We conclude that the dark lower-intensity features we observe are 1-CrTe2 crystallites that have not yet been converted into Cr5Te8. Comparison between SEM images and AFM topographs (Figure 3d) suggests that these crystallites do not all emerge at the surface, but are also buried below the surface of the flakes.
In addition, the EDS analysis reveals a composition change with the annealing temperature. The change is marginal after 500 K annealing, by typically percents (Figure 3e). After 800 K annealing, changes are drastic (Figure 3e). Correlated with the spatially varying secondary electron yield in SEM imaging, the Te/Cr atomic fraction varies spatially, in the form of a bimodal distribution centered at 1.980.02 and 1.720.06.
The former composition is indiscernible from 1:2, which corresponds to 1-CrTe2, but what about the latter composition? A 1.720.06 ratio can point to either a 1-CrTe2 material enriched with Cr atoms, or to 1-CrTe2 depleted with Te, i.e. with Te vacancies. Such a depletion would however mean the material assumes essentially the same lattice parameter as 1-CrTe2, in contradiction with our EBSD data (Figure 3b). The composition derived from EDS hence corresponds to a Cr:Te composition of about 5:8 (actually 5:8.6), with the excess Cr relative to 1-CrTe2 presumably present in the form of covalent Cr bridges connecting the individual 1-CrTe2 layers. Where does this excess Cr come from? No external supply of Cr was provided during the annealing treatments, hence this excess must be either already present or generated locally within the samples. Since X-ray diffraction did not detect any pure-Cr inclusions or other Cr-Te phases in the pristine (macroscopic) grains, a reasonable scenario is Cr diffusion across the sample, leaving Cr-depleted regions likely in the form of Te clusters (we do not detect Cr-poor Cr-Te compound in EBSD).
Room temperature in-plane ferromagnetism in pristine 1-CrTe2 micro-flakes
First, we summarise the temperature dependence of the magnetic properties of millimeter-sized 1-CrTe2 grains, prior to any thermal annealing. Consistent with Ref. 34, magnetization decreases as temperature increases, and has lost 45% of its 4 K value close to room temperature, signalling a ferromagnetic-to-paramagnetic transition with = 320 K (Figure 4a). As expected, the latter does not depend on the magnitude of the external magnetic field or on its direction. However, the maximum magnetization values are substantially larger in the in-plane direction.
The magnetization versus magnetic field loops with in-plane () and out-of-plane () applied field have distinct shapes, pointing to an in-plane easy axis for magnetization, regardless of the temperature (Figure 4b,c). Small loop openings (hence small coercivities) are observed in both directions, but their variations with temperature () differ: although it increases with decreasing for , it decreases with decreasing for . Altogether, our observations are very different from those recently reported for what was claimed to be CrTe2 in the form of 25 nm-thick layers with a = 205 K 37 and 25 nm-thick layers with a = 160-190 K for 39. In Ref. 37 an out-of-plane easy axis was observed, while in Ref. 39 an in-plane easy was found (beyond the few 1 nm-thickness regime). We argue that the origin of these different magnetic properties are related to different Cr:Te compositions, consistent with the Raman spectroscopy data, beyond the 1:2 ratio that we quantified in the present work with the EBSD + EDS analysis.
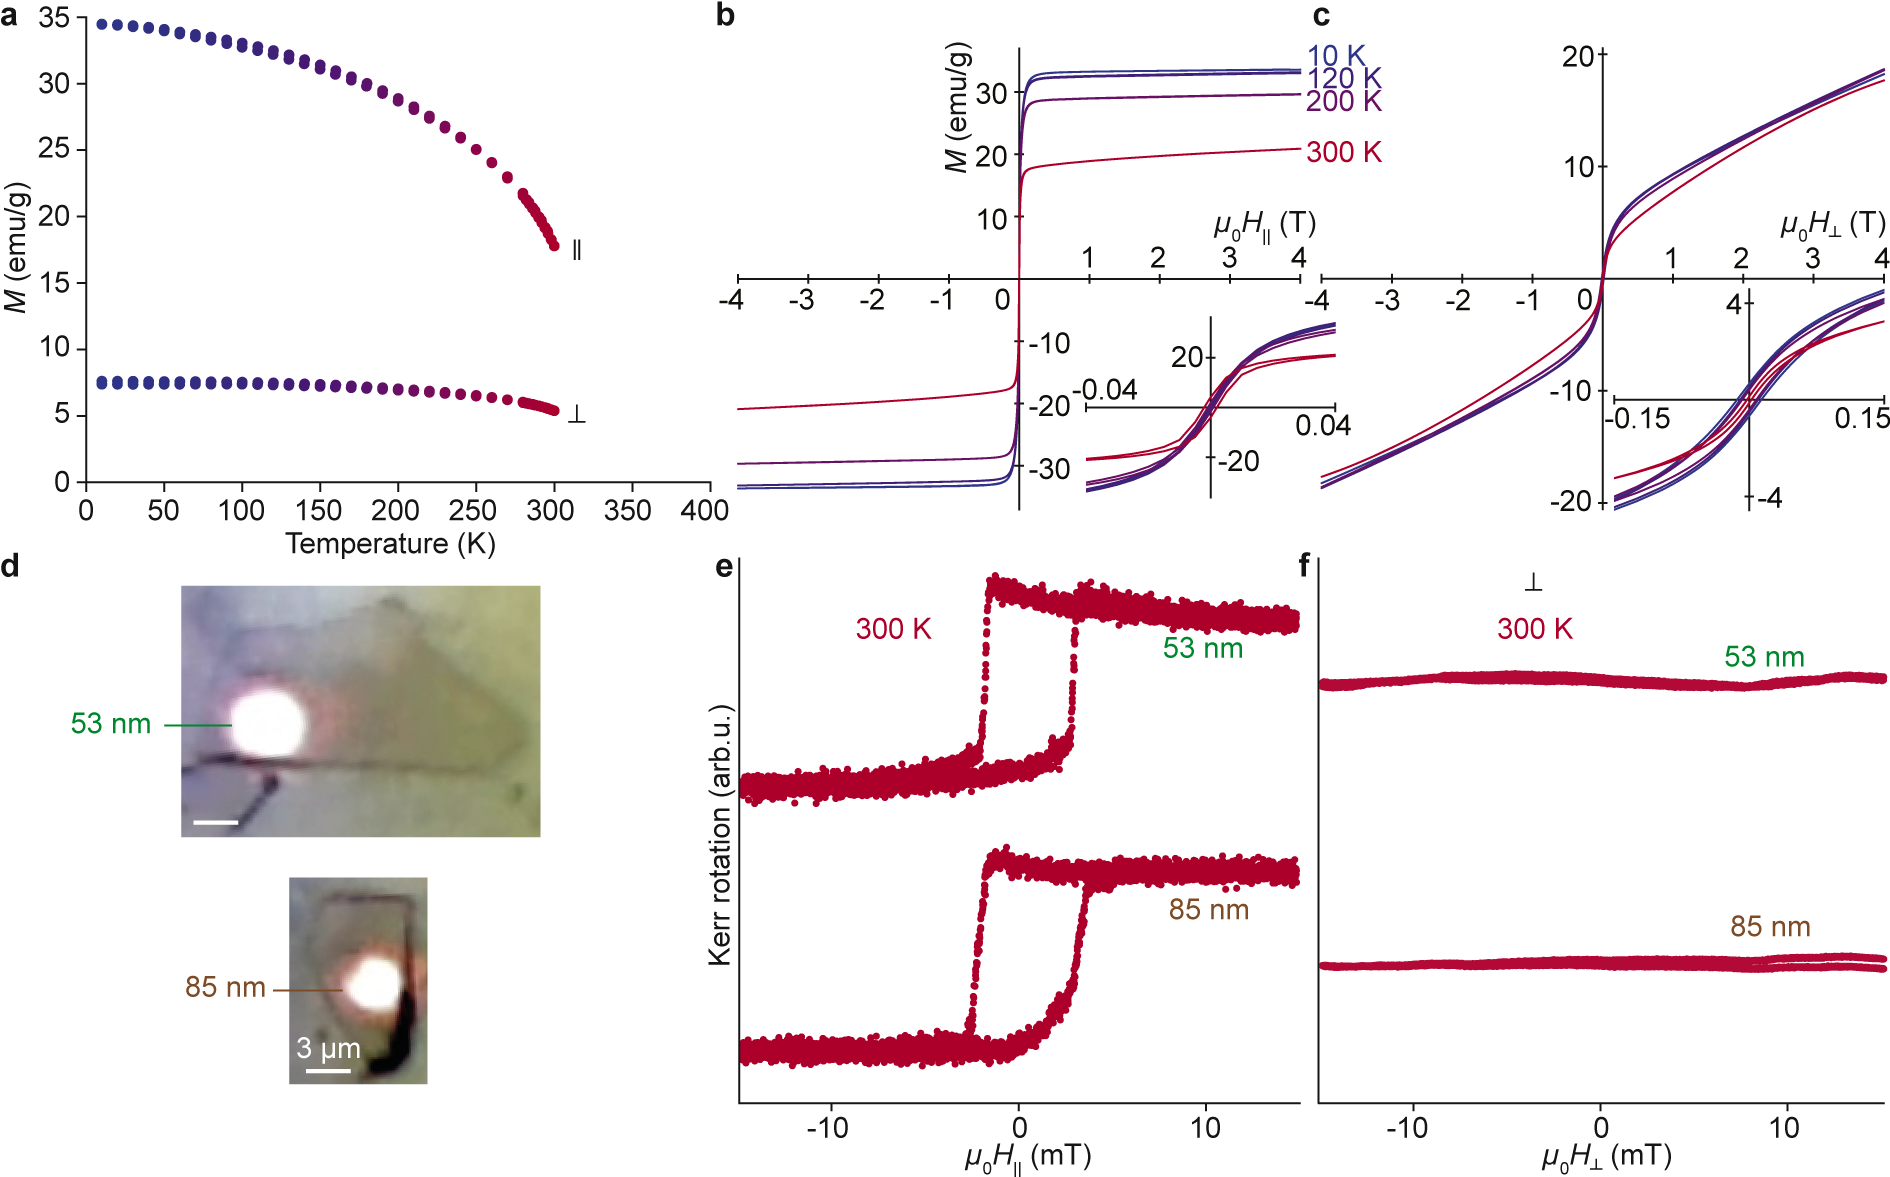
Micro-flakes (analyzed with focused Kerr magnetometry at room temperature, Figure 4d-f) exhibit loops that look qualitatively different from those of the macroscopic samples (probed with SQUID). The loops reveal a square hysteresis (Figure 4e), while no loop opening is observed when the field is applied in the perpendicular direction (, Figure 4f). This is, once more, typical of an in-plane easy axis for the magnetization (see Supporting Information, Section S8 and Figure S4), which is much favoured by the large aspect ratio of the flakes as it minimizes the dipolar term in the total magnetic anisotropy energy.
Low Curie temperatures in thermally-transformed 1-CrTe2
Millimeter-sized grains were subsequently annealed to 500 K, 650 K, and 800 K under Ar atmosphere. The curves (Figure 5a) reveal a progressive decrease of , well below 300 K. While a well-defined is still observed after 500 K annealing (see derivative in Figure S5 of the Supporting Information), it is noteworthy that the perpendicular component of magnetization has doubled compared to pristine samples. After annealing to 650 K, the perpendicular component exceeds the parallel component; additionally multiple steps are observed in the curves, at 130 K, 210-220 K and 280 K suggesting a coexistence of phases with distinct (Supporting Information, Figure S5). Finally, after 800 K annealing, the perpendicular component largely dominates and exhibits a monotonous decay with pointing to 175 K (Supporting Information, Figure S5). Instead, a more complex behaviour is observed for the parallel component, which exhibits a bump at 165 K and a step at 250 K.
The unambiguous changes of the magnetic easy axis (from in-plane to out-of-plane) and of the ordering temperature from above to below room temperature are also evident in the loops measured at various temperatures (Figure 5b-g; see also Figure S6 in Supporting Information for a broader range of field values).
To interpret these observations we now refer to our characterizations of the structure and composition (Figure 3) and to data available from previous literature. Our SEM EBSD/EDS analysis suggests that a negligible amount of the pristine 1-CrTe2 material has transformed after 500 K annealing, turning into other phases such as CrTe and Cr5Te8. This is consistent with our Raman spectroscopy data, which appears to be especially sensitive to these other phases, and with the and curves, which are only slightly altered by this moderate annealing.
Changes are stronger after 650 K annealing, with steps in the curves that are consistent with the presence of CrTe crystallites (whose varies with their thickness 22) or Cr5Te8 31. A large fraction of the material then consists of phases other than 1-CrTe2.
Finally, after 800 K annealing, our previous analyses indicate that the material is to a large extent converted to Cr5Te8, still with few 100 nm-wide 1-CrTe2 clusters. Obviously, these clusters do not significantly contribute to the magnetic response of the material. They represent a small fraction of the material, typically few 1% (see discussions above), which may still be sufficient to be detected with SQUID magnetometry. A possible reason is that their low thickness (Figure 3c,d shows they are definitely thinner than the flakes) corresponds to a reduced 38; they hence may contribute to the 200 K tail of the curve measured with an in-plane field (Figure 5a, left). Anyway, the observed ordering temperature of the 800 K-annealed material, around 175 K, is consistent with our above assignment (Figure 3) of a Cr5Te8 structure, for which similar values were recently reported for a certain range of material thickness 33. Our samples may indeed consist of Cr5Te8 with thickness of the order of 10 nm, separated by other kinds of more-or-less well-defined Cr-Te phases. In contrast, bulk Cr5Te8 exhibits a higher ordering temperature, 230 K 31. Besides, similar to the observation made for the bulk compound, Cr5Te8 in our study exhibits a bump in the for the parallel component, although at a lower temperature (165 K). The origin of this bump is not yet understood, possibly related to the presence of non-trivial spin textures 31.
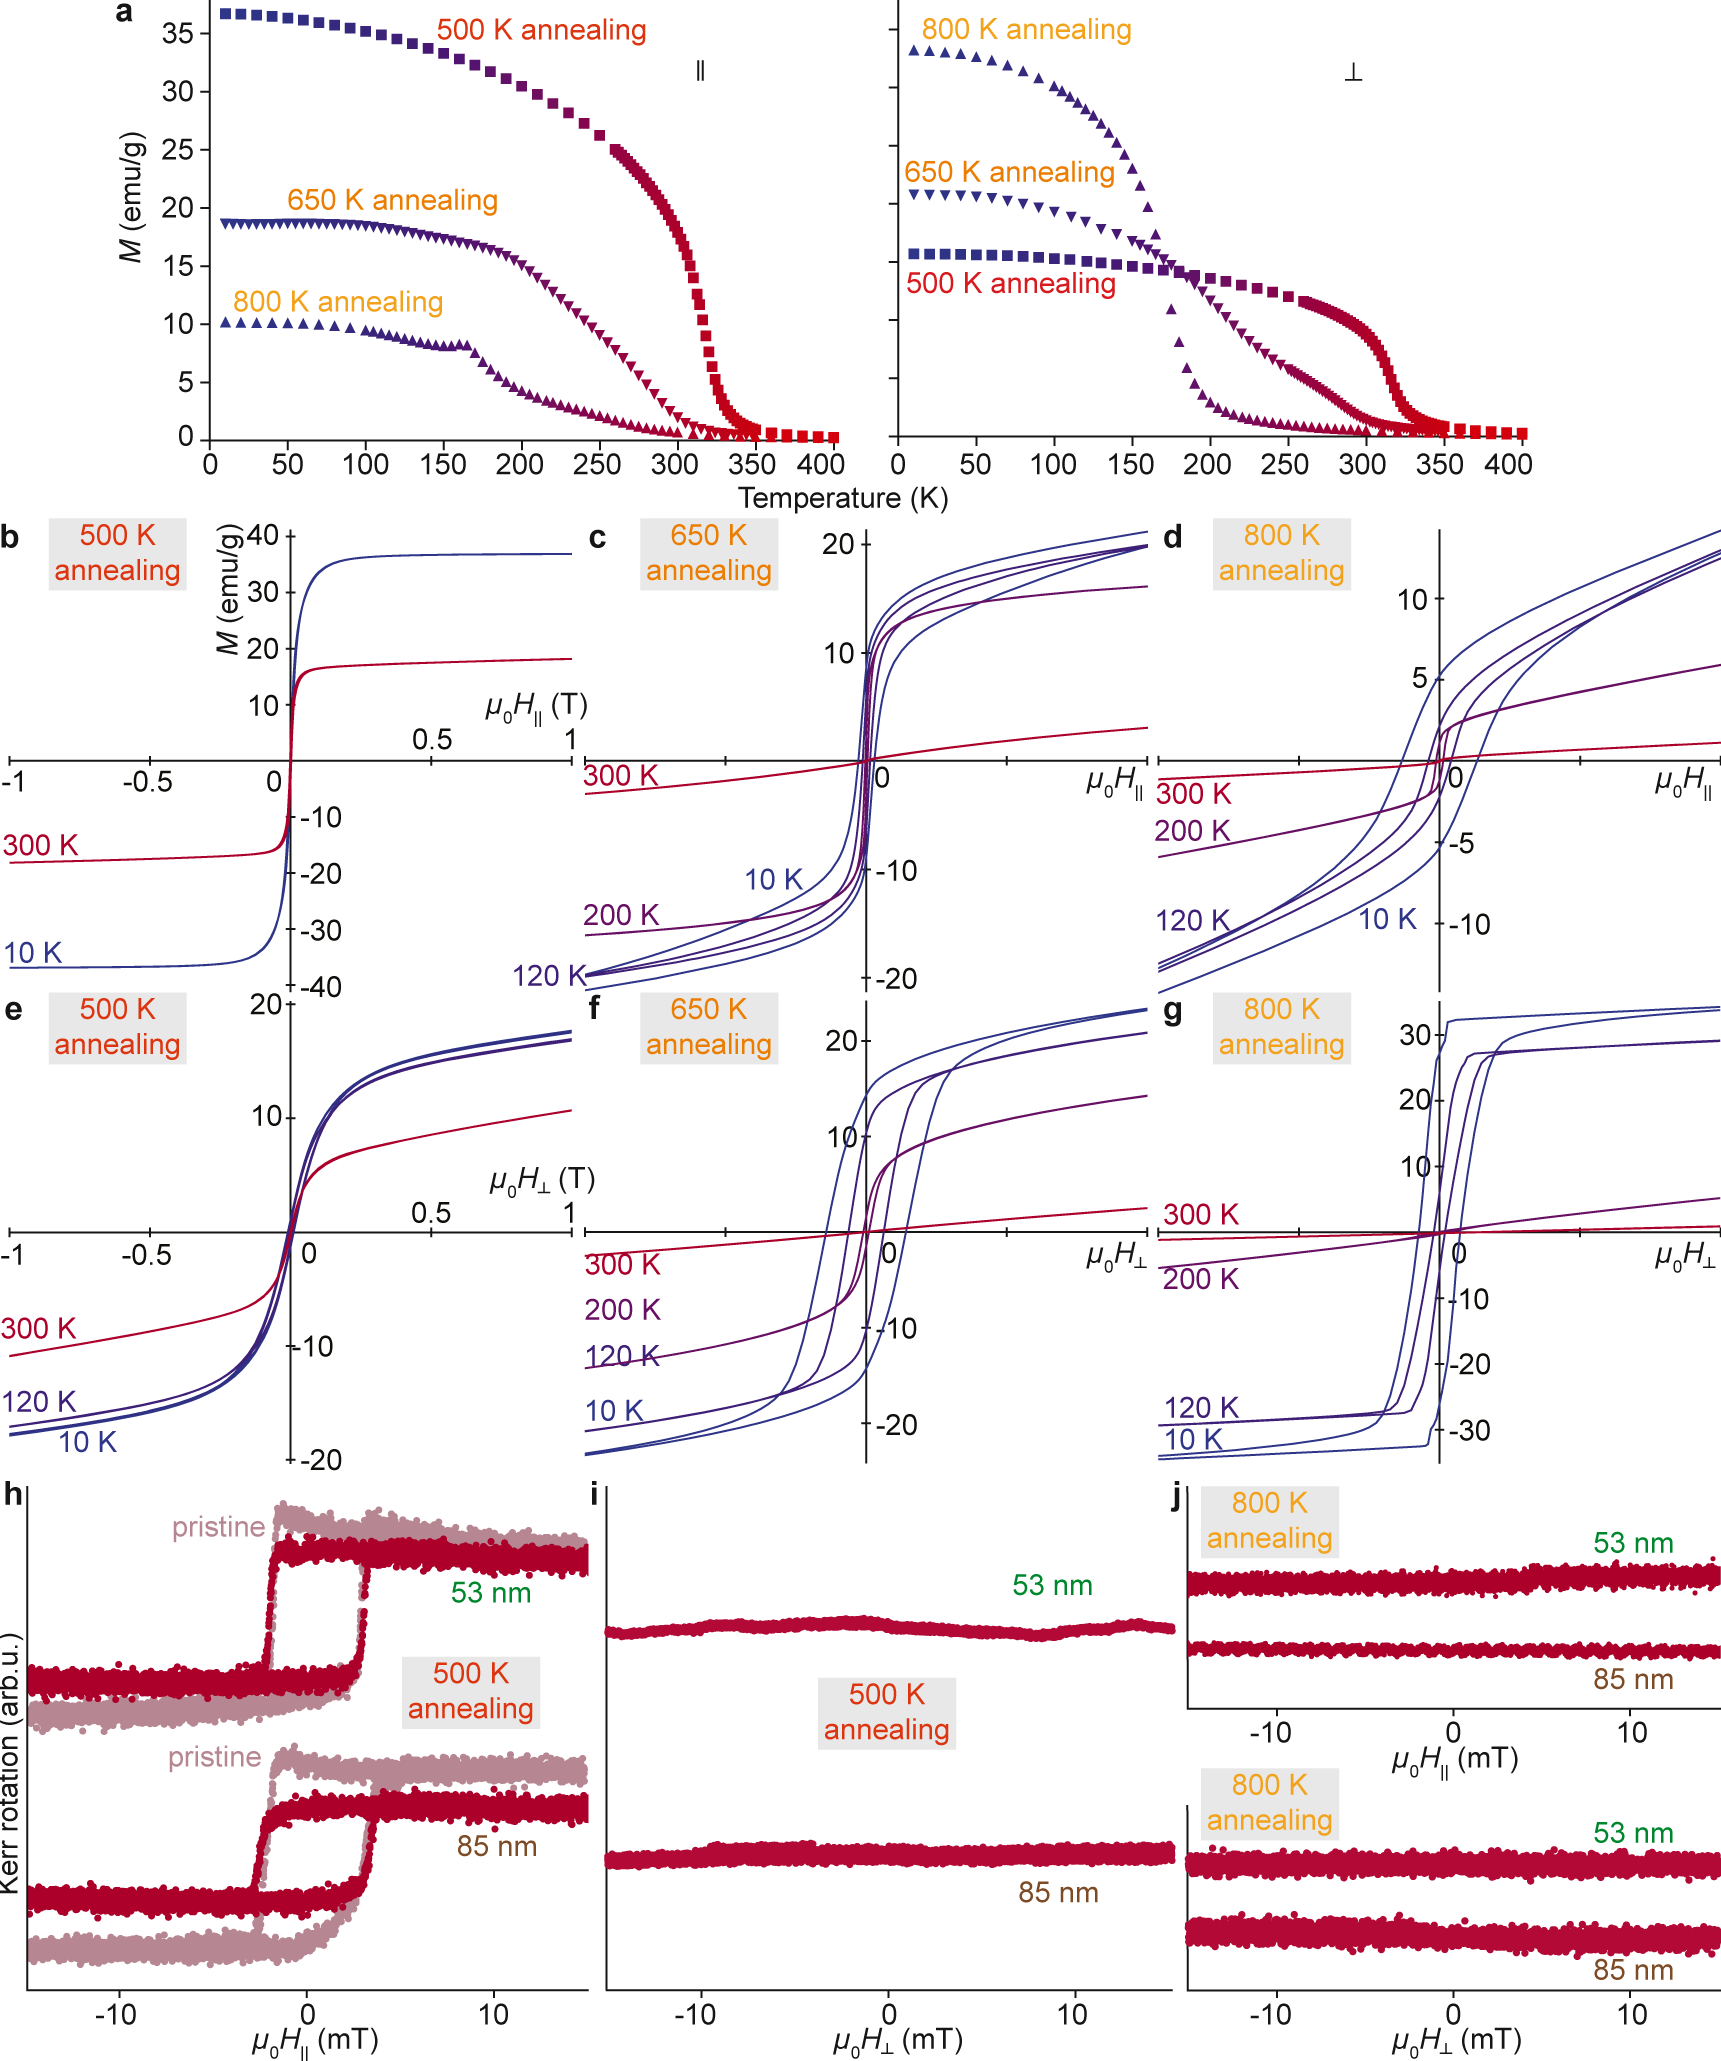
Finally, we discuss the room temperature magnetism of the flakes studied before and after annealing in Figures 2,3,4. We find square hysteresis loops in the parallel direction after 500 K annealing, and no loop opening in the perpendicular direction. This is qualitatively similar to the case of the pristine flakes (Figure 5h,i), and we observe a significant reduction of the intensity of the Kerr rotation after 500 K annealing, confirming once more that part of the pristine 1-CrTe2 has been converted into another phase. Strikingly, after annealing to 800 K, no ferromagnetic signature can be detected in either direction (Figure 5j), in perfect agreement with SQUID measurements revealing magnetic ordering only at low temperatures.
Summary and conclusion
Using detailled structural and chemical analysis of micro-flakes obtained by mechanical exfoliation from a bulk material synthesized at high temperature, we have established that these micro-flakes are made of the room temperature 1-CrTe2 ferromagnet. We have presented their polarization-dependent Raman spectroscopy signature, and showed that this is a very powerfull tool to discriminate the different Cr-Te compounds. We next have presented their magnetic properties, namely an in-plane easy axis, a Curie temperature above 300 K (at least for several 10 nm-thick samples), and coercivities of the order of few 1 mT. We have found that the bulk material, and flakes derived from it, are stable over weeks in air and at room temperature, and we have detected neither signs of oxidation or other chemical transformations, nor changes in the crystal structure, with Raman spectroscopy, electron diffraction, energy dispersive spectroscopy, optical Kerr and SQUID magnetometries.
We have then annealed the bulk 1-CrTe2 material and its micro-flakes at temperatures of 500 K, 650 K, and 800 K. We have found that the structure and composition of the starting material changes upon these treatments, rather marginally at 500 K but prominently starting from 650 K. The material converts, to a large extent, to monoclinic Cr5Te8, a phase where the CrTe2 planes are bridged by Cr atoms. We have correlated the changes of structure and composition to profound changes of the magnetic properties, which are, after 800 K, characterized by an out-of-plane anisotropy and a Curie temperature below 200 K. We suggest that the origin of the strong change in the magnetic properties is rooted in the role of covalent Cr-Te interlayer bonds, which may introduce super-exchange kinds of magnetic interactions between the transition metal ions belonging to different CrTe2 layers in Cr5Te8.
These findings provide a natural guide to revisit the recent literature (and to analyse commercially available samples, see Supporting Information Figure S7), which witnessed a number of conflicting reports regarding the properties of what was claimed to be 1-CrTe2. Besides shedding new light on the compound properties, our work highlights new opportunities for thermally-induced phase engineering. Given the richness of magnetic properties of Cr-Te compounds, ultra-thin materials with a variety of remarkable properties are within reach, e.g. hosting room-temperature ferromagnetism 35, topologically non-trivial magnetic textures 44, 45 or a very strong anomalous Hall effect 33, and could be combined within in-plane phase-modulated materials 46, 47 by exploiting local heating effects.
Materials and Methods
1-CrTe2 samples were obtained from KCrTe2. KCrTe2 was prepared from a molar mixture of Cr, K and Te, introduced under argon atmosphere (glove box) within an evacuated quartz tube. The quartz tube was then heated to the melting point of K and Te, and held at 1170 K during eight days. After cool down, the tubes were opened in a glove box to prevent oxidation. Potassium de-intercalation was subsequently achieved by reaction of KCrTe2 with a solution of iodine in acetonitrile. The resulting suspensions were stirred for about 1 h in an excess of iodine. Finally, washing with acetonitrile to remove iodide, filtering and drying under vacuum produce gray shinny platelets of lateral extension of few millimeters and few 100 m thickness.
These platelets were exfoliated onto thin Pt films (1 nm tickness) deposited onto Ta thin films (10 nm thickness) sputtered on Si wafers. These substrates conveniently evacuate the electron current induced during measurements performed under the electron beam of the SEM, and mitigate charging effects that otherwise make measurements very cumbersome. The samples were analyzed prior to any thermal treatment (pristine) and after successive thermal annealings. The time spent in atmospheric conditions was minimized to typically few hours.
Focused Kerr magnetometry was performed using a home-made setup. This setup includes a He-Ne laser (632 nm) with 0.3 mW power and a 100 objective focusing the laser beam with (linear) polarization to a 1 m diameter spot on the sample surface. The reflected beam goes through a Wollaston prism beam splitter producing two beams, with orthogonal polarization, and whose intensity is measured with two identical photodiodes. An oscilloscope is used to acquire the sum of the two corresponding signals during sweeps (1-2 Hz frequency, 100 sweeps typically used to improve the signal-to-noise ratio) of an external applied magnetic field. The field was applied using two kinds of electromagnets, a small horseshoe one and a linear solenoid, producing in-plane () and out-of-plane () magnetic fields, respectively. The perpendicular loops were measured in polar MOKE configuration, with the incoming and reflected laser beam perpendicular to the sample surface. The in-plane loops were measured by moving the laser beam out of the center of the objective, leading to an angle of about 20∘ between the incoming laser beam and the normal to the sample surface. This is thus not an optimal LMOKE configuration. In order to avoid polar and longitudinal Kerr signals in this geometry it was important to accurately align the applied in-plane magnetic field. With only an in-plane field, the component of the magnetization perpendicular to the surface should not change upon sweeping the field and no varying polar Kerr signal should be observed. For the data shown in Figure 4 and Figure 5, a linear contribution versus applied magnetic field, corresponding to the Faraday rotation through the optics, has been subtracted.
Raman spectra were acquired using a Witec Alpha 500 Raman microscope with a 532 nm laser (power set to 0.4 mW to ensure that samples are not damaged) focused with a 50 objective (Mitutoyo, NA=0.75) to a 1 m-wide spot. To access to low-wavenumber ranges such as needed to characterise -CrTe2, the optical detection line was equipped with a Rayshield coupler. The spectrometer was mounted with a 1800 lines/mm grating, with which a spectral resolution 0.1 cm-1 was possible. Acquisition of the spectra was done with typically 60 s integration time and typically three accumulations. Measurements were performed at room temperature for samples sealed within Ar-filled quartz cells (Figure 2f,g) and samples having experienced various thermal treatments, outside of the Ar-filled quartz cells.
SEM imaging, combined with EBSD and EDS micro-analyses, were performed over about 10 full exfoliated flakes with a field-emission-gun FE-SEM Zeiss Ultra Plus instrument (see more details in Supporting Information Section S5). Energy-dispersive X-ray data were acquired on several locations of each flake, with a Bruker silicon drift detector (SDD) using electron energies of 12 keV, 15 keV and 20 keV. Secondary electron imaging was performed with an Everhart & Thornley detector at 15 keV. Quantitative micro-analysis was achieved by comparing the X-ray emission line intensities to those measured with standard materials, namely pure Cr, Te, Si, Pt Ta, and for K using the KTiOPO4 compound. The data were analysed using the StrataGEM software 48, taking into account the presence of the substrate and deriving the composition and flake thickness by comparison of the -ratios as function of electron beam energy to simulated values. To obtain satisfactory fits of the simulated values to the experimental -ratios, no global scale factor was needed and only the thickness and composition of the flakes and substrate were free fit parameters. The flake thicknesses evaluated from this analysis were found to be very consistent with the AFM estimates. For EBSD data-processing and analysis, Oxford softwares (Tango & Mambo) were used.
Atomic force microscopy was done at room temperature in ambiant conditions, using a Veeco Dimension 3100 apparatus operated in tapping mode with OMCL-AC160TS probes.
1 Author Information
*E-mail: johann.coraux@neel.cnr.fr
2 Associated Content
The authors declare no competing financial interest.
We thank Simon Le Denmat for assistance in the AFM measurements. We warmly thank Michel Hehn for providing the Pt/Ta/Si substrates. This work was supported by the Agence Nationale de la Recherche through projects No. ANR-17-CE24-0007-03 ‘Bio-Ice’ and ANR-19-CE24-0021 ‘ANETHUM’, and under the program ESR/EquipEx+ (grant number ANR-21-ESRE-0025).
Supporting information comprises a Raman spectroscopy analysis as function of the annealing temperature for one of the two flakes analyzed in Figure 2, an AFM and SEM-EBSD study of an additional flake after 500 K annealing, an analysis of the vibrational, composition and magnetic properties of a commercially-available material, and a survey of the possible Cr-Te compounds and their structure/composition.
References
- Lee et al. 2016 Lee, J.-U.; Lee, S.; Ryoo, J. H.; Kang, S.; Kim, T. Y.; Kim, P.; Park, C.-H.; Park, J.-G.; Cheong, H. Ising-Type Magnetic Ordering in Atomically Thin FePS3. Nano Lett. 2016, 16, 7433–7438
- Wang et al. 2016 Wang, X.; Du, K.; Liu, Y. Y. F.; Hu, P.; Zhang, J.; Zhang, Q.; Owen, M. H. S.; Lu, X.; Gan, C. K.; Sengupta, P.; Kloc, C.; Xiong, Q. Raman Spectroscopy of Atomically Thin Two-Dimensional Magnetic Iron Phosphorus Trisulfide (FePS3) Crystals. 2D Mater. 2016, 3, 031009
- Huang et al. 2017 Huang, B.; Clark, G.; Navarro-Moratalla, E.; Klein, D. R.; Cheng, R.; Seyler, K. L.; Zhong, D.; Schmidgall, E.; McGuire, M. A.; Cobden, D. H.; Yao, W.; Xiao, D.; Jarillo-Herrero, P.; Xu, X. Layer-Dependent Ferromagnetism in a van der Waals Crystal Down to the Monolayer limit. Nature 2017, 546, 270–273
- Gong et al. 2017 Gong, C.; Li, L.; Li, Z.; Ji, H.; Stern, A.; Xia, Y.; Cao, T.; Bao, W.; Wang, C.; Wang, Y.; Qiu, Z. Q.; Cava, R. J.; Louie, S. G.; Xia, J.; Zhang, X. Discovery of Intrinsic Ferromagnetism in Two-Dimensional van der Waals Crystals. Nature 2017, 546, 265–269
- Gibertini et al. 2019 Gibertini, M.; Koperski, M.; Morpurgo, A.; Novoselov, K. Magnetic 2D Materials and Heterostructures. Nat. Nanotechnol. 2019, 14, 408–419
- Wang et al. 2022 Wang, Q. H.; Bedoya-Pinto, A.; Blei, M.; Dismukes, A. H.; Hamo, A.; Jenkins, S.; Koperski, M.; Liu, Y.; Sun, Q.-C.; Telford, E. J.; Kim, H. H.; Augustin, M.; Vool, U.; Yin, J.-X.; Li, L. H.; Falin, A.; Dean, C. R.; Casanova, F.; Evans, R. F. L.; Chshiev, M.; Mishchenko, A.; Petrovic, C.; He, R.; Zhao, L.; Tsen, A. W.; Gerardot, B. D.; Brotons-Gisbert, M.; Guguchia, Z.; Roy, X.; Tongay, S.; Wang, Z.; Hasan, M. Z.; Wrachtrup, J.; Yacoby, A.; Fert, A.; Parkin, S.; Novoselov, K. S.; Dai, P.; Balicas, L.; Santos, E. J. G. The Magnetic Genome of Two-Dimensional van der Waals Materials. ACS Nano 2022, 16, 6960–7079
- Han et al. 2010 Han, J. H.; Zang, J.; Yang, Z.; Park, J.-H.; Nagaosa, N. Skyrmion Lattice in a Two-Dimensional Chiral Magnet. Phys. Rev. B 2010, 82, 094429
- Ding et al. 2019 Ding, B.; Li, Z.; Xu, G.; Li, H.; Hou, Z.; Liu, E.; Xi, X.; Xu, F.; Yao, Y.; Wang, W. Observation of Magnetic Skyrmion Bubbles in a van der Waals Ferromagnet Fe3GeTe2. Nano Lett. 2019, 20, 868–873
- Park et al. 2021 Park, T.-E.; Peng, L.; Liang, J.; Hallal, A.; Yasin, F. S.; Zhang, X.; Song, K. M.; Kim, S. J.; Kim, K.; Weigand, M.; Schütz, G.; Finizio, S.; Raabe, J.; Garcia, K.; Xia, J.; Zhou, Y.; Ezawa, M.; Liu, X.; Chang, J.; Koo, H. C.; Kim, Y. D.; Chshiev, M.; Fert, A.; Yang, H.; Yu, X.; Woo, S. Néel-Type Skyrmions and their Current-Induced Motion in van der Waals Ferromagnet-Based Heterostructures. Phys. Rev. B 2021, 103, 104410
- Sun et al. 2021 Sun, W.; Wang, W.; Zang, J.; Li, H.; Zhang, G.; Wang, J.; Cheng, Z. Manipulation of Magnetic Skyrmion in a 2D van der Waals Heterostructure via Both Electric and Magnetic Fields. Adv. Func. Mater. 2021, 31, 2104452
- Cenker et al. 2021 Cenker, J.; Huang, B.; Suri, N.; Thijssen, P.; Miller, A.; Song, T.; Taniguchi, T.; Watanabe, K.; McGuire, M. A.; Xiao, D.; Xiaodong, X. Direct Observation of Two-Dimensional Magnons in Atomically Thin CrI3. Nat. Phys. 2021, 17, 20–25
- Xing et al. 2017 Xing, W.; Chen, Y.; Odenthal, P. M.; Zhang, X.; Yuan, W.; Su, T.; Song, Q.; Wang, T.; Zhong, J.; Jia, S.; Xie, X. C.; Yan, L.; Han, W. Electric Field Effect in Multilayer Cr2Ge2Te6: a Ferromagnetic 2D Material. 2D Mater. 2017, 4, 024009
- Deng et al. 2018 Deng, Y.; Yu, Y.; Song, Y.; Zhang, J.; Wang, N. Z.; Sun, Z.; Yi, Y.; Wu, Y. Z.; Wu, S.; Zhu, J.; Wang, J.; Chen, X. H.; Zhang, Y. Gate-Tunable Room-Temperature Ferromagnetism in Two-Dimensional Fe3GeTe2. Nature 2018, 563, 94–99
- Jiang et al. 2018 Jiang, S.; Shan, J.; Mak, K. F. Electric-Field Switching of Two-Dimensional van der Waals Magnets. Nat. Mater. 2018, 17, 406–410
- Jiang et al. 2018 Jiang, S.; Li, L.; Wang, Z.; Mak, K. F.; Shan, J. Controlling Magnetism in 2D CrI3 by Electrostatic Doping. Nat. Nanotechnol. 2018, 13, 549–553
- Wang et al. 2018 Wang, Z.; Zhang, T.; Ding, M.; Dong, B.; Li, Y.; Chen, M.; Li, X.; Huang, J.; Wang, H.; Zhao, X.; Li, Y.; Li, D.; Jia, C.; Sun, L.; Guo, H.; Ye, Y.; Sun, D.; Chen, Y.; Yang, T.; Zhang, J.; Ono, S.; Han, Z. H.; Zhang, Z. Electric-Field Control of Magnetism in a Few-Layered van der Waals Ferromagnetic Semiconductor. Nat. Nanotechnol. 2018, 13, 554–559
- Ciorciaro et al. 2020 Ciorciaro, L.; Kroner, M.; Watanabe, K.; Taniguchi, T.; Imamoglu, A. Observation of Magnetic Proximity Effect Using Resonant Optical Spectroscopy of an Electrically Tunable MoSe2/CrBr3 Heterostructure. Phys. Rev. Lett. 2020, 124, 197401
- Zhang et al. 2020 Zhang, L.; Huang, X.; Dai, H.; Wang, M.; Cheng, H.; Tong, L.; Li, Z.; Han, X.; Wang, X.; Ye, L.; Han, J. Proximity-Coupling-Induced Significant Enhancement of Coercive Field and Curie Temperature in 2D van der Waals Heterostructures. Adv. Mater. 2020, 32, 2002032
- Tian et al. 2020 Tian, C.; Pan, F.; Xu, S.; Ai, K.; Xia, T.; Cheng, P. Tunable Magnetic Properties in van der Waals Crystals (Fe1-xCox)5GeTe2. Appl. Phys. Lett. 2020, 116, 202402
- Yang et al. 2020 Yang, M.; Li, Q.; Chopdekar, R. V.; Stan, C.; Cabrini, S.; Choi, J. W.; Wang, S.; Wang, T.; Gao, N.; Scholl, A.; Tamura, N.; Hwang, C.; Wang, F.; Qiu, Z. Highly Enhanced Curie Temperature in Ga-Implanted Fe3GeTe2 van der Waals Material. Adv. Quantum Technol. 2020, 3, 2000017
- Wang et al. 2020 Wang, H.; Liu, Y.; Wu, P.; Hou, W.; Jiang, Y.; Li, X.; Pandey, C.; Chen, D.; Yang, Q.; Wang, H.; Wei, D.; Lei, N.; Kang, W.; Wen, L.; Nie, T.; Zhao, W.; Wang, K. L. Above Room-Temperature Ferromagnetism in Wafer-Scale Two-Dimensional van der Waals Fe3GeTe2 Tailored by a Topological Insulator. ACS Nano 2020, 14, 10045–10053
- Wang et al. 2020 Wang, M.; Kang, L.; Su, J.; Zhang, L.; Dai, H.; Cheng, H.; Han, X.; Zhai, T.; Liu, Z.; Han, J. Two-Dimensional Ferromagnetism in CrTe Flakes Down to Atomically Thin Layers. Nanoscale 2020, 12, 16427–16432
- Hashimoto et al. 1971 Hashimoto, T.; Hoya, K.; Yamaguchi, M.; Ichitsubo, I. Magnetic Properties of Single Crystals Cr2-δTe3. J. Phys. Soc. Japan 1971, 31, 679–682
- Bian et al. 2021 Bian, M.; Kamenskii, A. N.; Han, M.; Li, W.; Wei, S.; Tian, X.; Eason, D. B.; Sun, F.; He, K.; Hui, H.; Yao, F.; Sabirianov, R.; Bird, J. P.; Yang, C.; Miao, J.; Lin, J.; Crooker, S. A.; Hou, Y.; Zeng, H. Covalent 2D Cr2Te3 ferromagnet. Mater. Res. Lett. 2021, 9, 205–212
- Zhong et al. 2022 Zhong, J.; Wang, M.; Liu, T.; Zhao, Y.; Xu, X.; Zhou, S.; Han, J.; Gan, L.; Zhai, T. Strain-Sensitive Ferromagnetic Two-Dimensional Cr2Te3. Nano Res. 2022, 15, 1254–1259
- Lasek et al. 2022 Lasek, K.; Coelho, P. M.; Gargiani, P.; Valvidares, M.; Mohseni, K.; Meyerheim, H. L.; Kostanovskiy, I.; Zberecki, K.; Batzill, M. Van der Waals Epitaxy Growth of 2D Ferromagnetic Cr1+δTe2 Nanolayers with Concentration-Tunable Magnetic Anisotropy. Appl. Phys. Rev. 2022, 9, 011409
- Yamaguchi and Hashimoto 1972 Yamaguchi, M.; Hashimoto, T. Magnetic Properties of Cr3Te4 in Ferromagnetic Region. J. Phys. Soc. Japan 1972, 32, 635–638
- Chua et al. 2021 Chua, R.; Zhou, J.; Yu, X.; Yu, W.; Gou, J.; Zhu, R.; Zhang, L.; Liu, M.; Breese, M. B.; Chen, W.; Loh, K. P.; Feng, Y. P.; Yang, M.; Huang, Y. L.; Wee, A. T. S. Room Temperature Ferromagnetism of Monolayer Chromium Telluride with Perpendicular Magnetic Anisotropy. Adv. Mater. 2021, 33, 2103360
- Huang et al. 2021 Huang, M.; Gao, L.; Zhang, Y.; Lei, X.; Hu, G.; Xiang, J.; Zeng, H.; Fu, X.; Zhang, Z.; Chai, G.; Peng, Y.; Lu, Y.; Du, H.; Chen, G.; Zang, J.; Xiang, B. Possible Topological Hall Effect above Room Temperature in Layered Cr1.2Te2 Ferromagnet. Nano Lett. 2021, 21, 4280–4286
- Zhang et al. 2020 Zhang, L.-Z.; Zhang, A.-L.; He, X.-D.; Ben, X.-W.; Xiao, Q.-L.; Lu, W.-L.; Chen, F.; Feng, Z.; Cao, S.; Zhang, J.; Ge, J.-Y. Critical Behavior and Magnetocaloric Effect of the Quasi-Two-Dimensional Room-Temperature Ferromagnet Cr4Te5. Phys. Rev. B 2020, 101, 214413
- Wang et al. 2019 Wang, Y.; Yan, J.; Li, J.; Wang, S.; Song, M.; Song, J.; Li, Z.; Chen, K.; Qin, Y.; Ling, L.; Du, H.; Cao, L.; Luo, X.; Xiong, Y.; Sun, Y. Magnetic Anisotropy and Topological Hall Effect in the Trigonal Chromium Tellurides Cr5Te8. Phys. Rev. B 2019, 100, 024434
- Chen et al. 2022 Chen, C.; Chen, X.; Wu, C.; Wang, X.; Ping, Y.; Wei, X.; Zhou, X.; Lu, J.; Zhu, L.; Zhou, J.; Zhai, T.; Han, J.; Xu, H. Air-Stable 2D Cr5Te8 Nanosheets with Thickness-Tunable Ferromagnetism. Adv. Mater. 2022, 34, 2107512
- Tang et al. 2022 Tang, B.; Wang, X.; Han, M.; Xu, X.; Zhang, Z.; Zhu, C.; Cao, X.; Yang, Y.; Fu, Q.; Yang, J.; Li, X.; Gao, W.; Zhou, J.; Lin, J.; Liu, Z. Phase Engineering of Cr5Te8 with Colossal Anomalous Hall Effect. Nat. Elec. 2022, 5, 224–232
- Freitas et al. 2015 Freitas, D. C.; Weht, R.; Sulpice, A.; Remenyi, G.; Strobel, P.; Gay, F.; Marcus, J.; Núñez-Regueiro, M. Ferromagnetism in Layered Metastable 1T-CrTe2. J. Phys.: Condens. Matter 2015, 27, 176002
- Purbawati et al. 2020 Purbawati, A.; Coraux, J.; Vogel, J.; Hadj-Azzem, A.; Wu, N.; Bendiab, N.; Jegouso, D.; Renard, J.; Marty, L.; Bouchiat, V.; Sulpice, A.; Aballe, L.; Foerster, M.; Genuzio, F.; Locatelli, A.; Menteş, T. O.; Han, Z. V.; Sun, X.; Núñez Regueiro, M.; Rougemaille, N. In-Plane Magnetic Domains and Néel-Like Domain Walls in Thin Flakes of the Room Temperature CrTe2 van der Waals Ferromagnet. ACS Appl. Mater. Interfaces 2020, 12, 30702–30710
- Sun et al. 2020 Sun, X.; Li, W.; Wang, X.; Sui, Q.; Zhang, T.; Wang, Z.; Liu, L.; Li, D.; Feng, S.; Zhong, S.; Wang, H.; Bouchiat, V.; Núñez Regueiro, M.; Rougemaille, N.; Coraux, J.; Purbawati, A.; Hadj-Azzem, A.; Wang, Z.; Dong, B.; Wu, X.; Yang, T.; Yu, G.; Wang, B.; Han, Z.; Han, X.; Zhang, Z. Room Temperature Ferromagnetism in Ultra-Thin van der Waals Crystals of 1T-CrTe2. Nano Res. 2020, 13, 3358–3363
- Sun et al. 2021 Sun, Y.; Yan, P.; Ning, J.; Zhang, X.; Zhao, Y.; Gao, Q.; Kanagaraj, M.; Zhang, K.; Li, J.; Lu, X.; Yan, Y.; Li, Y.; Xu, Y.; He, L. Ferromagnetism in Two-Dimensional CrTe2 Epitaxial Films Down to a Few Atomic Layers. AIP Adv. 2021, 11, 035138
- Zhang et al. 2021 Zhang, X.; Lu, Q.; Liu, W.; Niu, W.; Sun, J.; Cook, J.; Vaninger, M.; Miceli, P. F.; Singh, D. J.; Lian, S.-W.; Chang, T.-R.; He, X.; Du, J.; He, L.; Zhang, R.; Bian, G.; Xu, Y. Room-Temperature Intrinsic Ferromagnetism in Epitaxial CrTe2 Ultrathin Films. Nat. Commun. 2021, 12, 1–9
- Meng et al. 2021 Meng, L.; Zhou, Z.; Xu, M.; Yang, S.; Si, K.; Liu, L.; Wang, X.; Jiang, H.; Li, B.; Qin, P.; Zhang, P.; Wang, J.; Liu, Z.; Tang, P.; Ye, Y.; Zhou, W.; Bao, L.; Gao, H.-J.; Gong, Y. Anomalous Thickness Dependence of Curie Temperature in Air-Stable Two-Dimensional Ferromagnetic 1T-CrTe2 Grown by Chemical Vapor Deposition. Nat. Commun. 2021, 12, 1–8
- Fabre et al. 2021 Fabre, F.; Finco, A.; Purbawati, A.; Hadj-Azzem, A.; Rougemaille, N.; Coraux, J.; Philip, I.; Jacques, V. Characterization of Room-Temperature In-Plane Magnetization in Thin Flakes of CrTe2 With a Single-Spin Magnetometer. Phys. Rev. Mater. 2021, 5, 034008
- Xian et al. 2022 Xian, J.-J.; Wang, C.; Nie, J.-H.; Li, R.; Han, M.; Lin, J.; Zhang, W.-H.; Liu, Z.-Y.; Zhang, Z.-M.; Miao, M.-P.; Yi, Y.; Wu, S.; Chen, X.; Han, J.; Xia, Z.; Ji, W.; Fu, Y.-S. Spin Mapping of Intralayer Antiferromagnetism and Field-Induced Spin Reorientation in Monolayer CrTe2. Nat. Commun. 2022, 13, 1–9
- Sekine et al. 1980 Sekine, T.; Nakashizu, T.; Toyoda, K.; Uchinokura, K.; Matsuura, E. Raman Scattering in Layered Compound 2H-WS2. Solid State Commun. 1980, 35, 371–373
- Fu et al. 2021 Fu, B.; Bao, X.; Deng, H.; Zhang, M. Redetermination the Basic Cell Trigonal Cr5Te8 Single Crystal Structure and its Temperature Dependence Raman Spectra. J. Solid State Chem. 2021, 300, 122222
- Li et al. 2022 Li, B.; Deng, X.; Shu, W.; Cheng, X.; Qian, Q.; Wan, Z.; Zhao, B.; Shen, X.; Wu, R.; Shi, S.; Zhang, H.; Zhang, Z.; Yang, X.; Zhang, J.; Zhong, M.; Xia, Q.; Li, J.; Liu, L., Yuan Liao; Ye, Y.; Dai, L.; Peng, Y.; Li, B.; Duan, X. Air-Stable Ultrathin Cr3Te4 Nanosheets with Thickness-Dependent Magnetic Biskyrmions. Mater. Today 2022,
- Saha et al. 2022 Saha, R.; Meyerheim, H. L.; Göbel, B.; Hazra, B. K.; Deniz, H.; Mohseni, K.; Antonov, V.; Ernst, A.; Knyazev, D.; Bedoya-Pinto, A.; Mertig, I.; Parkin, S. S. P. Observation of Néel-Type Skyrmions in Acentric Self-Intercalated Cr1+δTe2. Nat. Commun. 2022, 13, 1–7
- Li et al. 2022 Li, R.; Nie, J.-H.; Xian, J.-J.; Zhou, J.-W.; Lu, Y.; Miao, M.-P.; Zhang, W.-H.; Fu, Y.-S. Planar Heterojunction of Ultrathin CrTe3 and CrTe2 van der Waals Magnet. ACS Nano 2022, 16, 4348–4356
- Yao et al. 2022 Yao, J.; Wang, H.; Yuan, B.; Hu, Z.; Wu, C.; Zhao, A. Ultrathin Van der Waals Antiferromagnet CrTe3 for Fabrication of In-Plane CrTe3/CrTe2 Monolayer Magnetic Heterostructures. Adv. Mater. 2022, 2200236
- Pouchou and Pichoir 1991 Pouchou, J.-L.; Pichoir, F. Electron Probe Quantitation; Springer, 1991; pp 31–75