11email: timothy.vanreeth@kuleuven.be 22institutetext: Kavli Institute for Theoretical Physics, University of California, Santa Barbara, CA 93106, USA 33institutetext: Department of Astrophysics, IMAPP, Radboud University Nijmegen, P. O. Box 9010, 6500 GL Nijmegen, the Netherlands 44institutetext: Astrophysics Group, Keele University, Staffordshire ST5 5BG, UK 55institutetext: TAPIR, Mailcode 350-17, California Institute of Technology, Pasadena, CA 91125, USA
Tidally perturbed g-mode pulsations
in a sample of close eclipsing binaries††thanks: The reduced and analysed datasets are also available in electronic form at \hrefhttps://doi.org/10.5281/zenodo.7555868https://doi.org/10.5281/zenodo.7555868.
Abstract
Context. Thanks to the high-precision photometry from space missions such as Kepler and TESS, tidal perturbations and tilting of pulsations have been detected in more than a dozen binary systems. However, only two of these were gravity-mode (g-mode) pulsators.
Aims. We aim to detect tidally perturbed g modes in additional binary systems and characterise them observationally.
Methods. We perform a custom data reduction of the available Kepler and TESS photometry of a well-studied, published sample of 35 binary systems with Doradus ( Dor) pulsators. For each target, we model the binary signal using a sum of 100 sine waves, with frequencies at orbital harmonics, and measure significant pulsation frequencies in an iterative prewhitening analysis of the residual light curve. Pulsations are labelled as tidally perturbed g modes if they are part of both period-spacing patterns and multiplets spaced by integer multiples of the orbital frequency. After visual inspection and confirmation, the properties of these targets and g modes are characterised.
Results. We detect tidally perturbed g-mode pulsations for five short-period binaries that are circularised and (almost) synchronously rotating: KIC 3228863, KIC 3341457, KIC 4947528, KIC 9108579, and KIC 12785282. Tidally perturbed g modes that occur within the same star and have the same mode identification (,), are found to have near-identical relative amplitude and phase modulations, which are within their respective uncertainties also identical for the Kepler and TESS photometric passbands. By contrast, pulsations with different mode identification (,) are found to exhibit different modulations. Moreover, the observed amplitude and phase modulations are correlated, indicating that the binary tides primarily distort the g-mode amplitudes on the stellar surface. The phase modulations are then primarily a geometric effect of the integration of the stellar flux over the visible stellar surface. All selected binaries also exhibit signal that resembles rotational modulation in the Fourier domain. In the case of KIC 3228863, this is caused by the presence of the known tertiary component, and for the other systems we hypothesise that it is caused by temperature variations on the stellar surface. Alternatively, the signal can be overstable convective modes in the stellar core or belong to the non-pulsating companion.
Conclusions. While g-mode pulsation periods are known to be a direct probe of the deep interior stellar structure, the binary tides which cause the pulsation modulations are dominant in the outer stellar layers. Hence, in future tidally perturbed g modes may allow us to do core-to-surface asteroseismic modelling of tidally distorted stars.
Key Words.:
asteroseismology – stars: binaries: eclipsing – stars: oscillations (including pulsations) – stars: starspots – stars: rotation1 Introduction
Thanks to the near-continuous time series of high-precision photometry from space missions such as CoRoT (Auvergne et al. 2009), Kepler (Koch et al. 2010), and TESS (Ricker et al. 2015), there has been substantial progress in the field of observational asteroseismology, the study of the interior stellar structure via the analysis of stellar pulsations (e.g. Aerts et al. 2010). In particular, there has been major progress in the study of gravity-mode (g-mode) pulsations, which have buoyancy as the dominant restoring force and are most sensitive to the near-core stellar properties for main-sequence stars. Here, g modes are present in Doradus ( Dor; ) stars (Kaye et al. 1999) and slowly pulsating B type (SPB; ) stars (Waelkens 1991). Because of their low amplitudes (usually mmag) and dense pulsation spectra with typical periods between 0.3 and 3 d, the advent of space missions gave a large boost to the detection and observational analysis of g-mode pulsators (e.g. Tkachenko et al. 2013; Van Reeth et al. 2015b; Li et al. 2020b; Garcia et al. 2022; Skarka et al. 2022).
In the asymptotic regime, where the g-mode pulsation frequency is much smaller than the Brunt-Väisälä frequency , the periods of g modes with consecutive radial order and identical mode geometry follow regular patterns, which facilitates the analysis and interpretation of the observations. In a non-rotating, non-magnetic, chemically homogeneous star with a convective core and radiative envelope, g modes with consecutive, high radial orders and mode identification are equidistantly spaced in period (Shibahashi 1979; Tassoul 1980). Here, in a non-rotating star, the meridional degree , where and indicate the spherical degree and azimuthal order, respectively. When chemical gradients are present inside a star, g modes can be trapped and are no longer equidistantly spaced in period, but exhibit deviations which scale with the steepness of the gradients (Miglio et al. 2008). In addition, stellar rotation causes the pulsation frequencies to shift. As a result, the observed period spacings decrease with increasing radial order for prograde (with ) and zonal modes (with ), while for retrograde modes () they mostly increase (e.g. Bouabid et al. 2013). Using the framework of the traditional approximation of rotation (TAR; Eckart 1960; Lee & Saio 1987; Bildsten et al. 1996; Mathis 2009), this characteristic has been exploited in multiple studies (e.g. Van Reeth et al. 2016; Ouazzani et al. 2017; Christophe et al. 2018; Li et al. 2020b; Takata et al. 2020b; Pedersen et al. 2021) to measure the near-core rotation rate and the buoyancy travel time
| (1) |
of stars with g-mode pulsations, where and indicate the radial boundaries of the g-mode pulsation cavity. Furthermore, in moderate- to fast-rotating stars, g-mode pulsations can occur in the sub-inertial regime, where the pulsation frequency in the co-rotating frame . In this case, the Coriolis force confines the g-mode pulsations to a band around the stellar equator, which is more narrow when the star is rotating faster, and the pulsations are called gravito-inertial modes. In addition, the Coriolis force contributes to the restoring force of pulsations with or . Pulsations which have the Coriolis force as the dominant restoring force are indicated with and are called inertial modes. Among these, global retrograde inertial modes or r modes are the most often observed and well-studied (e.g. Saio et al. 2018; Takata et al. 2020a).
Based on these theoretical frameworks, a lot of effort has been done to model such observed g-mode pulsators, improving our understanding of the deep interior structure of these stars and their evolution (e.g. Aerts 2021). Recent results of these studies include the measurement of opacity and pulsation mode excitation (e.g. Szewczuk & Daszyńska-Daszkiewicz 2018; Szewczuk et al. 2021, 2022), convective core masses and sizes (e.g. Mombarg et al. 2021), mixing efficiency in the radiative envelopes (e.g. Pedersen et al. 2021), inference of interior magnetic field strengths (Buysschaert et al. 2018; Lecoanet et al. 2022), and constraints on the convective boundary stiffness (Aerts et al. 2021). In turn, these successes are fuelling further efforts to improve upon the existing theoretical frameworks, such as refining the near-core (Michielsen et al. 2019; Bowman & Michielsen 2021) and extra mixing processes in the radiative envelope (e.g. Rogers 2015; Ratnasingam et al. 2020; Mombarg et al. 2022), calculating the coupling between inertial- and gravity-mode pulsations (Ouazzani et al. 2020; Saio et al. 2021; Tokuno & Takata 2022), and expanding the TAR to include magnetic fields (Prat et al. 2019, 2020; Van Beeck et al. 2020; Dhouib et al. 2022) and the centrifugal acceleration (Henneco et al. 2021; Dhouib et al. 2021a, b).
The diagnostic power of asteroseismology increases when it is combined with complementary constraints from other analysis methods, such as the study of binary stars. In eclipsing binaries with time series of spectroscopic observations (Southworth 2020) or light travel time variations (Hey et al. 2020), the orbital solutions allow us to precisely determine the stellar radii and masses. Hence, in the case of binaries with sufficiently wide orbits, where the effects of tides and mass transfer on the stellar evolution can be ignored, this breaks the degeneracy between some of the model parameters that are considered in the asteroseismic modelling (e.g. Johnston et al. 2019; Murphy et al. 2021; Sekaran et al. 2021). Meanwhile, in pulsating close binaries that have undergone mass transfer, asteroseismology can be used to complement the information from the binarity and help constrain the stellar properties (e.g. Guo & Li 2019). Stellar pulsations can also be excited by tides (e.g. Fuller 2017; Hambleton et al. 2018; Cheng et al. 2020) or couple to them (e.g. Burkart et al. 2012, 2014; Weinberg et al. 2013; Li et al. 2020a; Guo et al. 2022), which can then result in additional angular momentum transport (e.g. Fuller 2021). However, such processes are not yet well understood (see Guo 2021, for a recent review).
Tidal perturbations of pulsations (e.g. Hambleton et al. 2013; Balona 2018; Bowman et al. 2019; Southworth et al. 2020, 2021; Steindl et al. 2021; Johnston et al. 2022), which occur in close binaries that are circularised and (quasi-)synchronously rotating (Guo 2021), are a prime example of such lesser understood interactions. Here, strong tides modify the mode cavities inside the pulsating star, which in turn results in perturbed pulsations. A subset of these, called the tidally tilted pulsators, have received much attention in the literature lately (e.g. Handler et al. 2020; Kurtz et al. 2020; Rappaport et al. 2021; Lee 2021a; Kahraman Aliçavuş et al. 2022; Jayaraman et al. 2022). For tidally tilted pulsators, the tidal influence on the pulsations consists of three main effects: (i) tidal trapping, whereby the pulsation is confined to a specific part of the star, (ii) tidal alignment, whereby the pulsation is tilted, and has the tidal axis as its symmetry axis rather than the stellar rotation axis, and (iii) tidal amplification, whereby the pulsation mode amplitude is larger on part of the stellar surface (Fuller et al. 2020).
Recently, tidal perturbations of g-mode pulsations were observed by Jerzykiewicz et al. (2020) and Van Reeth et al. (2022b) for the SPB star in Ori and the Dor star in V456 Cyg, respectively. Since tides are dominant in the outer stellar layers and g-modes are most sensitive to the near-core stellar properties, these were unexpected observations. In this paper we reanalyse a sample of 35 ellipsoidal and eclipsing binaries with Dor-type pulsators observed by the Kepler mission, and g-mode patterns detected and analysed by Li et al. (2020a), with the aim of detecting and characterising new close binaries that exhibit tidally perturbed g-mode pulsations. Since all of these targets have up to 4 yr of high-precision Kepler photometry, this allows us to study the phenomenon in much more detail than for either Ori or V456 Cyg. Below we describe our data collection and reduction (Sect. 2), as well as the methods used to analyse the binarity, g modes, tidal perturbations and rotational-modulation-like variability (Sect. 3), before discussing the five most promising targets (Sect. 4). Finally, we characterise the tidal perturbations of g-mode pulsations (Sect. 5) and the rotational-modulation-like variability (Sect. 6) in close binaries with a Dor component, and give our conclusions in Sect. 7.
2 Observations
2.1 Kepler photometry
To ensure that the low-frequency instrumental variability in the analysed light curves is minimal and the measured g-mode variability is most precise, we performed a custom data reduction of the Kepler long-cadence target pixel files for the 35 Dor binaries studied by Li et al. (2020a), based on the data reduction process previously described by Pápics et al. (2013) and Tkachenko et al. (2013). First, we collected the target pixel files from DR 25 at the Mikulski Archive for Space Telescopes (MAST111\hrefhttps://archive.stsci.edu/https://archive.stsci.edu/). The light curves were then extracted from these pixel data using custom binary aperture masks, which were defined by evaluating the 85th percentile of the measured flux within each pixel to avoid outliers. Pixels were included in the aperture mask if the evaluated electron count exceeded a threshold of and did not form secondary local maxima within the mask. The light curves were then constructed by summing over the measured electron count rates within the aperture mask for each time stamp. Next, the data were converted to mmag, and detrended by fitting and subtracting a -order polynomial per quarter. To minimise the risk of overfitting the data and introducing a bias in this detrending step, it was done for all quarters simultaneously, whereby the different polynomial functions were fitted and optimised simultaneously with a sum of ten sine waves, which represented the dominant intrinsic variability of the studied target. For most of our targets, these sine waves had frequencies at integer multiples of the binary orbital frequency. Outliers were excluded from the light curves using clipping, and finally the quality of the reduced light curves was evaluated using visual inspection. Similar custom light-curve extraction approaches have been shown to provide the most robust asteroseismic results (Bowman & Michielsen 2021).
2.2 TESS photometry
To complement the Kepler photometry of the most interesting stars in the sample, we have also extracted light curves from -pixel cutouts from the TESS full frame images (FFI) for these targets, obtained with TessCut (Brasseur et al. 2019). Because the TESS photometric passband (600-1000 nm) is relatively redder than the Kepler passband (420-900 nm), the TESS light curves provide complementary information. However, they do not reach the same quality level. The TESS data cover shorter time spans and consist of separate 27-d sectors rather than years-long near-continuous observations. In addition, TESS was developed to observe brighter stars; the size of the individual pixels on the CCDs is much larger (21 arcseconds compared to 3.98 arcseconds for Kepler) making the observations more susceptible to contamination from nearby stars. And finally, there is a strong background flux in the TESS data, caused by sunlight scattered by the Earth.
Hence, additional steps were needed for the data reduction of the TESS observations. First, the background flux was estimated by calculating the 5th-percentile -count of the pixels in the selected CCD cutout, and subtracted from the measured -count in each of the pixels. This allowed us to avoid significant stellar contamination and measurement outliers. Second, the pixels of the aperture mask were selected using a cutoff above the median flux count as the threshold, and secondary maxima within the mask were again excluded. Then the remainder of the TESS data reduction was almost identical to that of the Kepler data. The light curves were extracted by summing over the flux counts of the pixels within the aperture mask, converted to mmag units, and detrended by subtracting a -order polynomial fit per orbital cycle of the TESS satellite. To avoid overfitting the detrending curve, the polynomial functions were again fitted and optimised simultaneously with a sum of ten sine waves, with frequencies equal to harmonics of the binary orbital frequency.
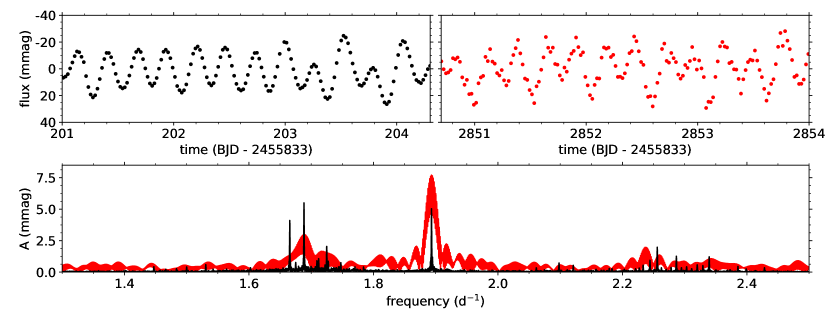
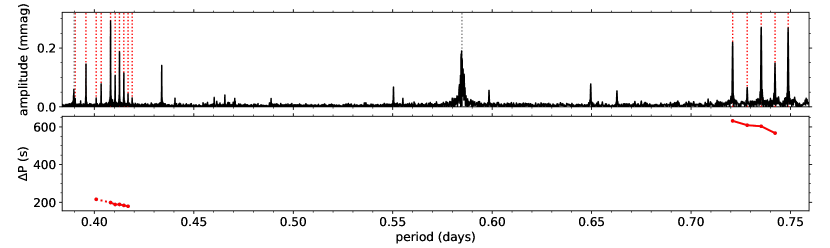
Despite these additional data reduction steps, the TESS data still do not reach the same quality level as the Kepler data, as illustrated in Fig. 1, and as a result have limited usage. Hence, throughout the rest of this work, the main analyses are based on the Kepler observations. The TESS observations are only used as a complementary source of information.
3 Data analysis
To identify targets with tidally perturbed g-mode pulsations, each of the light curves is analysed in the same systematic way. First, we model and subtract the binary signal from the light curve. Then we measure the frequencies of the independent g modes from the residual light curve, and finally we identify which of these g modes are tidally perturbed.
3.1 Binarity
First, we model the observed variability associated with the binary motion. However, for most of the binaries in our sample, there are no published radial velocities or spectroscopic observations available. As a result, we do not have the required information to build detailed physical binary models (e.g. Southworth 2020) for all stars in the sample. To ensure that all binaries are analysed homogeneously, we constructed a numerical model for the photometric binary variability using a sum of 100 sine waves
| (2) |
where is the cyclic orbital frequency, and and are the amplitude and phase of the orbital harmonic, respectively. While this model is limited by the highest-order orbital harmonic that is considered, it does not smear out the binary signal (see, e.g. Bowman et al. 2019), which could in turn modulate the observed pulsation signal. This risk does exist when the binary model is calculated by phase-folding and binning the light curve onto the orbit, as was done by for example Li et al. (2020a). Because our aim was to study the relation between the binarity and g modes, and we could benchmark our results against those presented by Li et al. (2020a), the harmonic model in Eq. (2) was best-suited to our work.
3.2 Pulsation analysis
Following the harmonic modelling, we first used iterative prewhitening to determine the frequencies of the g-mode variability in the residual light curve, hereafter referred to as the pulsation light curve. To minimise a potential bias of the measured g-mode pulsations caused by the partial occultation of the pulsation mode geometry, also called eclipse mapping (Reed et al. 2001, 2005; Johnston et al. 2022) or spatial filtering (Gamarova et al. 2003; Rodríguez et al. 2004; Gamarova et al. 2005), we limit this analysis to the out-of-eclipse parts of the light curves. In each iterative step, we calculated the Lomb-Scargle periodogram (Scargle 1982) from the residual light curve, and fitted and subtracted a sine wave with the dominant frequency from the pulsation light curve. This was done for all frequencies with an optimal signal-to-noise ratio based on statistical false-alarm simulations for Kepler data (Baran et al. 2015; Zong et al. 2016; Bowman & Michielsen 2021), where was calculated as the ratio between the amplitude of the fitted sine wave and the average amplitude of the residual Lomb-Scargle periodogram in a window around the frequency of that sine wave. Next, we filtered the derived frequency list, based on both an automated selection, whereby only frequencies which were dominant in a window were accepted (with being the frequency resolution; Loumos & Deeming 1978), and subsequent manual inspection. From the resulting list of pulsation frequencies , with corresponding amplitudes and phases , we built a light curve model
| (3) |
This model was then optimised with a non-linear fit to the pulsation light curve, using least-squares minimisation with the trust region reflective method, as implemented in the “least_squares” routine in lmfit222\hrefhttps://lmfit.github.io/lmfit-py/https://lmfit.github.io/lmfit-py/ (Newville et al. 2019). To ensure that the solution had properly converged, the parameter values were visually inspected and compared with those from the input model. Finally, we redetermined the values associated with the different frequencies.
Next, we searched for g-mode patterns, using the methodology outlined by Van Reeth et al. (2015a). We subsequently modelled these patterns with asymptotic g-mode series using the TAR, fitting the pulsation periods as a function of radial order (as done in, e.g. Li et al. 2020b; Van Reeth et al. 2022a) with the trust region reflective method, which allowed us to determine the mode geometries of the pulsations, the average near-core rotation rate and the buoyancy travel time of the pulsating star. Confidence intervals for and were calculated using a conservative limit (Takata et al. 2020b; Van Reeth et al. 2022a). These results were subsequently validated by comparing them with those from Li et al. (2020a).
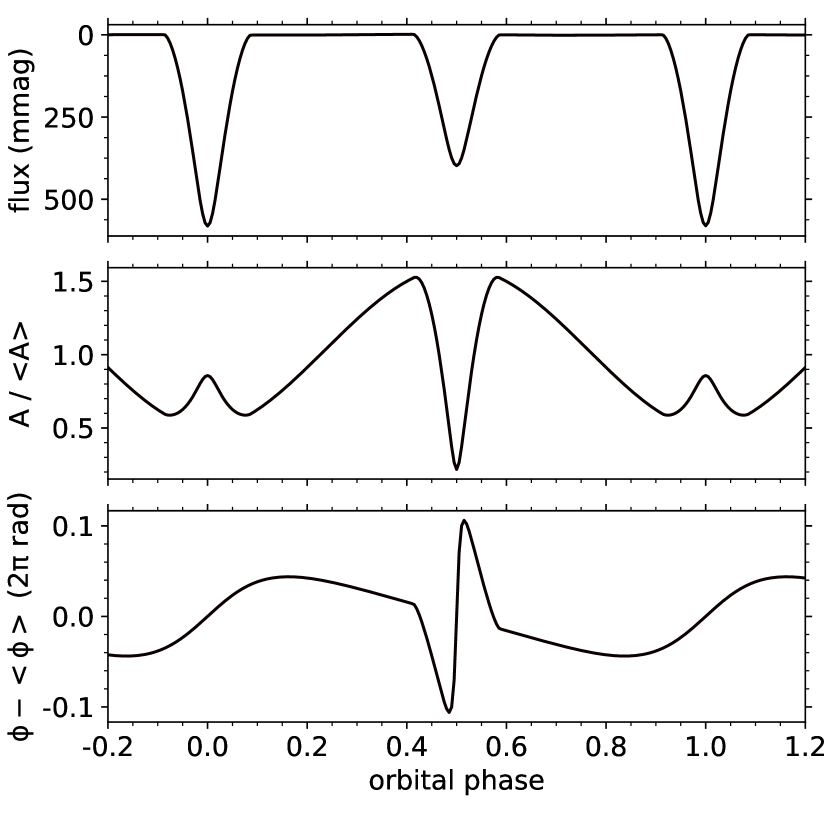
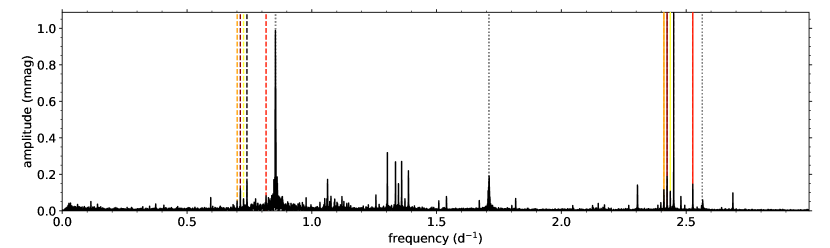
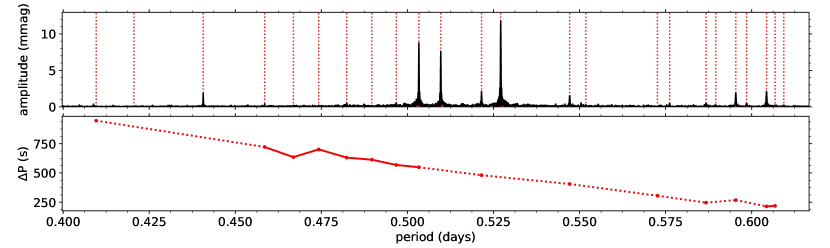
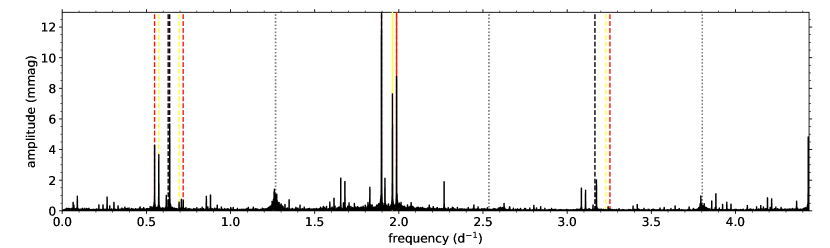
Different steps of this pulsation analysis are illustrated in Fig. 2 for KIC 3228863, one of the stars in our sample. As seen in the panel, there are strong residuals in the pulsation light curve during the eclipse phases, caused by eclipse mapping and light travel time variations (Lee et al. 2014, 2020). These can lead to the detection of additional frequencies during the iterative prewhitening routine, as shown in the panel of Fig. 2, which are avoided by excluding the eclipse phases from the analysis, as illustrated in the bottom panel of Fig. 2.
3.3 Tidal perturbations
In the next step, we identified which g-mode pulsations, if any, are tidally perturbed, by establishing if their frequencies are part of multiplets spaced by integer multiples of . In this work, this criterion is fulfilled if there is at least one prewhitened frequency for which
| (4) |
where and are the error margins on and , and . For each of these candidate perturbed g modes, we subsequently calculated the orbital-phase dependence of the modulations in two different ways. First, we reconstructed the tidal modulations from the detected spaced multiplets, using a semi-analytical model similar to the one developed by Jayaraman et al. (2022) as explained in Appendix A. Second, we phase-folded the pulsation light curve onto the binary orbit and divided the data points in 40 bins according to the orbital phase. Within each bin, we then refitted the light curve model to the observations, optimising the pulsation amplitudes and phases but keeping the frequencies fixed. The solutions from both methods were visually inspected and required to be consistent with each other.
We note that our detection criteria for tidal perturbation are very strict. This allows us to present and discuss unambiguous detections of this phenomenon in Section 4, but it is entirely possible that other stars in our sample also exhibit tidally perturbed pulsations, but did not fulfil our selection criteria.
3.4 Rotational-modulation-like variability
Finally, many stars in our sample exhibit rotational modulation or rotational-modulation-like signals, often at or around the orbital harmonics of the binary signal. They meet the detection criteria for rotational modulation that were defined by Van Reeth et al. (2018), but they also have relatively high amplitudes and can thus be identified by eye as well. There are multiple possible physical origins, many of which are not related to rotation and not fully understood, as explained later in Sect. 6. Physical modelling or a detailed understanding of this observed signal lies outside the scope of our work, but we provide an observational characterisation for the stars with detected tidally perturbed g modes.
To characterise the rotational-modulation-like signal and its time dependence, we have evaluated its amplitude as a function of time and the binary orbital phase. To this end, we have selected 100-d sections of the pulsation light curve using a sliding box. For each section, we then removed the light curve model , which we presented in Eq. (3), from the data, apart from the frequencies that are part of the rotational-modulation-like signal. For the stars in our sample, the rotational-modulation-like variability typically coincides with the orbital harmonics in the Lomb-Scargle periodogram, and measured frequencies are considered part of the signal if they lie within a 0.05 -window, centred on one of the orbital harmonics. This window width is sufficiently broad to cover the unresolved rotational-modulation-like peaks in the periodogram, but not overlap with the g-mode frequency ranges. We then phase-folded the residual light curve section with the orbital period, divided the data into 40 bins and calculated the median flux within each bin. To validate our results, we repeated this analysis for 200-d sections of the pulsation light curve, using measured pulsation frequencies with and 0.1 -windows around the rotational-modulation-like peaks in the periodogram. We then compared these results to ensure that they were not affected by any residual pulsation or harmonic signal, but for clarity the detailed discussion in Sect. 6 is limited to our first set of results.
4 Discussion of individual systems
Following the data analysis methodology described in the previous section, we detected tidally perturbed g-mode pulsations in 5 of the 35 sample targets of Li et al. (2020a). An overview of their derived parameter values is listed in Table 1, and each of them is discussed in detail below. Additional figures that illustrate the detections and complement the discussions below, are included in Appendix B.
| KIC 3228863 | KIC 3341457 | KIC 4947528 | KIC 9108579 | KIC 12785282 | V456 Cyg(1) | |
| TIC | 394179296 | 137094904 | 169560376 | 273583841 | 406997952 | 15795549 |
| eclipsing | y | n | n | n | y | y |
| (mag) | 11.816 | 13.873 | 13.910 | 11.560 | 13.518 | - |
| () | 1.36809332(4) | 1.8932976(5) | 2.0121190(1) | 0.85497202(16) | 1.26782902(13) | 1.122091(8) |
| () | 1.371(3) | 1.865(1) | 2.03(2) | 0.847(7) | 1.264(3) | 1.113(5) |
| (s) | 4370(100) | 3870(40) | 4390(310) | 4240(160) | 4214(30) | 4300(50) |
| pulsating component | primary | unknown | unknown | unknown | primary | secondary |
| 0 | 0 | 0 | 0 | 0 | 0 | |
| 1 | 1 | 1 | 1 | 1 | 1 | |
| -61 | -72 | -42 | -47 | -56 | -31 | |
| -28 | -41 | -21 | -40 | -19 | -18 | |
| 34 | 32 | 22 | 8 | 38 | 14 | |
| tidal perturbations | y | y | y | n | y | y |
| -2 | -2 | - | 0 | - | - | |
| -1 | -1 | - | 2 | - | - | |
| -24 | -53 | - | -61 | - | - | |
| -18 | -33 | - | -49 | - | - | |
| 7 | 21 | - | 13 | - | - | |
| tidal perturbations | n | y | - | y | - | - |
(1) studied by Van Reeth et al. (2022b)
4.1 KIC 3228863
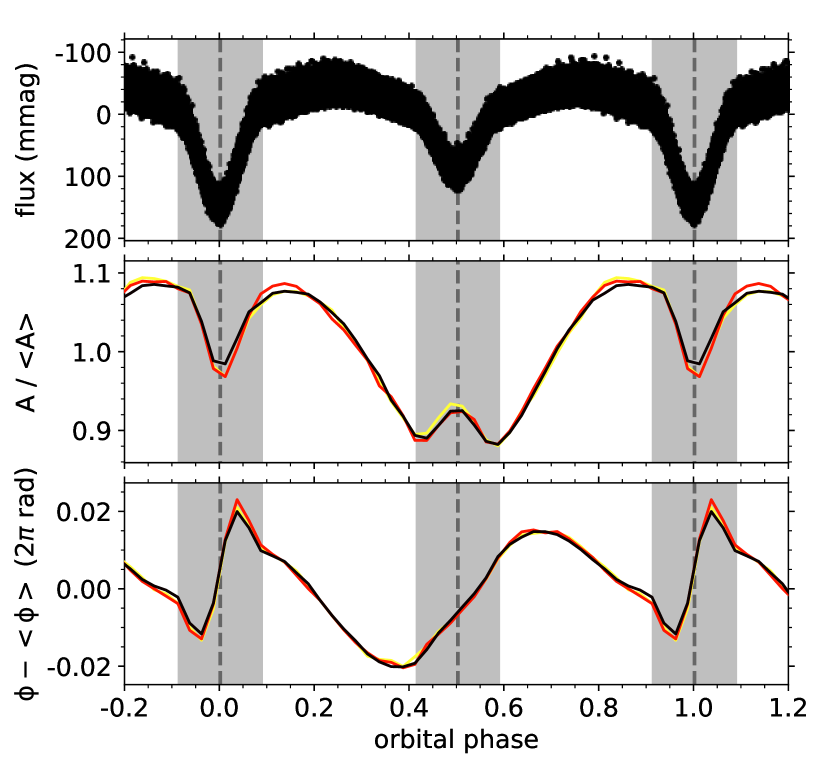
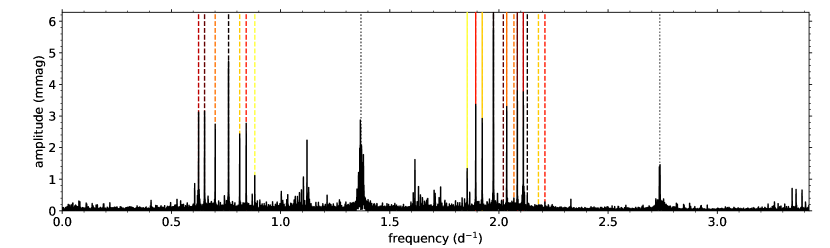
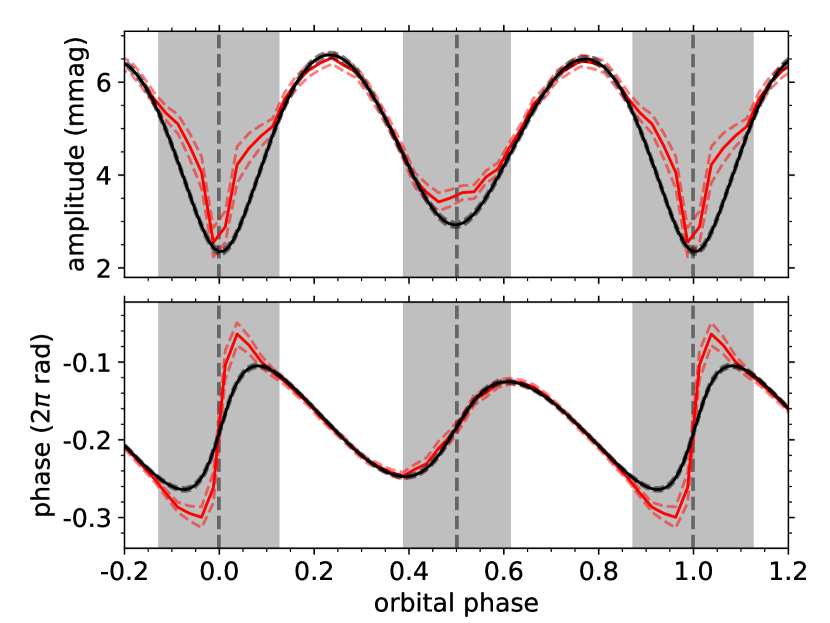
KIC 3228863 is one of the two eclipsing binary systems in our sample, as can be seen from the phase-folded light curve in the top panel of Fig. 3, where the grey areas indicate the orbital phases of the eclipses. It is a semi-detached binary, part of a quadruple system, and our only target with published radial velocities and orbital parameters (Lee et al. 2014, 2020). After the frequency analysis of the pulsation light curve from the Kepler space mission, we detected and modelled two period-spacing patterns for g-mode pulsations with mode identification and , respectively, in agreement with the results obtained by Li et al. (2020a). It shows that the near-core region of the primary is synchronously rotating () with the binary orbit () within the confidence intervals of the measured frequencies.
Using our strict criteria, explained in the previous section, we detected tidal perturbation of the seven most dominant modes. There are indications that at least some of the remaining independent g-mode pulsations, including those with , are also tidally perturbed, but these were not formally detected. Because our aim is to provide a clean detection and characterisation of tidally perturbed g modes, these remaining oscillations are therefore not discussed here.
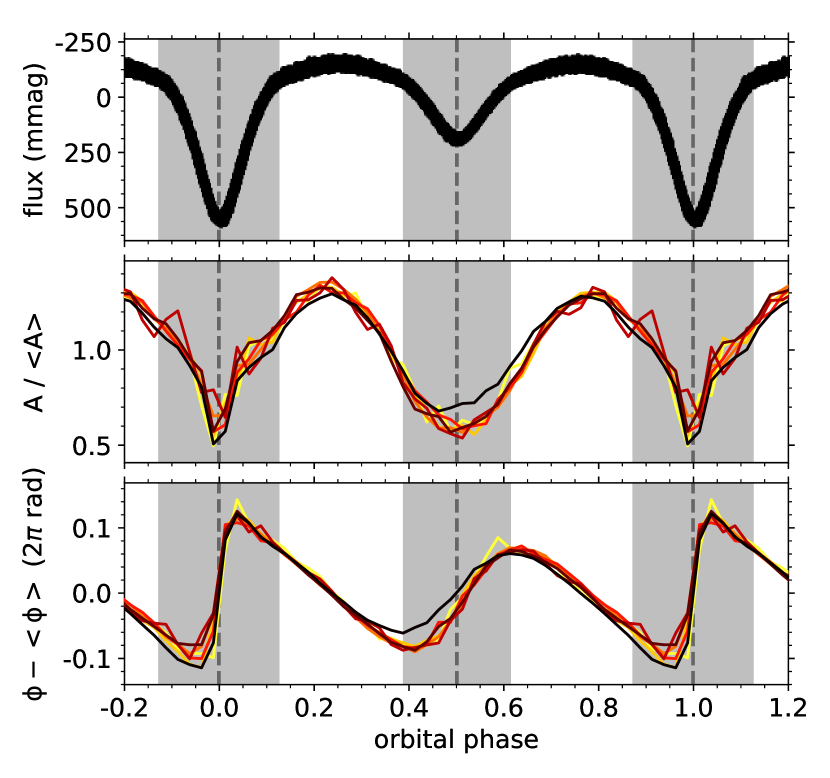
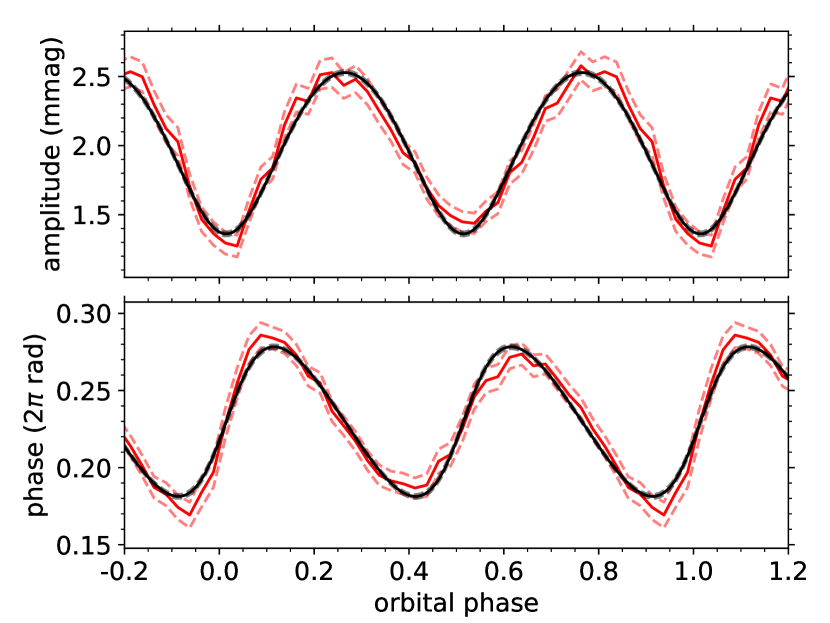
The observational signatures of the detected tidal perturbed pulsations are illustrated in Figs. 3 and 17 to 19. In these figures, we see a decrease (increase) in the observed pulsation amplitude during the primary (secondary) eclipse, as well as a saw-tooth signature in the pulsation phase modulation during the primary eclipse. These signatures are caused by eclipse mapping (Reed et al. 2001, 2005; Johnston et al. 2022), the partial occultation of the pulsation mode geometry, and indicate that the g-mode pulsations belong to the primary. This is in agreement with the conclusions from Lee et al. (2020), which were based on the locations of the binary components in the HR diagram. Interestingly, the correlation between the amplitude and phase modulations is qualitatively similar both during and out of the eclipses: when the pulsation amplitude is maximal, the pulsation phase decreases as a function of the orbital phase, and vice versa. Moreover, the observed tidal modulations of the seven dominant pulsations are similar. This is illustrated in Fig. 3, where we compare their relative amplitude and phase modulations, as calculated from the binned data analysis. Here, the modulations of the dominant pulsation are indicated in black, while the modulations for the smallest pulsation are shown in yellow. With the exception of the dominant pulsation, the relative modulations of the different pulsations agree with each other within their uncertainties.
4.2 KIC 3341457
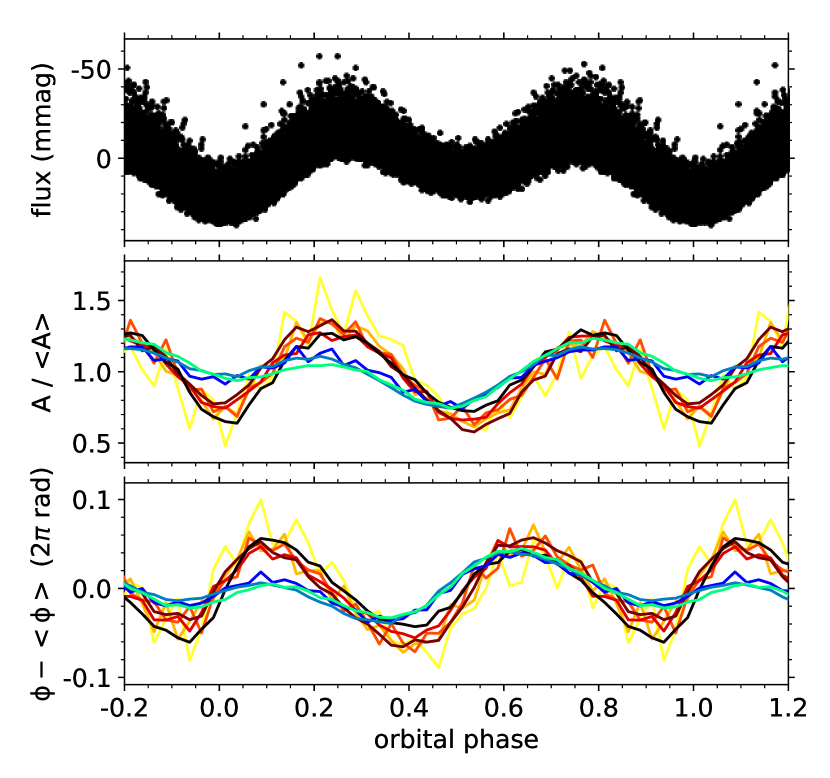
Contrary to KIC 3228863, we cannot assign the pulsations of KIC 3341457 to a specific component. This is a non-eclipsing, low-amplitude ellipsoidal variable, as can be seen from the top panel of Fig. 5. Because there are no eclipses, it is not possible to determine from the light curve which binary component is pulsating. Moreover, as there are no time series of high-resolution spectroscopy available for this target yet, we cannot place the binary components on the Hertzsprung-Russell diagram or measure their masses.
However, in agreement with Li et al. (2020a), we detected two g-mode patterns among the prewhitened pulsation frequencies, with mode identification and , respectively. From the asteroseismic analysis of these patterns, we found that the pulsating component is clearly rotating a bit slower (near-core rotation ) than the binary orbit (), making this the only target in our sample with clear asynchronous rotation.
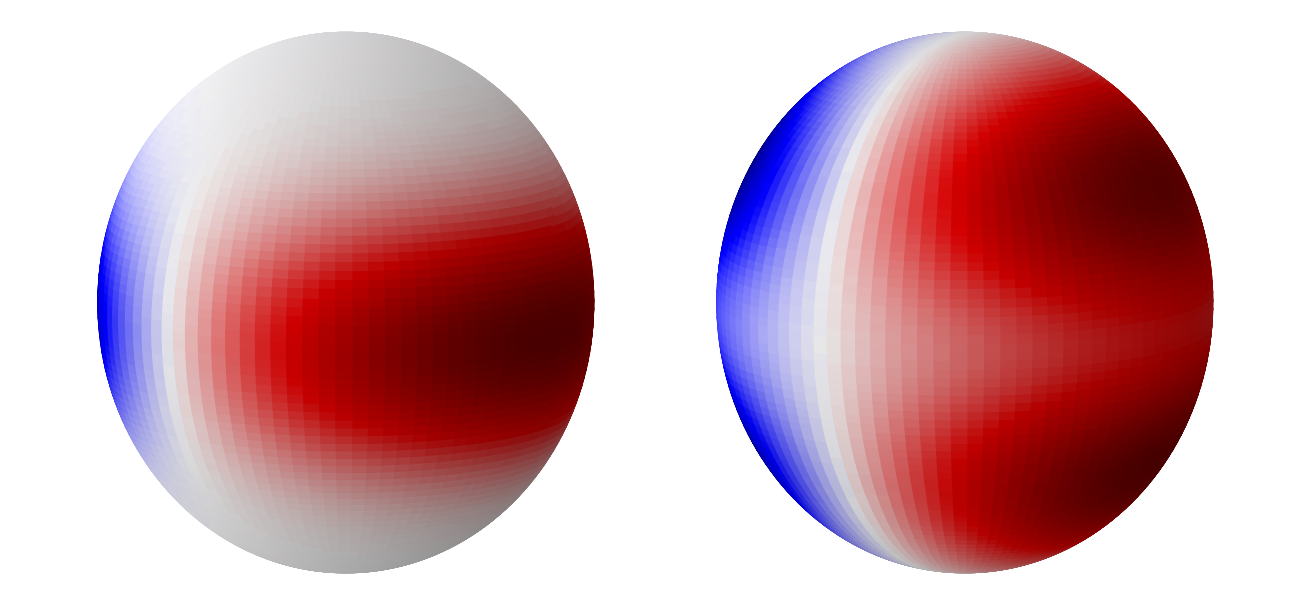
Moreover, as shown in the middle and bottom panels of Fig. 5, we have detected tidal perturbations of three r modes (with ) as well as six prograde dipole modes (). While the modulation morphology is again very similar for g modes with identical mode identification , there are clear differences for pulsations with different mode geometries. While pulsations with are (mostly) spheroidal and dominant near the equator, the r modes with are toroidal oscillations with dominant temperature variations at latitudes well above and below the equator (Saio et al. 2018), as illustrated in Fig. 5. As a result, both types of pulsations show different levels of sensitivity to the tidal deformation of the star, and as shown in Figs. 22 and 23, they have different morphologies as a function of the binary orbital phase. This proves that the pulsations do not merely scale with the tidal deformation of the pulsating star, but are effectively distorted.
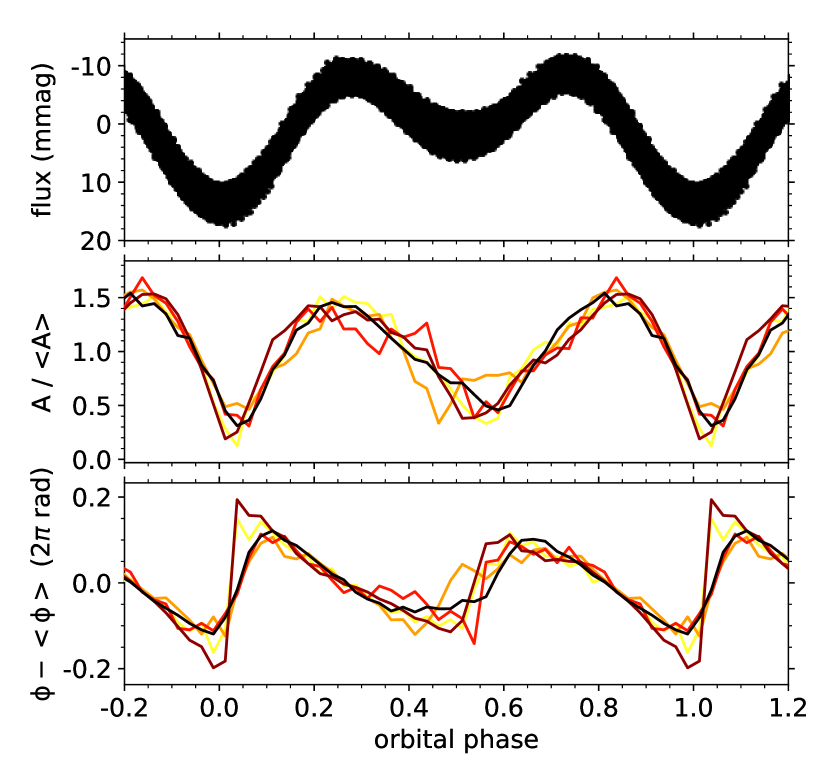
4.3 KIC 4947528
KIC 4947528 is the shortest-period binary in our sample. Similar to KIC 3341457, we do not have spectroscopic data and cannot identify which component is pulsating. However, based on our asteroseismic results we can confirm that the pulsating star is rotating synchronously (near-core rotation ) with the binary orbit () within the confidence intervals of the measured frequencies. The ten most dominant g modes, with , are clearly tidally perturbed, as illustrated in Figs. 6 and 24 to 26. The relative pulsation amplitude and phase modulations again agree with each other within their uncertainties, and similar to our observations for KIC 3228863 and KIC 3341457, the amplitudes and phases are correlated with each other.
4.4 KIC 9108579
KIC 9108579 is the only binary system in our selection with an orbital period of more than a day (). Just as for KIC 3341457 and KIC 4947528, the pulsating component in the system could not be identified. However, from our analysis of the detected pulsations, we again found that the pulsating star is rotating synchronously (near-core rotation ) within the confidence interval of the measured rotation frequency.
KIC 9108579 is the only target in our selection to clearly exhibit both prograde dipole () and quadrupole () g modes. Interestingly, while we could not formally detect tidal perturbations for any of the dipole modes, the five most dominant quadrupole modes exhibit tidal perturbations that are qualitatively similar to the tidal perturbations observed for the previous selected stars, as illustrated in Figs. 7 and 27 to 29. Within their confidence intervals, the relative amplitude and phase modulations of the different modes are again almost identical. We also note that, although the morphology of the amplitude modulations is similar to the ellipsoidal flux variations of the binary, which is comparable to the other binaries and as shown in Fig. 7, there is a large offset in orbital phase between them. While the ellipsoidal variability reaches its minima at orbital phases of 0.0 and 0.5, the minima of the amplitude modulations of the dominant pulsation are at orbital phases of 0.057 and 0.557.
4.5 KIC 12785282
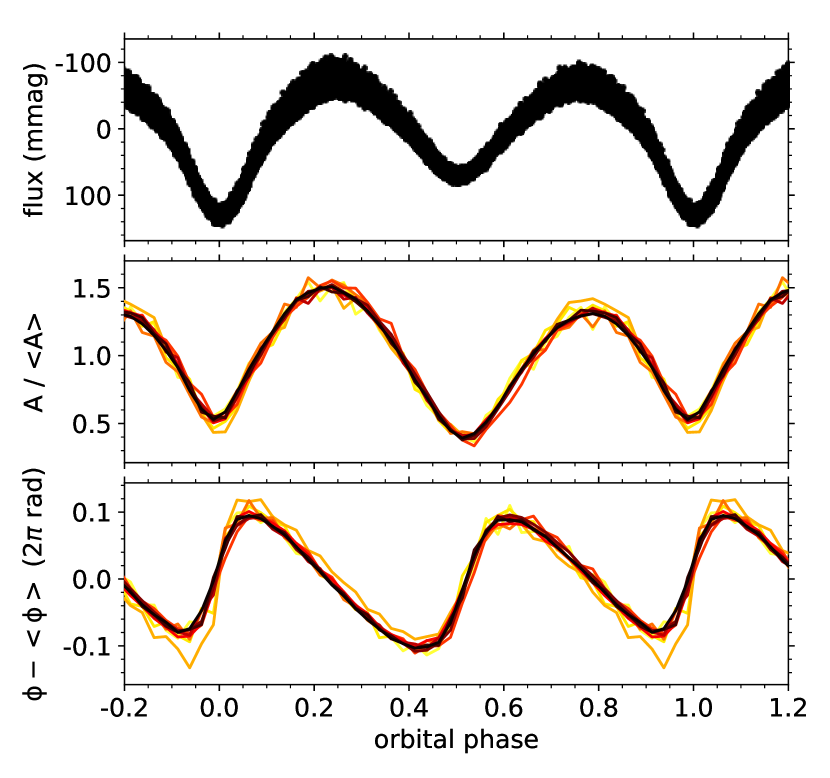
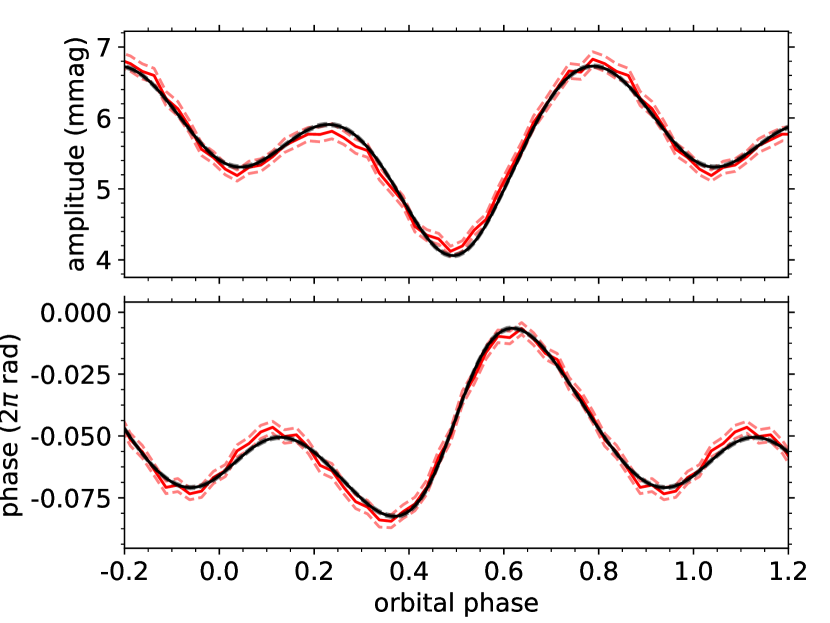
Our final target, KIC 12785282, is the second eclipsing binary system among our selected targets. Contrary to Li et al. (2020a), who detected a g-mode period-spacing pattern with mode identification spanning five radial orders, we found a much longer pattern spanning 38 radial orders. This allowed us to place much stronger constraints on the near-core rotation rate () of the pulsating star, and to confirm that it is also rotating synchronously () within the confidence intervals of the measured frequencies. However, in spite of the large number of identified pulsation modes in our period-spacing pattern, only the three dominant modes fulfilled our formal criteria for the detection of tidal perturbation. As illustrated in Figs. 8 and 31 to 32, their behaviour is consistent with what we have observed for our other selected stars. Moreover, the pulsation amplitude and phase modulations during the eclipses demonstrate that the primary component is the pulsating star, and that the g modes are amplified in the hemisphere facing the companion. This is similar to what was observed for V456 Cyg (Van Reeth et al. 2022b), although in that case the pulsating star was the secondary.
5 Characterisation of the tidally perturbed g-modes
Following the detailed individual analysis of all targets with tidally perturbed g-mode pulsations, there are clear similarities between these binary systems. They are very close, quasi-synchronised, circularised (Li et al. 2020a; Van Reeth et al. 2022b), and have an orbital period of the order of or less than a day. Moreover, the tidal g-mode perturbations themselves also have clear common features. Unfortunately, the number of tidally perturbed stars has proven to be too small for a successful statistical sample analysis, but even a qualitative description provides very useful insights into the physics behind them. First, the relative tidal perturbations of pulsations with the same mode identification are often almost identical. In other words, the perturbations are nearly independent of the intrinsic pulsation mode amplitudes, radial orders, and phases. However, tidal perturbations of g-mode pulsations with different mode identification within the same star can be very dissimilar, and there are clear observational differences between the stars as well.
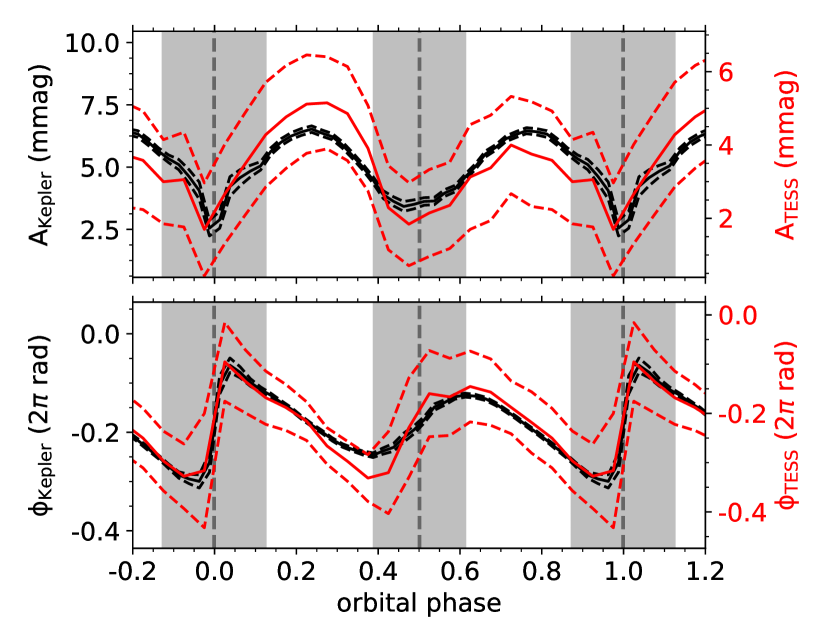
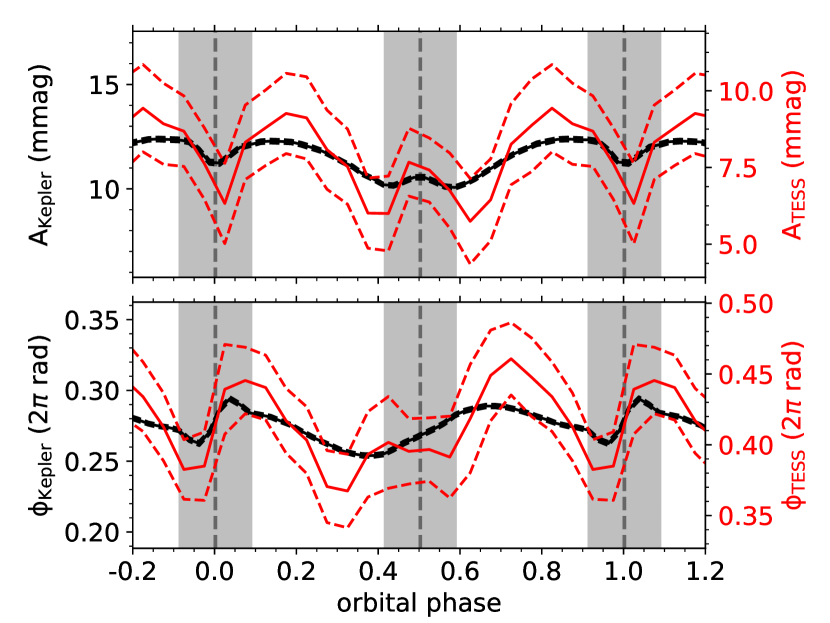
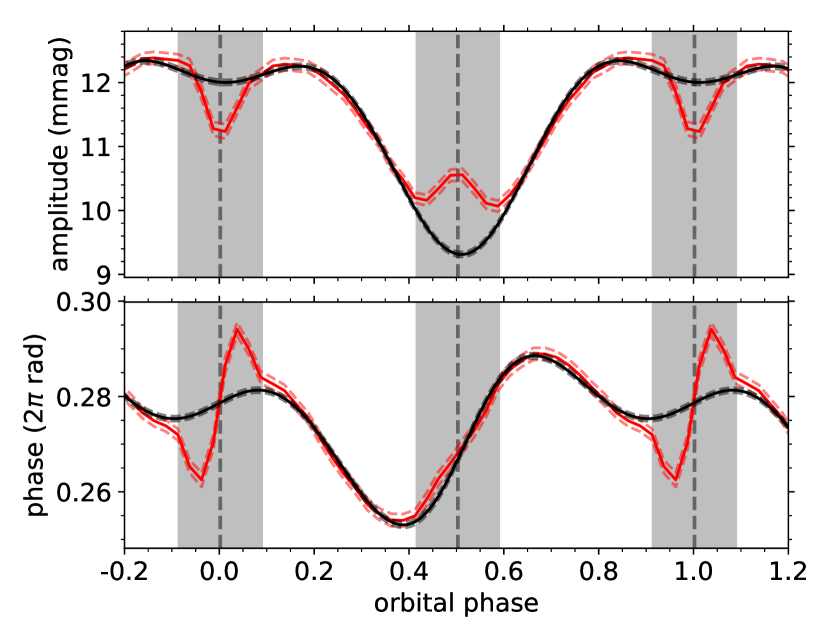
Second, the observed tidal perturbations reach maximal amplitudes once or twice per orbital cycle, and are often strongly correlated with the light variations caused by the ellipsoidal variability of the system. However, these correlations are not exact, indicating that the tidal g-mode perturbations do not merely scale with the deformation of the pulsating star. Third, for all perturbed g modes, the phase modulations decrease (increase) as a function of the binary orbital phase when the amplitude modulations are maximal (minimal), and the pulsation phase variations are relatively small and less than 0.5 rad. Fourth, within the limits of the available data, the relative tidal g-mode perturbations are found to be independent of the chosen photometric passband. This is illustrated in Figs. 9 and 10, where we compare the TESS observations of the dominant tidally perturbed modes of KIC 3228863 and KIC 12785282 with the Kepler data. However, because of the limited amount of available TESS data, the tidal perturbations were not detectable for any of the other pulsations or stars, and the confidence intervals on these two observed pulsations are large.
5.1 Pulsation amplitude and phase relations
Despite the different characteristics of our stars, there are obvious relations between the amplitude and phase modulations of the tidally perturbed pulsations. However, as the measured pulsation phases depend on multiple aspects like intrinsic pulsation phase variations, the light travel time from the pulsating star to the telescope (e.g. Murphy et al. 2014), and geometric effects such as spatial filtering (Gamarova et al. 2003; Rodríguez et al. 2004; Gamarova et al. 2005) or tidal tilting (e.g. Fuller et al. 2020), investigating this relation can be difficult. Hence, we have built a toy model of a g mode with a distorted pulsation amplitude in a synchronised, circular binary system, as described in detail in Appendix C, deliberately ignoring all other effects. In short, we used the parameter values from V456 Cyg (obtained by Van Reeth et al. 2022b) to construct the binary model, included the dominant g-mode pulsation of the secondary component, and scaled its local amplitude on the stellar surface with the function
| (5) |
where is the angle with respect to the tidal axis, such that the pulsation amplitude is up to five times larger in the hemisphere facing the primary than on the other side. Here, the value of the scaling parameter is not physically motivated, but merely set to for a conceptual illustration. The resulting amplitude and phase modulations of the simulated pulsation were then calculated using the methodology described in Section 3, and are illustrated in Figs. 11 and 33. In Fig. 33, we see the theoretical, high-resolution tidal perturbations, while in Fig. 11 the resolution has been downgraded to match the TESS data of V456 Cyg. Given that this is just a toy model, the similarities between the simulations and the observations are striking. The spatial filtering signatures during the eclipses are well reproduced, and we see a similar relation between the amplitude and phase modulations as in our observations during the out-of-eclipse orbital phases. This indicates that the dominant tidal distortion effect on the g modes is to amplify them on part of the tidally deformed stellar surface, while the observed pulsation phase modulations are at least partially caused by geometric effects of the pulsation mode visibility.
We note that despite this insight, our simulation does yet not provide any information on the physical processes that cause such distortion of the pulsation amplitude. The ellipsoidal variability of the pulsating star is likely a contributing factor, but as stated in Sect. 4, the observed ellipsoidal variability and the amplitude modulations are not perfectly correlated, indicating that other aspects also contribute to the amplifications of the g modes. Furthermore, our stars show different modulation of the mode amplitudes, which peak at or around orbital phases of 0.25 and 0.75 in KIC 3228863, KIC 3341457, KIC 4947528, and KIC 9108579 (Figs. 3, 5, 6, 7), at an orbital phase of 0 in KIC 12785282 (Fig. 8), and at an orbital phase of 0.5 in V456 Cyg (Fig. 11). The functional form of the amplitude modulation will thus be different from equation 5 for each case.
Unfortunately, the theoretical frameworks that have been presented in the literature do not suffice to describe these effects. None of them, including the study by Fuller et al. (2020), have fully accounted for the effects of the Coriolis force, which is one of the two dominant forces known to affect g-mode pulsations (e.g. Mathis 2009; Bouabid et al. 2013). Fuller et al. (2020) modelled tidally tilted p-modes assuming they were aligned with the tidal axis, under the justification that tidal distortion was more important than the Coriolis and centrifugal forces. However, low-frequency gravity modes are more sensitive to Coriolis forces and are likely to remain aligned with the rotation axis, as observed in our sample because the mode period spacings closely follow the predictions of the TAR.
One possible mechanism to explain the amplitude variations is a “tidal amplification” similar to that discussed in Fuller et al. (2020). In a tidally distorted star, the internal sound speed and Brunt-Väisälä frequency profiles will not be spherically symmetric. This may change the geometry of the g-mode cavity, allowing modes to propagate closer to the surface and produce larger flux perturbations on different sides of the star. In the future, it will be necessary to develop a new tidal coupling framework to model mode amplitude variations and determine the true physical causes of the observed tidal perturbations.

6 Rotational-modulation-like signals
In addition to the tidal g-mode perturbations, we also analysed the rotational-modulation-like variability of our five selected targets. While there are clear differences between the different binaries, it is often coherent over timescales of hundreds of days, and can provide us with additional information on the stellar properties. A proper understanding of the observed rotational-modulation-like signatures requires detailed modelling of our targets and lies outside of the scope of our current project. However, to facilitate future follow-up studies, we provide both observational characterisations and a qualitative discussion of the properties of these signals.
The rotational-modulation-like signatures have multiple possible physical origins, which are not always fully understood. In low-mass stars () rotational modulation is often a signature of spots on the stellar surface, caused by dynamic magnetic fields (e.g. Strassmeier 2009; Chowdhury et al. 2018), while in higher-mass stars (, with spectral types O, B, and A) fossil magnetic fields may lead to chemical abundance spots, though this does not explain all observations (e.g. David-Uraz et al. 2019, and references therein). By contrast, it has also been proposed that in a sufficiently fast-rotating star with a convective core, overstable convective modes in the core can resonantly excite g-mode pulsations in the radiative envelope if it is rotating slightly slower than the core. The signal of such g modes is then expected to resemble rotational spot modulation (e.g. Lee & Saio 2020; Lee 2021b). However, the rotational-modulation-like signal observed for our targets is much larger than what has been detected for (presumably) non-magnetic single stars (e.g. Li et al. 2020b), indicating that it is related to the binarity. Indeed, close binaries often have tertiary companions (e.g. Tokovinin et al. 2006), which can induce long-term variations in the observed orbit (e.g. Toonen et al. 2016). Additionally, the tidal deformation of stars in close binaries causes temperature, pressure, and density variations close to the stellar surface (e.g. Hilditch 2001), which can in turn induce circulation and flow processes that are visible on the stellar surface (e.g. Tassoul & Tassoul 1982a, b). Over the last decade, these mechanisms have been studied extensively for the atmospheres of tidally locked exoplanets (e.g. Showman & Polvani 2011). Here the atmospheric temperature variations were found to trigger standing equatorial Kelvin and Rossby waves, which can be tilted in the direction of the rotation by the balance between the pressure gradient, Coriolis, and drag forces in these targets (Showman & Polvani 2011).
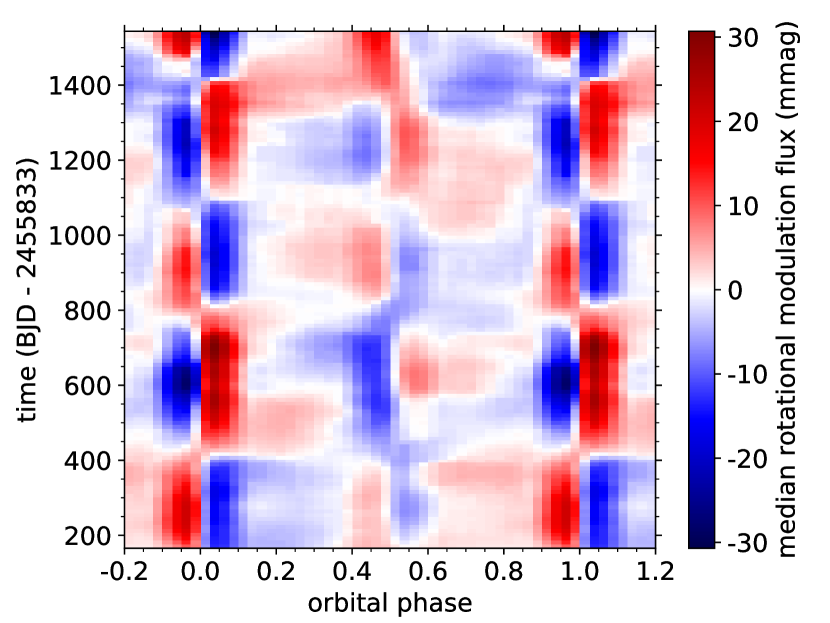
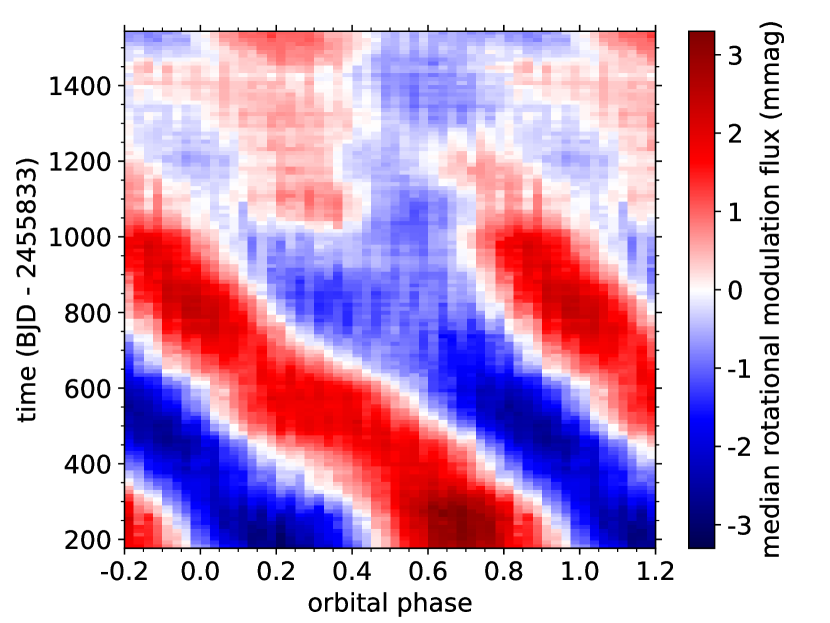
Our first target, KIC 3228863, is the only one for which we could clearly determine the physical cause of the observed rotational-modulation-like signal. As shown in Fig. 12, the dependence of the signal as a function of time and orbital phase revealed that this variability is predominantly caused by timing variations in the eclipses. The measured periodicity of these variations are 643 d, in agreement with the orbital period measured by Lee et al. (2020) for the known tertiary component of this system ( d).
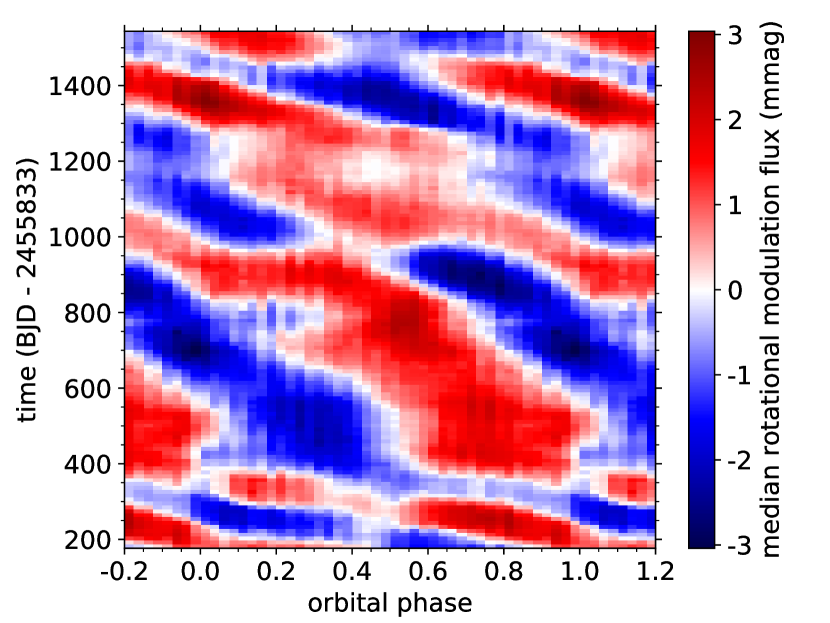
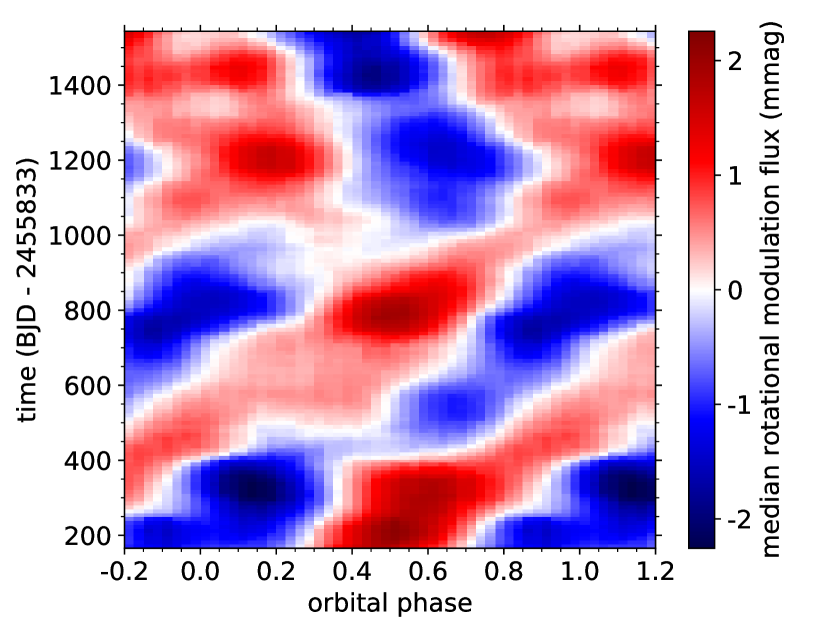
By comparison, the physical origins of the rotational-modulation-like variability of KIC 3341457, KIC 4947528, and KIC 9108579, as shown in Figs. 13 to 15, could not be definitively determined, though they appear to be most consistent with large-scale temperature spots and associated flow patterns on the stellar surfaces. As shown by Showman & Polvani (2011) for the case of tidally locked exoplanets, thermal forcing can induce large-scale, standing Kelvin and Rossby waves. The toroidal velocity fields of these waves can then be tilted by the combined pressure gradient, Coriolis, and drag forces, which can in turn lead to an equatorial superinertial flow. We hypothesise that if a similar mechanism is present in our close binaries, this could explain the time dependence of the observed rotational-modulation-like signal of these three targets. For example, in the case of KIC 3341457 it would correspond to an observed equatorial flow frequency of 1.89444 , which is slightly higher than the measured orbital frequency (1.8932976(5) ) even though the measured average near-core rotation rate is lower (1.865(1) ). Moreover, such a mechanical excitation of r modes has also been hypothesised to occur in the so-called hump-and-spike stars (Saio et al. 2018; Saio & Kurtz 2022). However, we cannot be certain; the observed rotational-modulation-like signal could also be caused by a different mechanism, such as overstable convective modes in the core (Lee & Saio 2020; Lee 2021b). It is also possible that the rotational-modulation-like variability originates from the non-pulsating companion. Unfortunately, we currently do not have sufficient information to provide a definite answer. Time series of spectroscopic observations and more detailed theoretical modelling of these targets are required to evaluate this.
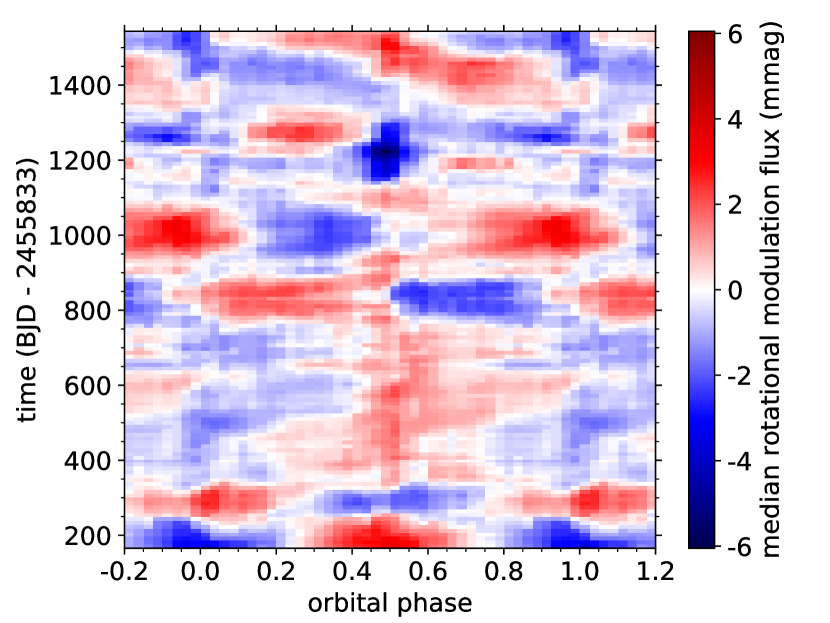
The rotational-modulation-like signal of our last target, KIC 12785282, differs significantly from our observations for the other stars, as shown in Fig. 16. It is less stable, and there are no clear long-term trends present. Furthermore, there is no clear regular time dependence during the eclipses, as observed for KIC 3228863, which was caused by the presence of the tertiary component. However, it is still possible that such signal is present on timescales shorter than 100 d. We used 100-d windows in our analysis to ensure numerical stability, but the downside is that we could not detect any shorter-term variability. As a result, we could not determine a (clear) physical cause for the observed rotational-modulation-like signal of this star either.
Finally, we note that in addition to our five selected targets, the rotational-modulation-like signal is also present in some, but not all, of the other close binaries in the sample from Li et al. (2020a). Examples of these targets include KIC 6048106, KIC 6206751, KIC 7385472, KIC 8197406 and KIC 8330092. So while we cannot definitively identify the true physical cause of the rotational-modulation-like signal, we can conclude that it is not directly related to the tidal perturbation of g-mode pulsations. And given that it appears to only be present in some close binaries, but not in wide binaries or single stars (e.g. Li et al. 2020b), it seems likely that it is causally related to the properties of close binaries. However, a detailed analysis of these targets is required to resolve this issue.
7 Conclusions
We have conducted a detailed asteroseismic analysis of the 35 Dor stars in binary systems with g-mode period-spacing patterns, presented by Li et al. (2020a), and detected tidal perturbation of the pulsations in the five shortest-period binaries of their sample, which are circularised and have orbital frequencies higher than or of the order of . Combined with the previously discovered binary with tidally perturbed Dor type pulsations (V456 Cyg; Van Reeth et al. 2022b), this allowed us to conduct a first ensemble characterisation of this phenomenon. The tidally perturbed g-mode pulsations that were previously reported for the SPB pulsator Ori (Jerzykiewicz et al. 2020), were not included in this study to avoid a potential bias. In addition to this star belonging to a different pulsator class, its analysis was based on data from the BRITE constellation (Weiss et al. 2014) rather than Kepler or TESS.
First, we have found that the relative amplitude and phase modulations of tidally perturbed g modes within a given star depend strongly on the mode geometry. For pulsations with the same mode identification, they are almost identical. In other words, they are observed to be independent of the intrinsic g-mode pulsation amplitudes, radial orders, and phases. Moreover, based on a comparison of the available Kepler and TESS photometry and within the limits of the available data, the relative modulations are found to be independent of the photometric passband in which they are observed. By contrast, the tidal modulations of g-mode pulsations with different mode geometries exhibit clear differences. As these pulsations have different mode cavities, velocity, and displacement fields, they have different sensitivities to the tidal distortion of the pulsating star and to the Coriolis and centrifugal forces in the binary system.
Second, the dominant observed characteristic of tidally perturbed g-mode pulsations is a distortion of the pulsation amplitude on the stellar surface, which is related to the tidal deformation of the pulsating star. This affects both the observed pulsation amplitude and phase modulations, and results in similar orbital-phase-dependent signatures as we see in the data of our selected sample. In most of our sample, the mode amplitudes are largest at or around orbital phases of 0.25 and 0.75 (when we are looking at the tidally distorted star side-on), but in a few cases the amplitude peaks at an orbital phase of 0.5 (when we are looking at the narrow side of the pulsating star that is facing the binary companion), and in other cases the amplitude modulation is asymmetric with orbital phase. Hence, the physical origins of these amplitude distortions are not yet clear. This requires a detailed theoretical study, which given that we are dealing with sub-inertial g modes should also account for the effects of the Coriolis acceleration on the pulsations. Such work lies outside of the scope of the presented observational analysis.
Interestingly, all five targets presented in this work also exhibit rotational-modulation-like signal which, except for KIC 12785282, contains clear coherent variability as a function of time. For KIC 3228863, this signal is a result of eclipse timing variations, caused by the known tertiary (Lee et al. 2014, 2020) that orbits the observed close binary. By contrast, the true physical origins of the rotational-modulation-like variability are currently still unknown for the remaining three stars, and we hypothesise that they are caused by temperature variations and associated flow patterns on the stellar surface. Alternatively, they could be caused by overstable convective modes in the stellar core, belong to the non-pulsating binary component, or be related to other variations in the binary motion. However, in each of these cases, the observed rotational-modulation-like signal provides information on the stellar properties, complementing the information from the g-mode pulsations and the binarity. Hence, when the physical origins of these rotational-modulation-like signals are known, they might be used to help constrain the angular momentum transport processes in our five targets.
In conclusion, our results indicate that with a suitable theoretical framework the g-mode perturbations can be used to probe the deformation of the outer layers of the pulsating stars, where the tidal effects are dominant. Since g-mode periods mostly provide information on the deep interior stellar structure, tidally perturbed g-mode pulsations provide us with a unique opportunity to study the stellar structure from the near-core region to the surface. The five binaries presented in this work are excellent targets for such a study. Moreover, other sample targets may be as well. Our strict detection criteria for tidal perturbations were specifically chosen to ensure unambiguous detections. It is possible that other stars in our sample exhibit tidally perturbed g modes that did not meet our detection criteria.
Acknowledgements.
Combinations and distortions of different pulsation mode geometries can be complicated. TVR is very grateful to Marrick Braam, Sarah Gebruers, Mathias Michielsen, and Joey S. G. Mombarg for useful discussions that have helped him to make sense of everything, or at least get confused consistently. We also thank the anonymous referee for useful comments which have improved the quality of the manuscript. TVR and DMB gratefully acknowledge funding from the research foundation Flanders (FWO) by means of junior and senior postdoctoral fellowships with grant agreements N∘ 12ZB620N and 1286521N, respectively, and FWO long stay travel grants N∘ V414021N and V411621N, respectively. JVB acknowledges receiving support from the Research Foundation Flanders (FWO) under grant agreement N∘ V421221N. The research leading to these results also received partial funding from the KU Leuven Research Council (grant C16/18/005: PARADISE), and was supported in part by the National Science Foundation under Grant No. NSF PHY-1748958. CJ gratefully acknowledges support from the Netherlands Research School of Astronomy (NOVA). This paper includes data collected with the Kepler and TESS missions, obtained from the MAST data archive at the Space Telescope Science Institute (STScI). Funding for the Kepler and TESS missions are provided by NASA’s Science Mission Directorate and the NASA Explorer Program, respectively. We thank the whole teams for the development and operations of these missions. STScI is operated by the Association of Universities for Research in Astronomy, Inc., under NASA contract NAS 5-26555. Support to MAST for these data is provided by the NASA Office of Space Science via grant NAG5-7584 and by other grants and contracts. This research also made use of the SIMBAD database, operated at CDS, Strasbourg, France, the SAO/NASA Astrophysics Data System, and the VizieR catalogue access tool, CDS, Strasbourg, France. The data analysis was done using Astropy444\hrefhttp://www.astropy.orghttp://www.astropy.org (a community-developed core Python package for Astronomy; Astropy Collaboration et al. 2013, 2018), Astroquery555\hrefhttps://astroquery.readthedocs.io/en/latest/https://astroquery.readthedocs.io/en/latest/ (Ginsburg et al. 2019), Lightkurve666\hrefhttps://docs.lightkurve.org/https://docs.lightkurve.org/ (a Python package for Kepler and TESS data analysis; Lightkurve Collaboration et al. 2018), lmfit (Newville et al. 2019), Matplotlib (the Python library for publication quality graphics; Hunter 2007), Numpy (Harris et al. 2020), and Scipy (Virtanen et al. 2020).References
- Aerts (2021) Aerts, C. 2021, Reviews of Modern Physics, 93, 015001
- Aerts et al. (2021) Aerts, C., Augustson, K., Mathis, S., et al. 2021, A&A, 656, A121
- Aerts et al. (2010) Aerts, C., Christensen-Dalsgaard, J., & Kurtz, D. W. 2010, Asteroseismology (Springer A&A Library)
- Astropy Collaboration et al. (2018) Astropy Collaboration, Price-Whelan, A. M., Sipőcz, B. M., et al. 2018, AJ, 156, 123
- Astropy Collaboration et al. (2013) Astropy Collaboration, Robitaille, T. P., Tollerud, E. J., et al. 2013, A&A, 558, A33
- Auvergne et al. (2009) Auvergne, M., Bodin, P., Boisnard, L., et al. 2009, A&A, 506, 411
- Balona (2018) Balona, L. A. 2018, MNRAS, 476, 4840
- Baran et al. (2015) Baran, A. S., Koen, C., & Pokrzywka, B. 2015, MNRAS, 448, L16
- Bildsten et al. (1996) Bildsten, L., Ushomirsky, G., & Cutler, C. 1996, ApJ, 460, 827
- Bouabid et al. (2013) Bouabid, M.-P., Dupret, M.-A., Salmon, S., et al. 2013, MNRAS, 429, 2500
- Bowman et al. (2019) Bowman, D. M., Johnston, C., Tkachenko, A., et al. 2019, ApJ, 883, L26
- Bowman & Michielsen (2021) Bowman, D. M. & Michielsen, M. 2021, A&A, 656, A158
- Brasseur et al. (2019) Brasseur, C. E., Phillip, C., Fleming, S. W., Mullally, S. E., & White, R. L. 2019, Astrocut: Tools for creating cutouts of TESS images, Astrophysics Source Code Library, record ascl:1905.007
- Burkart et al. (2014) Burkart, J., Quataert, E., & Arras, P. 2014, MNRAS, 443, 2957
- Burkart et al. (2012) Burkart, J., Quataert, E., Arras, P., & Weinberg, N. N. 2012, MNRAS, 421, 983
- Buysschaert et al. (2018) Buysschaert, B., Aerts, C., Bowman, D. M., et al. 2018, A&A, 616, A148
- Cheng et al. (2020) Cheng, S. J., Fuller, J., Guo, Z., Lehman, H., & Hambleton, K. 2020, ApJ, 903, 122
- Chowdhury et al. (2018) Chowdhury, S., Joshi, S., Engelbrecht, C. A., et al. 2018, Ap&SS, 363, 260
- Christophe et al. (2018) Christophe, S., Ballot, J., Ouazzani, R.-M., Antoci, V., & Salmon, S. J. A. J. 2018, A&A, 618, A47
- David-Uraz et al. (2019) David-Uraz, A., Neiner, C., Sikora, J., et al. 2019, MNRAS, 487, 304
- Dhouib et al. (2022) Dhouib, H., Mathis, S., Bugnet, L., Van Reeth, T., & Aerts, C. 2022, A&A, 661, A133
- Dhouib et al. (2021a) Dhouib, H., Prat, V., Van Reeth, T., & Mathis, S. 2021a, A&A, 652, A154
- Dhouib et al. (2021b) Dhouib, H., Prat, V., Van Reeth, T., & Mathis, S. 2021b, A&A, 656, A122
- Eckart (1960) Eckart, G. 1960, Hydrodynamics of oceans and atmospheres, Pergamon Press, Oxford
- Fuller (2017) Fuller, J. 2017, MNRAS, 472, 1538
- Fuller (2021) Fuller, J. 2021, MNRAS, 501, 483
- Fuller et al. (2020) Fuller, J., Kurtz, D. W., Handler, G., & Rappaport, S. 2020, MNRAS, 498, 5730
- Gamarova et al. (2005) Gamarova, A. Y., Mkrtichian, D. E., & Rodríguez, E. 2005, in Astronomical Society of the Pacific Conference Series, Vol. 333, Tidal Evolution and Oscillations in Binary Stars, ed. A. Claret, A. Giménez, & J. P. Zahn, 258
- Gamarova et al. (2003) Gamarova, A. Y., Mkrtichian, D. E., Rodriguez, E., Costa, V., & Lopez-Gonzalez, M. J. 2003, in Astronomical Society of the Pacific Conference Series, Vol. 292, Interplay of Periodic, Cyclic and Stochastic Variability in Selected Areas of the H-R Diagram, ed. C. Sterken, 369
- Garcia et al. (2022) Garcia, S., Van Reeth, T., De Ridder, J., et al. 2022, A&A, 662, A82
- Ginsburg et al. (2019) Ginsburg, A., Sipőcz, B. M., Brasseur, C. E., et al. 2019, AJ, 157, 98
- Guo (2021) Guo, Z. 2021, Frontiers in Astronomy and Space Sciences, 8, 67
- Guo & Li (2019) Guo, Z. & Li, G. 2019, ApJ, 882, L5
- Guo et al. (2022) Guo, Z., Ogilvie, G. I., Li, G., Townsend, R. H. D., & Sun, M. 2022, MNRAS, 517, 437
- Hambleton et al. (2018) Hambleton, K., Fuller, J., Thompson, S., et al. 2018, MNRAS, 473, 5165
- Hambleton et al. (2013) Hambleton, K. M., Kurtz, D. W., Prša, A., et al. 2013, MNRAS, 434, 925
- Handler et al. (2020) Handler, G., Kurtz, D. W., Rappaport, S. A., et al. 2020, Nature Astronomy, 4, 684
- Harris et al. (2020) Harris, C. R., Millman, K. J., van der Walt, S. J., et al. 2020, Nature, 585, 357
- Henneco et al. (2021) Henneco, J., Van Reeth, T., Prat, V., et al. 2021, A&A, 648, A97
- Hey et al. (2020) Hey, D. R., Murphy, S. J., Foreman-Mackey, D., et al. 2020, AJ, 159, 202
- Hilditch (2001) Hilditch, R. W. 2001, An Introduction to Close Binary Stars
- Hunter (2007) Hunter, J. D. 2007, Computing in Science & Engineering, 9, 90
- Jayaraman et al. (2022) Jayaraman, R., Handler, G., Rappaport, S. A., et al. 2022, ApJ, 928, L14
- Jerzykiewicz et al. (2020) Jerzykiewicz, M., Pigulski, A., Handler, G., et al. 2020, MNRAS, 496, 2391
- Johnston et al. (2019) Johnston, C., Tkachenko, A., Aerts, C., et al. 2019, MNRAS, 482, 1231
- Johnston et al. (2022) Johnston, C., Tkachenko, A., Van Reeth, T., et al. 2022, arXiv e-prints, arXiv:2210.06491
- Kahraman Aliçavuş et al. (2022) Kahraman Aliçavuş, F., Handler, G., Aliçavuş, F., et al. 2022, MNRAS, 510, 1413
- Kaye et al. (1999) Kaye, A. B., Handler, G., Krisciunas, K., Poretti, E., & Zerbi, F. M. 1999, PASP, 111, 840
- Koch et al. (2010) Koch, D. G., Borucki, W. J., Basri, G., et al. 2010, ApJ, 713, L79
- Kurtz et al. (2020) Kurtz, D. W., Handler, G., Rappaport, S. A., et al. 2020, MNRAS, 494, 5118
- Lecoanet et al. (2022) Lecoanet, D., Bowman, D. M., & Van Reeth, T. 2022, MNRAS, 512, L16
- Lee (2021a) Lee, J. W. 2021a, PASJ, 73, 809
- Lee et al. (2020) Lee, J. W., Hong, K., Koo, J.-R., & Park, J.-H. 2020, AJ, 159, 24
- Lee et al. (2014) Lee, J. W., Kim, S.-L., Hong, K., Lee, C.-U., & Koo, J.-R. 2014, AJ, 148, 37
- Lee (2021b) Lee, U. 2021b, MNRAS, 505, 1495
- Lee & Saio (1987) Lee, U. & Saio, H. 1987, MNRAS, 224, 513
- Lee & Saio (2020) Lee, U. & Saio, H. 2020, MNRAS, 497, 4117
- Li et al. (2020a) Li, G., Guo, Z., Fuller, J., et al. 2020a, MNRAS, 497, 4363
- Li et al. (2020b) Li, G., Van Reeth, T., Bedding, T. R., et al. 2020b, MNRAS, 491, 3586
- Lightkurve Collaboration et al. (2018) Lightkurve Collaboration, Cardoso, J. V. d. M., Hedges, C., et al. 2018, Lightkurve: Kepler and TESS time series analysis in Python, Astrophysics Source Code Library
- Loumos & Deeming (1978) Loumos, G. L. & Deeming, T. J. 1978, Ap&SS, 56, 285
- Mathis (2009) Mathis, S. 2009, A&A, 506, 811
- Michielsen et al. (2019) Michielsen, M., Pedersen, M. G., Augustson, K. C., Mathis, S., & Aerts, C. 2019, A&A, 628, A76
- Miglio et al. (2008) Miglio, A., Montalbán, J., Noels, A., & Eggenberger, P. 2008, MNRAS, 386, 1487
- Mombarg et al. (2022) Mombarg, J. S. G., Dotter, A., Rieutord, M., et al. 2022, ApJ, 925, 154
- Mombarg et al. (2021) Mombarg, J. S. G., Van Reeth, T., & Aerts, C. 2021, A&A, 650, A58
- Murphy et al. (2014) Murphy, S. J., Bedding, T. R., Shibahashi, H., Kurtz, D. W., & Kjeldsen, H. 2014, MNRAS, 441, 2515
- Murphy et al. (2021) Murphy, S. J., Li, T., Sekaran, S., et al. 2021, MNRAS, 505, 2336
- Newville et al. (2019) Newville, M., Otten, R., Nelson, A., et al. 2019, lmfit/lmfit-py 1.0.0
- Ouazzani et al. (2020) Ouazzani, R. M., Lignières, F., Dupret, M. A., et al. 2020, A&A, 640, A49
- Ouazzani et al. (2017) Ouazzani, R.-M., Salmon, S. J. A. J., Antoci, V., et al. 2017, MNRAS, 465, 2294
- Pápics et al. (2013) Pápics, P. I., Tkachenko, A., Aerts, C., et al. 2013, A&A, 553, A127
- Pedersen et al. (2021) Pedersen, M. G., Aerts, C., Pápics, P. I., et al. 2021, Nature Astronomy, 5, 715
- Prat et al. (2019) Prat, V., Mathis, S., Buysschaert, B., et al. 2019, A&A, 627, A64
- Prat et al. (2020) Prat, V., Mathis, S., Neiner, C., et al. 2020, A&A, 636, A100
- Rappaport et al. (2021) Rappaport, S. A., Kurtz, D. W., Handler, G., et al. 2021, MNRAS, 503, 254
- Ratnasingam et al. (2020) Ratnasingam, R. P., Edelmann, P. V. F., & Rogers, T. M. 2020, MNRAS, 497, 4231
- Reed et al. (2001) Reed, M., Kawaler, S. D., & Kleinman, S. J. 2001, in Astronomical Society of the Pacific Conference Series, Vol. 226, 12th European Workshop on White Dwarfs, ed. J. L. Provencal, H. L. Shipman, J. MacDonald, & S. Goodchild, 181
- Reed et al. (2005) Reed, M. D., Brondel, B. J., & Kawaler, S. D. 2005, ApJ, 634, 602
- Ricker et al. (2015) Ricker, G. R., Winn, J. N., Vanderspek, R., et al. 2015, Journal of Astronomical Telescopes, Instruments, and Systems, 1, 014003
- Rodríguez et al. (2004) Rodríguez, E., García, J. M., Gamarova, A. Y., et al. 2004, MNRAS, 353, 310
- Rogers (2015) Rogers, T. M. 2015, ApJ, 815, L30
- Saio et al. (2018) Saio, H., Bedding, T. R., Kurtz, D. W., et al. 2018, MNRAS, 477, 2183
- Saio & Kurtz (2022) Saio, H. & Kurtz, D. W. 2022, MNRAS, 511, 560
- Saio et al. (2021) Saio, H., Takata, M., Lee, U., Li, G., & Van Reeth, T. 2021, MNRAS, 502, 5856
- Scargle (1982) Scargle, J. D. 1982, ApJ, 263, 835
- Sekaran et al. (2021) Sekaran, S., Tkachenko, A., Johnston, C., & Aerts, C. 2021, A&A, 648, A91
- Shibahashi (1979) Shibahashi, H. 1979, PASJ, 31, 87
- Showman & Polvani (2011) Showman, A. P. & Polvani, L. M. 2011, ApJ, 738, 71
- Skarka et al. (2022) Skarka, M., Žák, J., Fedurco, M., et al. 2022, A&A, 666, A142
- Southworth (2020) Southworth, J. 2020, in Stars and their Variability Observed from Space, ed. C. Neiner, W. W. Weiss, D. Baade, R. E. Griffin, C. C. Lovekin, & A. F. J. Moffat, 329–334
- Southworth et al. (2021) Southworth, J., Bowman, D. M., & Pavlovski, K. 2021, MNRAS, 501, L65
- Southworth et al. (2020) Southworth, J., Bowman, D. M., Tkachenko, A., & Pavlovski, K. 2020, MNRAS, 497, L19
- Steindl et al. (2021) Steindl, T., Zwintz, K., & Bowman, D. M. 2021, A&A, 645, A119
- Strassmeier (2009) Strassmeier, K. G. 2009, A&A Rev., 17, 251
- Szewczuk & Daszyńska-Daszkiewicz (2018) Szewczuk, W. & Daszyńska-Daszkiewicz, J. 2018, MNRAS, 478, 2243
- Szewczuk et al. (2021) Szewczuk, W., Walczak, P., & Daszyńska-Daszkiewicz, J. 2021, MNRAS, 503, 5894
- Szewczuk et al. (2022) Szewczuk, W., Walczak, P., Daszyńska-Daszkiewicz, J., & Moździerski, D. 2022, MNRAS, 511, 1529
- Takata et al. (2020a) Takata, M., Ouazzani, R. M., Saio, H., et al. 2020a, A&A, 644, A138
- Takata et al. (2020b) Takata, M., Ouazzani, R. M., Saio, H., et al. 2020b, A&A, 635, A106
- Tassoul & Tassoul (1982a) Tassoul, J. L. & Tassoul, M. 1982a, ApJ, 261, 273
- Tassoul & Tassoul (1982b) Tassoul, J. L. & Tassoul, M. 1982b, ApJ, 261, 265
- Tassoul (1980) Tassoul, M. 1980, ApJS, 43, 469
- Tkachenko et al. (2013) Tkachenko, A., Aerts, C., Yakushechkin, A., et al. 2013, A&A, 556, A52
- Tokovinin et al. (2006) Tokovinin, A., Thomas, S., Sterzik, M., & Udry, S. 2006, A&A, 450, 681
- Tokuno & Takata (2022) Tokuno, T. & Takata, M. 2022, MNRAS, 514, 4140
- Toonen et al. (2016) Toonen, S., Hamers, A., & Portegies Zwart, S. 2016, Computational Astrophysics and Cosmology, 3, 6
- Van Beeck et al. (2020) Van Beeck, J., Prat, V., Van Reeth, T., et al. 2020, A&A, 638, A149
- Van Reeth et al. (2022a) Van Reeth, T., De Cat, P., Van Beeck, J., et al. 2022a, A&A, 662, A58
- Van Reeth et al. (2018) Van Reeth, T., Mombarg, J. S. G., Mathis, S., et al. 2018, A&A, 618, A24
- Van Reeth et al. (2022b) Van Reeth, T., Southworth, J., Van Beeck, J., & Bowman, D. M. 2022b, A&A, 659, A177
- Van Reeth et al. (2016) Van Reeth, T., Tkachenko, A., & Aerts, C. 2016, A&A, 593, A120
- Van Reeth et al. (2015a) Van Reeth, T., Tkachenko, A., Aerts, C., et al. 2015a, A&A, 574, A17
- Van Reeth et al. (2015b) Van Reeth, T., Tkachenko, A., Aerts, C., et al. 2015b, ApJS, 218, 27
- Virtanen et al. (2020) Virtanen, P., Gommers, R., Oliphant, T. E., et al. 2020, Nature Methods, 17, 261
- Waelkens (1991) Waelkens, C. 1991, A&A, 246, 453
- Weinberg et al. (2013) Weinberg, N. N., Arras, P., & Burkart, J. 2013, ApJ, 769, 121
- Weiss et al. (2014) Weiss, W. W., Rucinski, S. M., Moffat, A. F. J., et al. 2014, PASP, 126, 573
- Zong et al. (2016) Zong, W., Charpinet, S., Vauclair, G., Giammichele, N., & Van Grootel, V. 2016, A&A, 585, A22
Appendix A Semi-analytical tidal perturbation model
Following the example by Jayaraman et al. (2022), we used the pulsations that were prewhitened and presented in Section 3.2 to build a semi-analytical model of the photometric variability of each tidally perturbed pulsation with frequency :
| (6) |
with indicating the different components of the -spaced multiplet around . This expression can be rewritten as
| (7) |
where the orbital phase , and and are the orbital-phase-dependent amplitude and phase of pulsation frequency , respectively. These are then given by
| (8) |
and
| (9) |
When , the corresponding amplitude and phase values and are simply those of the pulsations measured in Section 3.2 that fulfil the frequency requirements. However, when , or in other words with , the pulsation phase used in Eqs. (8) and (9) is given by
where is the phase value measured in the prewhitening in Sect. 3.2.
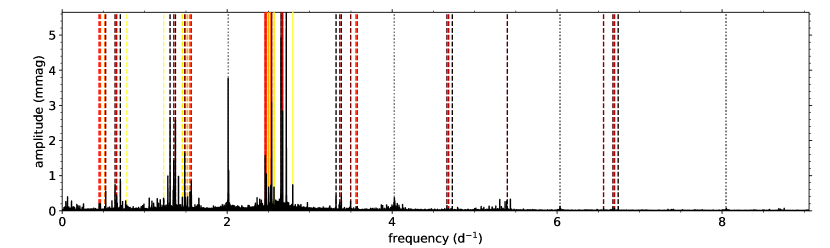
Appendix B Detections of tidally perturbed g modes
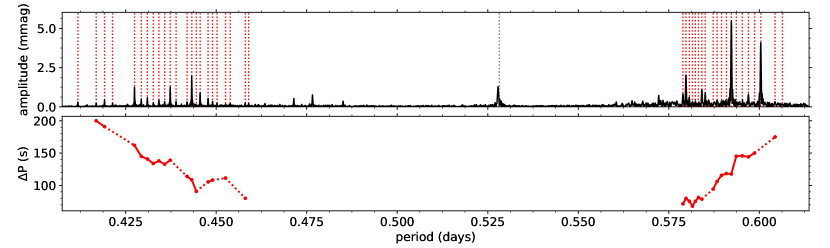
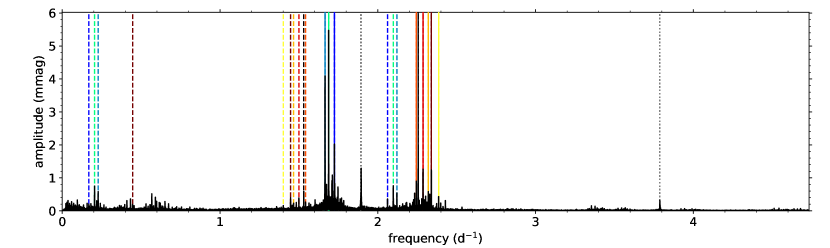
In this Appendix we have collected figures that illustrate the data analysis for the stars with detected tidally perturbed g-mode pulsations. For each star, we show (i) the detected period-spacing patterns in the Lomb-Scargle periodogram of the out-of-eclipse parts of the pulsation light curve, that is the residual Kepler light curve after removing the best-fitting harmonic model, (ii) the detected orbital-frequency-spaced multiplets for the independent g-mode pulsations, and (iii) the observed tidal perturbations of the dominant g mode(s), as a function of the binary orbital phase. To illustrate these, we show both the semi-analytical model that was described in Appendix A, and the binned data analysis of the modulations of the dominant g mode. Because the sine waves that were used to build the model, were determined from the out-of-eclipse data, there can be clear offsets between the model and the binned data during the eclipses (if present). These signatures are caused by the partial occultation of the pulsation mode geometry, also called eclipse mapping (Reed et al. 2001, 2005; Johnston et al. 2022) or spatial filtering (Gamarova et al. 2003; Rodríguez et al. 2004; Gamarova et al. 2005), and indicate to which binary component the observed pulsations belong.


Appendix C Distorted g-mode amplitudes
To evaluate the properties of g-mode pulsations with tidally distorted pulsation amplitudes, we built a toy model777A python implementation of this algorithm is available at \hrefhttps://github.com/TVanReeth/tidal-perturbation-simulationshttps://github.com/TVanReeth/tidal-perturbation-simulations. of a g-mode pulsator in a close binary, and artificially scaled the pulsation amplitude on the stellar surface. To simplify the calculations, it is assumed that the stars are spherically symmetric and rigidly rotating, and that the binary system is circularised and synchronised. Moreover, it is also assumed that the stellar rotation axis is perpendicular to the orbital plane.
In the corotating frame of the pulsating star, we then define our reference axes such that the z-axis coincides with the rotation axis of the star, and the y-axis with the tidal axis of the binary. The local brightness variations caused by the g-mode pulsation are then described by
| (10) |
where is the amplitude of the pulsation relative to the (local) brightness of the star, and is the distortion of the pulsation amplitude on the stellar surface. is the Hough function for the g mode with identification , calculated within the theoretical framework of the TAR, and the spin parameter with and being the rotation frequency and the pulsation frequency in the corotating frame, respectively. are the angular spherical coordinates with respect to the rotation axis.
In our toy model, the local pulsation amplitudes on the stellar surface are distorted by the function
| (11) |
where is the amplitude of the distortion and is the angle between the normal of the evaluated surface patch and the tidal axis.
Subsequently, we convert from the corotating to the inertial reference frame by defining a new set of spherical coordinates with respect to the observer’s line-of-sight at time stamp . This is done by replacing the azimuthal angle in the equations above by , and rotating the system around the inclination angle . The flux that the observer receives from the stellar component in the binary at time , can then be calculated as
| (12) |
where we have included linear limb darkening (with coefficient ). The mask indicates which parts of the stellar surface are not eclipsed by the other binary component, that is, which parts are visible to the observer at time . Given the masses and radii of the binary components, the inclination angle of the system, and our assumption of spherically symmetric stars in a circular binary with synchronised rotation, these are straightforward to compute. Finally, the normalisation constant ensures that when the star is non-pulsating () and not eclipsed.
The observed flux variability of the pulsating binary system is then calculated as
| (13) |
where and indicate the normalised flux of the individual binary components, and are the relative light contributions from both components, and is the third light.
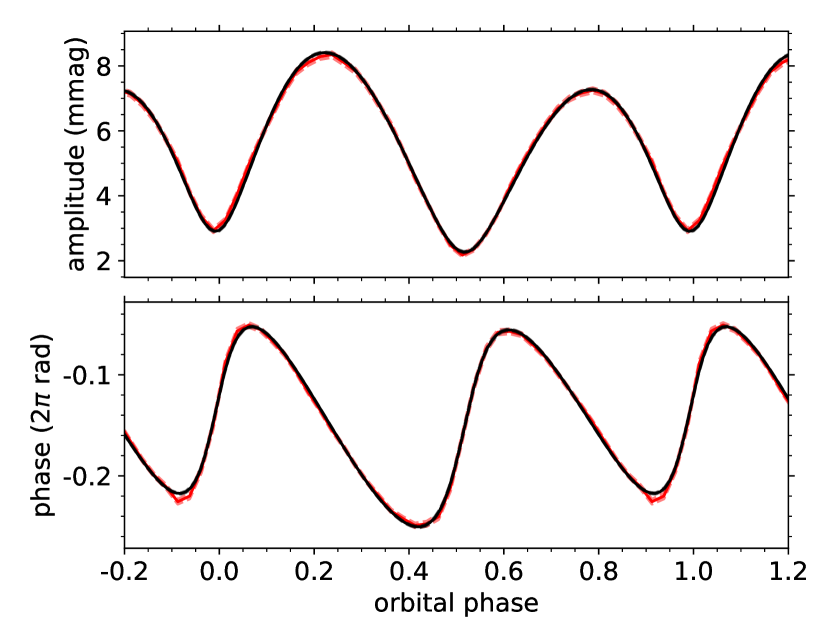
To illustrate our toy model, we have built a simulation using stellar parameter values that approximate those measured for V456 Cyg (listed in Table 2; obtained from Van Reeth et al. 2022b). A g-mode pulsation has been included for the secondary component, with the amplitude distorted as described by Eq.(11) with , so that the pulsation is up to five times larger in the stellar hemisphere facing the primary than on the opposite side. The simulated light curve was subsequently analysed using the same methodology as described in Section 3. The result, shown in high resolution in Fig. 33, is consistent with the observed tidal g-mode perturbations of V456 Cyg, as presented in Fig. 5 of Van Reeth et al. (2022b). Most notably, the amplitude modulations during the out-of-eclipse phases are reflected in the pulsation phase modulations, with the phase decreasing during the orbital phases when the pulsation amplitude is maximal, as observed. Similarly, the signatures of spatial filtering are clearly reproduced during the eclipses.
A posteriori, we can also see that the assumption of spherical symmetry in our toy model was justified. Real tidally distorted stars in close binaries like V456 Cyg exhibit ellipsoidal and rotational-modulation-like variability, caused by tidal distortion of stars in close binaries. The associated stellar flux variations also modulate the apparent pulsation mode amplitude on the stellar surface, similar to the local pulsation amplitude distortion that we simulated in our toy model. However, as ellipsoidal variability is usually small (of the order of 10 to 100 mmag for the stars in this work), the associated pulsation amplitude modulations will also be much smaller than what we see in our observations or what was simulated in our model.
| Parameter | Value |
|---|---|
| orbital frequency () | 1.122091 |
| inclination angle (∘) | 83.198 |
| stellar mass () | 1.859 |
| stellar mass () | 1.576 |
| stellar radius () | 1.588 |
| stellar radius () | 1.507 |
| linear LD coefficient | 0.248 |
| linear LD coefficient | 0.285 |
| light contribution | 0.6 |
| light contribution | 0.4 |
| third light | 0.0 |
| pulsation frequency () | 1.9491 |
| pulsation amplitude | 0.005 |
| amplitude distortion | 0.667 |
| mode identification | (0,1) |