MAVERIC: A Data-Driven Approach to Personalized Autonomous Driving
Abstract
Personalization of autonomous vehicles (AV) may significantly increase trust, use, and acceptance. In particular, we hypothesize that the similarity of an AV’s driving style compared to the end-user’s driving style will have a major impact on end-user’s willingness to use the AV. To investigate the impact of driving style on user acceptance, we 1) develop a data-driven approach to personalize driving style and 2) demonstrate that personalization significantly impacts attitudes towards AVs. Our approach learns a high-level model that tunes low-level controllers to ensure safe and personalized control of the AV. The key to our approach is learning an informative, personalized embedding that represents a user’s driving style. Our framework is capable of calibrating the level of aggression so as to optimize driving style based upon driver preference. Across two human subject studies (n = 54), we first demonstrate our approach mimics the driving styles of end-users and can tune attributes of style (e.g., aggressiveness). Second, we investigate the factors (e.g., trust, personality etc.) that impact homophily, i.e. an individual’s preference for a driving style similar to their own. We find that our approach generates driving styles consistent with end-user styles () and participants rate our approach as more similar to their level of aggressiveness (). We find that personality (), perceived similarity (), and high-velocity driving style () significantly modulate the effect of homophily.
I Introduction
Driving style is defined as the characteristics of driving related to the judgment and decisions of the driver in a specific situation [13]. Research has shown that driving styles differ greatly amongst individuals [36]. For example, the way in which a driver interacts with other drivers, the level of aggression that a driver exhibits, and tendency to commit traffic violations are characteristics that define an individual’s unique driving style. Because of these individual differences, when riding in an autonomous vehicle (AV), end-users’ expectations and preferences for the behavior of the AV will likely be influenced by their own driving style [18, 19, 32]. One-size-fits-all models employed by AVs which ignore driver differences may lead to decreased acceptance [18]. Instead, the driving style of AVs should be personalized to fit the preferences and expectations of individual end-users.
Much of the prior work in optimizing AV driving styles has assumed that, to increase end-user acceptance and trust, AVs should mimic users’ unique driving styles [32, 14]. However, even if we are able to personalize an AV’s behavior, not all end-users will necessarily want the AV to drive exactly as the end-user drives [39, 5]. In fact, prior work has suggested that some end-users may want an AV to drive more cautiously than they drive [14, 39, 5]. Additionally, factors such as trust and familiarity with AVs and various personality traits may affect preference for driving styles similar to one’s own [12, 9, 28].
Based upon evidence from prior work [12, 9, 28, 14], we hypothesize that an individual’s optimal driving style is a function of both the end-user’s own driving style and various subjective factors, such as personality. Therefore, to optimize driving style, an AV must be capable of learning about an end-user’s own driving style as well as modulating this style based upon relevant end-user characteristics. We identify two key shortcomings in prior work. First, prior approaches that are capable of modulating the driving style of an AV do not take into account the end-user’s own driving style [15, 3], despite prior work indicating that end-user’s own driving style is an important predictor of the optimal driving style. Second, prior works which mimic an end-user’s driving style [6, 23] are not capable of modulating various aspects of driving style to account for end-users who do not wish the driving style to exactly mirror their own.
In this work, we develop a data-driven approach called Manipulating Autonomous Vehicle Embedding Region for Individuals’ Comfort (MAVERIC) which is capable of producing an optimized driving style for an end-user. This driving style is based upon the end-user’s own driving style but can also be modulated to adjust the level of aggression. By observing the driving of an end-user, MAVERIC learns a high-level model via a neural network architecture that predicts personalized control parameters for low-level controllers to mimic the driving style of the end-user. Simultaneously, MAVERIC learns a personalized embedding representing the driving style of an end-user. By shifting the personalized embedding along the gradient of aggression, MAVERIC is capable of tuning the AV driving style to be more aggressive or cautious while maintaining other characteristics such as minimum headway distance and fraction of time in left lane. This capability allows us to modulate the AV’s level of aggressiveness with respect to an end-user’s style so as to optimize the AV’s driving style.
In a human-subjects study, we investigate if MAVERIC can effectively mimic an individual’s driving style as well as modulate aggression with respect to one’s own driving style while maintaining other aspects of driving style. Additionally, we investigate the factors that influence the effect of homophily, i.e., preference for a driving style similar to one’s own. We demonstrate that preferred driving style is related both to one’s own style as well as personality traits, perceived similarity, and high-velocity driving.
In this work we contribute the following:
-
1.
We formulate MAVERIC, a novel framework to personalize driving style and modulate aggressiveness while maintaining other aspects of driving style.
-
2.
We demonstrate that MAVERIC can closely match an end-user’s driving style () as well as produce more aggressive () and more cautious () driving in a high-fidelity driving simulator.
-
3.
We find that personality (), perceived similarity (), and high-velocity driving style () significantly impact the effect of homophily.
II Related Work
Researchers have demonstrated that personalization of AVs can lead to increased acceptance [14, 32] and may decrease motion sickness [21]. To achieve this objective of personalization, Kuderer et al. utilized an inverse reinforcement learning approach to produce personalized AV behavior via a learned cost function [23]. Ling et al. adapted driving style online based on the emotional responses of passengers [25]. Other work investigated personalization of specific aspects of driving [6, 16]. For example, Bolduc et al. developed an approach to match driver’s style for adaptive cruise control [6].
Yet, prior work suggests that end-users may not want an AV to drive exactly as they drive and various factors may influence a driver’s preference for a specific driving style [5, 14, 39]. Prior work has also shown that specifically the level of aggression of an AV has a large impact on preference [5, 14, 39]. For example, Ekman et al. found that a defensive driving style produced higher trust scores in a Wizard-of-Oz study [14]. Yusof et al. also found defensive driving was preferred, even more so by aggressive drivers [39]. Basu et al. also found that participants did not want AVs to drive as they drive, instead preferring the AV to drive like the end-user thinks they drive, which often differs from their actual driving style [5]. The authors in [5] suggest that we can not simply rely on mimicry and instead, must also account for other end-user characteristics to determine an optimal driving style.
Prior work has introduced several classic control approaches which allow for tuning of the level of AV aggression. For example, Eriksson and Svensson [15] introduced a linear quadratic controller for tuning the driving of an AV to optimize ride quality. Bae et al. [3] introduced an approach which allows the user to specify the desired parameters for a controller to adjust the driving style of the vehicle with respect to acceleration and jerk. However, these approaches do not consider tuning driving style with respect to the end-user’s own style and may require expert knowledge of vehicle dynamics and complex control parameters to determine the correct parameter settings.
While prior work has investigated mimicking driving style and tuning style via controllers, no prior work has created an architecture that can modulate driving style with respect to an end-user’s own style. Yet, prior work provides evidence that this functionality is important for optimizing driving style for an end-user [5, 39]. Additionally, prior work has not extensively investigated the relationship between subjective factors and preference for styles similar to one’s own. In our work, we seek to fill these gaps by proposing an approach capable of producing more or less aggressive behavior with respect to the end-user’s own driving style. Additionally, we conduct a thorough investigation into the factors that impact the effect of homophily.
III Methodology
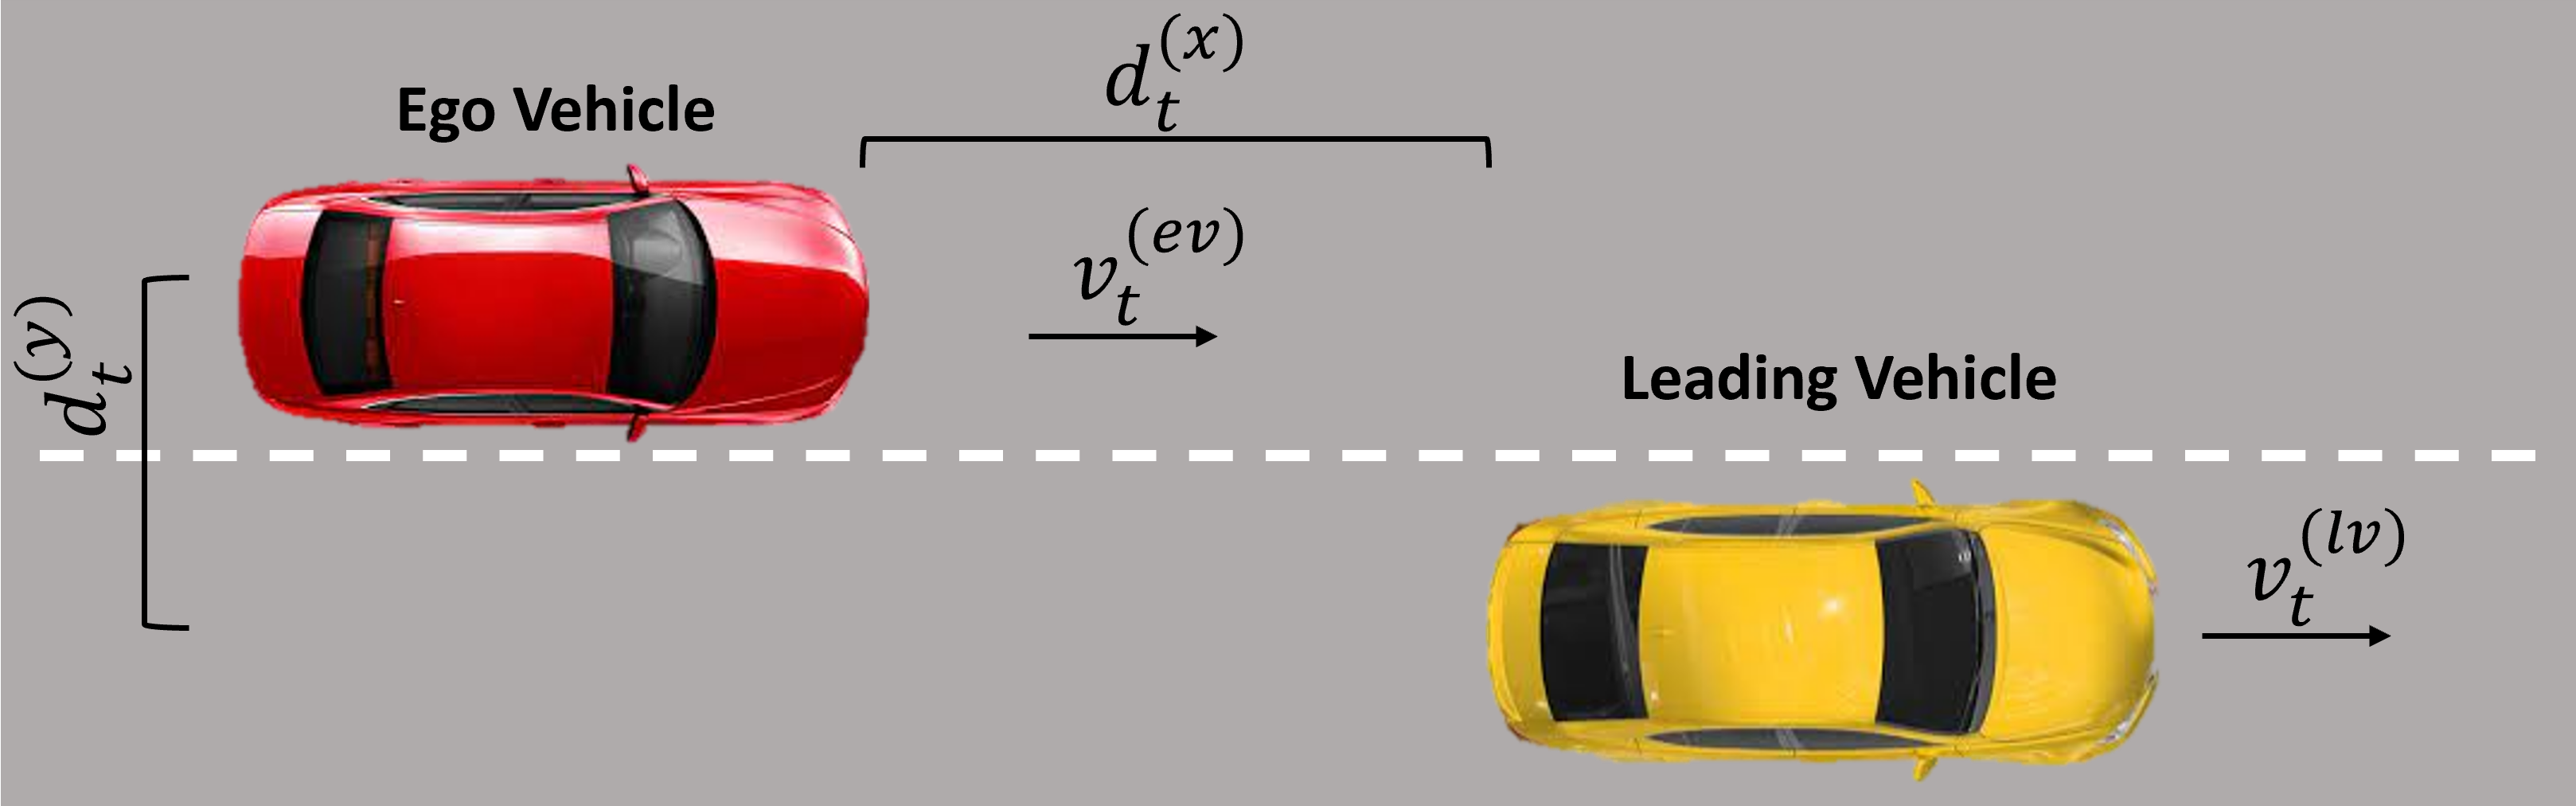
In the following section we provide an overview of MAVERIC. We discuss our architecture and how we endow our framework with the ability to both mimic an end-user’s driving style as well as modulate aggression. Fig. 2 depicts the state information relevant to our architecture.
III-A Network Architecture
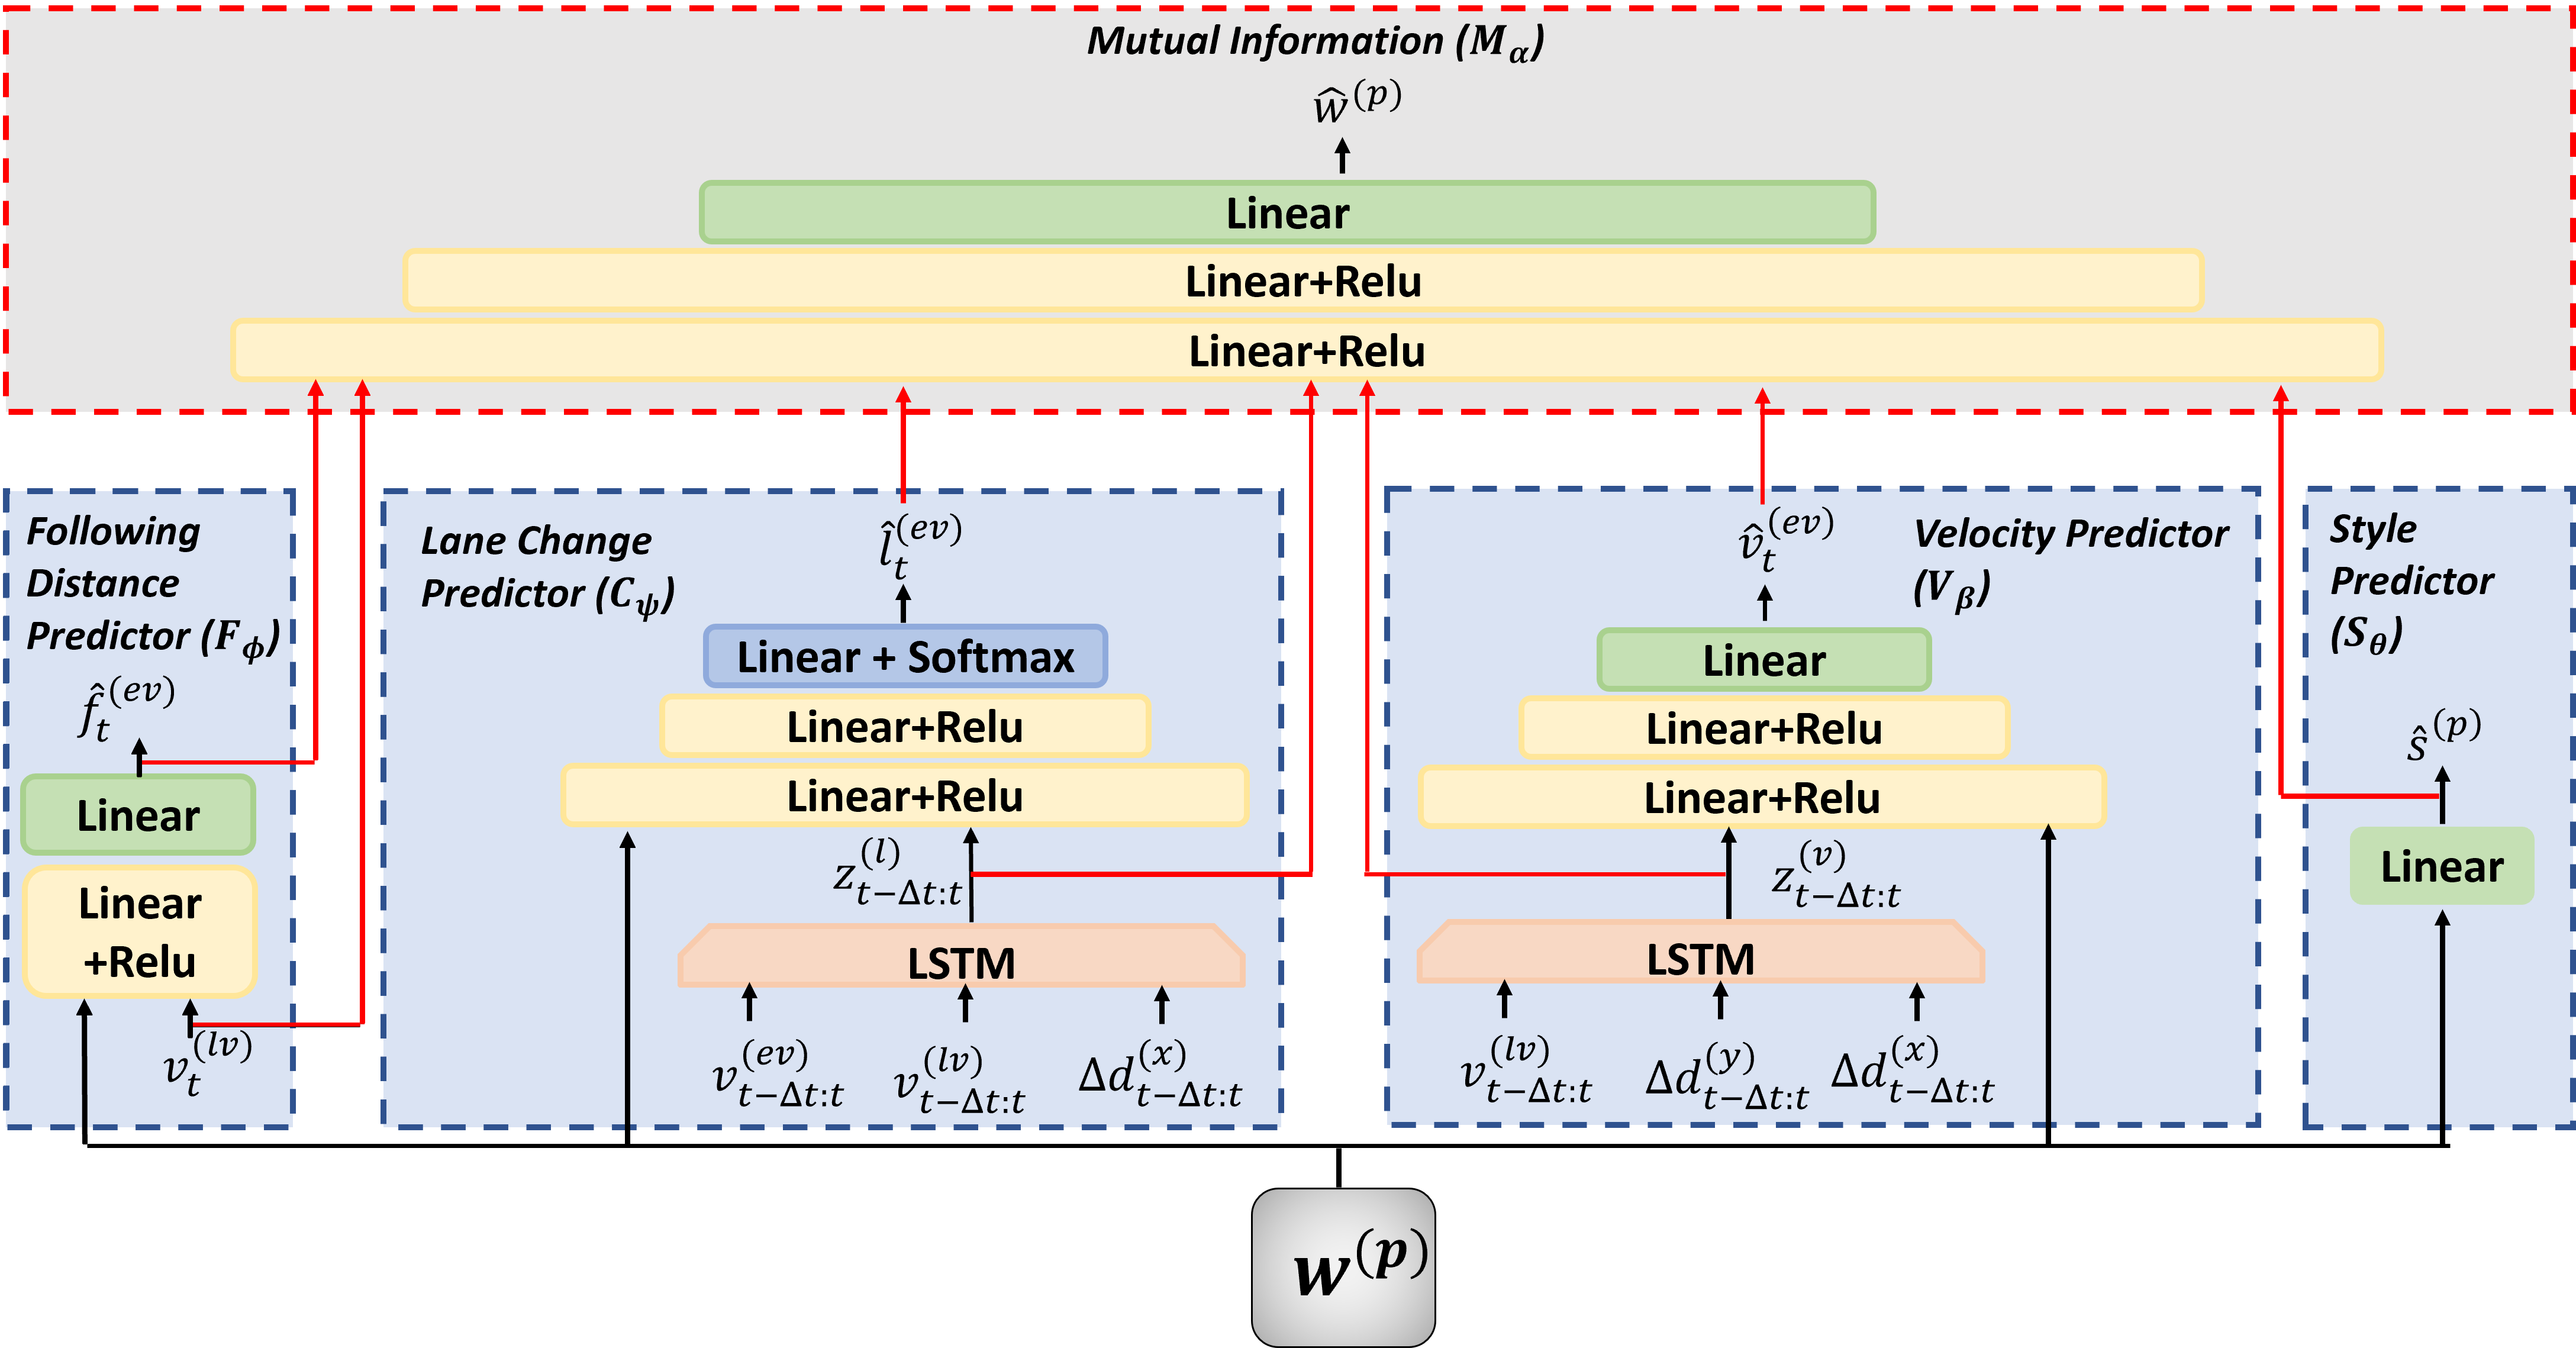
Our network architecture is depicted in Fig. 3. Our network simultaneously learns the high-level parameters of low level controllers and the personalized embedding, , representing the driving style of an individual, . See Section III-D for details on the low-level controllers. Our network is composed of five subnetworks: the Following Distance Predictor, , Lane Change Predictor, , Velocity Predictor, , Style Predictor, , and Mutual Information, .
Following Distance Predictor ()
-
•
Inputs: personalized embedding, , and the velocity of the lead vehicle, .
-
•
Outputs: desired following distance, , between the ego vehicle and the lead vehicle.
-
•
Layers: fully-connected with ReLU activations.
-
•
Loss Function: mean-squared error loss defined as ), where is the ground truth following distance of the end-user.
Lane Change Predictor ()
-
•
Inputs: personalized embedding, , ego velocity, , the velocity of the lead vehicle, , and x-distance between the ego and lead vehicle, , from time to .
-
•
Outputs: , i.e. when a lane change should occur.
-
•
Layers: fully-connected with ReLU and softmax activation.
-
•
Loss Function: cross-entropy loss defined as where is a binary variable indicating a lane change.
Velocity Predictor ()
-
•
Inputs: personalized embedding, , velocity of the lead vehicle, , y-distance, , and x-distance, , between the ego and lead vehicle, from time to .
-
•
Outputs: predicted speed of the ego, , at time .
-
•
Layers: fully-connected with ReLU activations.
-
•
Loss Function: mean-squared error loss defined as ) where is the velocity of the end-user.
Style Predictor ()
-
•
Inputs: personalized embedding, .
-
•
Outputs: subjective aggressiveness, , of participant, .
-
•
Layers: fully-connected.
-
•
Loss Function: ) where is the subjective aggressive style of the end-user as self-reported via a questionnaire. In Section III-C, we discuss the importance of this subnetwork and how we obtain .
Mutual Information (): seeks to maximize mutual information between the driving style of the individual and to ensure that the learned embedding captures the differences in driving style between individuals and that unique driving styles are represented by unique embeddings [27, 29].
-
•
Inputs: , encodings of the relevant time series state information and , and the outputs of each of the other subnetworks, , , , and .
-
•
Outputs: .
-
•
Layers: fully-connected layers with ReLU activations.
-
•
Loss Function: mean-squared error loss defined as ).
With this setup, we train to capture salient information about an end-user’s driving style by maximizing a lower bound, , on mutual information. Eq. 1 shows the lower bound on mutual information as derived in Chen et al. [8]. represents the vector containing the relevant state parameter (, , and ). represents the vector containing the outputs of the subnetworks (, , , and ).
| (1) |
III-B Training
We train our MAVERIC architecture to minimize the five loss functions, , , , , and . Loss functions through are utilized to train the four predictor subnetworks. minimizes the MSE between the embedding sampled from the approximate posterior and the true embedding, (). This is equivalent to maximizing the log likelihood of the posterior represented by [27]. We note that we initialize by sampling from the prior, [27]. The sum of these five losses is then backpropagated through each of the subnetworks and to simultaneously learn the personalized control parameters and the personalized embedding representing driving style.
III-C Modulating Aggression
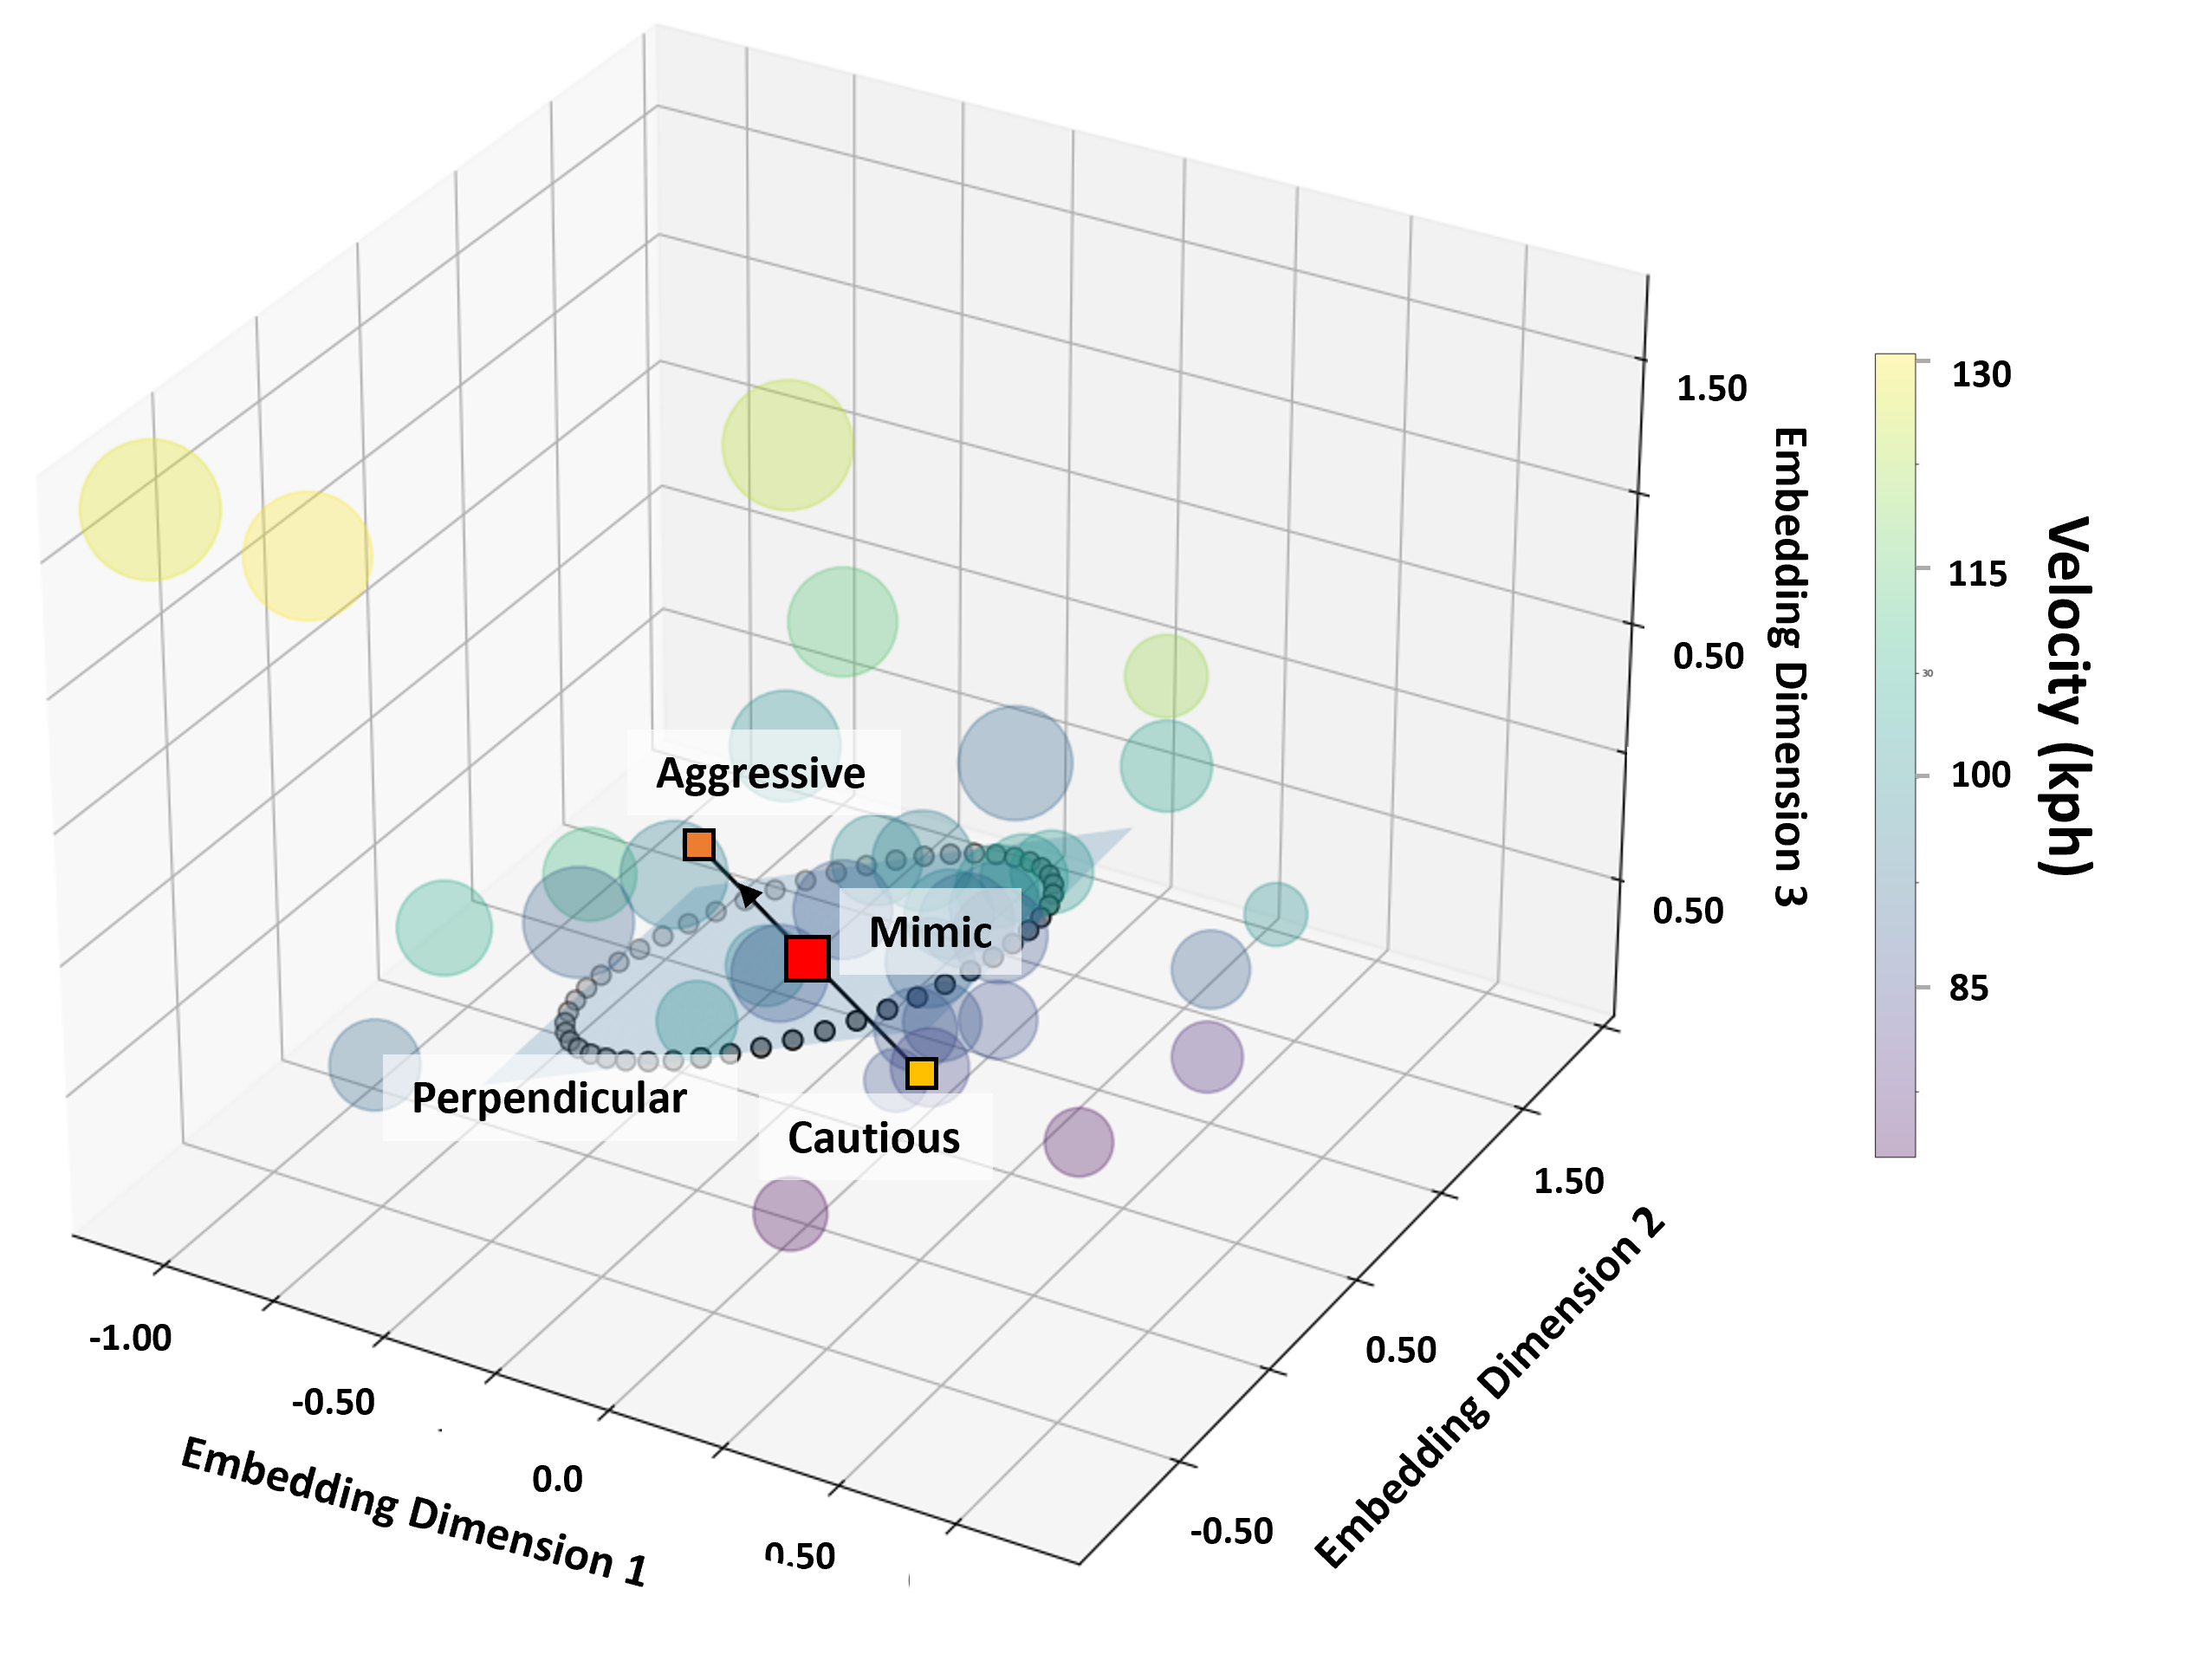
We designed MAVERIC to be capable of both matching driving styles of individuals and modulating aggression with respect to an individual’s driving style. Because MAVERIC learns a latent embedding space, we aim to create a dimension of aggression within the embedding space, allowing us to shift an embedding along that dimension and modulate aggression, while keeping other driving characteristics unrelated to aggression constant. To achieve this objective, we add an additional signal when learning the embedding space. We add a network head, , composed of a fully-connected layer which takes as input the personalized embedding, . is trained to predict the subjective aggressive driving style of the user as measured by the participant’s response to the Aggressive Driving Behavior (ADB) scale [17]. By doing so, we create an aggressive dimension within the embedding space. We can then move along the gradient of aggression () to produce a more or less aggressive driving style as shown in Fig. 4.
While driving style has multiple dimensions [34], we focus on the aggressive dimension, as prior work has shown that this dimension has a large impact on end-user preference [5, 14, 39]. Other characteristics of driving could be modulated by following a similar procedure. While we acknowledge that the ADB scale is a noisy metric, as discussed in Section V, our results demonstrate that our method can effectively produce more and less aggressive behavior. Additionally, we find we can represent the driving style of an end-user via a 3-dimensional vector and that increasing the size of the embedding did not significantly improve the accuracy of predictions.
III-D Low Level Controllers
MAVERIC learns the parameters for low-level controllers (e.g., velocity, timing of lane change, etc.) rather than directly learning the low-level control inputs (i.e., throttle and steering) to enable safety constraints and account for unexpected or dangerous behavior that could be produced by the network. For example, by learning the desired following distance for an end-user and utilizing an adaptive cruise controller to maintain this distance, we can ensure that the following distance remains safe. Additionally, by predicting when a lane change should occur via the neural network and utilizing a low-level controller to execute the lane change, we ensure consistent and smooth lane changes. Furthermore, this hierarchical method of learning and control has been shown to produce better results in prior work [26]. We utilized the specific controllers described below because they have been shown to be robust and produce desired behavior in prior work [31]. However, these controllers could be exchanged for other controllers.
Lane Change Controller: Our lane change controller is based on a Stanley controller [31] and follows a Bezier curve [2]. We compute the Bezier curve based upon the desired distance (selected to produce natural behavior) to complete the lane change, while ensuring that the ego vehicle will not collide with the leading vehicle. The lane change controller executes a lane change when .
Velocity Controller: We utilize a proportional and integral (PI) controller to maintain the desired velocity, , of the ego vehicle as predicted by the neural network.
Following Distance Controller: When the distance between the ego and leading vehicle falls below threshold, , we switch from the velocity controller to the following distance controller. The following distance controller is a PI controller that minimizes both the error between the desired following distance, , as predicted by the neural network and the difference in speed between the ego and leading vehicle subject to safety constraints on following distance.
IV Human Subjects Studies
We conducted two human subjects studies: A Model Training Study (Study 1) and a Model Testing Study (Study 2). In Study 1, we collect data from 30 participants to train MAVERIC and learn , , , , and , and the participants’ embeddings. We then freeze these parameters, and in Study 2, we collect driving data from 24 participants to learn their embedding. Then each participant experiences the four AV conditions (Section IV-D). Research was approved by an IRB.
IV-A Driving Simulator
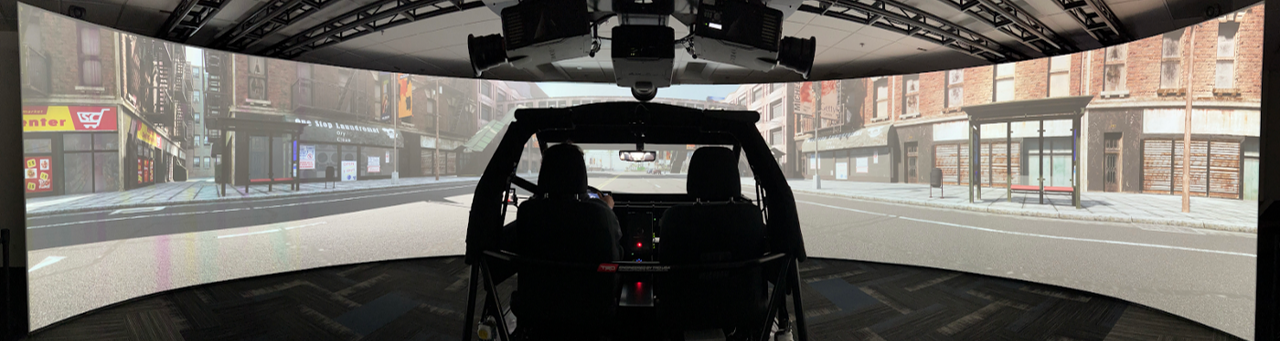
To test the abilities of MAVERIC, we utilize a high-fidelity, research grade driving simulator. The simulator (Fig. 1) is an immersive 6-DOF platform capable of emulating the motion of a vehicle. The simulator is based on CARLA [11], ROS2, and Unreal Engine.
IV-B Participants
Model Training Study (Study 1): We recruited 30 participants (Mean age 35.4; 27% Female) via word of mouth and mailing lists. Four of the participants were professional drivers who demonstrated aggressive, cautious, and their own driving style. In total, we collected 38 data points representing various driving styles.
Model Testing Study (Study 2): Study 2 was run with two different populations of participants to increase diversity. For the internal study, 12 subjects were recruited internally (Mean age 34.42; 33.4% Female). For the external study, 12 subjects (Mean age 43.92; 41.7% Female) were recruited from the general public via Fieldwork recruiting. External participants were compensated $250. The populations are analyzed as a collapsed dataset because the procedure was identical.
IV-C Procedure
We investigate personalization of driving styles in the domain of light traffic on a two-lane divided highway with both lanes going in the same direction (Fig. 2).
Study 1: Participants control the vehicle and demonstrate their driving style for 10 minutes. Their task is to drive as they would in their own vehicle. They are instructed to maintain the speed they would typically drive if the speed limit is 55mph and to pass other vehicles when they feel it is appropriate. In this domain, participants encounter vehicles in the same lane (lead vehicles) and in the adjacent lane (off-lane vehicles). Participants must make decisions about changing lanes, following distance, and velocity. The speed of the lead vehicles is randomly selected without replacement from the set {, , , , , } where is the ego target speed and the posted speed (55mph). These speeds ensure consistency across participants but also ensures that a portion of the leading vehicles are slower than the ego, thus forcing the participant to make a decision about changing lanes.
Participants first complete pre-study surveys to collect information about demographics and attitude towards AVs (Section IV-E). Participants complete a practice session to familiarize themselves with the vehicle controls and domain. We next collect driving data from the participants to learn the network parameters and their personalized embeddings.

Study 2: In the testing study, we freeze the network parameters, , , , , and learned from Study 1 data. Participants fill out the pre-study surveys, complete a practice round, and then drive the vehicle in the highway domain. We collect their data to learn their embedding. This first part of the procedure mirrors the procedure experienced by training participants. All participants next experience four AV conditions as described in Section IV-D. After each condition, participants fill out surveys about their subjective perception of the AV (Section IV-E).
IV-D Model Testing Study Conditions
The behaviors described below are created by shifting a participant’s embedding in the embedding space. Fig. 4 shows the learned embedding space and how we choose the embedding to create the behavior for each of the conditions. We hypothesize that Mimic will produce similar behavior relative to the participant’s driving, Aggressive will produce more aggressive behavior and Cautious, less aggressive.
Mimic: In Mimic, we utilize the personalized embedding learned from the participant’s data to produce driving behavior to mimic the participant’s own driving style.
Aggressive: In Aggressive, we shift the participant’s embedding in the positive gradient of aggression (equivalent to 15 points on the ADB survey) to produce more aggressive behavior while maintaining other characteristics of driving style (i.e., ). We constrain to be no more than the largest possible score on the ADB survey (55 points).
Cautious: In Cautious, we shift the embedding in the negative gradient of aggression () to produce less aggressive behavior while maintaining other characteristics of style. We constrain to be no less than the smallest possible score on the ADB (11 points).
Perpendicular: We include Perpendicular to conduct an exploratory investigation into the behavior produced when we maintain the level of aggression but move the embedding within the plane perpendicular to the aggressive gradient. Our objective is to investigate which driving characteristics change as a result of this shift. To select the embedding, we randomly sample a point along an ellipse on the plane one standard deviation away from the participant’s embedding as shown by the gray points in Fig. 4. By doing so, we are able to keep the degree of aggression constant, while altering other aspects of driver style. We hypothesize that Perpendicular will produce similarly aggressive behavior compared to the participant’s driving but may modulate other factors not related to aggression.
IV-E Metrics
Participants in both Study 1 and Study 2 complete the pre-study surveys. Only participants in Study 2 complete the post-trial surveys. The surveys detailed below comply with the design guidelines outlined in Schrum et al. [30] and are validated from prior work when possible.
Pre-study: The pre-study survey is intended to measure the participants’ subjective attitudes towards AVs. We collect demographic information and Big-Five personality information via the Mini International Personality Item Pool [10]. To measure a participant’s aggressive driving style, we utilize the Aggressive Driving Behavior Scale [17]. We measure other aspects of driving style via the Multi-Dimensional Driving Style Inventory [34] and measure experience with cars/racing games/AVs [29], trust in AVs [22], perception of AVs [35], and trust in automation [1].
Post-trial: The post-trial surveys capture the participants’ subjective attitudes towards each of the AV conditions. We measure perceived intelligence [4], competence [7], discomfort [7], and trust [22]. We modify each of these subscales for AVs. Additionally, we create two custom scales to measure perceived similarity and aggressiveness relative to the participant’s own driving style.
Objective Measures: In keeping with prior work [5, 24], we measure various metrics to determine how similar the driving style of each condition is compared to the participant’s own driving style. We investigate mean velocity and mean number of lane changes. We also measure mean headway time (the distance between the lead vehicle and ego divided by the speed of the ego when a lane change occurs), minimum headway distance (the minimum distance between the ego and lead vehicle before either the ego slows down or changes lanes), distance headway merge back (the distance between the following vehicle and ego when merging back), and time headway merge back (distance headway merge back divided by the speed when a lane change occurs).
V Results
V-A Analysis of Embedding Space and Aggressive Gradient
We first investigate if our embedding space is capable of representing and producing diverse driving styles and if the aggressive gradient correlates with relevant objective metrics. To investigate these questions, we project the learned embeddings of the test participants onto the line representing the gradient of aggression. We then analyze how driving style changes as a result of the position of the embedding along this line. We find that as we move along the aggressive gradient, the average velocity of the participant increases. The average velocity along the aggressive gradient ranges from 54.5 mph (in the most negative direction of the gradient) to 78.56 mph (in the most positive direction of the aggressive gradient. We find a strong correlation () between the embedding’s position along the aggressive gradient and the average velocity of the participant. This finding suggests that, in keeping with prior work [33], velocity is an important component of aggression within the embedding space. We find similar results for mean headway time (), distance headway merge back (), mean number of lane changes (), and time headway merge back (). Lastly, we show that a participant’s subjective aggressive rating of their own driving style strongly correlates with the position of their learned embedding along the aggressive gradient (). These findings provide evidence that our embedding space is capable of representing diverse driving styles and that aggressiveness objectively and subjectively increases as we move along the aggressive gradient.
V-B Algorithm Validation
We next investigate MAVERIC’s ability to mimic end users’ driving styles and produce more and less aggressive behavior in terms of both objective and subjective metrics. In our following analysis, we verify that data complies with assumptions before applying a parametric test. We first investigate MAVERIC’s ability to accurately mimic driving style. We find that the accuracy with which we are able to mimic the participant’s velocity is 93.6%, time headway is 80.2%, distance headway merge back is 92.4%, mean number of lane changes is 81.0%, and time headway merge back is 81.8%.
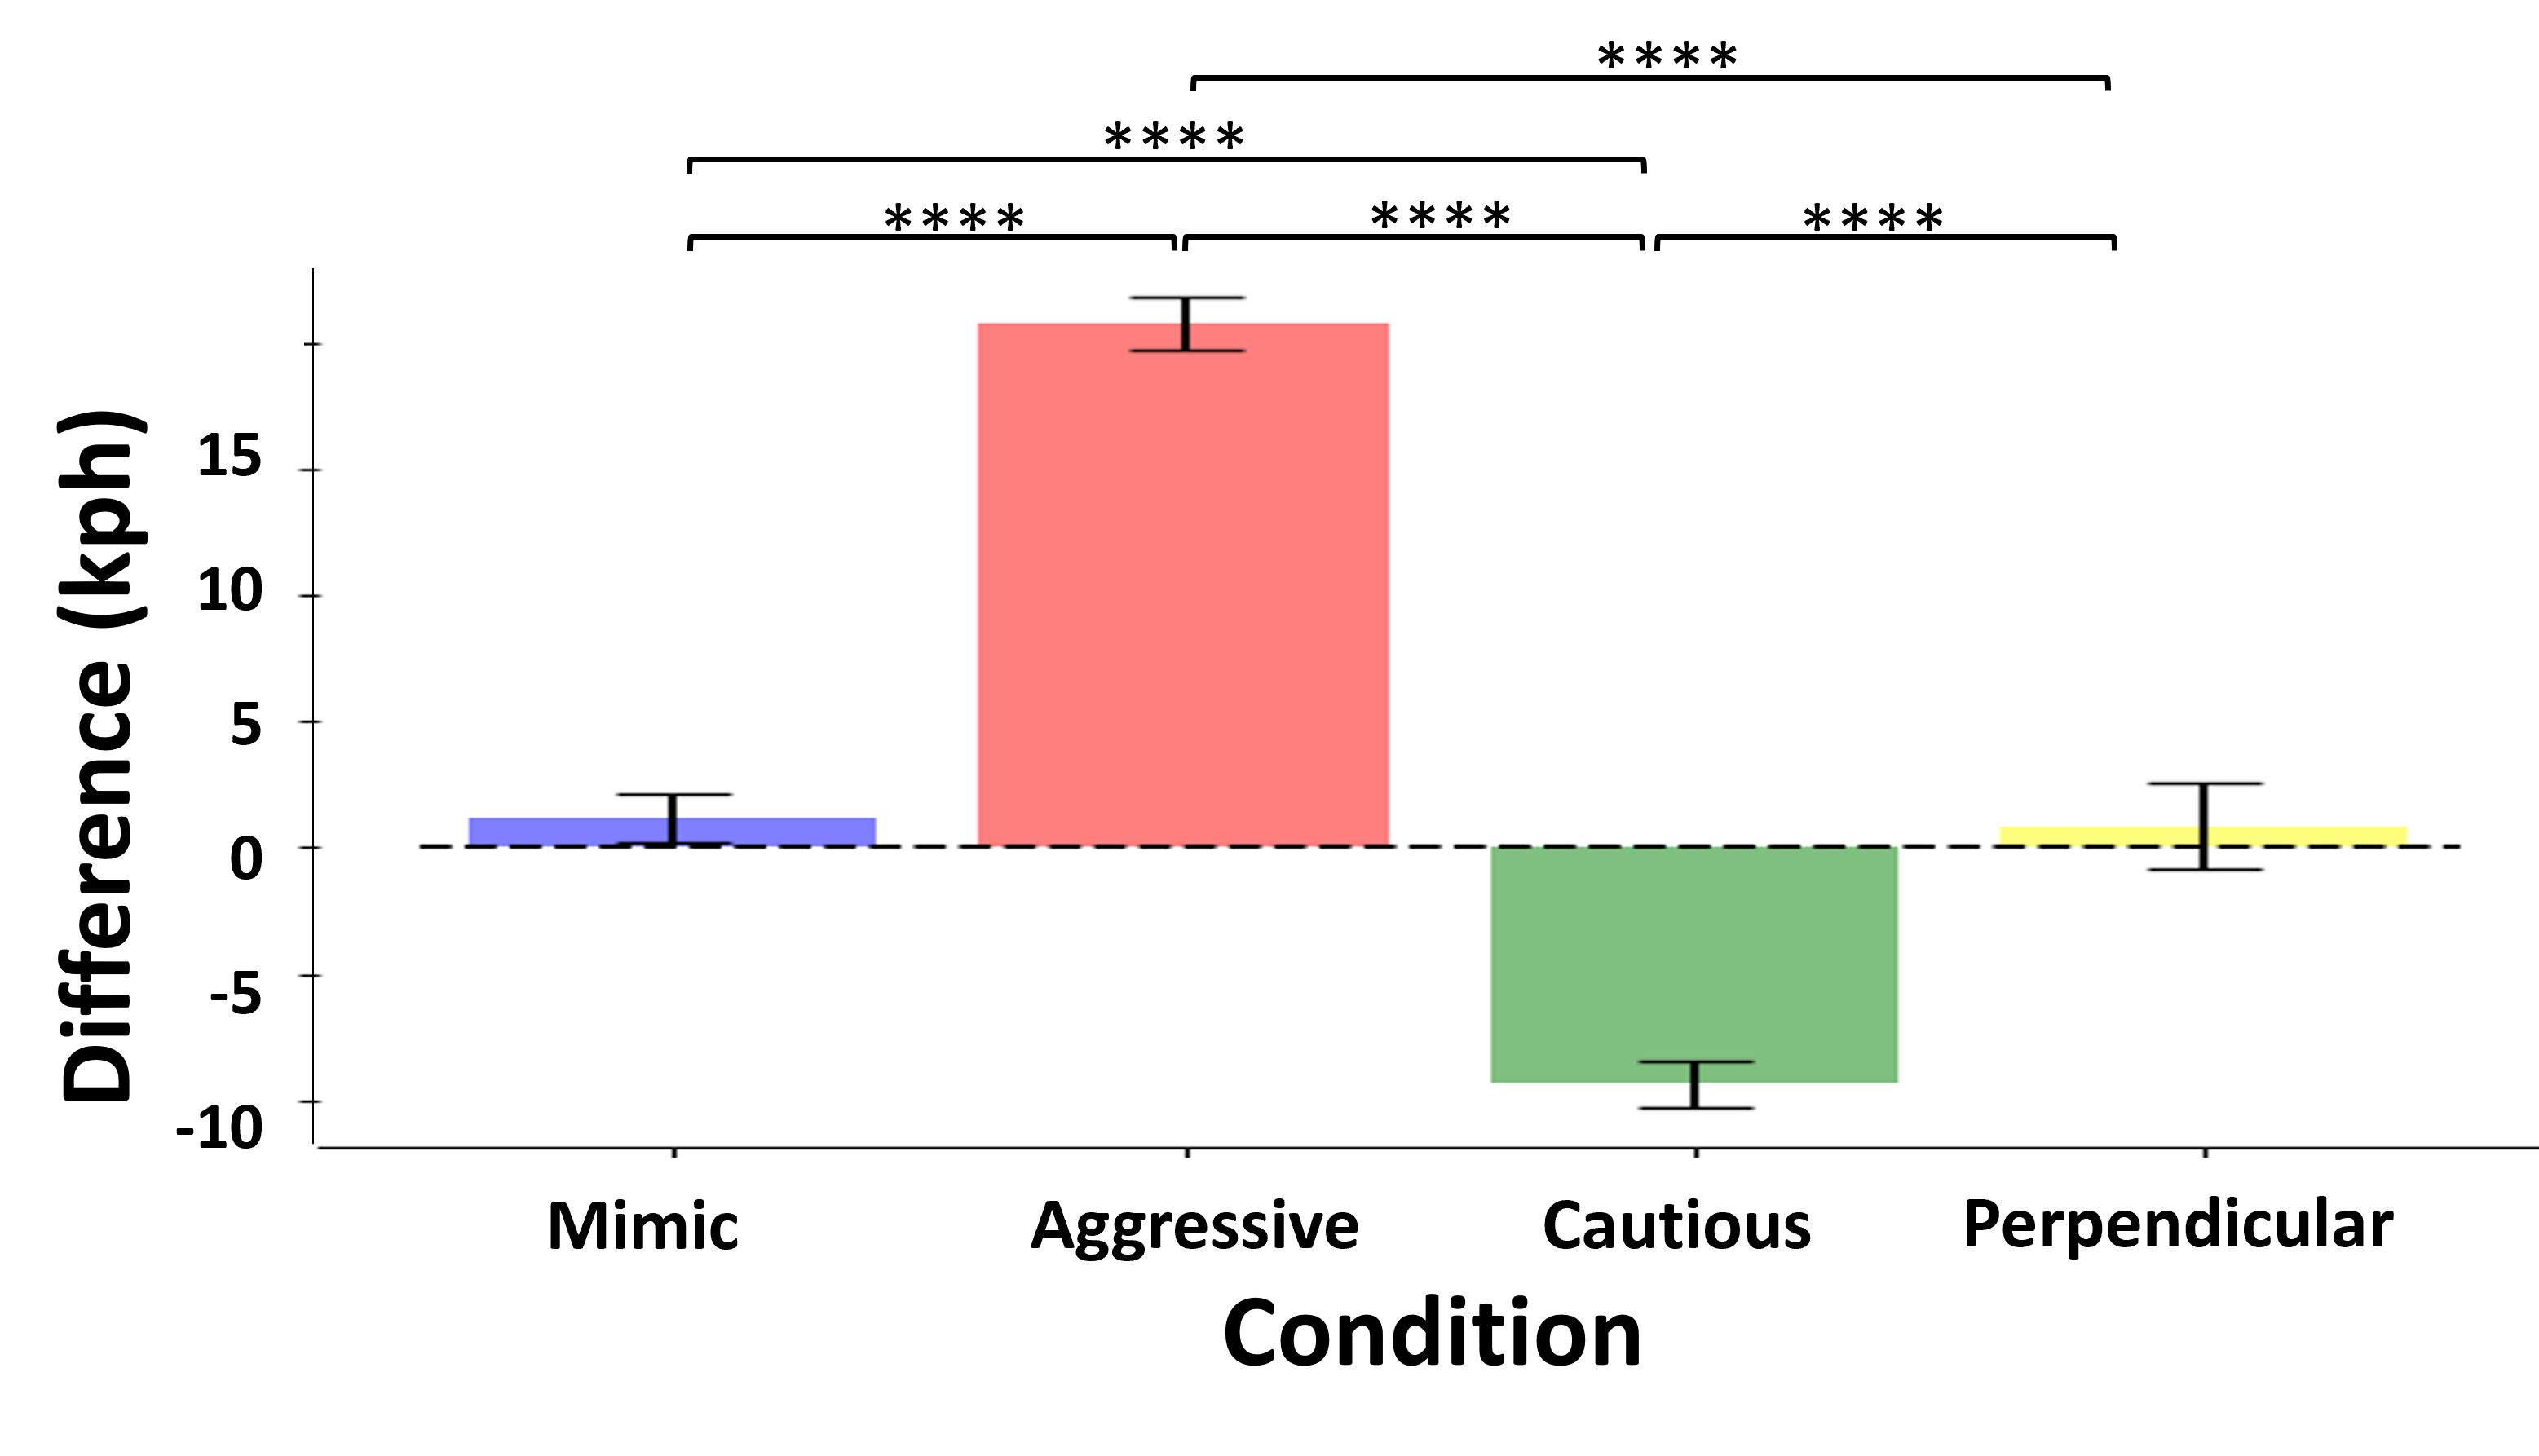
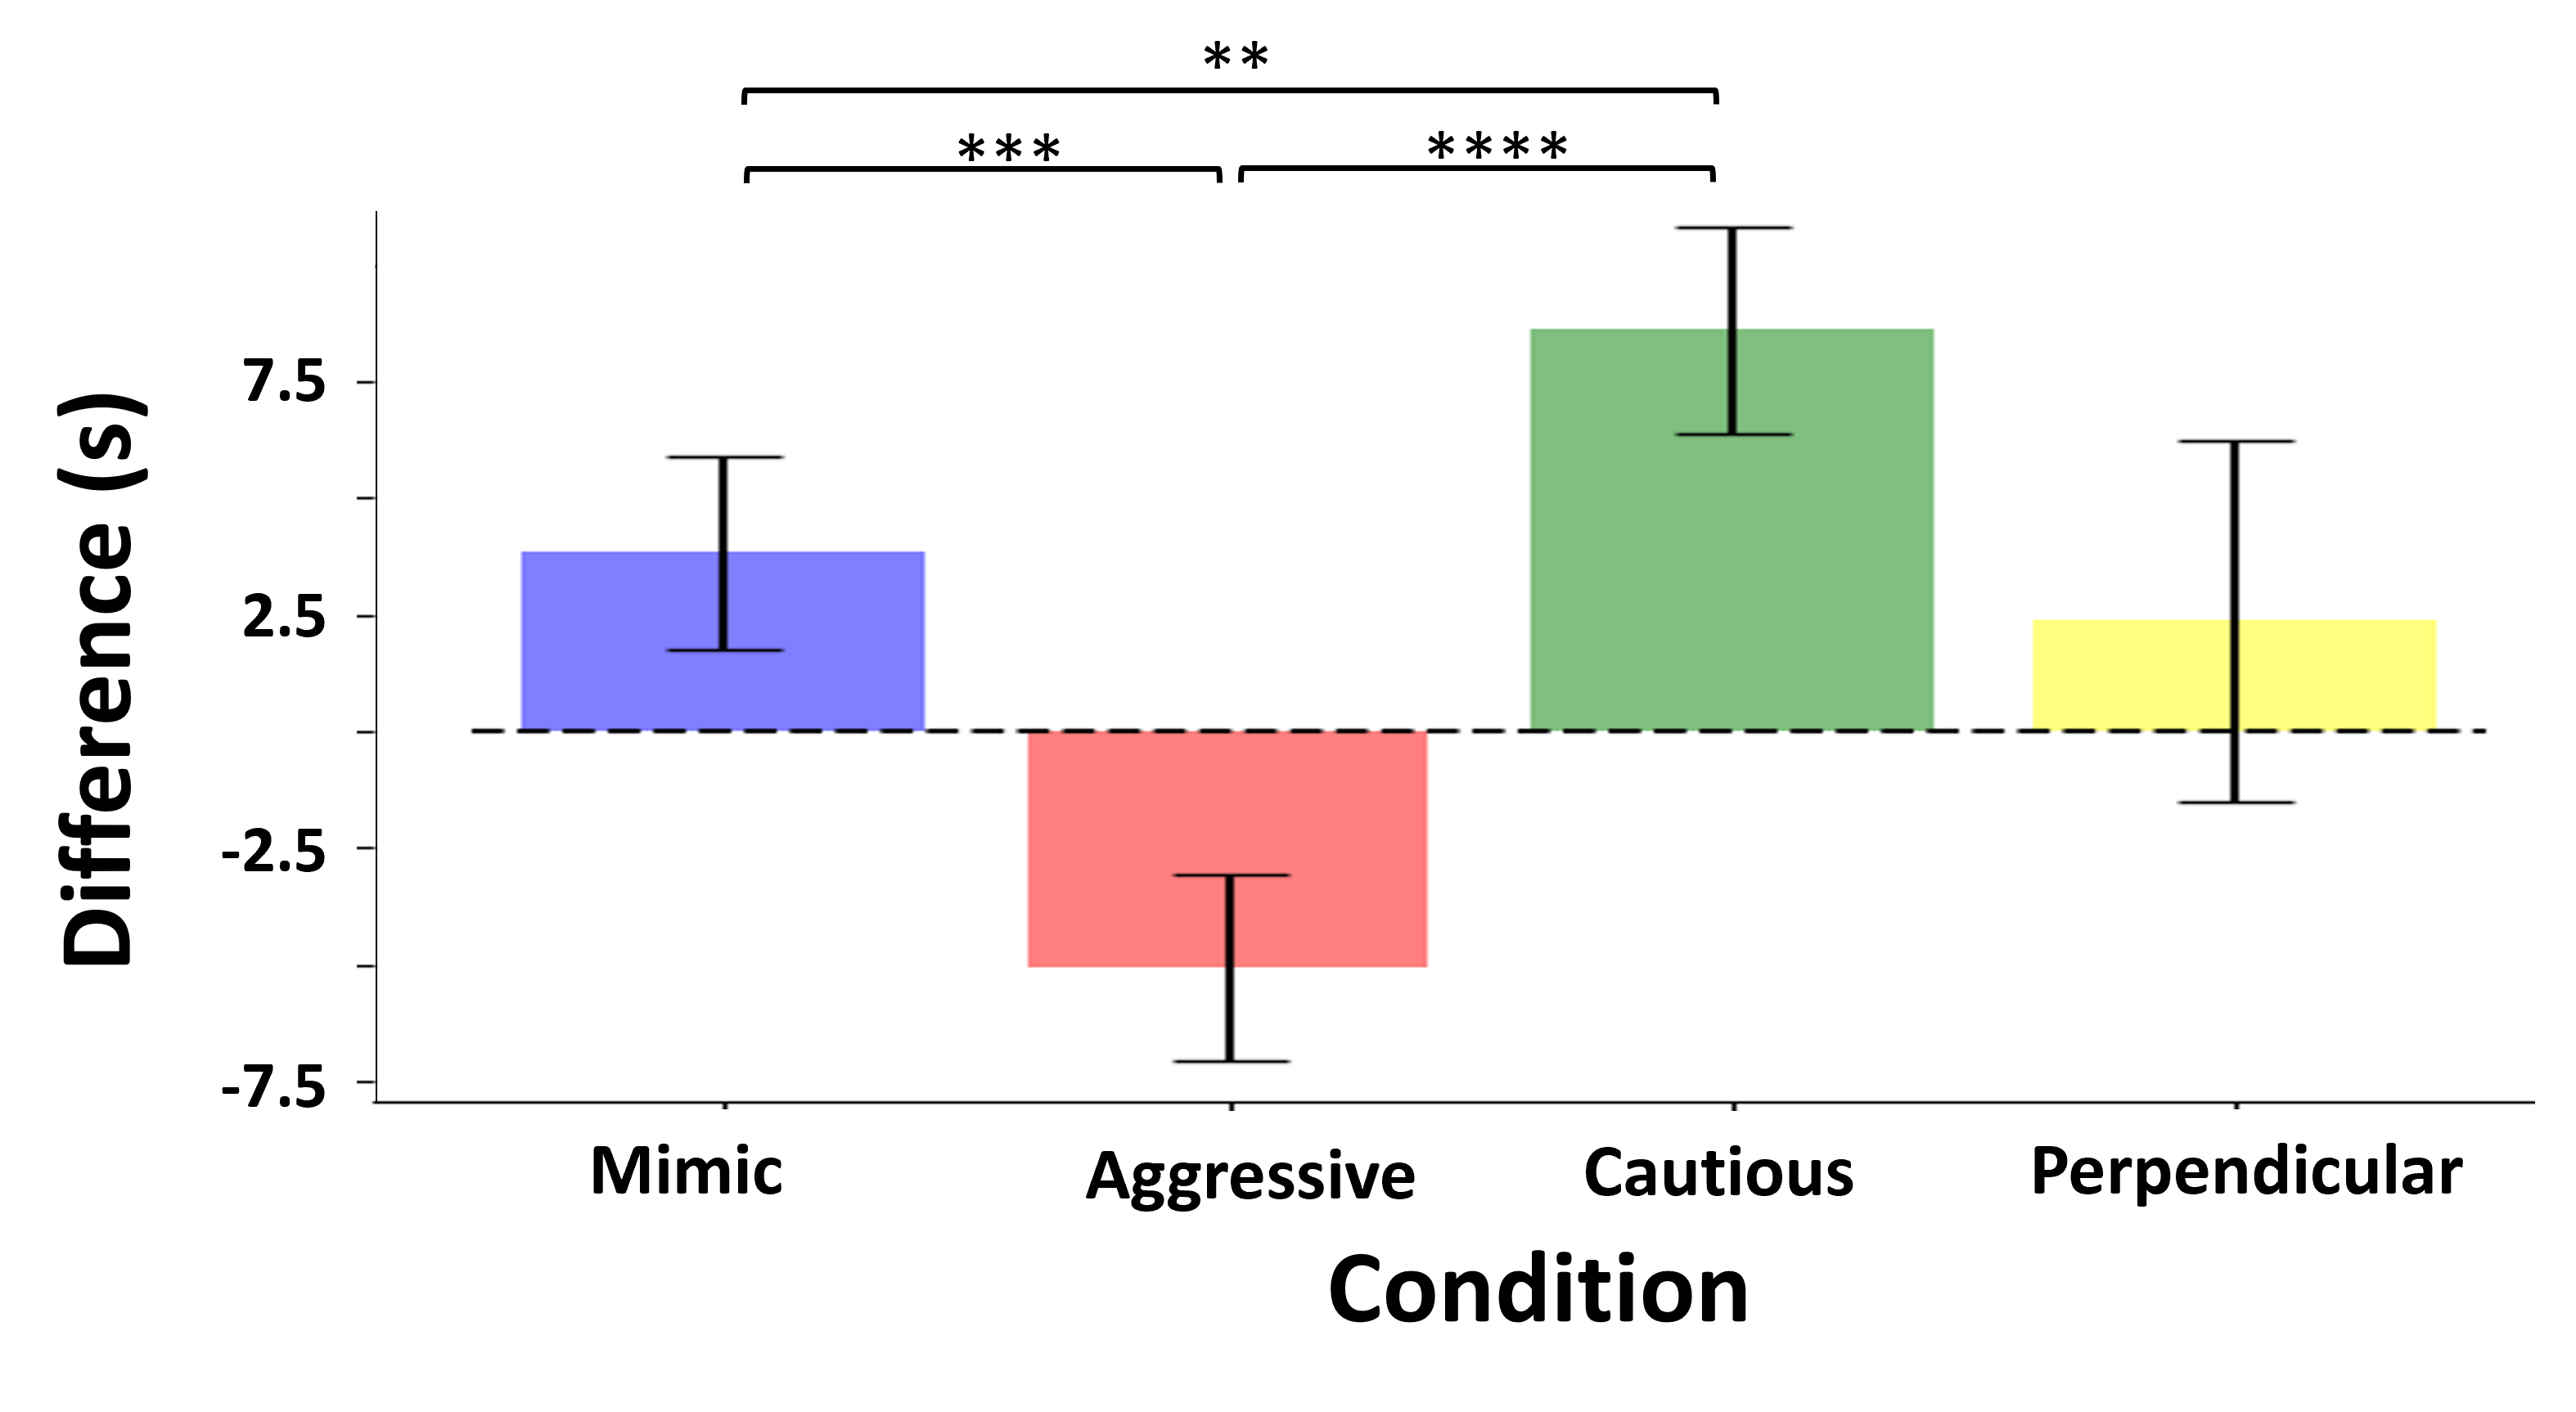
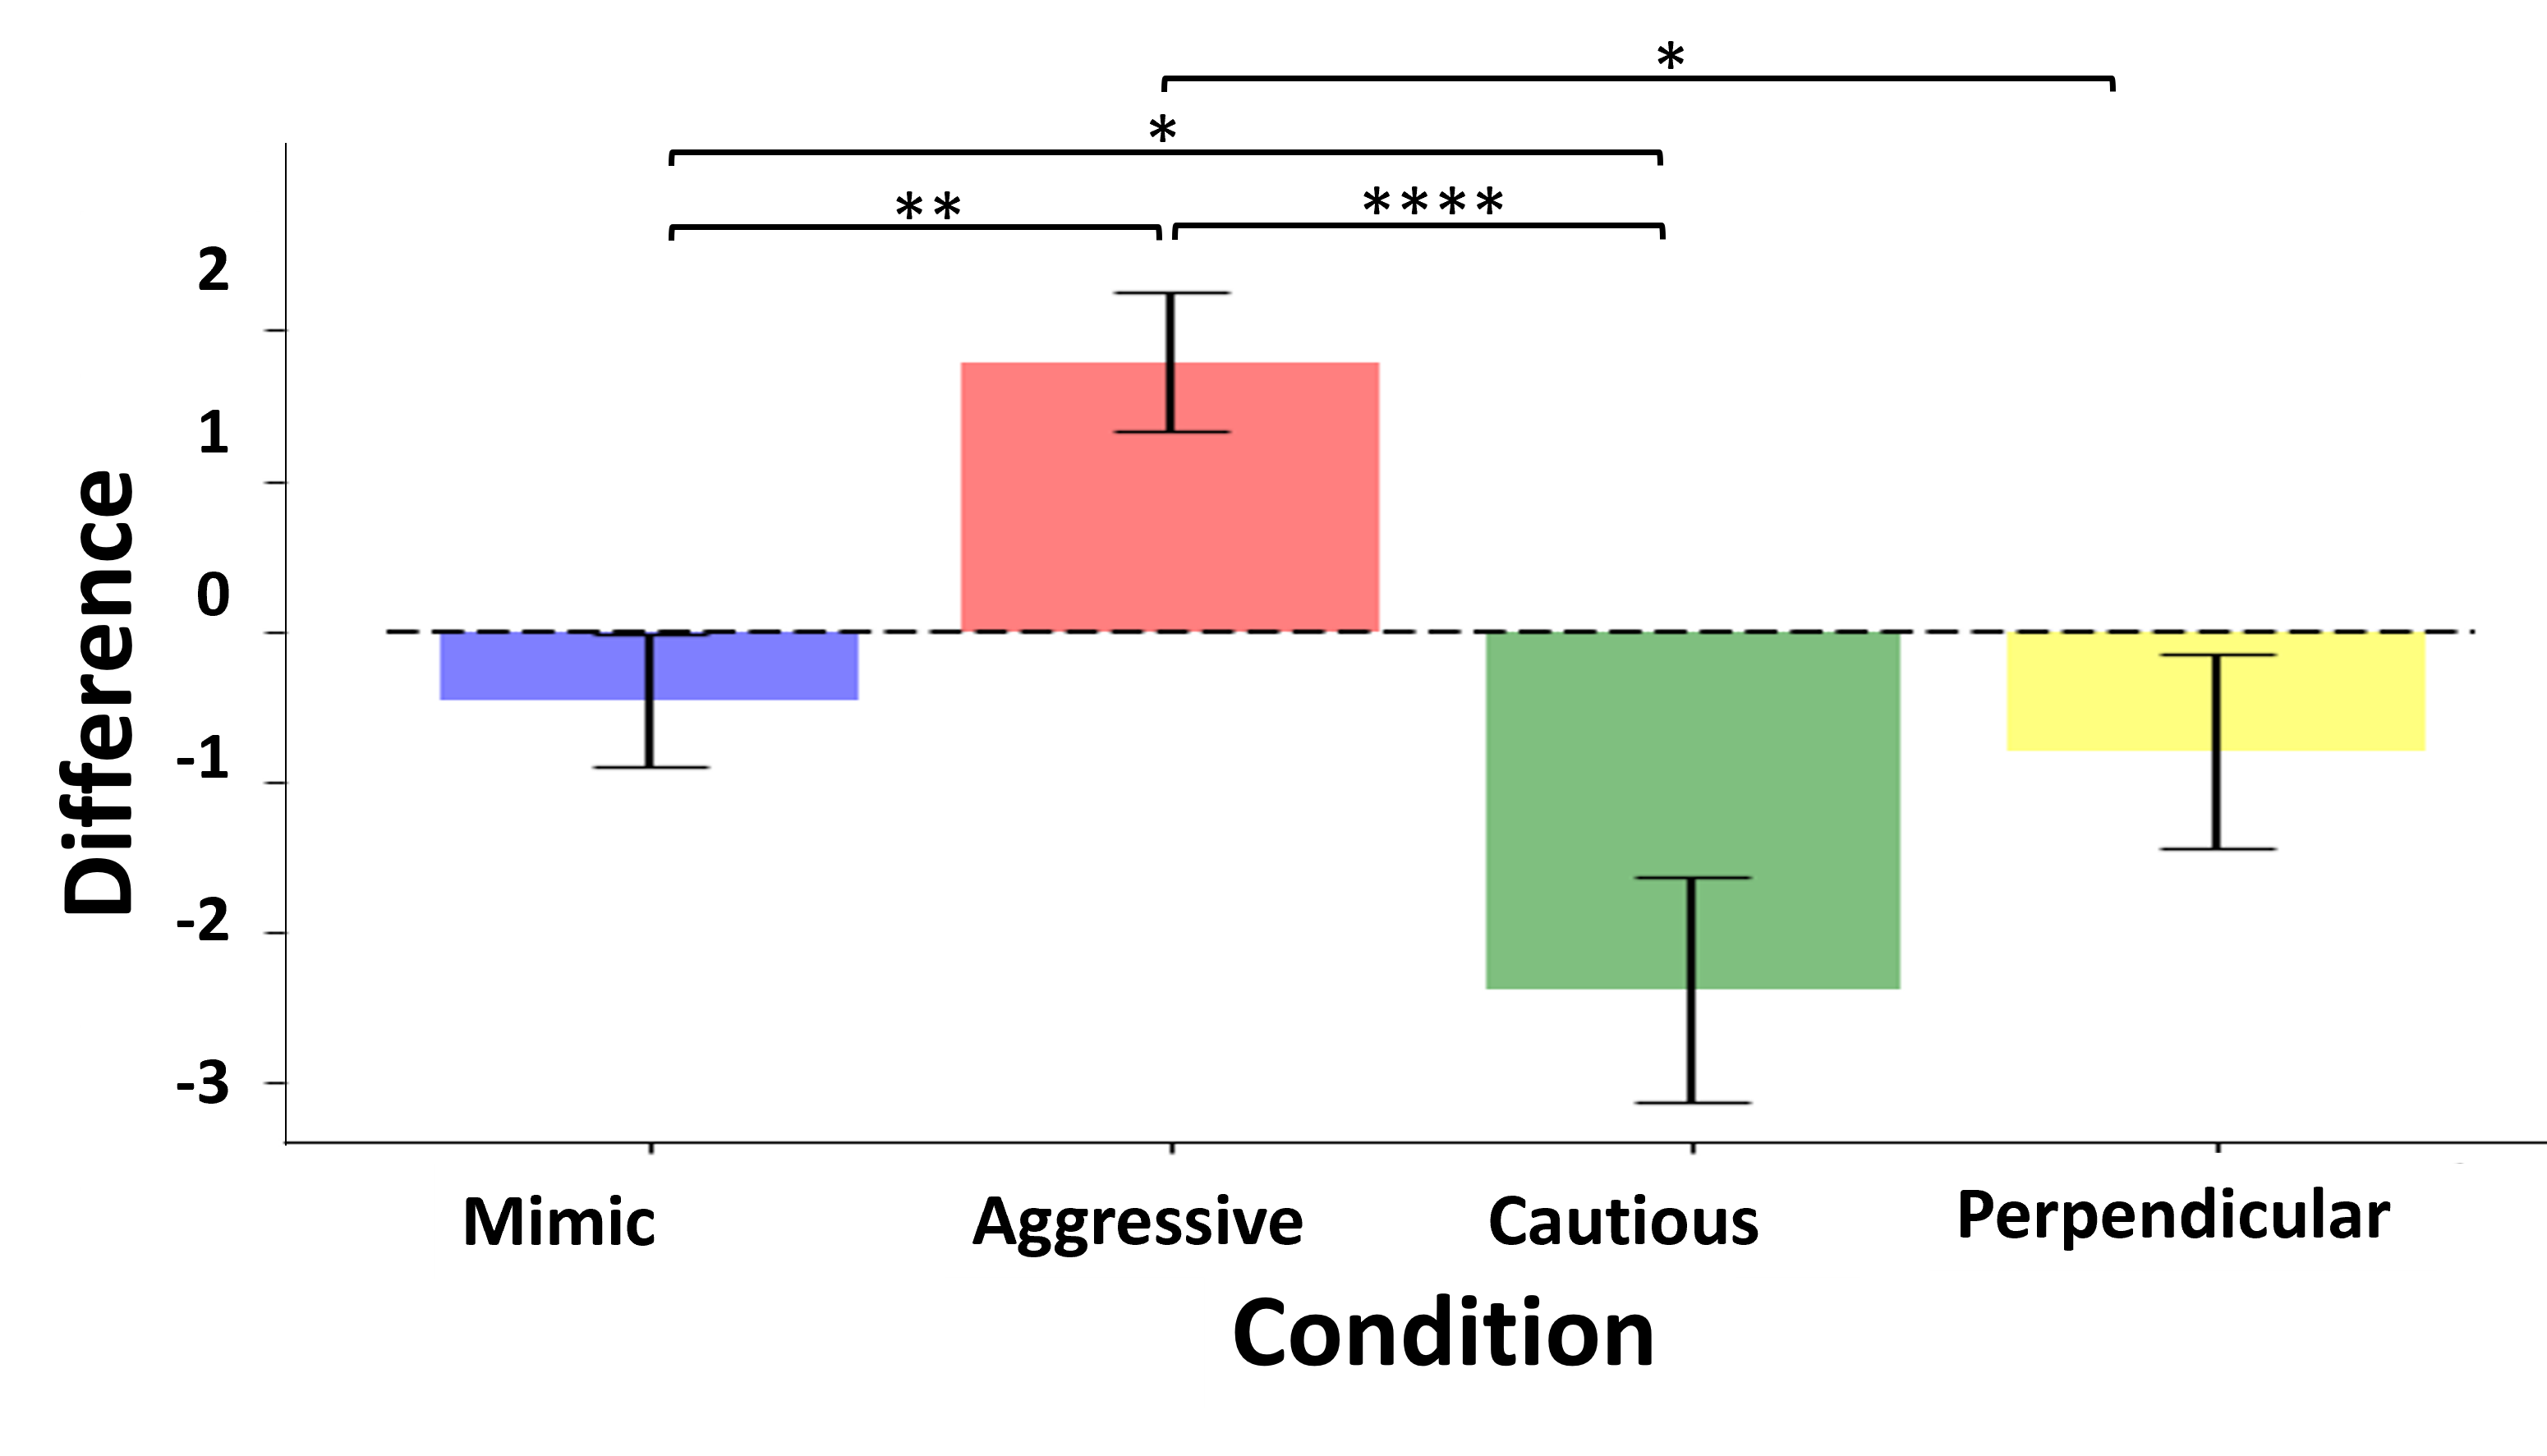
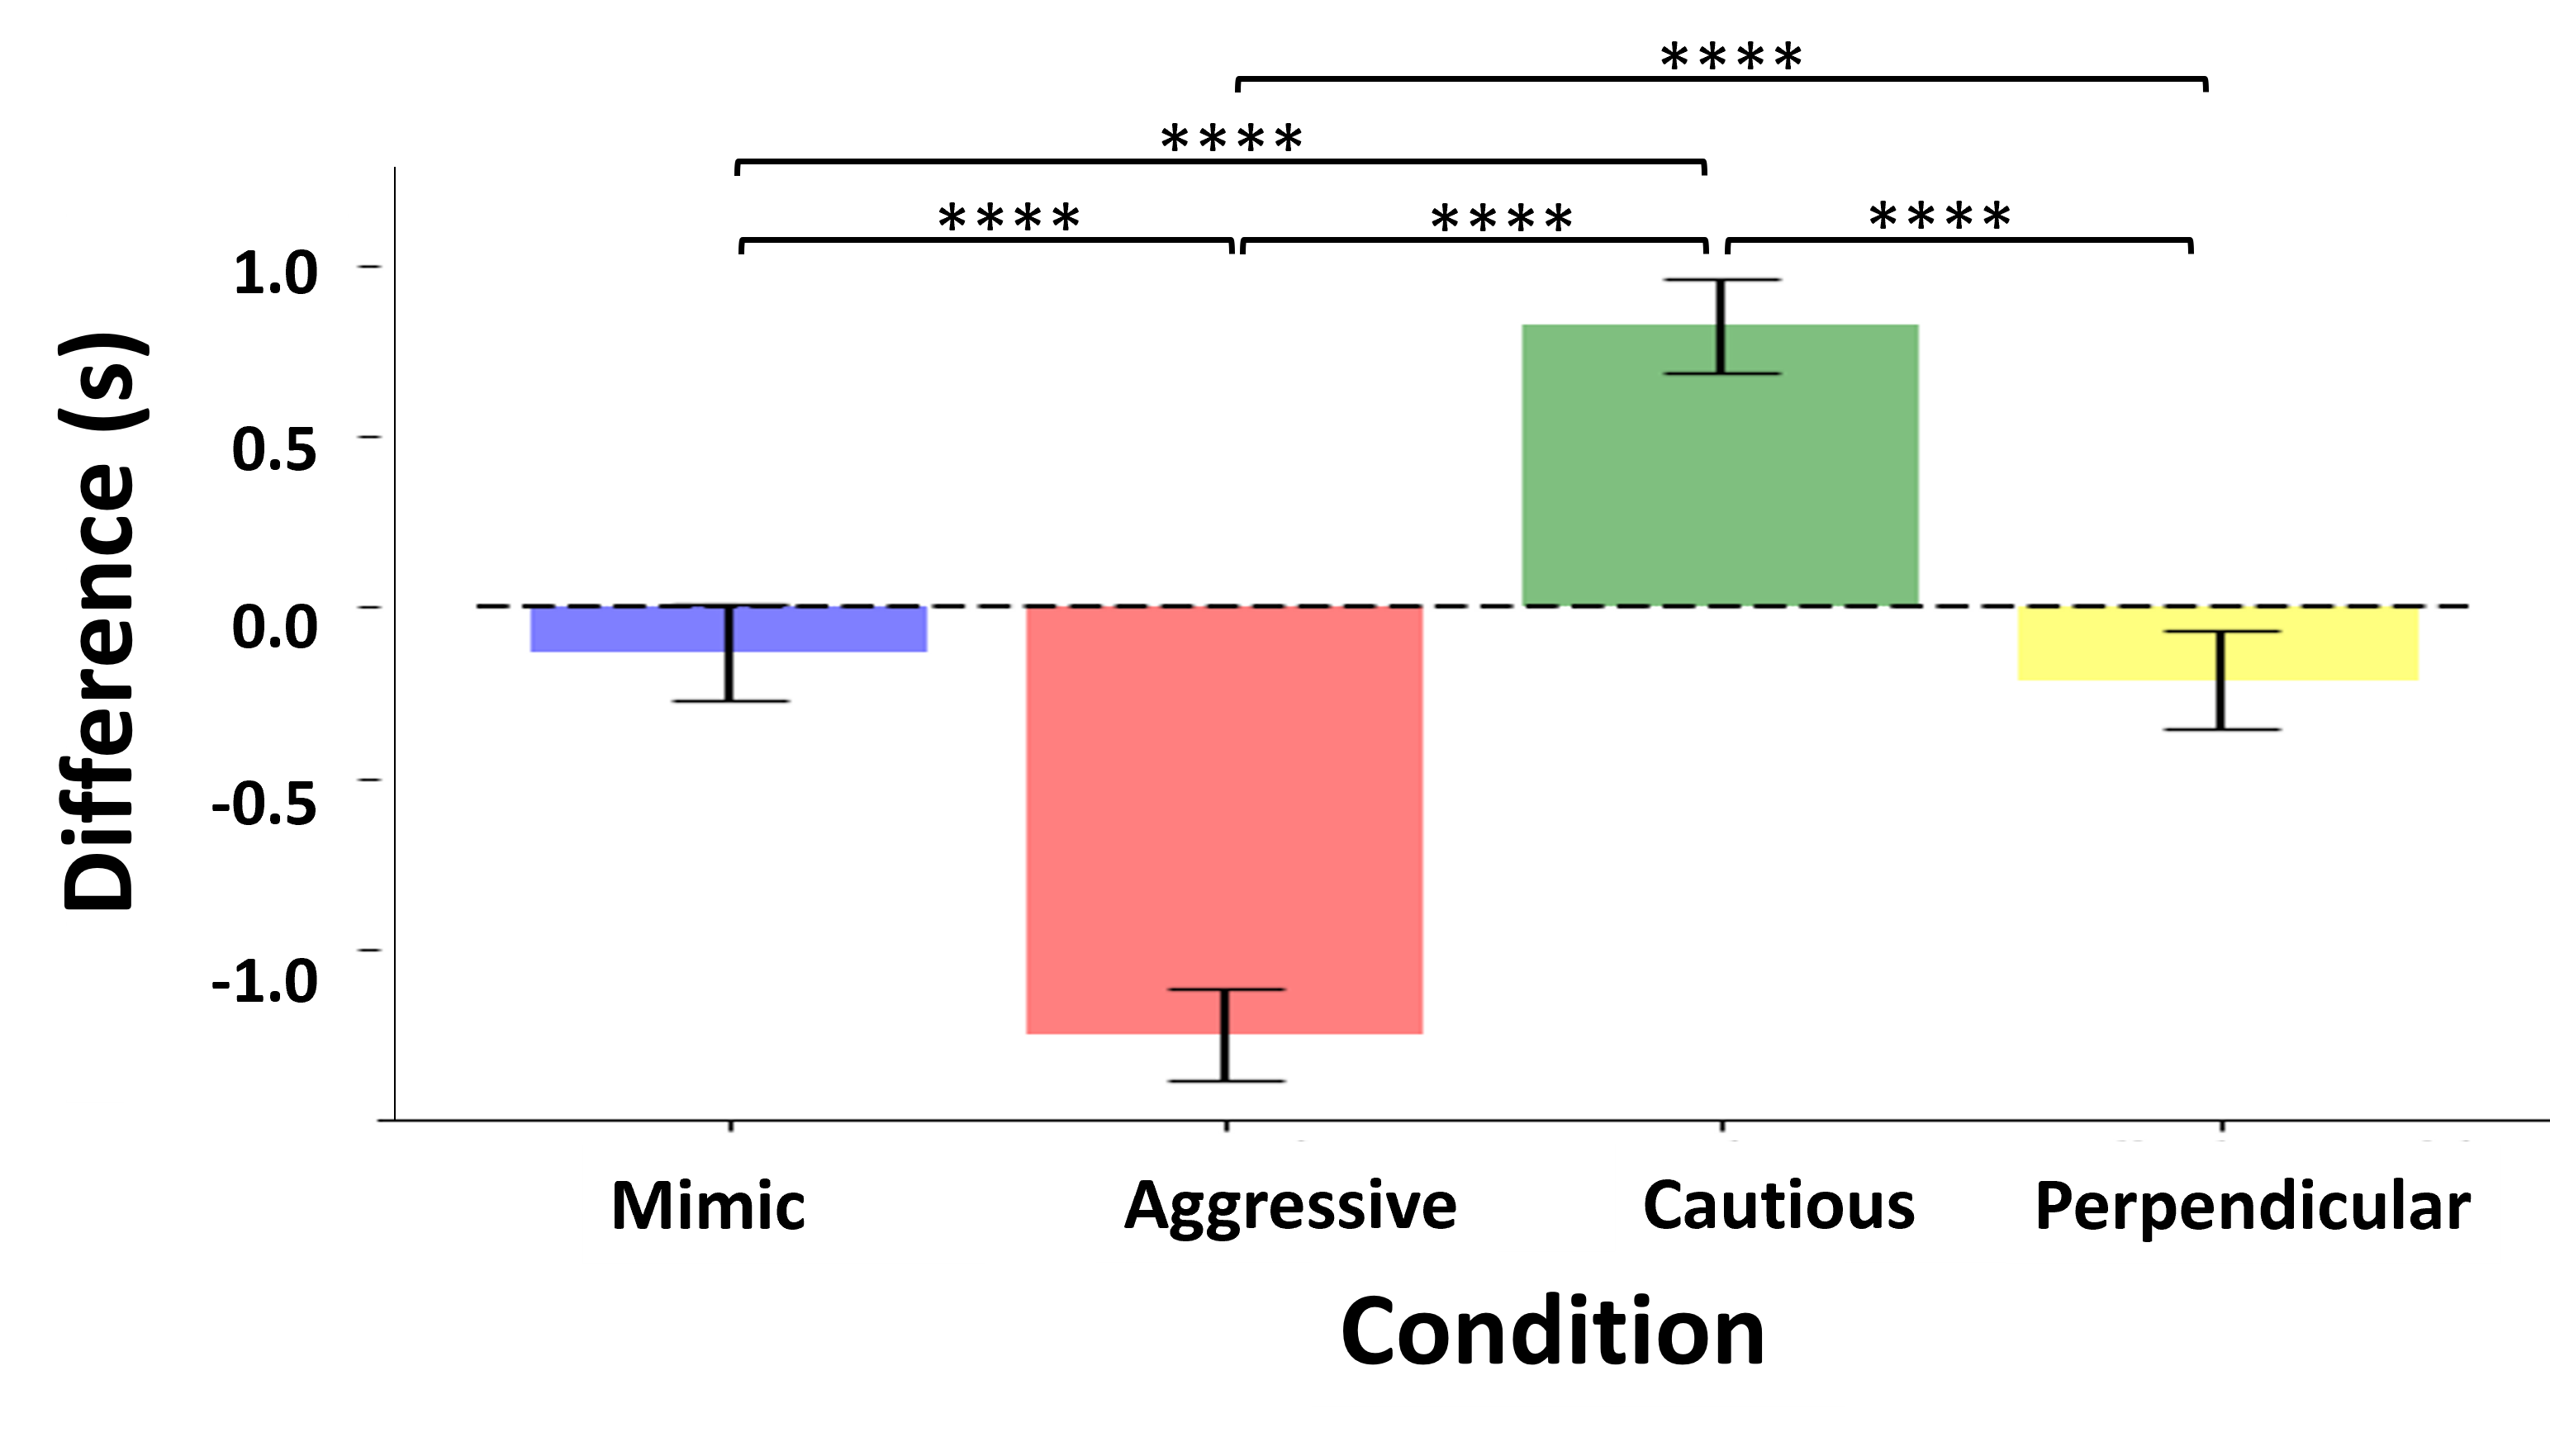
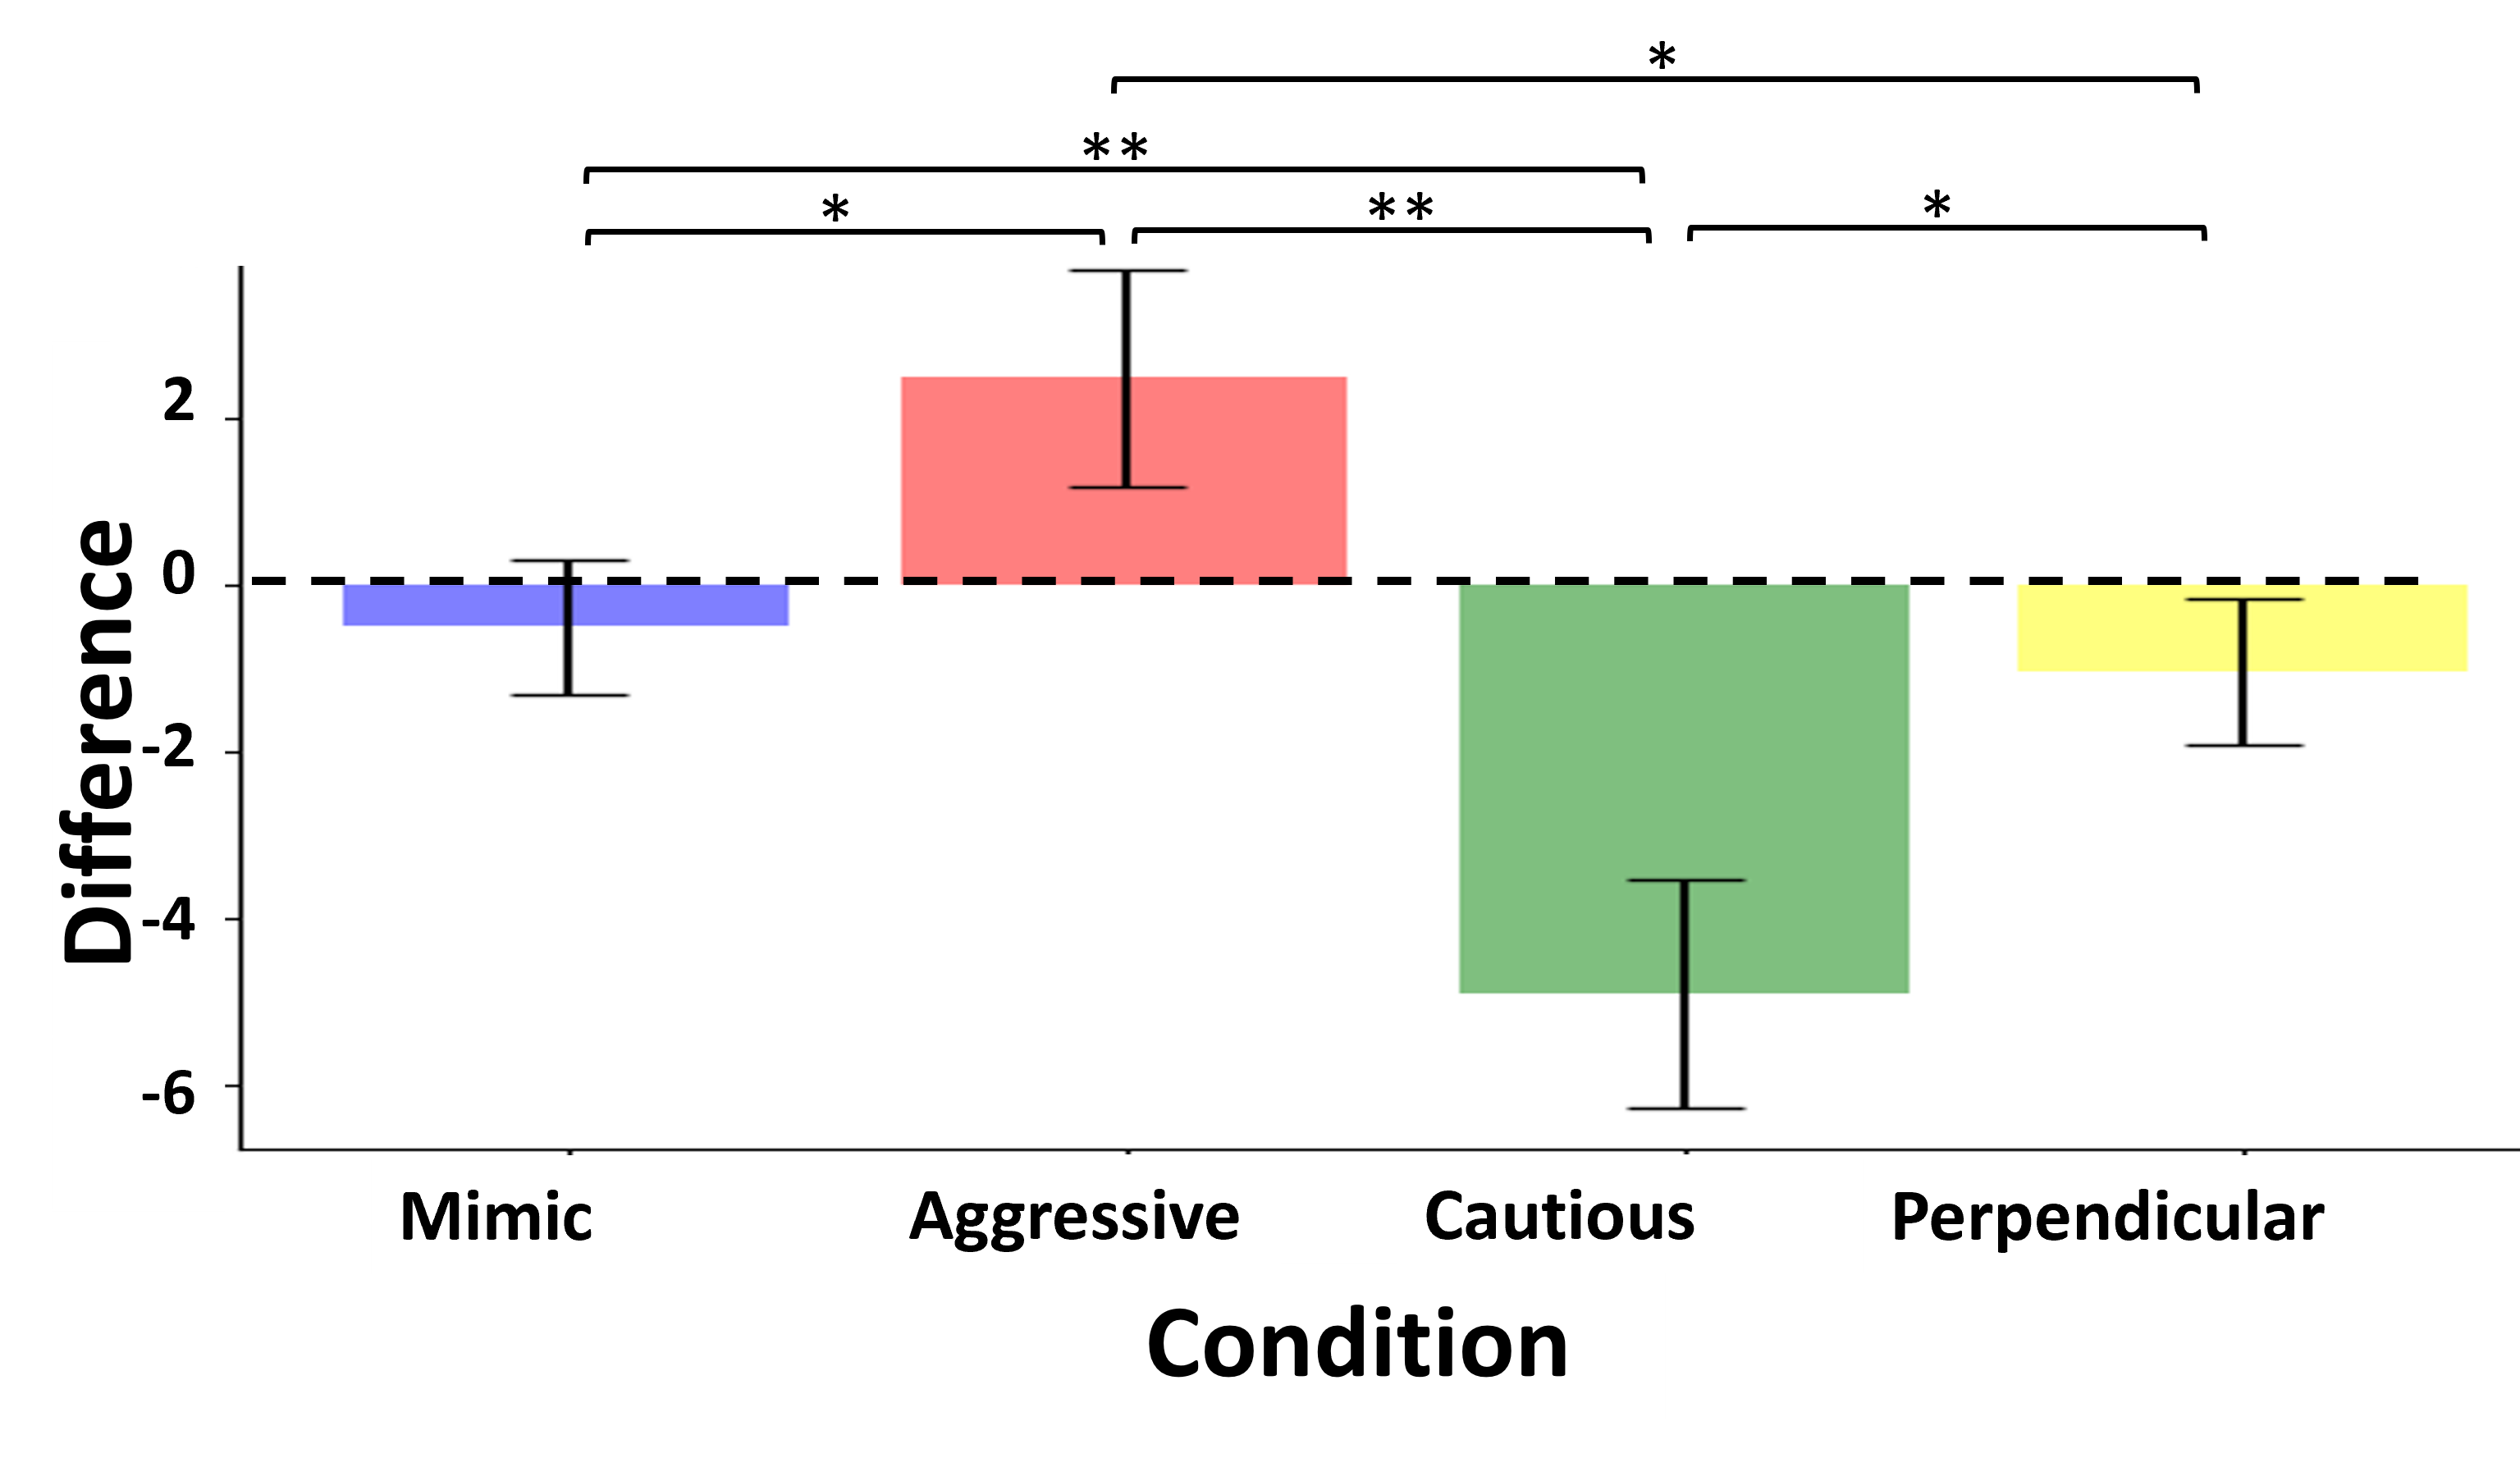
Fig. 5 shows the differences in our objective and subjective metrics between the participant’s driving style and the behavior produced by our four conditions. To determine if there are significant differences between conditions for each of the metrics, we conduct a repeated measures ANOVA with Holm’s post hoc correction or a Friedman’s test when the data fails assumptions. We find that the difference between Mimic and the participant’s driving is significantly less compared to Aggressive and Cautious for all objective metrics () (Fig 5(a) - 5(e)). We find that Aggressive maintains a higher velocity compared to Mimic. Additionally, as predicted by prior work [5, 24], aggressive achieves a lower headway merge back time and headway merge back distance. Furthermore, Aggressive commits more lane changes compared to Mimic despite encountering the same number of leading vehicles. We find opposite results with the Cautious condition. We illustrate that the characteristics of our AV driving styles align with the characteristics indicative of aggression in prior work, suggesting that our approach can effectively modulate aggression with respect to one’s own driving style [5, 24, 33].
Additionally, as shown in Fig. 5(f), we find that participants rate Cautious as significantly less aggressive compared to Mimic () and Aggressive as significantly more aggressive (). Furthermore, we find that Mimic and Perpendicular are rated as similarly aggressive compared to the participant’s own driving. Our objective and subjective results together support our hypotheses that 1) our approach is capable of mimicking driving style and 2), by shifting a participant’s learned embedding along the aggressive dimension, we are able to produce objectively and subjectively more aggressive and cautious behavior.
V-C Maintaining Other Aspects of Driving Style
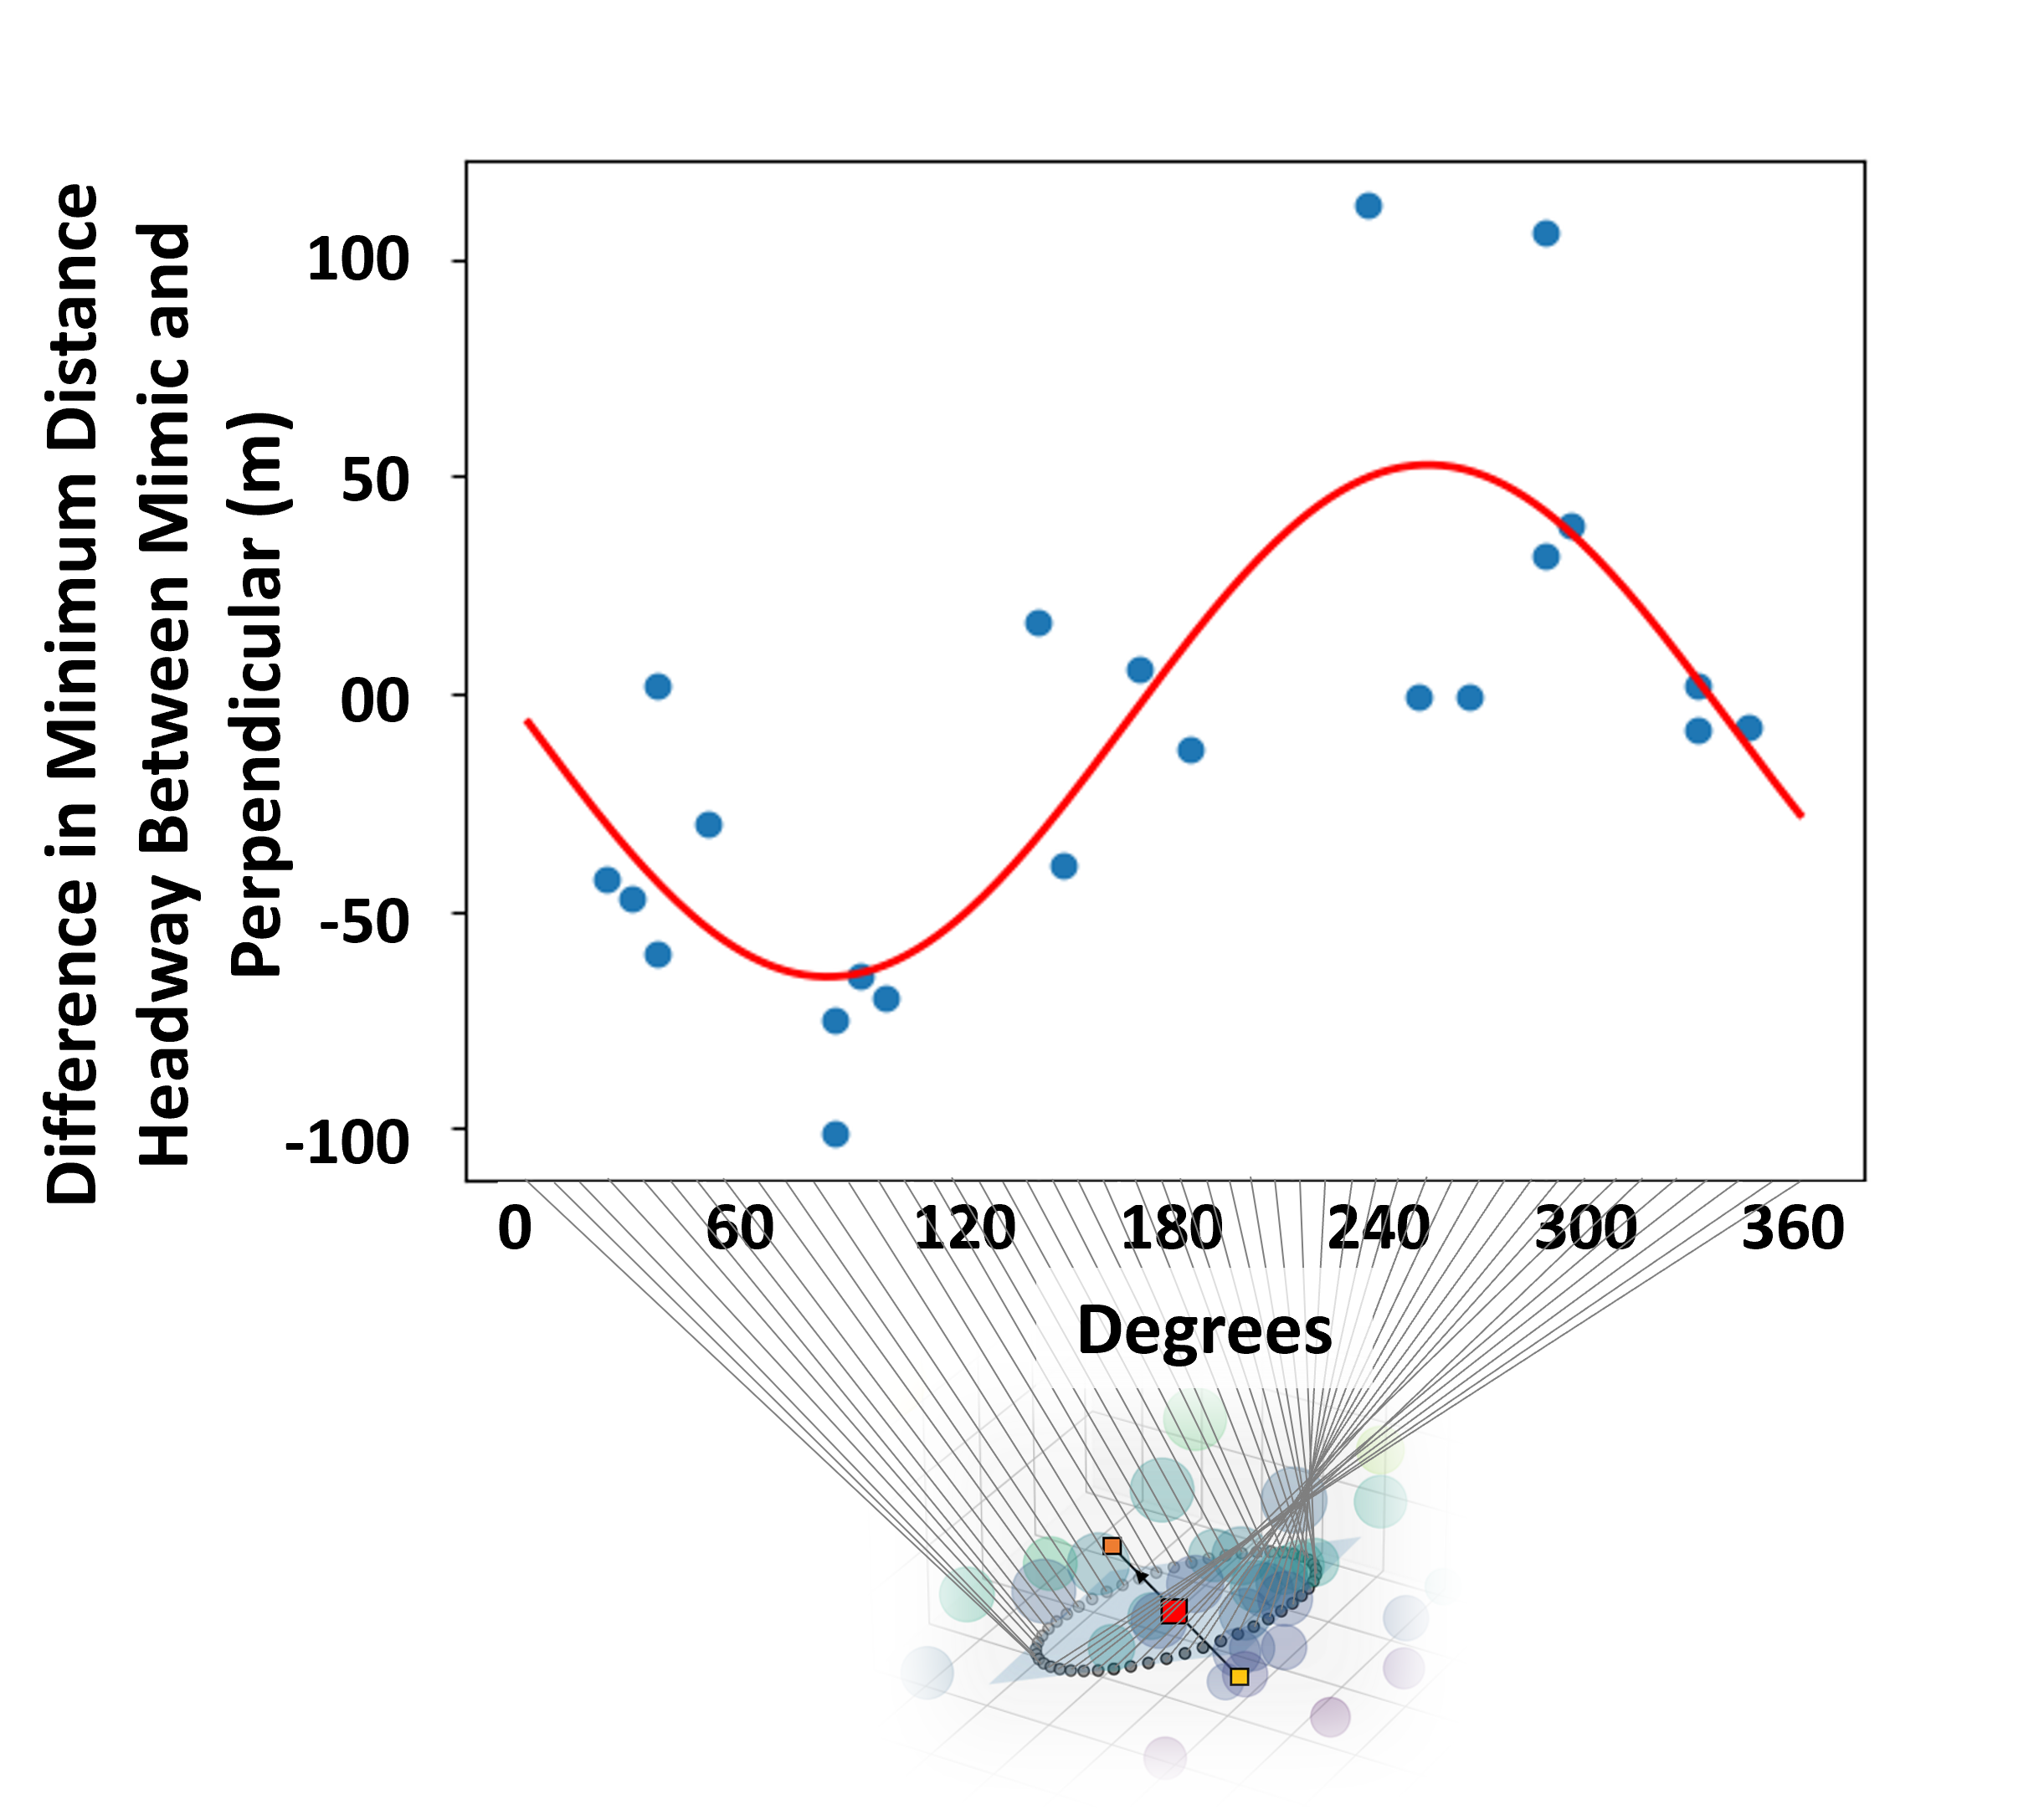
One of the goals of our approach is to modulate aggression while maintaining other aspects of driving style. If moving along the gradient of aggression modulates the aggressive aspect of the driving style, then we hypothesize that moving within the plane perpendicular to aggression will modulate other aspects of driving style unrelated to aggression. Interestingly, we found that minimum headway distance and fraction of time in the left lane were not significantly correlated with the embeddings position along the aggressive gradient. Moving along the gradient does not significantly alter minimum headway distance or fraction of time in the left lane, suggesting that, in our learned embedding space, these factors do not play a large role in aggressiveness. Therefore, we predict that these aspects of driving will instead be modulated when we move perpendicular to the gradient of aggression. To test this hypothesis, in Fig 6 we plot the difference in minimum headway distance between Mimic and Perpendicular versus the position around the ellipse that is depicted in Fig. 4. We find that minimum headway distance does in fact correlate with position around the ellipse (). We additionally find that the fraction of time in the left lane significantly correlates with position around the ellipse ().
We note that minimum headway distance is often associated with aggression [37]. However, this is most often the case when the ego vehicle is not capable of changing lanes and is instead forced to following a leading vehicle. We hypothesize in our work that minimum headway distance is not correlated with aggression because the participant can choose to change lanes at any point to pass a slower driver and therefore is not forced to maintain a following distance if they do not want to.
| Independent | Dependent | Statistic | p-value |
|---|---|---|---|
| Conscientious | M-C Competence | ||
| Conscientious | M-C Intelligence | ||
| Conscientious | M-C Discomfort | ||
| Conscientious | M-C Trust | ||
| Conscientious | M-A Competence | ||
| Conscientious | M-A Intelligence | ||
| Conscientious | M-A Discomfort | ||
| Conscientious | M-A Trust | ||
| Openness | M-A Discomfort | ||
| Similarity | Trust | ||
| Similarity | Intelligence | ||
| Similarity | Competence | ||
| High-Velocity | M-A Intelligence | ||
| High-Velocity | M-A Competence | ||
| High-Velocity | M-A Trust |
V-D Homophily
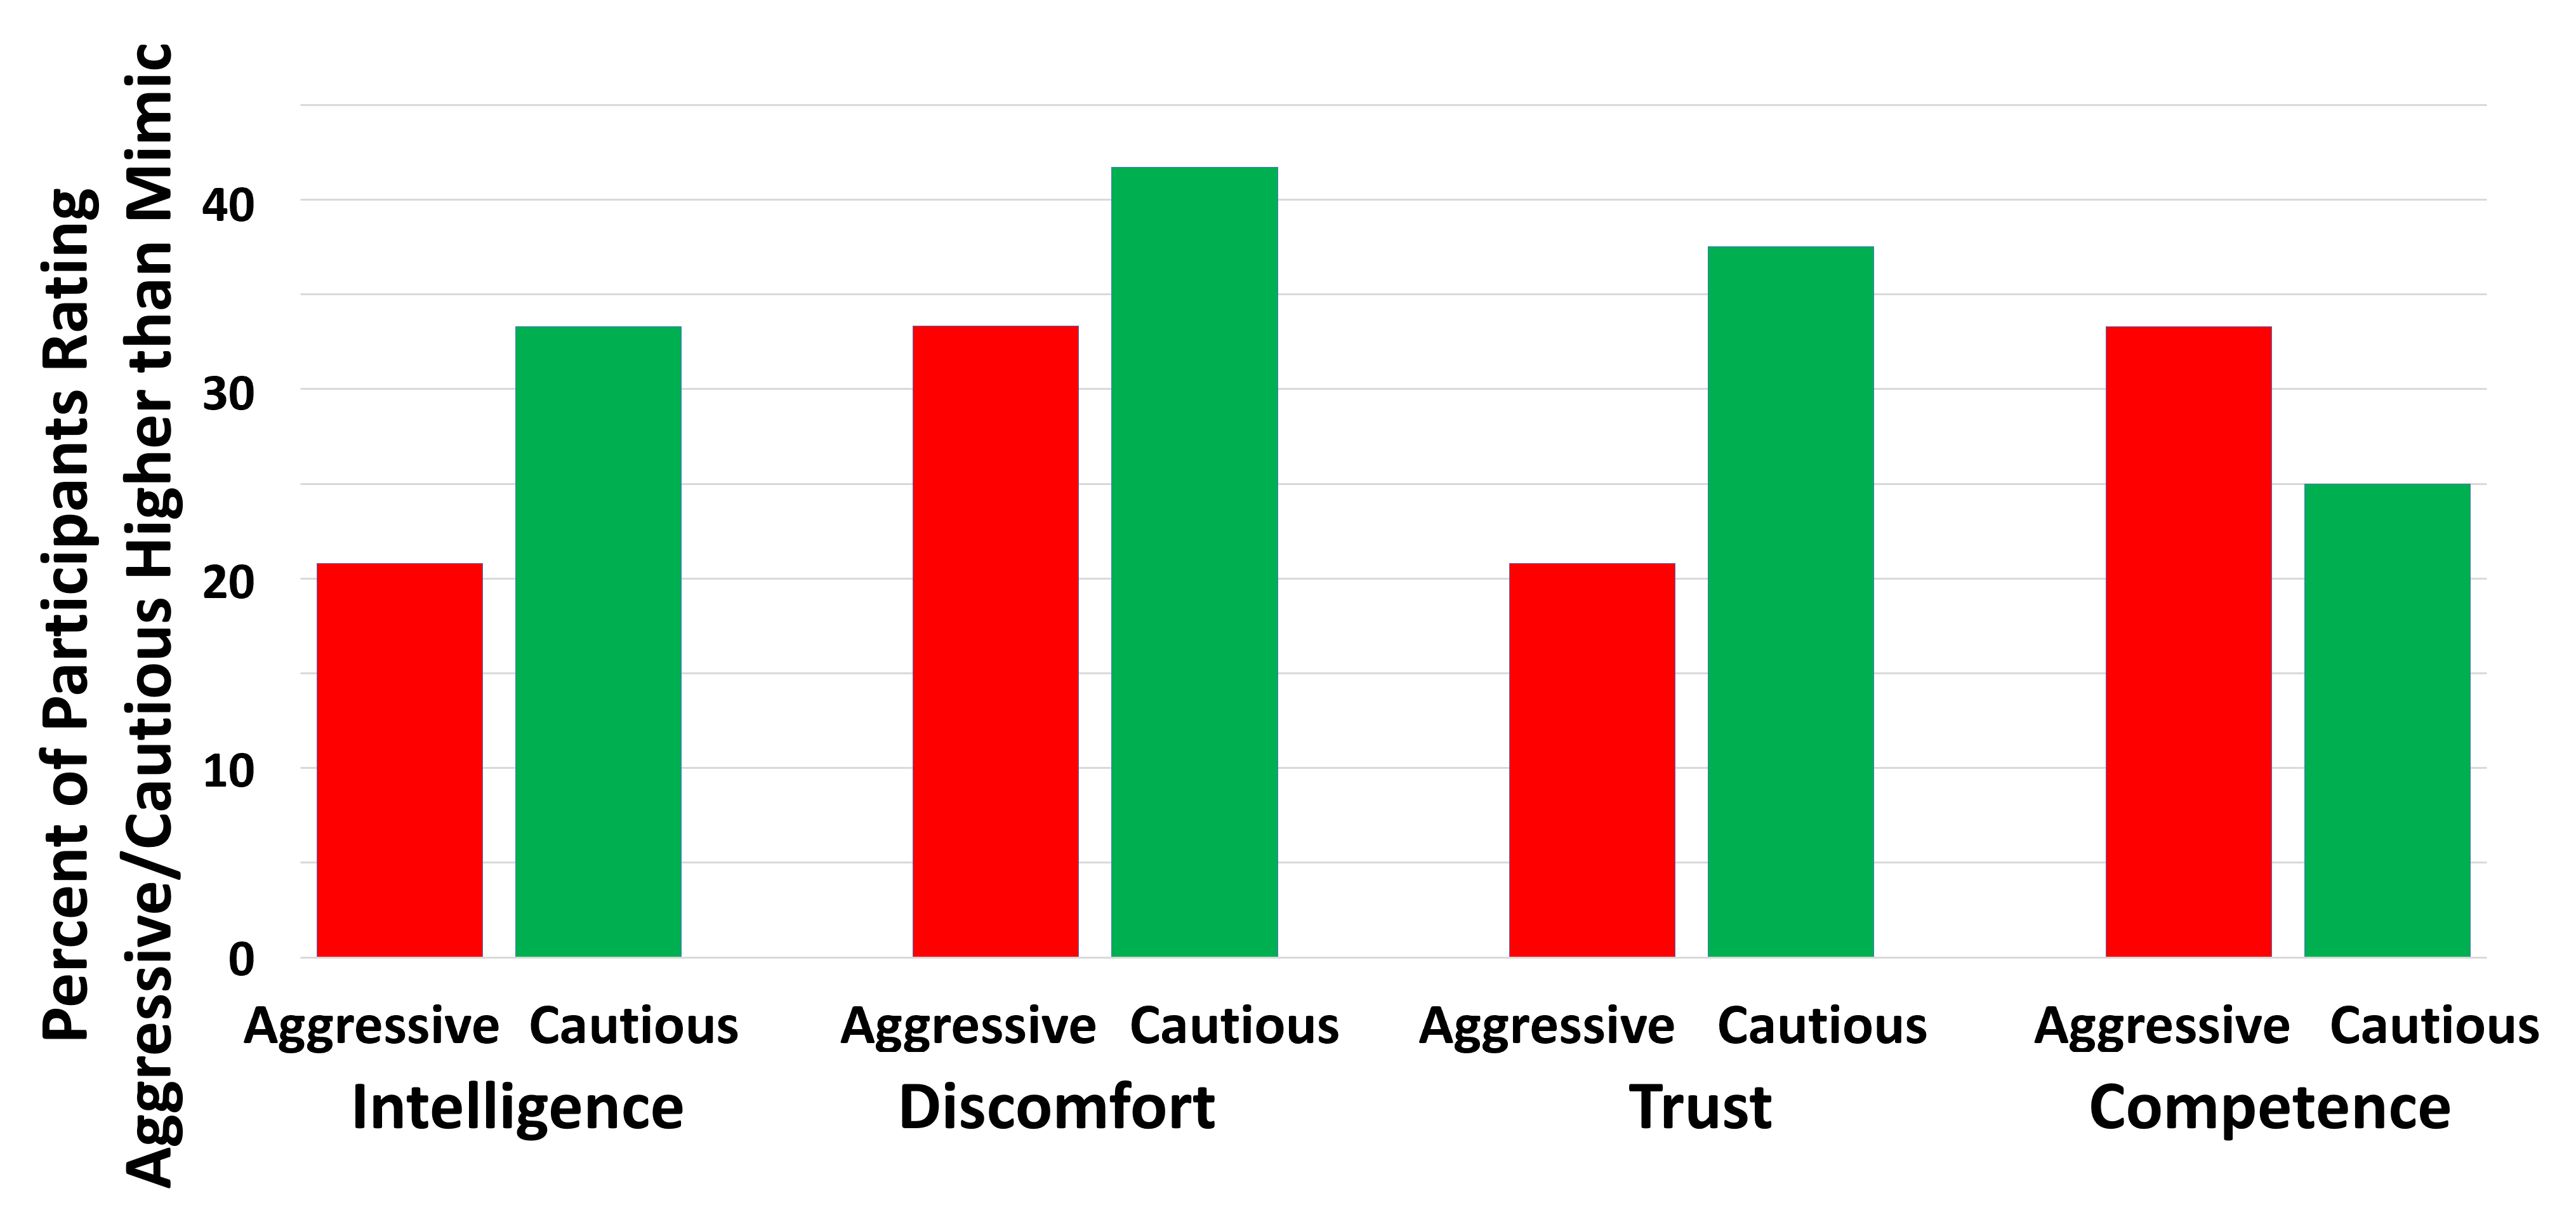
As shown in Fig. 7 not all participants preferred the Mimic condition. More than 20% of participants preferred the Aggressive condition and more than 25% of participants preferred the Cautious condition. To explain this finding, we next explore the factors that modulate the effect of homophily (Table I) to determine why some participants prefer a driving style different from their own. First we investigate if a participant’s personality impacts their preference via a correlation analysis. As shown in Table I, we find a strong correlation between conscientiousness (i.e., the extent to which one is responsible and dependable [38]) and the difference between a participant’s perceived competence of Mimic compared to Cautious, suggesting that individuals higher in conscientiousness prefer a more cautious style to their own. This finding may explain why 62.5% of participants rated Mimic as less than or equal in competence relative to Cautious. To further support the hypothesis that conscientiousness influences the effect of homophily, we find that participants who are higher in conscientiousness rate a more cautious style as significantly more intelligent, comfortable, and trustworthy compared to Mimic and significantly more competent, intelligent, comfortable, and trustworthy compared to Aggressive.
We additionally find that openness (the degree to which one is broad-minded [38]) correlates with the difference between a participant’s comfort with Aggressive compared to Mimic. This finding suggests that those who are more open to new experiences may prefer a more aggressive AV and may explain why 37.5% of participants rated Aggressive as causing greater comfort compared to Mimic.
Prior work suggests that perceived similarity to one’s own driving style is an important aspect of AV acceptance [5]. To investigate this claim, we conduct a correlation analysis between perceived similarity and an end-users preference for the AV. We find a positive correlation between perceived similarity and trust, intelligence, and competence. This finding suggests that perceived similarity should be taken into consideration when optimizing AV driving style.
Prior work demonstrated that one’s own driving style may impact preference for an AV’s style (e.g., more aggressive drivers prefer relatively less aggressive AVs) [5, 39]. To investigate this question further, we conduct a correlation analysis between the dimensions of the Multi-Dimensional Driving Style Inventory [34] and preference for Aggressive and Cautious compared to Mimic. We find that participants who report a high-velocity driving style rate Aggressive to be significantly higher than Mimic in intelligence, competence, and trustworthiness. This findings suggests that high-velocity drivers may prefer a more aggressive AV. Due to the contradictory findings with prior work, we aim to conduct a deeper analysis into how the specific dimensions of one’s own aggressive style impact the effect of homophily in future work.
We note that the results we present are an exploratory analysis and we do not claim to demonstrate a causal relationship between the subjective factors discussed above and homophily. However, our findings suggest that these factors warrant further investigation in future work. Overall, our findings demonstrate that personality traits, perceived similarity, and high-velocity driving style may be important factors in modulating the effect of homophily.
VI Discussion
Our results demonstrate the our MAVERIC framework is capable of both mimicking and modulating driving style by learning an embedding representing an end-user’s own driving style. Given other relevant factors related to end-user characteristics, we can then tune this driving style to better match the preference of the end-user. Thus, while other approaches either directly mimic the end-user’s own driving style or do not take into consideration the end-user’s driving style at all, our approach is capable of integrating both information about an end-user’s own driving style and subjective characteristics that are predictive of the optimal AV driving style.
In our analysis, we show that our learned embedding space captures salient aspects of driving style and that the gradient of aggression correlates with objective and subjective aggressive metrics. An interesting aspect of our aggressive dimension is that this representation of aggression is not based on a pre-defined or hand-crafted heuristic but is instead based upon end-users’ perception of what is meant by aggressive driving. By defining aggression via this subjective metric, we are able to produce driving styles that are perceived to be more aggressive or more cautious by end-users.
In our analysis of the effect of homophily, we aim to determine the subjective factors that future work should consider when optimizing driving style. We show that simply mimicking an end-user’s own driving style is often not preferred and that certain subjective characteristics may explain the discrepancy between an end-user’s own driving style and their preferred AV driving style. By conducting a correlation analysis, we uncover several characteristics that impact homophily. We find that personality should be considered when determining the optimal driving style and that specifically, conscientiousness and openness to experience are important factors. Additionally, participant’s perception of their own driving style, e.g. self-reported high-velocity driving style may influence an individual’s preference for a more aggressive driving style. We additionally find that perceived similarity is a relevant factor as supported in prior work [5]. These findings provide us with insight into what factors should be considered when determining exactly how much and in which direction to shift an end-user’s personalized embedding along the aggressive gradient so as to optimize driving style.
VII Limitations and Future Work
In future work we aim to quantify the relationship between relevant subjective factors and the preferred level of aggression. By doing so, we will be able to determine exactly how much to shift an individual’s embedding along the aggressive dimension so as to produce the optimal driving style for an individual. Additionally, we plan to investigate MAVERIC’s abilities to learn driving styles in domains involving more traffic and the potential for more complex decision making.
A limitation of our work is that we only recruited internal participants for Study 1. However, despite this limitation, our study comprises a more diverse population pool than many studies in human-robot interaction which typically recruit from a pool of college students [20]. Another limitation is that the perceived similarity and aggressiveness surveys are not verified in prior work. Additionally, because we only conduct a correlation analysis, we cannot conclude that the subjective factors are causally related to homophily. However, our results suggest that these factors are worthy of further investigation in future work.
VIII Conclusion
We have presented MAVERIC, a novel framework to personalize driving style and modulate aggressiveness. We demonstrated MAVERIC’s ability to reproduce an end-user’s own driving style and investigated how the preference for one’s own style is modulated by personality, self-reported driving style, and perceived similarity. To our knowledge, ours is the first framework to combine subjective metrics (i.e., the ADB survey) with end-user training data to produce a personalized AV controller. Our results indicate that personalizing AV control is a research area that merits further investigation and may provide a path towards greater AV acceptance.
ACKNOWLEDGMENT
References
- [1] Barbara D Adams, Lora E Bruyn, Sébastien Honde, and Paul Angelopoulos. Trust in automated systems. Department of National Defense, 2003.
- [2] Il Bae, Jin Hyo Kim, Jaeyoung Moon, and Shiho Kim. Lane change maneuver based on bezier curve providing comfort experience for autonomous vehicle users. In 2019 IEEE Intelligent Transportation Systems Conference (ITSC), pages 2272–2277, 2019.
- [3] Il Bae, Jaeyoung Moon, and Shiho Kim. Driving preference metric-aware control for self-driving vehicles. International Journal of Intelligent Engineering and Systems, 12:157–166, 2019.
- [4] Christoph Bartneck, Dana Kulić, Elizabeth Croft, and Susana Zoghbi. Measurement instruments for the anthropomorphism, animacy, likeability, perceived intelligence, and perceived safety of robots. International Journal of Social Robotics, pages 71–81, 2009.
- [5] Chandrayee Basu, Qian Yang, David Hungerman, Mukesh Sinahal, and Anca D. Draqan. Do you want your autonomous car to drive like you? In 2017 12th ACM/IEEE International Conference on Human-Robot Interaction, pages 417–425, 2017.
- [6] Drew Bolduc, Longxiang Guo, and Yunyi Jia. Modeling and characterization of driving styles for adaptive cruise control in personalized autonomous vehicles. Dynamic Systems and Control Conference, 10 2017. V001T44A004.
- [7] Colleen M. Carpinella, Alisa B. Wyman, Michael A. Perez, and Steven J. Stroessner. The Robotic Social Attributes Scale (RoSAS): Development and Validation. ACM/IEEE International Conference on Human-Robot Interaction, Part F1271:254–262, 2017.
- [8] Xi Chen, Yan Duan, Rein Houthooft, John Schulman, Ilya Sutskever, and Pieter Abbeel. InfoGAN: Interpretable representation learning by information maximizing generative adversarial nets. Advances in Neural Information Processing Systems, pages 2180–2188, 2016.
- [9] Jong Kyu Choi and Yong Gu Ji. Investigating the importance of trust on adopting an autonomous vehicle. International Journal of Human–Computer Interaction, 31(10):692–702, 2015.
- [10] Andrew J. Cooper, Luke D. Smillie, and Philip J. Corr. A confirmatory factor analysis of the Mini-IPIP five-factor model personality scale. Personality and Individual Differences, 48(5):688–691, 2010.
- [11] Alexey Dosovitskiy, German Ros, Felipe Codevilla, Antonio Lopez, and Vladlen Koltun. CARLA: An open urban driving simulator. In Proceedings of the 1st Annual Conference on Robot Learning, pages 1–16, 2017.
- [12] Mahdi Ebnali, Richard Lamb, Razieh Fathi, and Kevin Hulme. Virtual reality tour for first-time users of highly automated cars: Comparing the effects of virtual environments with different levels of interaction fidelity. Applied Ergonomics, 90:103226, 2021.
- [13] Laura Eboli, Gabriella Mazzulla, and Giuseppe Pungillo. How drivers’ characteristics can affect driving style. Transportation Research Procedia, 27:945–952, 2017. 20th EURO Working Group on Transportation Meeting, EWGT 2017, 4-6 September 2017, Budapest, Hungary.
- [14] Fredrick Ekman, Mikael Johansson, Lars-Ola Bligård, MariAnne Karlsson, and Helena Strömberg. Exploring automated vehicle driving styles as a source of trust information. Transportation Research Part F: Traffic Psychology and Behaviour, 2019.
- [15] Jenny Eriksson and Lars Svensson. Tuning for ride quality in autonomous vehicle application to linear quadratic path planning algorithm, 2015.
- [16] Yingying Feng and Xiaolong Yan. Support vector machine based lane-changing behavior recognition and lateral trajectory prediction. Computational Intelligence and Neuroscience, 2022:3632333, May 2022.
- [17] J M Harris and P B Norman. The aggressive driving behavior scale: Developing a self-report measure of unsafe driving practices. North American Journal of Psychology, 5:193–202, 2003.
- [18] Martina Hasenjäger and Heiko Wersing. Personalization in advanced driver assistance systems and autonomous vehicles: A review. In 2017 IEEE 20th International Conference on Intelligent Transportation Systems (ITSC), pages 1–7, 2017.
- [19] M. Hoedemaeker. Driving behaviour with acc and the acceptance by individual drivers. In ITSC2000. 2000 IEEE Intelligent Transportation Systems. Proceedings (Cat. No.00TH8493), pages 506–509, 2000.
- [20] Guy Hoffman and Xuan Zhao. A primer for conducting experiments in human–robot interaction. J. Hum.-Robot Interact., 10(1), oct 2020.
- [21] Julie Iskander, Mohammed Attia, Khaled Saleh, Darius Nahavandi, Ahmed Abobakr, Shady Mohamed, Houshyar Asadi, Abbas Khosravi, Chee Peng Lim, and Mohammed Hossny. From car sickness to autonomous car sickness: A review. Transportation Research Part F: Traffic Psychology and Behaviour, 62:716–726, 2019.
- [22] Jiun-Yin Jian, Ann Bisantz, and Colin Drury. Foundations for Empirically Determined Scale of Trust in Automated Systems. International Journal of Cognitive Ergonomics, 4:53–71, 1998.
- [23] Markus Kuderer, Shilpa Gulati, and Wolfram Burgard. Learning driving styles for autonomous vehicles from demonstration. Internation Conference on Robotics and Automation, pages 2641–2646, 2015.
- [24] Suzanne E Lee, Erik C B Olsen, Walter W Wierwille, and Michael Goodman. A comprehensive examination of naturalistic lane-changes, 2004.
- [25] Jiali Ling, Jialong Li, Kenji Tei, and Shinichi Honiden. Towards personalized autonomous driving: An emotion preference style adaptation framework. IEEE International Conference on Agents, pages 47–52, 2021.
- [26] Soroush Nasiriany, Huihan Liu, and Yuke Zhu. Augmenting reinforcement learning with behavior primitives for diverse manipulation tasks. International Conference on Robotics and Automation, 2021.
- [27] Rohan Paleja and Matthew Gombolay. Inferring personalized bayesian embeddings for learning from heterogeneous demonstration. arXiv, 2019.
- [28] Fernando Martín Poó and Ruben Daniel Ledesma. A study on the relationship between personality and driving styles. Traffic Injury Prevention, 14(4):346–352, 2013. PMID: 23531257.
- [29] Mariah L. Schrum, Erin Hedlund-Botti, Nina Moorman, and Matthew C. Gombolay. MIND MELD: Personalized Meta-Learning for Robot-Centric Imitation Learning. ACM/IEEE International Conference on Human-Robot Interaction, 2022.
- [30] Mariah L. Schrum, Michael Johnson, Muyleng Ghuy, and Matthew C. Gombolay. Four years in review: Statistical practices of likert scales in human-robot interaction studies. ACM/IEEE International Conference on Human-Robot Interaction, pages 43–52, 2020.
- [31] Jarrod M Snider. Automatic steering methods for autonomous automobile path tracking. Thesis: Robotics Institute, Carnegia Mellon University, 2009.
- [32] Xu Sun, Jingpeng Li, Pinyan Tang, Siyuan Zhou, Xiangjun Peng, Hao Nan Li, and Qingfeng Wang. Exploring personalised autonomous vehicles to influence user trust. Cognitive Computation, 12(6):1170–1186, Nov 2020.
- [33] Emilia M. Szumska and Rafał Jurecki. The effect of aggressive driving on vehicle parameters. Energies, 13(24), 2020.
- [34] Orit Taubman - Ben-Ari and Vera Skvirsky. The multidimensional driving style inventory a decade later: Review of the literature and re-evaluation of the scale. Accident Analysis & Prevention, 93:179–188, 2016.
- [35] Chris Tennant. Exploring Emerging Public Attitudes Towards Autonomous Vehicles, pages 253–266. Springer Singapore, 2021.
- [36] Hanneke Hooft van Huysduynen, Jacques Terken, Jean-Bernard Martens, and Berry Eggen. Measuring driving styles: A validation of the multidimensional driving style inventory. In Proceedings of the 7th International Conference on Automotive User Interfaces and Interactive Vehicular Applications, page 257–264, New York, NY, USA, 2015. Association for Computing Machinery.
- [37] Yueru Xu, Shan Bao, and Anuj K. Pradhan. Modeling drivers’ reaction when being tailgated: A random forests method. Journal of Safety Research, 78:28–35, 2021.
- [38] Yanghang Yu, Yuanyuan Zhao, Dongyan Li, Jingqiu Zhang, and Jiewei Li. The relationship between big five personality and social well-being of chinese residents: The mediating effect of social support. Frontiers in Psychology, 11, 3 2021.
- [39] Nidzamuddin Md. Yusof, Juffrizal Karjanto, Jacques Terken, Frank Delbressine, Muhammad Zahir Hassan, and Matthias Rauterberg. The exploration of autonomous vehicle driving styles: Preferred longitudinal, lateral, and vertical accelerations. In Proceedings of the 8th International Conference on Automotive User Interfaces and Interactive Vehicular Applications, page 245–252, New York, NY, USA, 2016. Association for Computing Machinery.