Uncertainties on the / and / cross-section ratio from the modelling of nuclear effects at 0.2 to 1.2 GeV neutrino energies and their impact on neutrino oscillation experiments
Abstract
The potential for mis-modeling of /, / and / cross section ratios due to nuclear effects is quantified by considering model spread within the full kinematic phase space for CCQE interactions. Its impact is then propagated to simulated experimental configurations based on the Hyper-K and ESSSB experiments. Although significant discrepancies between theoretical models is confirmed, it is found that these largely lie in regions of phase space that contribute only a very small portion of the flux integrated cross sections. Overall, a systematic uncertainty on the oscillated flux-averaged / cross-section ratio is found to be 2% and 4% for Hyper-K and ESSSB respectively.
Currently-running accelerator-based long-baseline (LBL) neutrino experiments, T2K Abe et al. (2020a, 2021) and NOvA Acero et al. (2019, 2021), are placing increasingly tight constraints on neutrino oscillation parameters. LBL experiments infer both (anti)electron neutrino appearance and (anti)muon neutrino disappearance in an (anti)muon neutrino beam using a “far” detector (FD), placed a few hundred kilometres away from the neutrino production point. LBL measurements are sensitive to the neutrino oscillation parameters: (including the octant), the complex phase , responsible for the violation of the leptonic Charge-Parity (CP) symmetry, and the neutrino mass-squared splittings, , including the neutrino mass ordering (MO), i.e. whether (normal) or (inverted). Although the latest LBL measurements remain statistically limited, their sensitivity is continuing to improve as larger samples of data are collected in higher intensity beams Abe et al. (2019). The upcoming Hyper-K Abe et al. (2018) and DUNE Acciarri et al. (2015) experiments will identify the correct neutrino MO and measure with a resolution better than . Another experiment, ESSSB, has proposed to further improve the resolution below Alekou et al. (2022). With an order of magnitude or more data, future experiments are likely to be dominated by systematic uncertainties due to the possible mis-modelling of the neutrino-nucleus interaction cross sections Alvarez-Ruso et al. (2018). Since the predominant sensitivity to , the MO and the octant stems from an analysis of (anti)electron neutrino appearance event rates at the FD, the uncertainty on the differences between the (anti)muon neutrino cross sections, which can be constrained at a near detector, and the FD-relevant (anti)electron neutrino cross sections, is especially important Scott (2021); Abed Abud et al. (2021).
For interactions where the range of kinematically allowed energy- and momentum-transfer is comparable to lepton mass differences, nuclear processes which determine the cross section may do so differently for different flavours of neutrinos. In particular, previous works have investigated differences in the and cross sections due to the way nuclear effects change the impact of the restriction the lepton mass places on the allowed kinematic phase space Martini et al. (2016); Ankowski (2017); Nikolakopoulos et al. (2021, 2019); Ankowski (2017). Other works have shown differences due to radiative corrections Day and McFarland (2012), which have currently been assigned a 2% systematic uncertainty on the / cross-section ratio at energies around one GeV Abe et al. (2020b), but recent calculations offer prospects for significant reduction Tomalak et al. (2022a, b).
In this article the impact of nuclear effects on the cross-section ratios (/, /, and /) of charged-current quasi-elastic (CCQE) interactions are studied. CCQE interactions on oxygen nuclei (the dominant interaction and target for the T2K, Hyper-K and ESSSB experiments) are investigated across a variety of state-of-the-art and widely used models. Differences in the ratios between oxygen and carbon nuclei are also considered. A systematic uncertainty is derived to cover the observed model spread for the Hyper-K (which is also applicable to T2K) and ESSSB experiments in the form of two correlated uncertainties on the / and / cross-section ratios, which together imply an uncertainty on the / ratio.
CCQE neutrino interactions are generated with a flat neutrino flux between zero and two GeV on an oxygen target using the NEUT interaction event generator Hayato and Pickering (2021), using either a Local Fermi Gas (LFG) model (with random phase approximation corrections) based on Nieves et al. (2011); Bourguille et al. (2021), or a model that uses the plane-wave impulse approximation using the Benhar spectral function (SF), based on Benhar et al. (1994). Note that the axial mass parameter is set at NEUT’s default values of 1.21 GeV for SF and 1.05 GeV for LFG, although an alternative version of SF using 1.03 GeV is also considered. Another alternative version of SF is considered in which Pauli blocking is disabled. NUISANCE Stowell et al. (2017) is used to process the simulations and to calculate cross sections. The impact of statistical uncertainties was verified to be small sup (8065a).
The NEUT cross-section predictions are compared among each other and to inclusive cross-section calculations using SuSAv2 Gonzaléz-Jiménez et al. (2014) or a Hartree–Fock (HF) model with and without continuum random phase approximation (CRPA) corrections Jachowicz et al. (2002); Pandey et al. (2015), produced using the hadron tensor tables prepared for their implementations within the GENIE event generator Dolan et al. (2022, 2019); Andreopoulos et al. (2010). In the HF-CRPA case, the distortion of the outgoing nucleon wavefunction (i.e. FSI) can be disabled so the outgoing nucleon is considered a plane wave (PW). In contrast to commonly-used intranuclear cascade FSI, this treatment changes the predicted inclusive cross sections Nikolakopoulos et al. (2022). Each calculation is made for an oxygen target, whilst the HF-CRPA model is also considered for carbon. Together, the considered models, summarised in table 1, cover a wide range of approaches to account for nuclear effects and represent those most commonly used for neutrino oscillation analyses. They further include model variations with key processes disabled which, whilst not realistic, provide a means to study their role.
| Model | Description |
| SuSAv2 | Model from Gonzaléz-Jiménez et al. (2014) |
| HF | Model from Jachowicz et al. (2002) w/o CRPA corrections |
| HF-CRPA | w/ CRPA corrections |
| HF-CRPA PW† | w/ CRPA corrections, plane wave nucleon |
| HF-CRPA C | w/ CRPA corrections, carbon target |
| SF | Model from NEUT based on Benhar et al. (1994) |
| SF w/o PB† | w/o Pauli blocking |
| SF | w/ modified nucleon axial mass |
| LFG | Model from NEUT based on Nieves et al. (2011) |
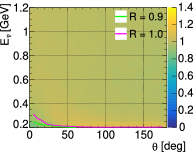
A ratio between and differential cross sections across a range of incoming neutrino energy () and outgoing lepton angles with respect to the incoming neutrino () is defined as:
where and give the flavours under consideration. , , and are shown in fig. 1sup (8065b). Note that the contour lines shown are built using a bi-linear interpolation based on the four nearest bin centres Rademakers et al. (2017) and that this uses unseen bins for 2 GeV. Large differences between the HF-CRPA and SF models are seen in the forward scattered region, as previously studied in Nikolakopoulos et al. (2019). Although this behaviour is also observed in SF, it is much weaker.
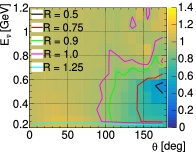
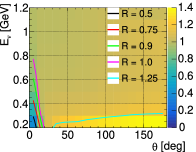
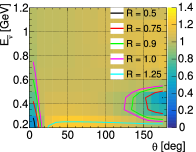
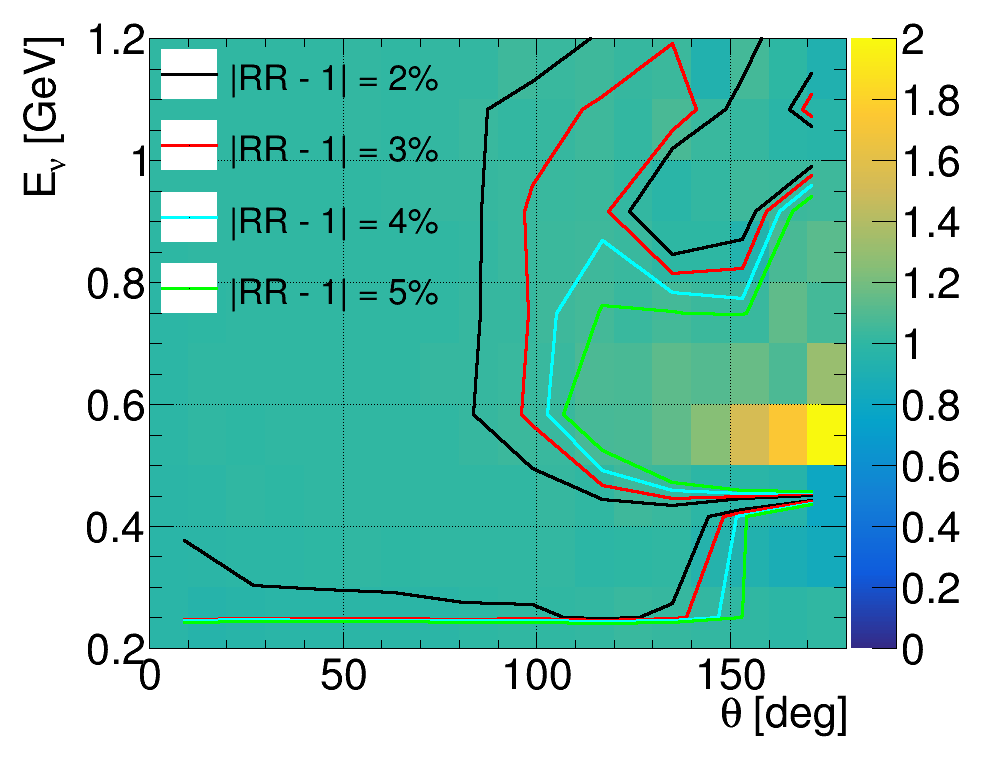
To better quantify these deviations, the double ratio of the differential cross section predicted by two different models is computed as:
, and , are shown in fig. 2. The forward scattered region at angles below 20 degrees show a large discrepancy between the models. However, it is interesting to see that the differences remain non-negligible when considering angles larger than about for energies close to Hyper-K’s oscillation maximum ( 0.6 GeV).
In order to investigate the impact of potential cross-section mismodelling, the contours highlighting the regions with large are also shown overlaid on expected oscillated and appearance event distributions at T2K/Hyper-K 111The event rates are calculated using only CCQE interactions (using the SF model), without applying efficiency corrections or detector smearing. The oscillation parameters used are: , , , , , (normal ordering), . in fig. 2 sup (8065c).
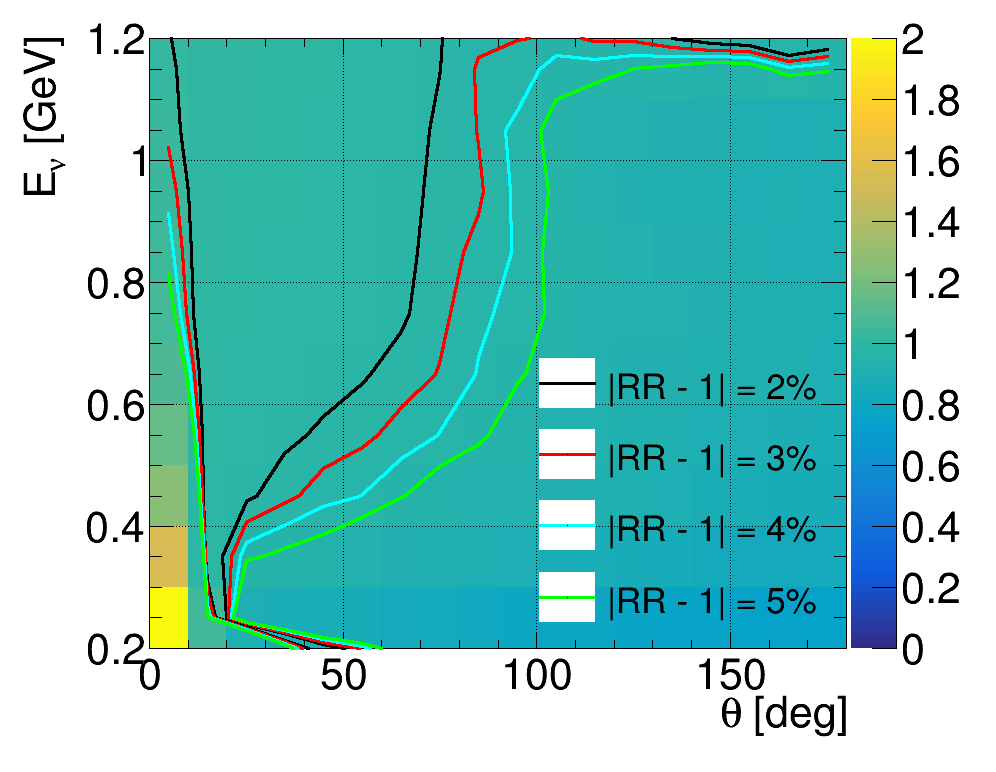
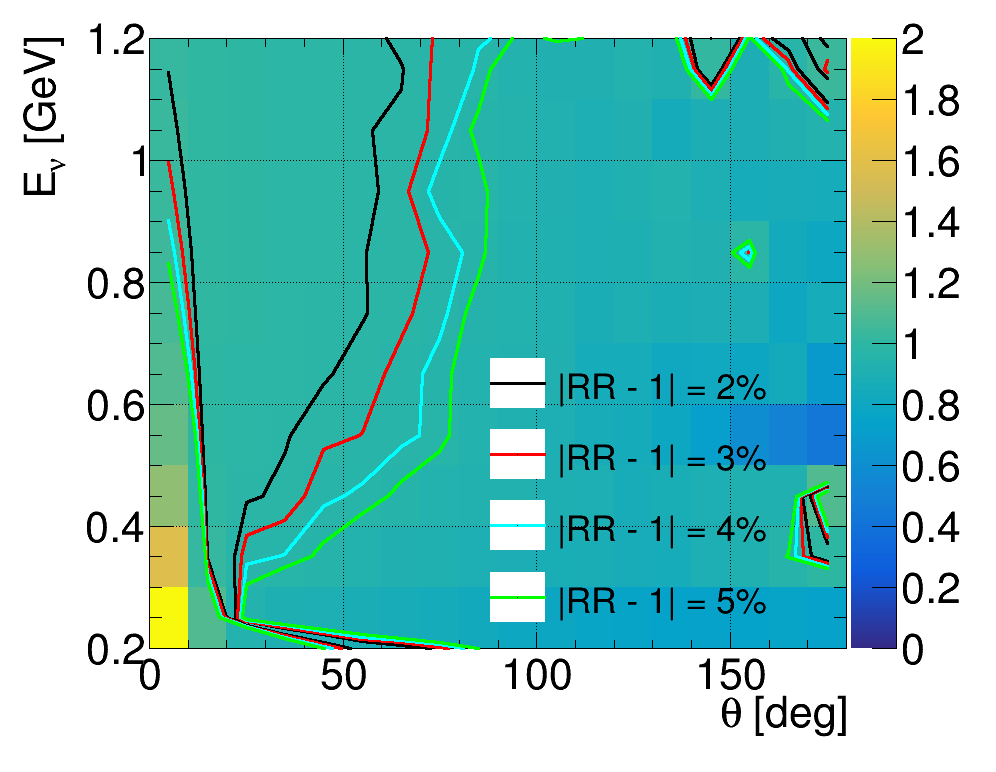
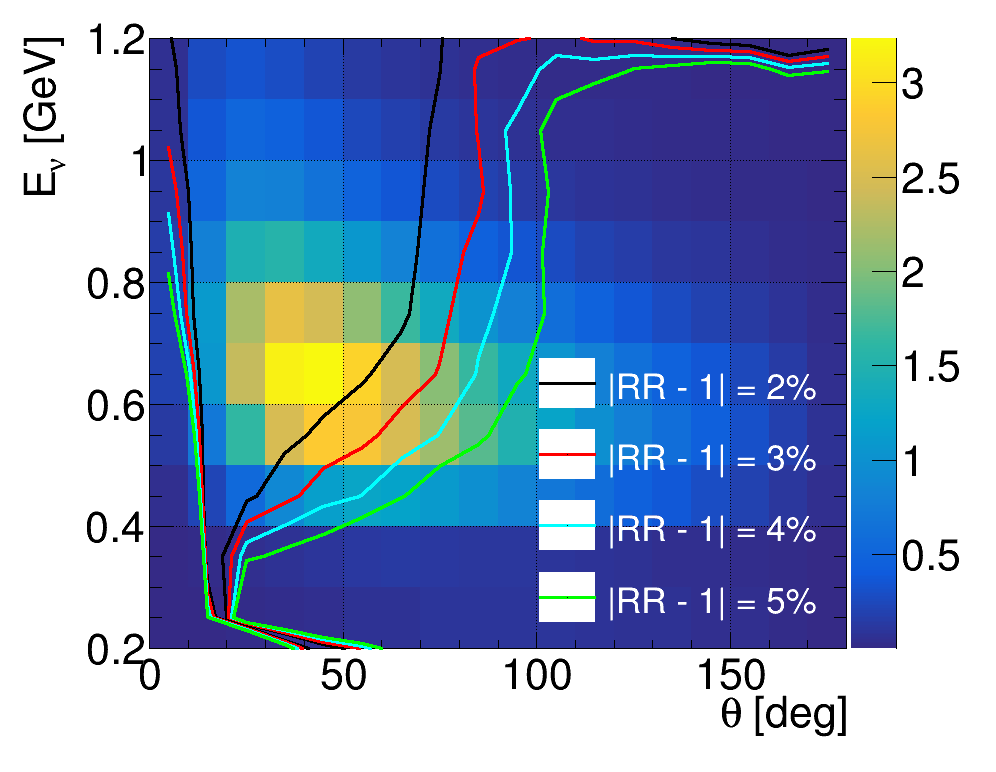
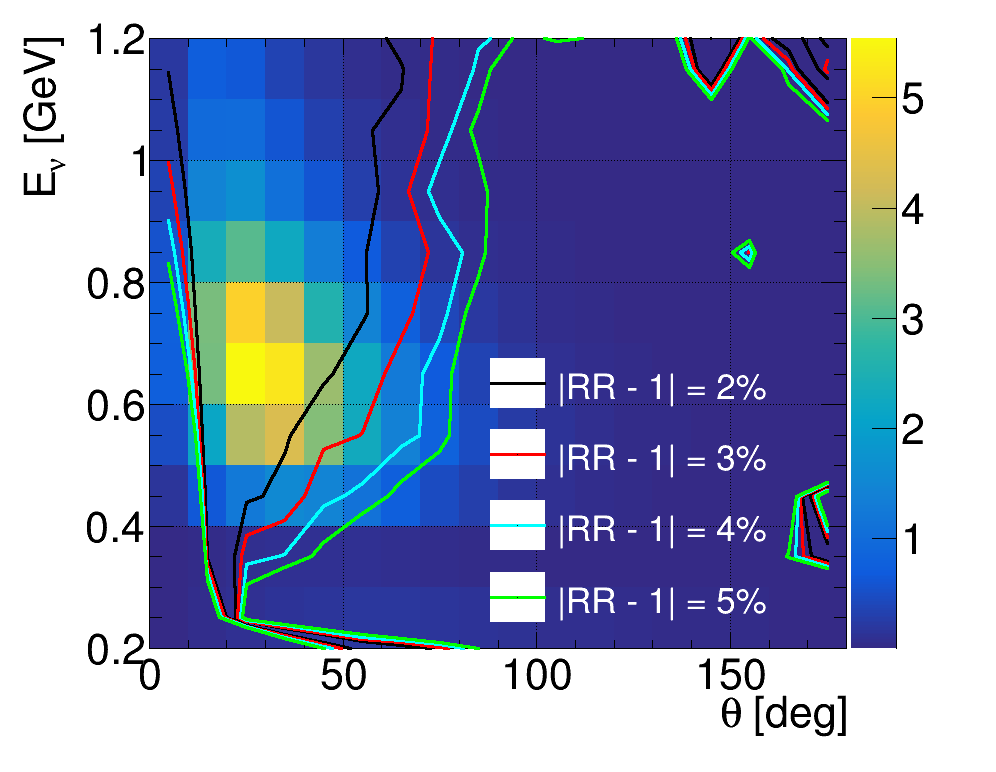
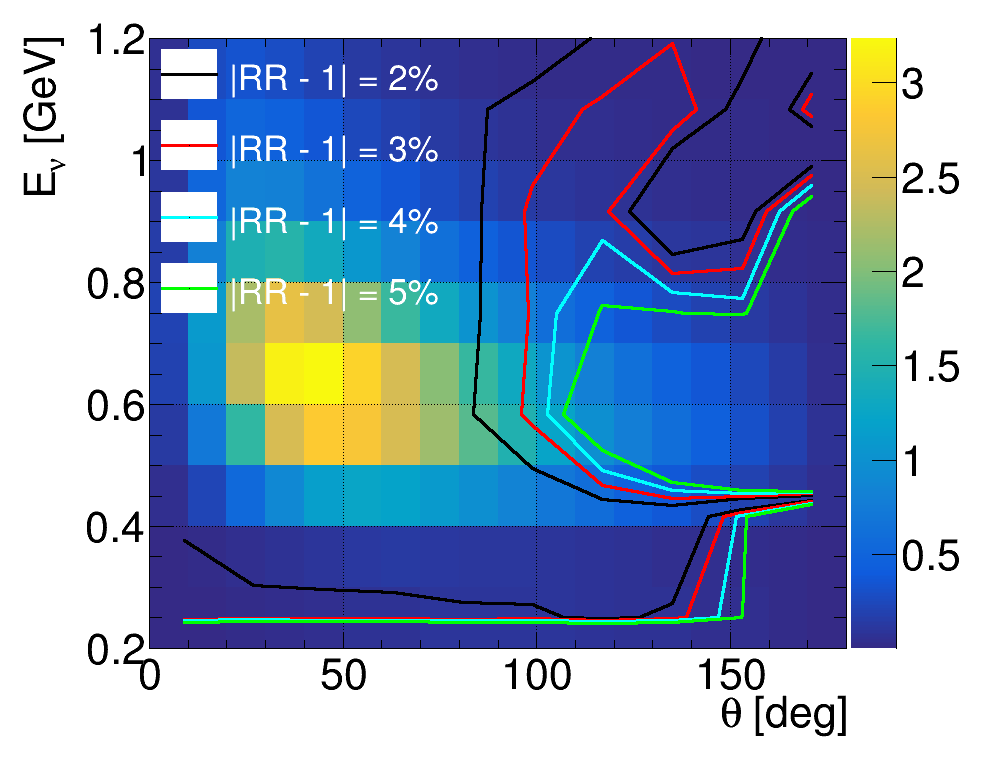
From fig. 2 it is clear that neither the large differences in the very forward region, nor the differences at low neutrino energies will have any significant impact on T2K or Hyper-K oscillation analyses, as only a very small portion of CCQE interactions will fall within this region. However, it can also be seen that a sizeable fraction of the interactions fall in the higher angle region of the phase space where differs from unity by more than 2%. In the case of antineutrino interactions, which have a larger portion of their cross section at more forward outgoing lepton angles, the overlap with regions of large deviations from unity is smaller. The computed is also shown, from which it can be seen that the regions with the largest deviations from unity overlap only with the extreme tails of the expected event distribution (i.e. at very low cross section).
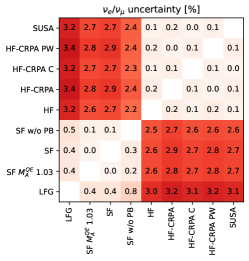
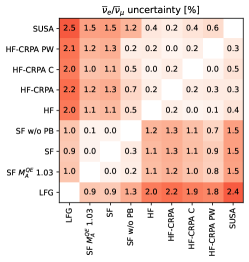
An estimate of the integrated uncertainty on the expected appearance event rates associated with differences between and cross sections due the modelling of nuclear effects is computed by averaging the model differences over the distribution of events predicted with the SF model, as illustrated in the lower plots of in fig. 2. The resultant uncertainties on the /, /, and / cross-section ratios are defined respectively as: , and . The former two are either fully correlated or fully anti-correlated, depending on whether the averaged model differences cause the cross-section ratios to change in the same direction.
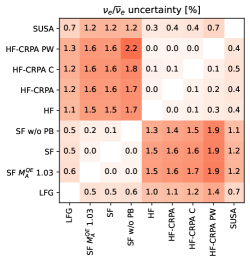
The flux-averaged uncertainties derived for comparisons of each pair of models introduced in table 1 are shown as a matrix in fig. 3. This pairwise comparison derived from different model combinations permits an analysis of the possible physical source of differences in predictions of , and . Overall, every systematic alteration within a model is found to change the ratios of interest by less than 0.5%, whilst differences between models using different nuclear ground states (LFG, SuSAv2, SF-based, HF-based) are much larger (2-3%). This may suggest that that the differences are driven by the treatment of the nuclear ground state. Note also that the change in the ratios for HF-CRPA between oxygen and carbon targets is much smaller than the differences between models, implying carbon-to-oxygen differences are likely to be a subdominant effect sup (8065d).
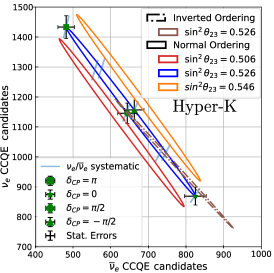
An indication of the impact of the derived uncertainties on neutrino oscillation analyses can be visualised using “bi-event” plots. These show the expected versus appearance event rate at the FD for different values of the oscillation parameters. Such plots are shown for different values of , the MO and in fig. 4. The separation between different oscillation models is compared with the statistical uncertainty and the systematic uncertainty from (whilst shows a larger uncertainty, it is a comparison of two unrealistic models). The uncertainties are shown to be comparable in size, but the latter is fully correlated between and . The propagation of the uncertainty through an oscillation analyses therefore mostly affects the sensitivity to the CP-conserving term (proportional to ) of the oscillation probability, rather than the CP violating one (proportional to ). It does not extend the range of values for which there is degeneracy between the different MO and but it does enhance the existing significant degeneracy in regions where the ellipses for the different MO overlap. Fig. 4 also shows that a stronger degeneracy is introduced in the measurement of , whose effect is correlated between and events. The derived systematic uncertainty can therefore affect the determination of the octant.
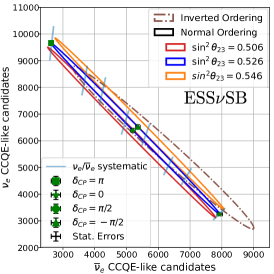
Similar conclusions can be derived for an ESSSB experimental configuration sup (8065c). The largest deviation of from unity was found from the comparison of the SF and the HF-CRPA models, resulting in , and , considerably larger than the uncertainties derived from the Hyper-K simulation. Bi-event plots for ESSSB are also shown in fig. 4. The impact of the estimated systematic uncertainty is shown to be much larger than the projected statistical uncertainties and significantly impacts the sensitivity to determining the octant. However, note that ESSSB gains more from measurements of the shape of the oscillated spectrum which is not reflected in the bi-event plots.
In conclusion, an evaluation of uncertainties on the / and / cross-section ratios from the modelling of nuclear effects has been studied using the spread of predictions from a wide variety of models. Overall, it has been found that such uncertainties are unlikely to be dominant in measurements of term and the MO, although they may become crucial for analyses of and the octant. More detailed studies are required in order to evaluate the impact of a systematic uncertainty affecting the modelling of the cross section as a function of FD observables. Whilst this analysis has focused on CCQE interactions, analogous model discrepancies may exist for other processes and nuclei.
The authors would like to thank the T2K and Hyper-K collaborations, in particular for useful discussions in T2K’s “Physics and Performance” and “Neutrino Interactions” working groups. The authors would like to thank Jan Sobczyk, Marco Martini, Claudio Giganti and Anna Ershova for their insightful comments on a draft version of the manuscript. SD would like to especially thank Kevin McFarland, Laura Munteanu and Callum Wilkinson for fruitful discussions. DS and TDi were supported by the Swiss National Science Foundation Eccellenza grant (SNSF PCEFP2_203261), Switzerland. TDe was supported by the Science and Technology Facilities Council (grant numbers ST/X002489/1, ST/V006215/1). LP is supported by a Royal Society University Research Fellowship (URF\R1\211661). Fermilab is operated by the Fermi Research Alliance, LLC under contract No. DE-AC02-07CH11359 with the United States Department of Energy.
References
- Abe et al. (2020a) K. Abe et al. (T2K), Nature 580, 339 (2020a), [Erratum: Nature 583, E16 (2020)], arXiv:1910.03887 [hep-ex] .
- Abe et al. (2021) K. Abe et al. (T2K), Phys. Rev. D 103, 112008 (2021), arXiv:2101.03779 [hep-ex] .
- Acero et al. (2019) M. A. Acero et al. (NOvA), Phys. Rev. Lett. 123, 151803 (2019), arXiv:1906.04907 [hep-ex] .
- Acero et al. (2021) M. A. Acero et al. (NOvA), (2021), arXiv:2108.08219 [hep-ex] .
- Abe et al. (2019) K. Abe et al. (T2K, J-PARC Neutrino Facility Group), (2019), arXiv:arXiv:1908.05141 [physics.ins-det] .
- Abe et al. (2018) K. Abe et al. (Hyper-Kamiokande), (2018), arXiv:1805.04163 [physics.ins-det] .
- Acciarri et al. (2015) R. Acciarri et al. (DUNE), (2015), arXiv:1512.06148 [physics.ins-det] .
- Alekou et al. (2022) A. Alekou et al., (2022), 10.1140/epjs/s11734-022-00664-w, arXiv:2206.01208 [hep-ex] .
- Alvarez-Ruso et al. (2018) L. Alvarez-Ruso et al., Prog. Part. Nucl. Phys. 100, 1 (2018), arXiv:1706.03621 [hep-ph] .
- Scott (2021) M. Scott, PoS ICHEP2020, 174 (2021).
- Abed Abud et al. (2021) A. Abed Abud et al. (DUNE), Instruments 5, 31 (2021), arXiv:2103.13910 [physics.ins-det] .
- Martini et al. (2016) M. Martini, N. Jachowicz, M. Ericson, V. Pandey, T. Van Cuyck, and N. Van Dessel, Phys. Rev. C 94, 015501 (2016), arXiv:1602.00230 [nucl-th] .
- Ankowski (2017) A. M. Ankowski, Phys. Rev. C 96, 035501 (2017), arXiv:1707.01014 [nucl-th] .
- Nikolakopoulos et al. (2021) A. Nikolakopoulos, V. Pandey, J. Spitz, and N. Jachowicz, Phys. Rev. C 103, 064603 (2021), arXiv:2010.05794 [nucl-th] .
- Nikolakopoulos et al. (2019) A. Nikolakopoulos, N. Jachowicz, N. Van Dessel, K. Niewczas, R. González-Jiménez, J. M. Udías, and V. Pandey, Phys. Rev. Lett. 123, 052501 (2019), arXiv:1901.08050 [nucl-th] .
- Day and McFarland (2012) M. Day and K. S. McFarland, Phys. Rev. D 86, 053003 (2012), arXiv:1206.6745 [hep-ph] .
- Abe et al. (2020b) K. Abe et al. (T2K), Phys. Rev. Lett. 124, 161802 (2020b), arXiv:1911.07283 [hep-ex] .
- Tomalak et al. (2022a) O. Tomalak, Q. Chen, R. J. Hill, and K. S. McFarland, Nature Commun. 13, 5286 (2022a), arXiv:2105.07939 [hep-ph] .
- Tomalak et al. (2022b) O. Tomalak, Q. Chen, R. J. Hill, K. S. McFarland, and C. Wret, Phys. Rev. D 106, 093006 (2022b), arXiv:2204.11379 [hep-ph] .
- Hayato and Pickering (2021) Y. Hayato and L. Pickering, (2021), 10.1140/epjs/s11734-021-00287-7, arXiv:2106.15809 [hep-ph] .
- Nieves et al. (2011) J. Nieves, I. Ruiz Simo, and M. J. Vicente Vacas, Phys. Rev. C83, 045501 (2011), arXiv:1102.2777 [hep-ph] .
- Bourguille et al. (2021) B. Bourguille, J. Nieves, and F. Sánchez, JHEP 04, 004 (2021), arXiv:2012.12653 [hep-ph] .
- Benhar et al. (1994) O. Benhar, A. Fabrocini, S. Fantoni, and I. Sick, Nucl. Phys. A579, 493 (1994).
- Stowell et al. (2017) P. Stowell et al., JINST 12, P01016 (2017), arXiv:1612.07393 [hep-ex] .
- sup (8065a) See Supplemental Material at for a detailed analysis of statistical uncertainties associated with the NEUT event generation (available at arXiv:2301.08065a).
- Gonzaléz-Jiménez et al. (2014) R. Gonzaléz-Jiménez, G. D. Megias, M. B. Barbaro, J. A. Caballero, and T. W. Donnelly, Phys. Rev. C 90, 035501 (2014), arXiv:1407.8346 [nucl-th] .
- Jachowicz et al. (2002) N. Jachowicz, K. Heyde, J. Ryckebusch, and S. Rombouts, Phys. Rev. C 65, 025501 (2002).
- Pandey et al. (2015) V. Pandey, N. Jachowicz, T. Van Cuyck, J. Ryckebusch, and M. Martini, Phys. Rev. C 92, 024606 (2015), arXiv:1412.4624 [nucl-th] .
- Dolan et al. (2022) S. Dolan, A. Nikolakopoulos, O. Page, S. Gardiner, N. Jachowicz, and V. Pandey, Phys. Rev. D 106, 073001 (2022), arXiv:2110.14601 [hep-ex] .
- Dolan et al. (2019) S. Dolan, G. D. Megias, and S. Bolognesi, (2019), arXiv:1905.08556 [hep-ex] .
- Andreopoulos et al. (2010) C. Andreopoulos et al., Nucl. Instrum. Meth. A 614, 87 (2010), arXiv:0905.2517 [hep-ph] .
- Nikolakopoulos et al. (2022) A. Nikolakopoulos, R. González-Jiménez, N. Jachowicz, K. Niewczas, F. Sánchez, and J. M. Udías, Phys. Rev. C 105, 054603 (2022), arXiv:2202.01689 [nucl-th] .
- sup (8065b) Histograms of ratios calculated for all models are available in the Supplemental Material (available at arXiv:2301.08065b).
- Rademakers et al. (2017) F. Rademakers, R. Brun, P. Canal, et al., “ROOT - An Object-Oriented Data Analysis Framework. root-project/root: v6.10/04,” (2017).
- sup (8065c) See Supplemental Material for details concerning the simulation of the T2K/Hyper-K and ESSSB experimental configurations (available at arXiv:2301.08065c).
- sup (8065d) See Supplemental Material for further details regrading the change in the cross-section ratios of interest under the systematic model tweaks, including the consideration of HF-CRPA differences on a carbon and oxygen target (available at arXiv:2301.08065d).