Evolutionary dynamics of glucose-deprived cancer cells: insights from experimentally-informed mathematical modelling
Abstract
Glucose is a primary energy source for cancer cells. Several lines of evidence support the idea that monocarboxylate transporters, such as MCT1, elicit metabolic reprogramming of cancer cells in glucose-poor environments, allowing them to reuse lactate, a byproduct of glucose metabolism, as an alternative energy source with serious consequences for disease progression. We employ a synergistic experimental and mathematical modelling approach to explore the evolutionary processes at the root of cancer cell adaptation to glucose deprivation, with particular focus on the mechanisms underlying the increase in MCT1 expression observed in glucose-deprived aggressive cancer cells. Data from in vitro experiments on breast cancer cells are used to inform and calibrate a mathematical model that comprises a partial integro-differential equation for the dynamics of a population of cancer cells structured by the level of MCT1 expression. Analytical and numerical results of this model suggest that environment-induced changes in MCT1 expression mediated by lactate-associated signalling pathways enable a prompt adaptive response of glucose-deprived cancer cells, whilst fluctuations in MCT1 expression due to epigenetic changes create the substrate for environmental selection to act upon, speeding up the selective sweep underlying cancer cell adaptation to glucose deprivation, and may constitute a long-term bet-hedging mechanism.
1 Introduction
Glucose is one of the primary nutrients used by cancer cells to produce energy, and glucose deficiency causes metabolic stress, cell dysfunction, and eventual death [1]. In fact, glucose consumption not only results in decreased nutrient availability, but also generally correlates with lactate production and the development of an acidic extracellular environment [2, 3, 4, 5]. Cancer cells can rely on a variety of mechanisms that activate protective functions under metabolic and environmental stress, including metabolic reprogramming [4, 6]. Accumulating evidence indicates that aggressive cancer cells may acquire the ability to absorb lactic acid and use it to synthesise pyruvate [3, 7, 4, 8], thus converting harmful byproducts of glucose metabolism into alternative energy sources. Lactic acid is transported across cell membranes through a family of four reversible monocarboxylate transporters (MCTs) belonging to the SLC16/MCT family of solute carriers [9]. The intracellular uptake of lactate by cancer cells is primarily achieved via the MCT1 transporter protein on the cytoplasmic membrane [10, 11]. Such an increase in pyruvate and lactate metabolism has been associated with enhanced invasion and migration, and higher survival in the circulation, with overall consequences for metastasis [12, 11], to the extent that MCT1 inhibition has been investigated as a potential therapeutic target [13, 14].
While it is evident that the overexpression of MCT1 plays a key role in the metabolic reprogramming of glucose-deprived aggressive cancer cells, allowing them to reuse lactate as an alternative energy source with serious consequences for disease progression, the mechanisms underlying such a change in MCT1 expression remain, to this day, poorly explored. On the one hand, lactate may function as a signalling molecule, triggering regulatory pathways that promote the expression of MCT1 [7, 15], thus mediating environment-induced changes in MCT1 expression [16]. On the other hand, lactic acid accumulation is known to cause reshaping of the tumour microenvironment and induce epigenetic changes in cancer cells [17]. As lactate has been shown to be responsible for certain histone modifications, such as acetylation or lactylation [18, 19], the effect of non-genetic mechanisms may even be perturbed under glucose-deprivation. Furthermore, MCT1 inhibition has been shown to prevent histone acetylation, suggesting that lactate intake induces transcriptional and metabolic reprogramming that involves epigenetic modifications [20]. Therefore, protein expression levels, which vary in a systematic transcriptionally-regulated way, may undergo fluctuations due to spontaneous and lactate-induced epigenetic changes [16].
In this work, a synergistic experimental and mathematical modelling approach is employed to explore the evolutionary processes at the root of cancer cell adaptation to glucose deprivation, with particular focus on the mechanisms underlying the increase in MCT1 expression observed in glucose-deprived aggressive cancer cells. Data from in vitro experiments on breast cancer cells, which were specifically carried out for this study, are used to inform a mathematical model that comprises a partial integro-differential equation (PIDE) for the dynamics of a population of cancer cells structured by the level of MCT1 expression, which is coupled with a system of ordinary differential equations (ODEs) for the dynamics of glucose and lactate present in the extracellular environment. This model allows for predictions on the dynamics of the MCT1 expression distribution of cancer cells to be made and to be directly compared with the results of flow cytometry analyses, while making it also possible to dissect out the evolutionary processes underlying these dynamics. Related mathematical models have been employed to investigate cancer cell adaptation to hypoxia [21, 22, 23, 24, 25], but not to assess MCT1-associated changes in lactate uptake. Furthermore, alternative mathematical models have been proposed to study the role of MCT1 expression-regulated lactate uptake in the coexistence of different metabolic pathways within the same tumour [26, 27, 5], but none of these proposes a causal mechanism for the reported increase in MCT1 expression.
Experimental data are used to carry out model calibration, through a likelihood-maximising method [28, 29, 30, 31] and bootstrapping algorithm for uncertainty quantification [32, 33], and the results of numerical simulations of the calibrated model are complemented with analytical results on the qualitative and quantitative properties of the solution to the PIDE that governs the evolution of cancer cells. These results shed light on the evolutionary dynamics of glucose-deprived cancer cells by elucidating the respective roles that environment-induced changes in MCT1 expression mediated by lactate-associated signalling pathways and fluctuations in MCT1 expression due to epigenetic changes play in the adaptation of cancer cell populations to glucose-poor environments.
2 Methods
2.1 In vitro experiments
A summary of the experimental set-up is provided below, and full details of experimental materials and methods can be found in Sup.Mat.S2.
Cell lines
Breast cancer cells of the MCF7 and MCF7-sh-WISP2 lines are considered, with the latter being obtained from the former upon inducing epithelial-to-mesenchymal transition through WISP2 gene silencing. The focus of this study is on the MCF7-sh-WISP2 cell line, which has been documented to be more invasive and aggressive than the MCF7 cell line [34, 35]. We also report on the results from experiments conducted on MCF7 cells to corroborate the hypothesis that fast metabolic reprogramming associated with lactate uptake under glucose deprivation is characteristic of more aggressive cancer cells.
‘Glucose-deprivation’ and ‘rescue’ experiments
Cells originally maintained in medium containing 24.75mM of glucose (i.e. 4.5g/l, a high level of glucose) are seeded, at high cell numbers, in a medium containing 5.5mM of glucose (i.e. 1g/l, a physiological level of glucose). In ‘glucose-deprivation’ experiments, glucose is not re-added to the medium during cell culture (i.e. there is no glucose replenishment) so that, due to consumption by the cells, glucose levels drop during the course of the experiment and thus cells experience glucose deprivation. In ‘rescue’ experiments, a similar protocol is followed for a few days and the culture medium is subsequently changed to a medium containing 24.75mM of glucose, where cells are cultured for a few more days, so that cells first experience glucose deprivation and are then rescued from it.
Measured quantities
Over the span of several days, we tracked: viable cell numbers and percentages of apoptotic cells; glucose and lactate concentrations in the cell culture medium; MCT1 expression distribution (i.e. fluorescence-intensity distributions), obtained through flow cytometry analysis and complemented with images from immunocytochemistry analysis; mRNA expression of different MCT proteins measured by RT-qPCR – i.e. MCT1, MCT2 (an MCT very similar to MCT1 although it displays a higher affinity for L-lactic acid and pyruvate), and MCT4 (an efficient lactate exporter expressed in glycolytic cells that is not required for lactate uptake [36, 37]). All data are available in the supplementary Excel file ‘ExperimentalData.xlsx’.
2.2 Mathematical modelling
Building on the modelling strategies presented in [38], we develop a mathematical model that describes the evolutionary dynamics of a population of MCF7-sh-WISP2 cells, structured by the level of MCT1 expression, under the environmental conditions which are determined by the levels of glucose and lactate in the extracellular environment. An outline of the model is provided below, while a detailed description of the model equations alongside the main modelling assumptions, which are informed by the results of in vitro experiments underlying this study, is provided in Sup.Mat.S1.
Key model quantities
The model comprises a PIDE for the dynamics of the cell population density function , which represents the number of MCF7-sh-WISP2 cells with level of MCT1 expression at time (i.e. the MCT1 expression distribution of MCF7-sh-WISP2 cells at time ). Such a PIDE is coupled with a system of ODEs for the dynamics of the concentrations of glucose and lactate in the extracellular environment and . The cell number, the mean level of MCT1 expression and the related variance, which provides a possible measure for the level of intercellular variability in MCT1 expression, are computed, respectively, as
| (2.1) |
Modelling cell proliferation and death under environmental selection on MCT1 expression
The results of in vitro experiments (cf. Sec. 3.2) indicate that the mean of the MCT1 expression distribution of MCF7-sh-WISP2 cells moves from lower to higher expression levels when cells experience glucose deprivation, and from higher to lower expression levels when cells are rescued from glucose deprivation. Hence, we assume that there is a level of MCT1 expression (i.e. the fittest level of MCT1 expression) endowing cells with the highest fitness depending on the environmental conditions determined by the concentrations of glucose and lactate. Moreover, the results of in vitro experiments (cf. Sec. 3.1) support the idea that proliferation and survival of MCF7-sh-WISP2 cells correlate with glucose uptake when glucose levels are sufficiently high and with lactate uptake when glucose levels are low. This is also in line with the well-established notion of tumour metabolism indicating a preferential use of glucose for energy production when glucose is abundantly available [4]. Therefore, we further assume that there are a level of MCT1 expression, , endowing cells with the highest rate of proliferation via glycolysis and a higher level of MCT1 expression, , endowing cells with the highest rate of proliferation via lactate reuse when glucose is scarce – i.e. when the concentration of glucose in the extracellular environment is lower than a threshold level above which cells stop taking lactate from the extracellular environment in order to prioritise glucose uptake. Under these assumptions, in the framework of our model, the fittest level of MCT1 expression is represented by the function , defined via Eq. (S.14) in Sup.Mat.S1, which is such that if then for any , whereas if then as decreases and increases. Furthermore, the strength of environmental selection on MCT1 expression is linked to the value of the selection gradient defined via Eq. (S.12) in Sup.Mat.S1,
Modelling changes in MCT1 expression
The effects of changes in the level of cell expression of MCT1 are also incorporated into the model. In particular, we let fluctuations due to epigenetic changes – henceforth referred to as FECs – occur at rate . Moreover, we assume that environment-induced changes mediated by lactate-associated signalling pathways – henceforth referred to as SPCs – lead to an increase in MCT1 expression at rate under glucose deprivation (i.e. when ) and to a decrease in MCT1 expression at rate when the glucose level is sufficiently high (i.e. when ).
2.3 Model calibration based on experimental data
Experimental data on MCF7-sh-WISP2 cells are used to carry out model calibration through a likelihood-maximising method [28, 29, 30]. We assume mM (i.e. the threshold level of glucose above which cells interrupt lactate uptake to prioritise glucose uptake is above physiological levels) and calibrate the model using data from ‘glucose-deprivation’ experiments. In summary, the optimal parameter set (OPS) is obtained, through an iterative process, by minimising the weighted sum of squared residuals
| (2.2) |
where and are the average and standard deviation of summary statistic from the experimental data and is the value predicted by the model under the parameter set , exploiting the in-built Matlab function bayesopt, which is based on Bayesian Optimisation. At each iteration, in order to retrieve for , we solve numerically the PIDE-ODE system that constitutes the model, using the methods described in Sup.Mat.S2. Minimising (2.2) is analogous to maximising the log-likelihood, having assumed that data for each summary statistic are normally distributed around their average values with variance , to account for heteroscedasticity [31]. In order to explore a variety of evolutionary scenarios, calibration was carried out for the model in which both FECs and SPCs in MCT1 expression are included (i.e. and ), and for reduced models that take into account only FECs (i.e. and ) or SPCs (i.e. and ). The obtained OPSs are reported in Tab.S1 in Sup.Mat.S2. Uncertainty quantification of the OPS was carried out on the full model by means of a bootstrapping algorithm [32, 33], based on random sampling of data with replacement and particularly suited when only few data are available. The bootstrap statistics are reported in Tab.S2 in Sup.Mat.S2, and bootstrap sampling distributions of the parameter values are plotted in Fig.S6. All Matlab source codes used for model calibration have been made available on GitHub111https://github.com/ChiaraVilla/AlmeidaEtAl2023Evolutionary.
2.4 Simulation and analysis of the model
To explore the mechanisms underlying the evolutionary dynamics of MCF7-sh-WISP2 cells under glucose deprivation, the results of numerical simulations of the calibrated model, which are carried out using the numerical methods described in Sup.Mat.S2.3, are integrated with the analytical results presented in Sup.Mat.S2.5, which build on the results presented in [39, 25].
3 Main results
3.1 Proliferation and survival of MCF7-sh-WISP2 cells correlate with lactate uptake under glucose deprivation
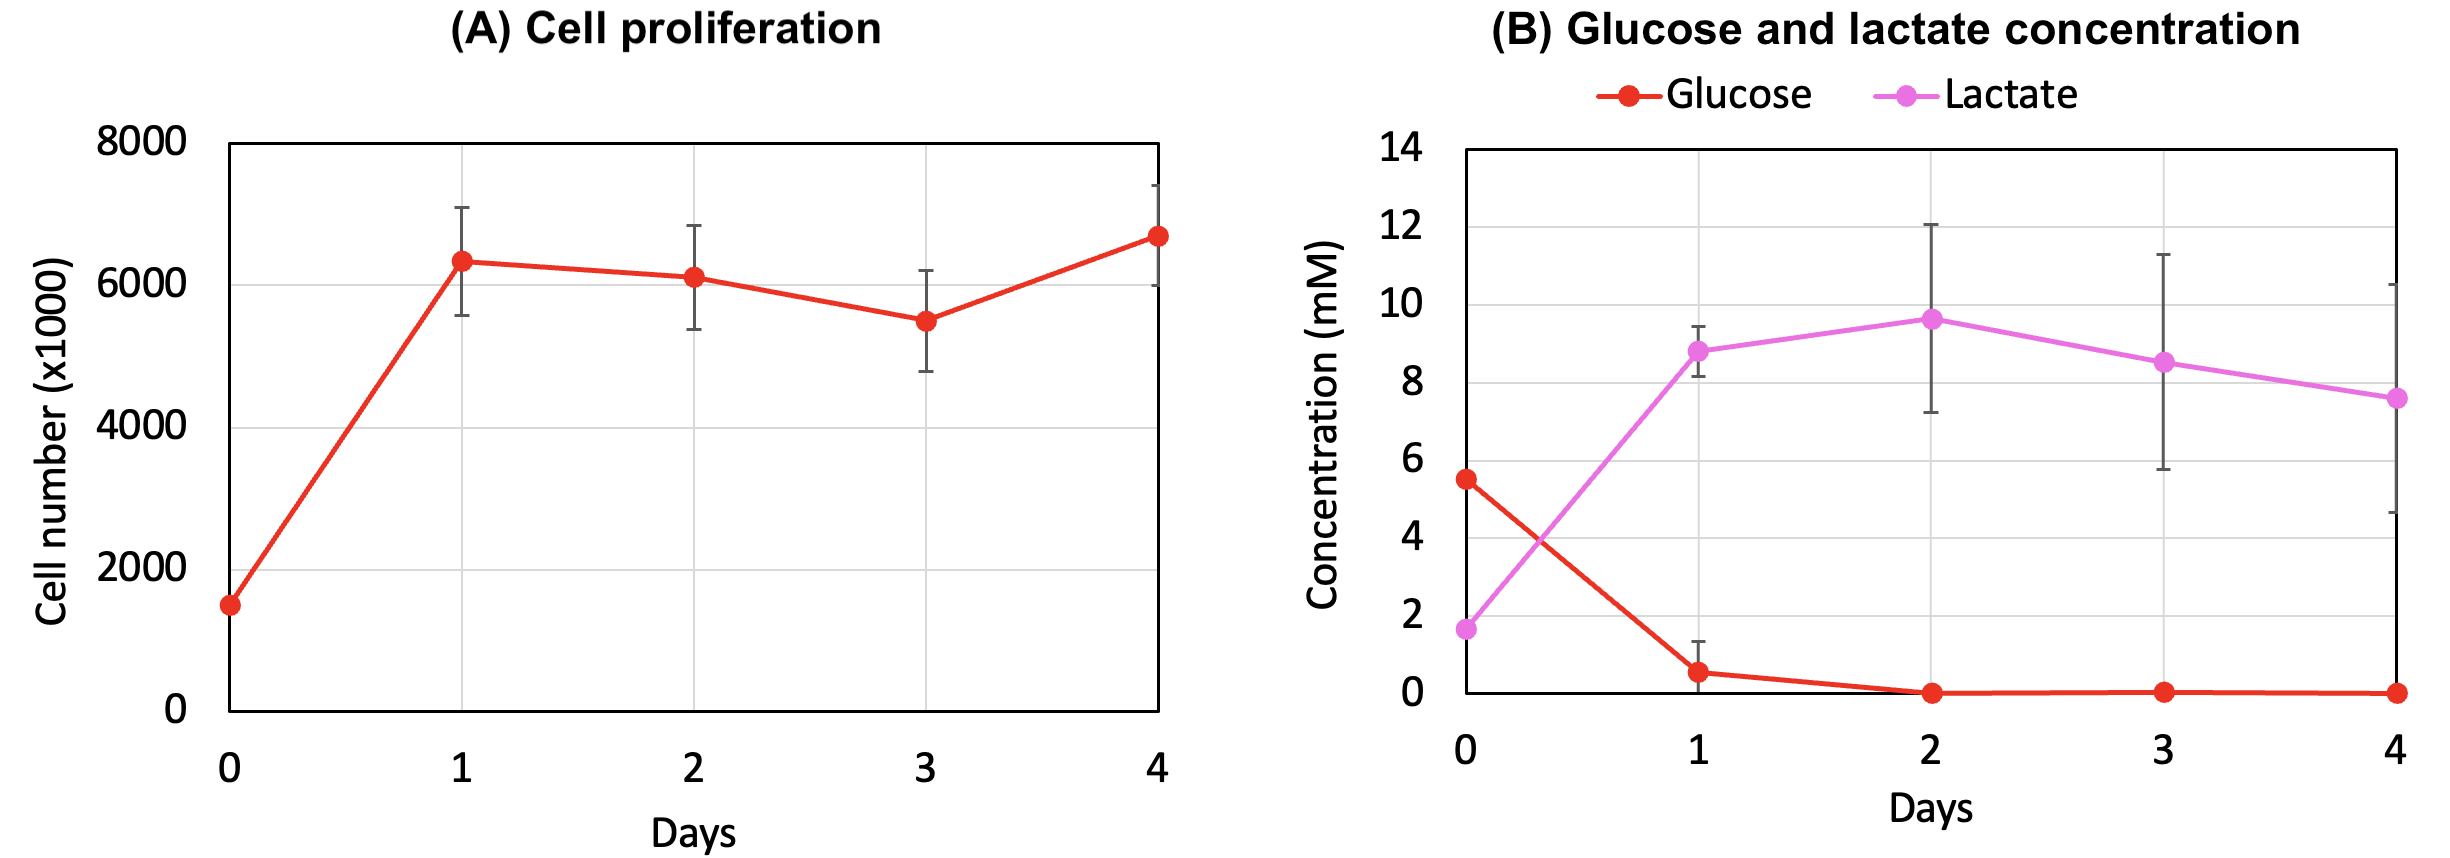
Fig.1 and Fig.S1 in Sup.Mat.S3 summarise the dynamics of cell proliferation and glucose and lactate concentrations in the cell culture medium observed during ‘glucose-deprivation’ experiments conducted for four days on MCF7-sh-WISP2 and MCF7 cells, respectively. The corresponding dynamics of cell death are summarised by Fig.S2 in Sup.Mat.S3. These results demonstrate that there is a stark difference in the proliferation dynamics of the MCF7-sh-WISP2 and MCF7 cell lines under glucose deprivation, with the former reaching numbers of viable cells over twice as high as the latter. Moreover, cell death in the MCF7-sh-WISP2 line does not significantly increase over time, as opposed to the MCF7 line for which the percentage of apoptotic cells undergoes a four-fold increase during the experiment. The dynamics of the concentration of glucose in the culture medium of the two cell lines are similar, though only cells of the MCF7-sh-WISP2 line consume all the glucose available. Furthermore, the concentration of lactate in the culture medium of MCF7 cells displays a steady increase mirroring glucose consumption, whilst a decline in lactate concentration in the culture medium of MCF7-sh-WISP2 cells is observed when little to no glucose is present in the medium, thus suggesting that lactate uptake occurs amongst MCF7-sh-WISP2 cells under glucose deprivation. Taken together, these experimental results support the idea that proliferation and survival of MCF7-sh-WISP2 cells correlate with glucose consumption when glucose levels are sufficiently high and with lactate uptake under glucose deprivation.
3.2 Glucose deprivation induces a reversible increase in MCT1 expression of MCF7-sh-WISP2 cells
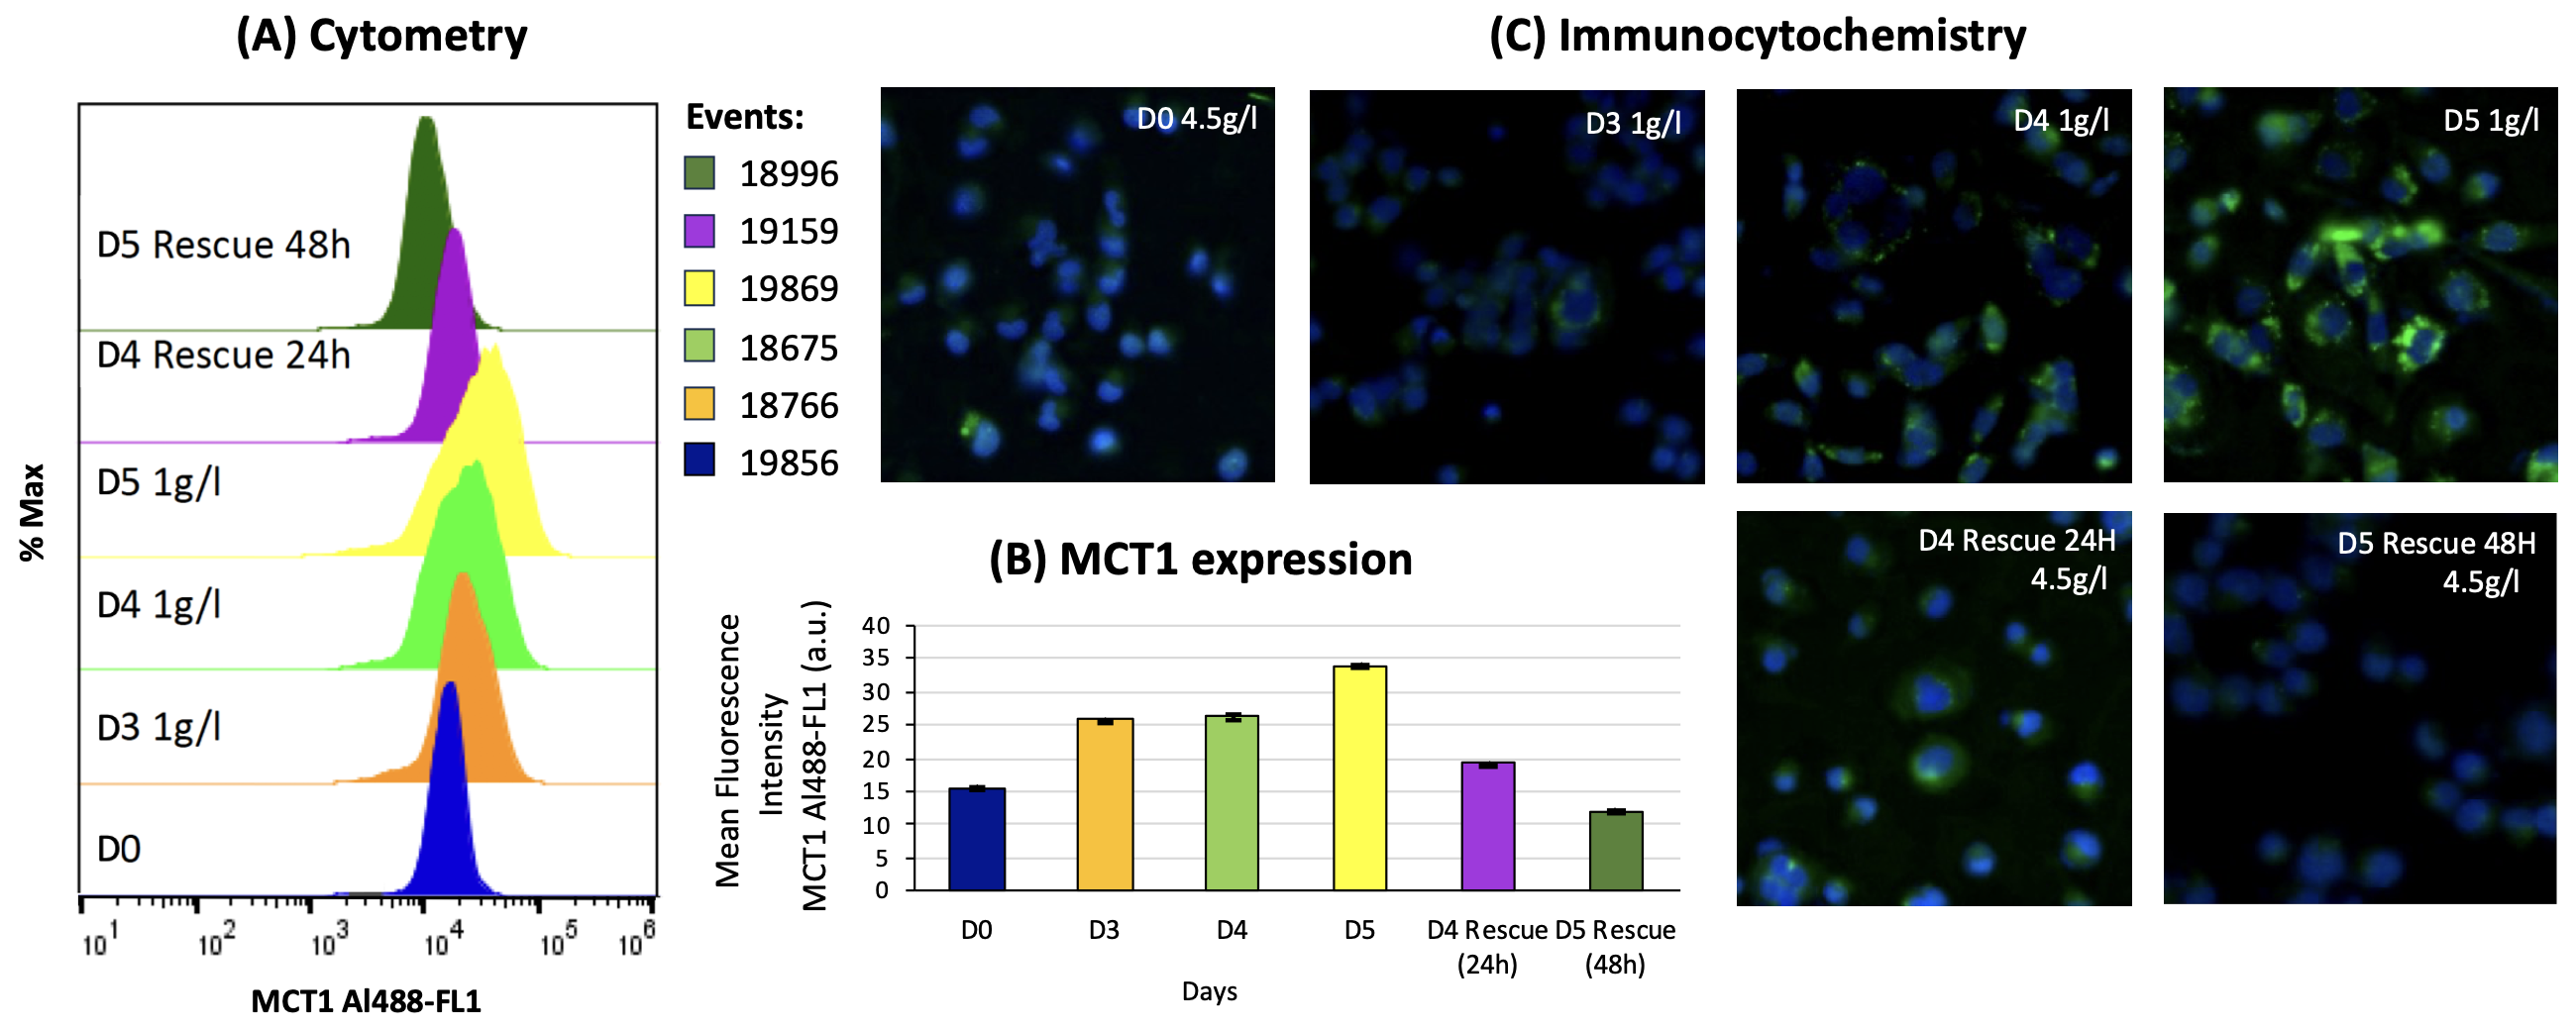
The experimental results summarised by Fig.2 show a steady increase in MCT1 expression of MCF7-sh-WISP2 cells throughout ‘glucose-deprivation’ experiments. On the other hand, in ‘rescue’ experiments, MCT1 expression levels of MCF7-sh-WISP2 cells increase during the glucose-deprivation phase of the experiment and then decrease again during the phase of rescue from glucose deprivation, which demonstrates reversibility of changes in MCT1 expression. Similar trends are observed in the MCT1 mRNA levels of MCF7-sh-WISP2 cells during ‘glucose-deprivation’ and ‘rescue’ experiments. Note that due to delayed transcription and translation, which have been reported by several authors and for various systems – see for instance [40, 41] –, there is a delay between the surge in the mRNA level and the surge in the corresponding protein level. On the other hand, an increase resembling the one detected in the MCT1 protein expression levels is not observed in the MCT2 mRNA levels, and no MCT4 mRNA is detected (cf. Fig.S4 in Sup.Mat.S3). In contrast, our data give no indication of a significant change in MCT1 expression of MCF7 cells during both ‘glucose-deprivation’ and ‘rescue’ experiments (cf. Fig.S3 in Sup.Mat.S3).
3.3 Both FECs and SPCs in MCT1-expression may contribute to the adaptation of MCF7-sh-WISP2 cells to glucose deprivation
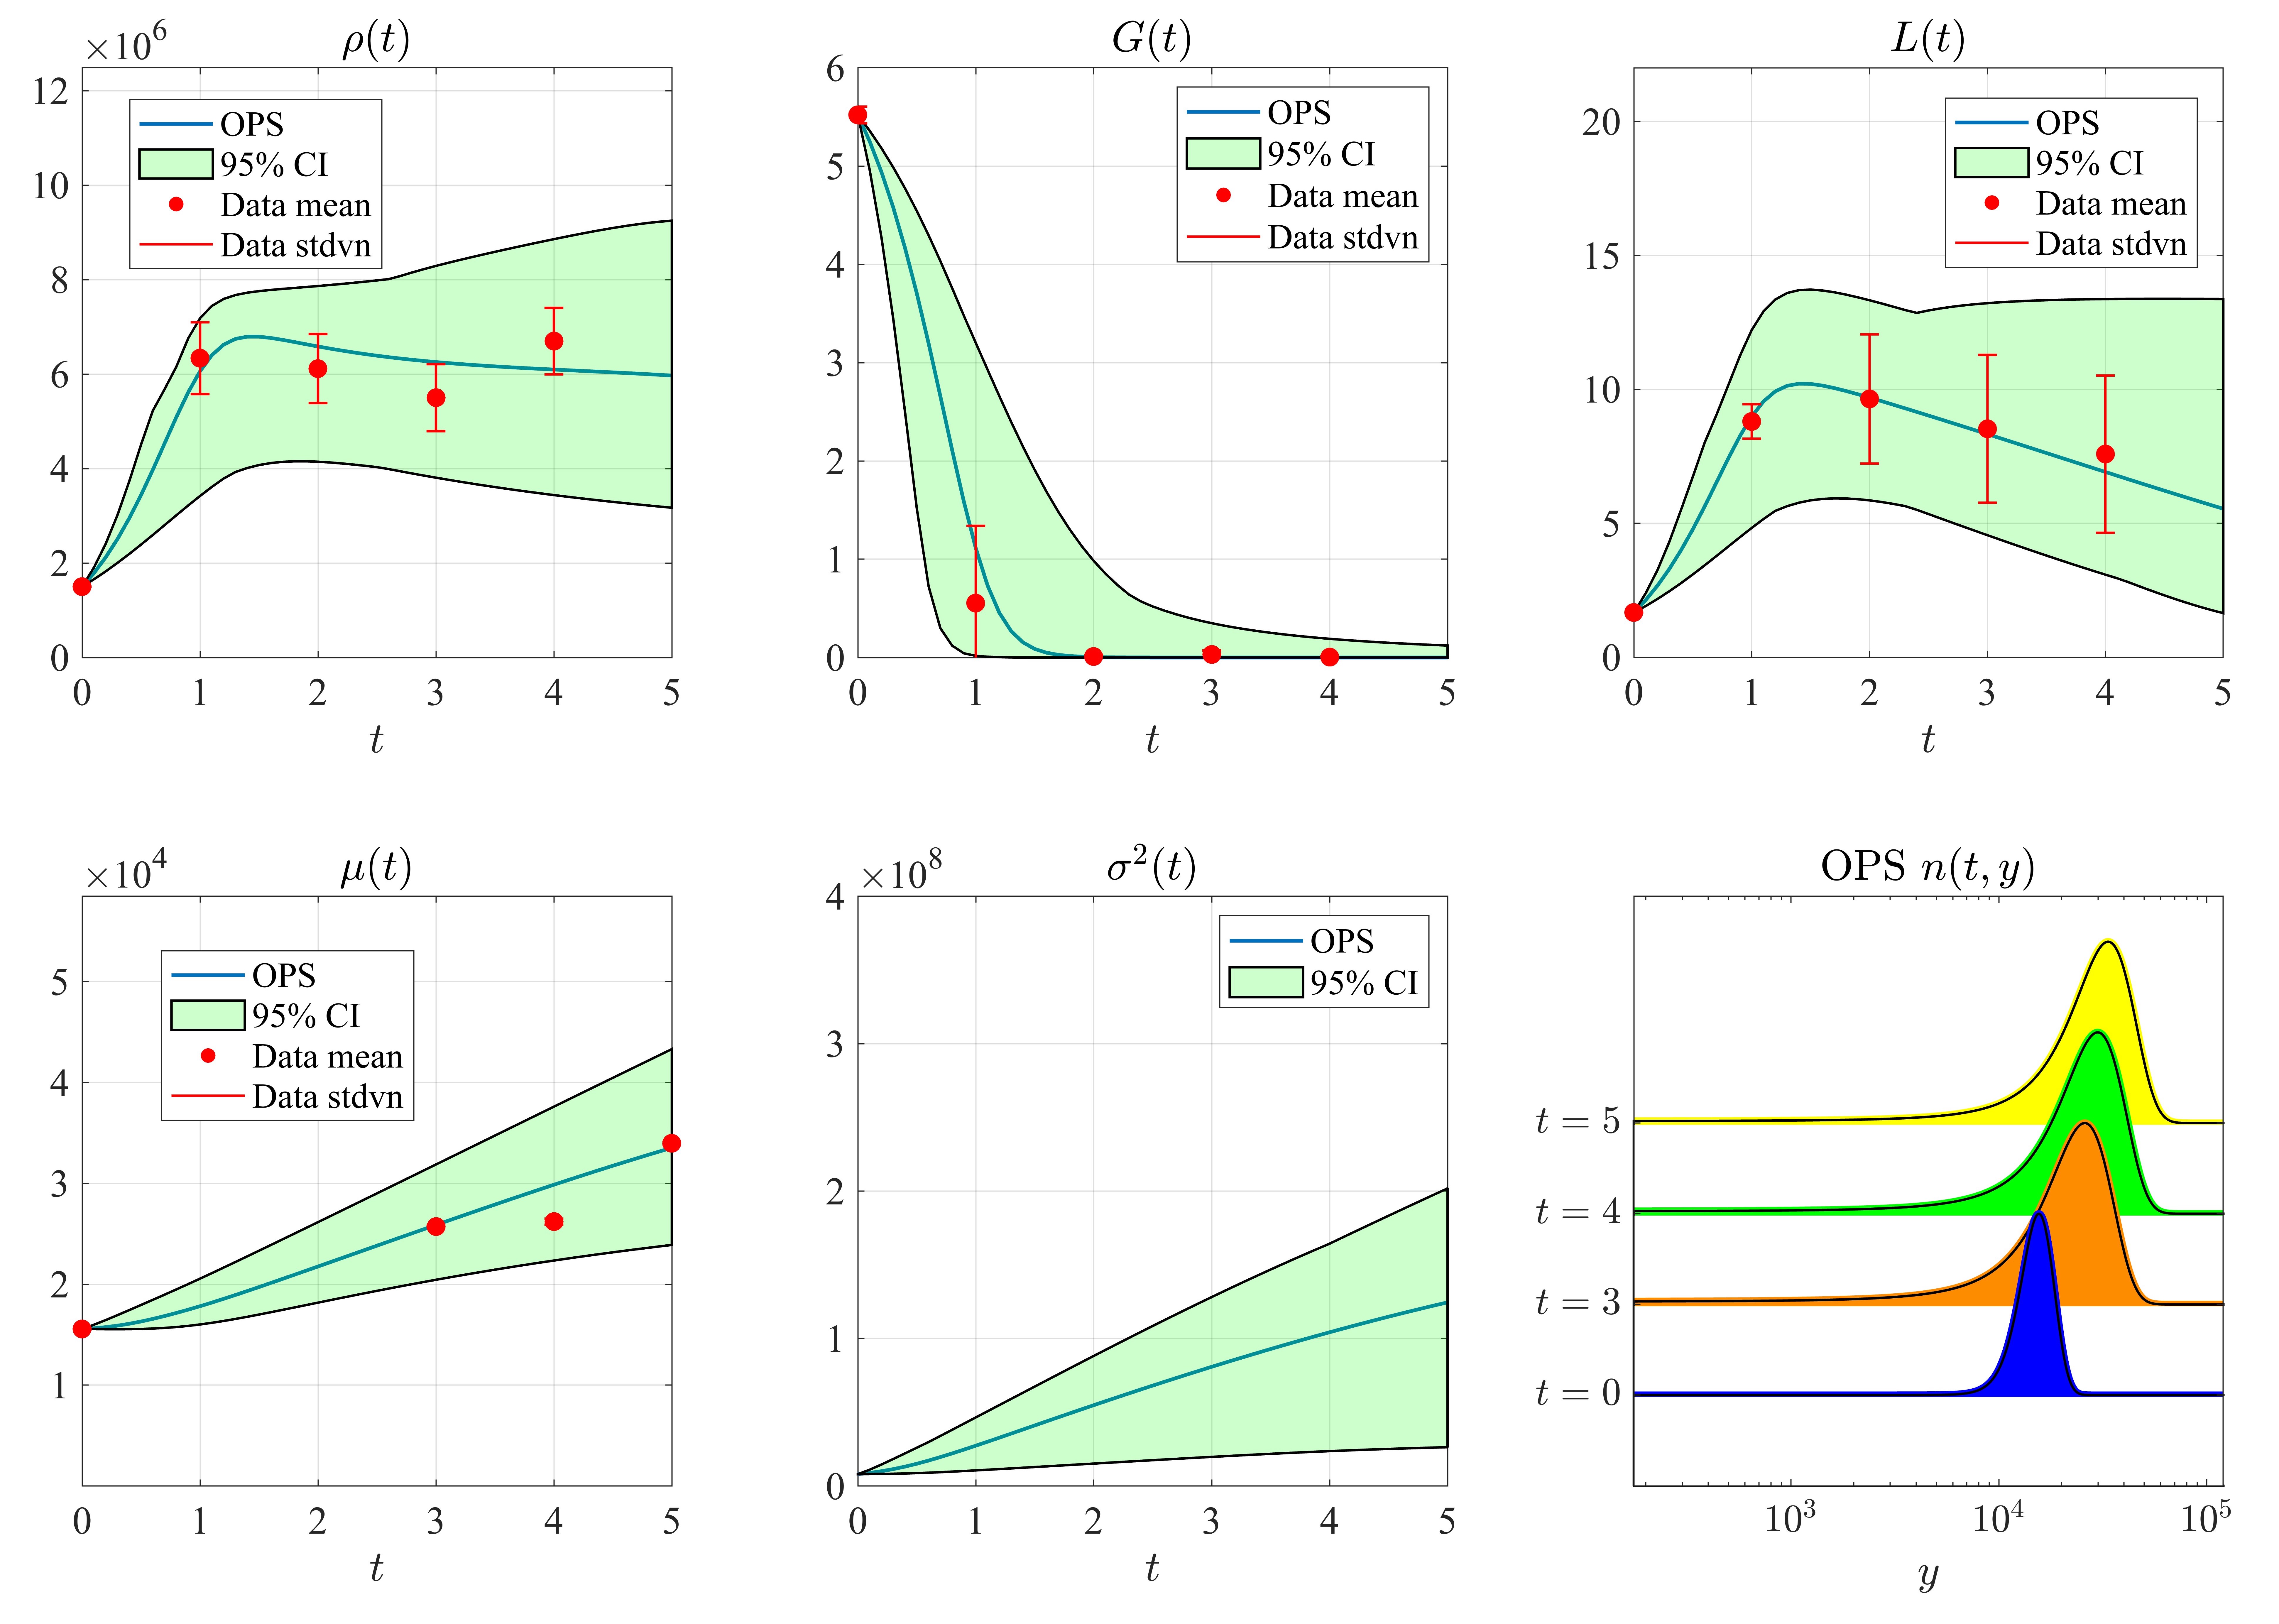
There is good quantitative agreement () between numerical results obtained by simulating ‘glucose-deprivation’ through the calibrated model in which both FECs and SPCs in MCT1 expression are included (i.e. and ) and experimental observations for MCF7-sh-WISP2 cells deprived of glucose, as shown by the plots in Fig.3. Instead, levels of intercellular variability in MCT1 expression much higher or lower than those estimated from experimental data are observed in numerical simulations of the experiments carried out through calibrated reduced models that take into account only FECs or SPCs in MCT1 expression (i.e. and or and ), respectively – this is demonstrated by the dynamics of the variance of the MCT1 expression distribution, , displayed in Fig.S5(d) in Sup.Mat.S3. Furthermore, the results of numerically simulated ‘glucose-deprivation’ experiments carried out over a time span longer than that of in vitro experiments suggest that the synergy between these two forms of changes in MCT1 expression accelerates collective cell adaptation to glucose deprivation. This is demonstrated by the fact that, when and , the mean level of MCT1 expression, , converges more quickly to the level , which in our modelling framework is the level endowing MCF7-sh-WISP2 cells with the maximum capability of taking lactate from the extracellular environment and reusing it to produce the energy required for their proliferation when glucose is scarce (cf. Fig.S7 in Sup.Mat.S3).
Taken together, these results support the idea that both FECs and SPCs in MCT1 expression contribute to the adaptation of MCF7-sh-WISP2 cells to glucose deprivation. In particular, the modelling assumptions underlying these numerical results provide the following theoretical explanation for the increase in the mean level of MCT1 expression experimentally observed amongst glucose-deprived MCF7-sh-WISP2 cells. Cells with different levels of MCT1 expression emerge as a consequence of fluctuations in MCT1 expression due to epigenetic changes. On top of this, as the glucose concentration decreases and the lactate concentration increases during ‘glucose-deprivation’ experiments, SPCs in protein expression mediated by lactate-associated signalling pathways lead cells to express MCT1 at a higher level. Cells with levels of MCT1 expression closer to the fittest one, which in glucose-poor environments is higher than in glucose-rich environments, are then dynamically selected. The interplay between these evolutionary processes results in a progressive increase in the mean level of MCT1 expression of MCF7-sh-WISP2 cells.
Similar conclusions can be drawn by calibrating the model with data from both ‘glucose-deprivation’ and ‘rescue’ experiments – cf. the results of numerical simulations displayed in Fig.S10 in Sup.Mat.S3 – although the delay in the dynamics predicted by the model compared to experimental observations suggest additional evolutionary mechanisms are at play under high glucose levels, i.e. for mM.
3.4 Respective contributions of FECs and SPCs in MCT1-expression in the adaptation of MCF7-sh-WISP2 cells to glucose deprivation
The analytical results of Proposition S2.1 in Sup.Mat.S2 (cf. Eqs. (S28)1 and (S28)2 along with the relations given by Eq.(S4)) clarify how, under the assumptions on which our model is built, FECs and SPCs in MCT1 expression, along with environmental selection on MCT1 expression, affect the dynamics of the mean level of MCT1 expression, , and the corresponding variance, , in MCF7-sh-WISP2 cells. In summary, larger values of the rate of FECs in MCT1 expression, , accelerate the growth of , while a stronger environmental selection on MCT1 expression (i.e. a larger selection gradient ) leads to reduced values of . In turn, larger values of enhance the rate at which approaches the fittest level of MCT1 expression, . Such a rate also increase with the strength of environmental selection on MCT1 expression (i.e. the selection gradient ). Moreover, under glucose deprivation, larger values of the rate at which SPCs lead to an increase in MCT1 expression, , promote the growth of . These analytical results are confirmed by the results of numerical simulations of ‘glucose-deprivation’ experiments presented in Fig.S8 in Sup.Mat.S3, which show that larger values of and correlate with a faster increase of and .
Taken together, these results may clarify the roles played by FECs and SPCs in MCT1 expression in the evolutionary dynamics of glucose-deprived MCF7-sh-WISP2 cells. Under our model’s assumptions, the former promote intercellular variability in MCT1 expression, which creates the substrate for environmental selection to act upon and speed up the selective sweep underlying collective cell adaptation to glucose deprivation, while the latter triggers a prompt adaptive response of glucose-deprived MCF7-sh-WISP2 cells by promoting overexpression of MCT1. These conclusions are also supported by the fact that estimation of the model parameters from experimental data (cf. the OPS reported in Tab.S1 in Sup.Mat.S2) and uncertainty quantification via bootstrapping (cf. the bootstrap statistics reported in Tab.S2 in Sup.Mat.S2 and the bootstrap sampling distributions plotted in Fig.S6 in Sup.Mat.S3) indicate that the rate of SPCs in the level of MCT1 expression is approximately three orders of magnitude larger than the rate of FECs – see Sup.Mat.S2.4 for more details.
3.5 FECs in MCT1-expression may constitute a long-term bet-hedging mechanism for MCF7-sh-WISP2 cells under glucose deprivation
The mathematical model makes it possible to explore the cell evolutionary dynamics beyond timescales and scenarios which can be investigated through experiments. In particular, the analytical results of Theorem S2.2 in Sup.Mat.S2 (cf. Remark S2.3 in Sup.Mat.S2) provide a complete characterisation of the equilibrium values of the number, the mean level of MCT1 expression and the related variance of MCF7-sh-WISP2 cells under virtual scenarios where the glucose and lactate concentrations are kept constant, i.e. a complete characterisation of the limits , and as when and for all . These analytical results are confirmed by the results of numerical simulations of the calibrated model summarised by Fig.S9 in Sup.Mat.S3, which demonstrate that the equilibrium values , and are ultimately attained when .
The results of Theorem S2.2 complement the results discussed in Sec. 3.3 by showing that the equilibrium value of the variance of the MCT1 expression distribution, , increases with the rate of FECs in MCT1 expression, , and decreases with the strength of environmental selection on MCT1 expression (i.e. the selection gradient ). The results of Theorem S2.2 also demonstrate that when glucose is scarce and lactate is present (i.e. when and ), and thus under glucose deprivation, the distance between the equilibrium value of the mean level of MCT1 expression, , and the fittest level of MCT1 expression, , increases with the rate at which SPCs lead to an increase in MCT1 expression, , and decreases with both the rate of FECs , , and the strength of environmental selection on MCT1 expression (i.e. the selection gradient ). This supports the idea that, whilst enabling a faster adaptive response to glucose deprivation, as discussed in Sec. 3.4, SPCs in MCT1 expression may ultimately lead to suboptimal adaptation, whereas FECs may constitute a long-term bet-hedging mechanism.
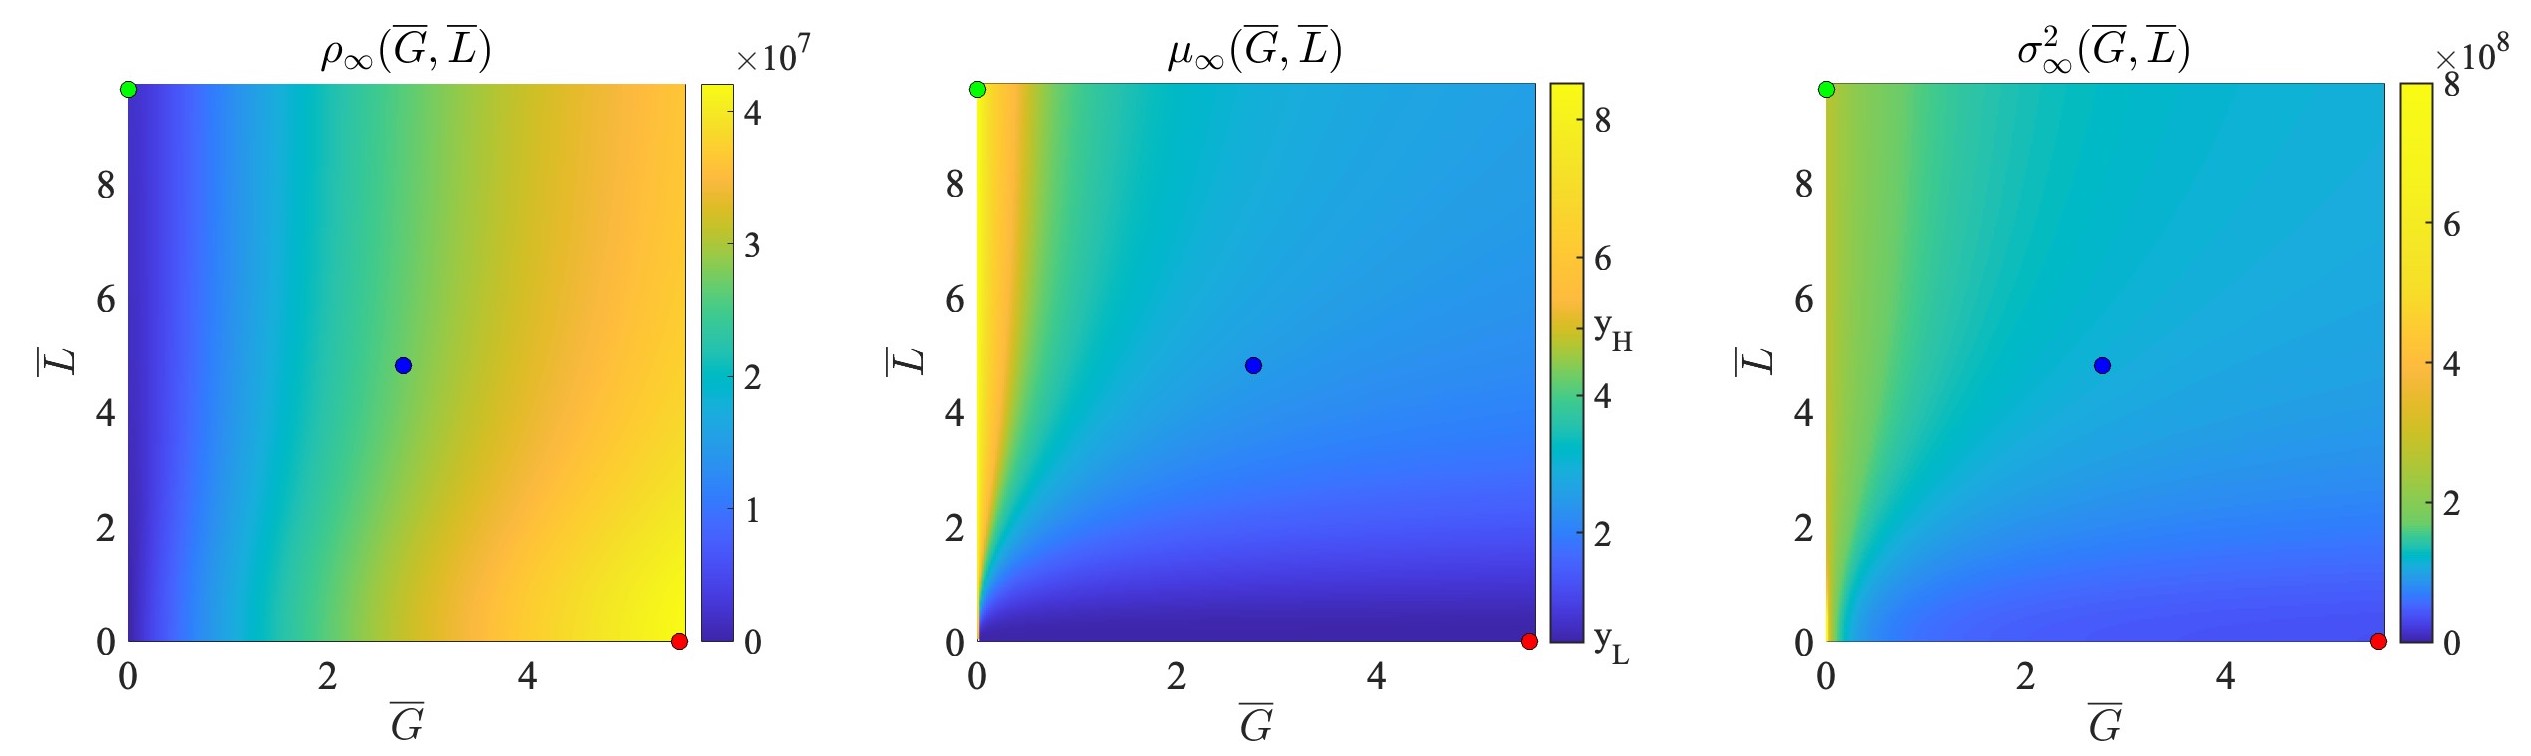
Moreover, the heat maps in Fig. 4 illustrate how the equilibrium values , and vary with the glucose and lactate concentrations and , under the OPS reported in Tab.S1 in Sup.Mat.S2. In summary, when glucose is scarce (i.e. for with mM in the obtained OPS and bootstrap sampling distribution mean reported in Tab.S3 in Sup.Mat.S2): decreases with and increases with ; increases as decreases and reaches maximum levels when is also small; increases with and decreases with when is sufficiently large, while it increases with when is closer to zero. In particular, the values of obtained for mM and mM are only one order of magnitude smaller than those obtained for mM and mM (cf. Fig.S9, first panel in Sup.Mat.S3).
These findings recapitulate the results of numerical simulations of ‘glucose-deprivation’ experiments displayed in Fig.3 by corroborating the idea that, whereas lower mean levels of MCT1 expression emerge when the concentration of glucose in the extracellular environment is sufficiently high, as in ‘rescue’ experiments (cf. Fig.S10 in Sup.Mat.S3), glucose deprivation leads to the selection for cells that are capable of exploiting lactate as an alternative energy source, which results in higher mean levels of MCT1 expression amongst MCF7-sh-WISP2 cells and allows for relatively high cell numbers in spite of glucose scarcity.
4 Discussion
We adopted an experimentally-informed mathematical modelling approach to investigate the evolutionary dynamics of glucose-deprived cancer cells.
In vitro experiments were conducted on two breast cancer cell lines, MCF7 and MCF7-sh-WISP2, seeded at high cell numbers and quickly consuming the glucose initially available at physiological levels. Experimental outputs revealed that the more aggressive MCF7-sh-WISP2 cells have the ability to survive and sustain substantial proliferation in low-glucose conditions, as opposed to the less aggressive MCF7 cells. Changes in lactate levels in situ suggested lactate uptake by MCF7-sh-WISP2 cells, and flow cytometry and immunocytochemistry analyses indicated an associated increase in MCT1 expression, which was then reversed when cells were rescued and exposed again to higher glucose levels.
Experimental data from ‘glucose-deprivation’ experiments on the MCF7-sh-WISP2 cell line were used to calibrate the proposed mathematical model of cell evolutionary dynamics, as well as to conduct uncertainty quantification of the model calibration results, and the MCT1 expression distributions obtained through flow cytometry analyses were compared with those predicted by the mathematical model. We found that the calibrated model, whose numerical simulation results are in good quantitative agreement with experimental data, best reproduces experimental observations when the effects of both FECs and SPCs in MCT1 expression are taken into account. This finding suggests that cognate studies considering only one of these two types of changes in protein expression may be overestimating the rates at which the considered type of change occurs, overall disregarding the combined effect of the two of them.
The analytical and numerical results of the calibrated model presented here suggest that environment-induced changes in MCT1 expression mediated by lactate-associated signalling pathways enable a prompt adaptive response of glucose-deprived cancer cells. Furthermore, fluctuations in MCT1 expression due to epigenetic changes may create the substrate for natural selection to act upon, speeding up the selective sweep underlying cancer cell adaptation to glucose deprivation, and may constitute a long-term bet-hedging mechanism. These results on the respective roles played by FECs and SPCs in MCT1 expression in the evolutionary dynamics of cancer cells, whilst having been obtained for glucose-deprived cells of the MCF7-sh-WISP2 line, may extend to other cell lines and scenarios whereby changes in protein expression elicit metabolic reprogramming of cancer cells under nutrient deprivation – e.g. HIF1 favouring anaerobic energy pathways or CD36 promoting fatty acid uptake [12, 42].
The optimal parameter set recovered from model calibration, and related bootstrap sampling distributions obtained through the uncertainty quantification procedure, suggest that the MCT1 fluorescence intensity levels recorded at the end of the in vitro experiments on MCF7-sh-WISP2 cells do not correspond to maximal levels of lactate uptake, and MCT1 expression levels may continue to increase over time. In practice, performing the experiments over a longer timeframe we expect cells to die out faster than as predicted by the model, due to external factors, demographic stochasticity at low cell numbers or additional byproducts of cell metabolism that are not incorporated into the modelling framework proposed here. Therefore, our study supports the idea that alternative experimental conditions may need to be considered in studies aimed at investigating the fitness of aggressive breast cancer cells at maximum MCT1 expression levels in glucose-deprived conditions – for instance by periodically, or continuously, adding lactate to the medium and recording data for a longer period of time. This would also reproduce the inflow of lactate we expect the cells to be exposed to in vivo, as cells closer to blood vessels may still perform glycolysis due to exposure to high glucose concentrations and thus produce lactate, which could then reach glucose-deprived areas via spatial diffusion [24]. Nevertheless, it is evident from our experimental and numerical results that the observed increase in MCT1 expression of MCF7-sh-WISP2 cells over the span of a few days is sufficient to ensure survival and sustain proliferation under glucose deprivation, maintaining the population at high cell numbers for about a week, by the end of which we expect cells to have initiated alternative survival mechanisms associated with disease progression in vivo [12, 11].
Analogous results have been obtained calibrating the model with data from ‘glucose-deprivation’ and ‘rescue’ experiments, although with a worse quantitative agreement between numerical simulation results and experimental data. This suggests that additional evolutionary mechanisms may need to be considered in regimes of glucose abundance wherein, for instance, carrying capacities and net proliferation rates may differ from those recorded at physiological levels of glucose [43]. Nonetheless, such regimes are outside the scope of this work, and the good qualitative agreement of the model results with experimental data still highlights the model’s ability to predict the reversibility of MCT1 expression observed in ‘rescue’ experiments.
While we recorded an increase in MCT1 expression of glucose-deprived MCF7-sh-WISP2 cells, no MCT4 mRNA was detected, which suggests that the in vitro environmental conditions here investigated do not influence the expression of such a monocarboxylate transporter. It would be relevant to perform similar experiments under hypoxic conditions, as hypoxia-regulated signalling pathways may explain the increase in MCT4 expression observed in vivo far from tumour blood vessels. In this regard, it would also be significant to formulate a spatially-explicit extension of the present model where oxygen dependency of various dynamics, here ignored as experiments were carried out in normoxic conditions, was modelled explicitly. Such an extended model would allow for theoretical studies on the still debated role of hypoxia in MCT1 expression at tissue level, which might reconcile reported discrepancies between oxygen and pH profiles [44, 45, 46, 5], and could inform anti-cancer therapeutic approaches based on MCT1 blockers [13, 14].
Acknowledgements
The authors acknowledge the valuable assistance of Romain Morichon and Annie Munier of the Sorbonne Université-INSERM, UMR_S938, Centre de Recherche Saint-Antoine Imagery and cytometry platform. T.L. thanks the Istituto Nazionale di Alta Matematica (INdAM) and the Gruppo Nazionale per la Fisica Matematica (GNFM) for their support.
Funding
C.V. has received funding from the European Research Council (ERC) under the European Union’s Horizon 2020 research and innovation programme (grant agreement No 740623). T.L. gratefully acknowledges support from the Italian Ministry of University and Research (MUR) through the grant “Dipartimenti di Eccellenza 2018-2022” (Project no. E11G18000350001) and the PRIN 2020 project (No. 2020JLWP23) “Integrated Mathematical Approaches to Socio-Epidemiological Dynamics” (CUP: E15F21005420006). T.L. and C.V. gratefully acknowledge support of the Institut Henri Poincaré (UAR 839 CNRS-Sorbonne Université), and LabEx CARMIN (ANR-10-LABX-59-01). L.A., T.L. and C.V. gratefully acknowledge support from the CNRS International Research Project ‘Modélisation de la biomécanique cellulaire et tissulaire’ (MOCETIBI).
References
- [1] Susana Romero-Garcia, Jose Sullivan Lopez-Gonzalez, José Luis B´ ez Viveros, Dolores Aguilar-Cazares, and Heriberto Prado-Garcia. Tumor cell metabolism: an integral view. Cancer Biology & Therapy, 12(11):939–948, 2011.
- [2] Joanne R Doherty, John L Cleveland, et al. Targeting lactate metabolism for cancer therapeutics. The Journal of Clinical Investigation, 123(9):3685–3692, 2013.
- [3] Juan C García-Cañaveras, Li Chen, and Joshua D Rabinowitz. The tumor metabolic microenvironment: Lessons from lactate. Cancer Research, 79(13):3155–3162, 2019.
- [4] Melissa Keenan and Jen-Tsan Chi. Alternative fuels for cancer cells. Cancer Journal, 21(2):49, 2015.
- [5] Qian Wang, Peter Vaupel, Sibylle I Ziegler, and Kuangyu Shi. Exploring the quantitative relationship between metabolism and enzymatic phenotype by physiological modeling of glucose metabolism and lactate oxidation in solid tumors. Physics in Medicine & Biology, 60(6):2547, 2015.
- [6] Douglas Hanahan and Robert A Weinberg. Hallmarks of cancer: the next generation. Cell, 144(5):646–674, 2011.
- [7] Luigi Ippolito, Andrea Morandi, Elisa Giannoni, and Paola Chiarugi. Lactate: a metabolic driver in the tumour landscape. Trends in Biochemical Sciences, 44(2):153–166, 2019.
- [8] Chongru Zhao, Min Wu, Ning Zeng, Mingchen Xiong, Weijie Hu, Wenchang Lv, Yi Yi, Qi Zhang, and Yiping Wu. Cancer-associated adipocytes: Emerging supporters in breast cancer. Journal of Experimental & Clinical Cancer Research, 39(1):1–17, 2020.
- [9] Andrew P Halestrap. Monocarboxylic acid transport. Comprehensive Physiology, 3(4):1611–1643, 2013.
- [10] Aaminah Khan, Emanuele Valli, Hayley Lam, David A Scott, Jayne Murray, Kimberley M Hanssen, Georgina Eden, Laura D Gamble, Rupinder Pandher, Claudia L Flemming, et al. Targeting metabolic activity in high-risk neuroblastoma through monocarboxylate transporter 1 (mct1) inhibition. Oncogene, 39(17):3555–3570, 2020.
- [11] Alpaslan Tasdogan, Brandon Faubert, Vijayashree Ramesh, Jessalyn M Ubellacker, Bo Shen, Ashley Solmonson, Malea M Murphy, Zhimin Gu, Wen Gu, Misty Martin, et al. Metabolic heterogeneity confers differences in melanoma metastatic potential. Nature, 577(7788):115–120, 2020.
- [12] Baoyi Liu and Xin Zhang. Metabolic reprogramming underlying brain metastasis of breast cancer. Frontiers in Molecular Biosciences, 8, 2021.
- [13] Cyril Corbet, Estelle Bastien, Nihed Draoui, Bastien Doix, Lionel Mignion, Bénédicte F Jordan, Arnaud Marchand, Jean-Christophe Vanherck, Patrick Chaltin, Olivier Schakman, et al. Interruption of lactate uptake by inhibiting mitochondrial pyruvate transport unravels direct antitumor and radiosensitizing effects. Nature Communications, 9(1):1–11, 2018.
- [14] Zi-Hao Wang, Wen-Bei Peng, Pei Zhang, Xiang-Ping Yang, and Qiong Zhou. Lactate in the tumour microenvironment: From immune modulation to therapy. EBioMedicine, 73:103627, 2021.
- [15] Lucia Longhitano, Nunzio Vicario, Daniele Tibullo, Cesarina Giallongo, Giuseppe Broggi, Rosario Caltabiano, Giuseppe Maria Vincenzo Barbagallo, Roberto Altieri, Marta Baghini, Michelino Di Rosa, et al. Lactate induces the expressions of MCT1 and HCAR1 to promote tumor growth and progression in glioblastoma. Frontiers in Oncology, 12, 2022.
- [16] Sui Huang. Genetic and non-genetic instability in tumor progression: link between the fitness landscape and the epigenetic landscape of cancer cells. Cancer and Metastasis Reviews, 32(3):423–448, 2013.
- [17] Ting Wang, Zeng Ye, Zheng Li, De-sheng Jing, Gui-xiong Fan, Meng-qi Liu, Qi-feng Zhuo, Shun-rong Ji, Xian-jun Yu, Xiao-wu Xu, et al. Lactate-induced protein lactylation: A bridge between epigenetics and metabolic reprogramming in cancer. Cell proliferation, page e13478, 2023.
- [18] Gabriele Bergers and Sarah-Maria Fendt. The metabolism of cancer cells during metastasis. Nature Reviews Cancer, 21(3):162–180, 2021.
- [19] Di Zhang, Zhanyun Tang, He Huang, Guolin Zhou, Chang Cui, Yejing Weng, Wenchao Liu, Sunjoo Kim, Sangkyu Lee, Mathew Perez-Neut, et al. Metabolic regulation of gene expression by histone lactylation. Nature, 574(7779):575–580, 2019.
- [20] Luigi Ippolito, Giuseppina Comito, Matteo Parri, Marta Iozzo, Assia Duatti, Francesca Virgilio, Nicla Lorito, Marina Bacci, Elisa Pardella, Giada Sandrini, et al. Lactate rewires lipid metabolism and sustains a metabolic–epigenetic axis in prostate cancer. Cancer Research, 82(7):1267–1282, 2022.
- [21] Aleksandra Ardaševa, Robert A. Gatenby, Alexander R. A. Anderson, Helen M. Byrne, Philip K. Maini, and Tommaso Lorenzi. A mathematical dissection of the adaptation of cell populations to fluctuating oxygen levels. Bulletin of Mathematical Biology, 82(6):81, 2020.
- [22] Giulia L Celora, Samuel B Bader, Ester M Hammond, Philip K Maini, Joe M Pitt-Francis, and Helen M Byrne. A DNA-structured mathematical model of cell-cycle progression in cyclic hypoxia. Journal of Theoretical Biology, 545:111104, 2022.
- [23] Heyrim Cho and Doron Levy. Modeling the dynamics of heterogeneity of solid tumors in response to chemotherapy. Bulletin of Mathematical Biology, 79(12):2986–3012, 2017.
- [24] Giada Fiandaca, Marcello Delitala, and Tommaso Lorenzi. A mathematical study of the influence of hypoxia and acidity on the evolutionary dynamics of cancer. Bulletin of Mathematical Biology, 83(7):1–29, 2021.
- [25] Chiara Villa, Mark AJ Chaplain, and Tommaso Lorenzi. Evolutionary dynamics in vascularised tumours under chemotherapy: Mathematical modelling, asymptotic analysis and numerical simulations. Vietnam Journal of Mathematics, 49(1):143–167, 2021.
- [26] Jessica B McGillen, Catherine J Kelly, Alicia Martínez-González, Natasha K Martin, Eamonn A Gaffney, Philip K Maini, and Víctor M Pérez-García. Glucose–lactate metabolic cooperation in cancer: Insights from a spatial mathematical model and implications for targeted therapy. Journal of Theoretical Biology, 361:190–203, 2014.
- [27] Berta Mendoza-Juez, Alicia Martínez-González, Gabriel F Calvo, and Víctor M Pérez-García. A mathematical model for the glucose-lactate metabolism of in vitro cancer cells. Bulletin of Mathematical Biology, 74(5):1125–1142, 2012.
- [28] Nathaniel J Linden, Boris Kramer, and Padmini Rangamani. Bayesian parameter estimation for dynamical models in systems biology. bioRxiv, 2022.
- [29] Ruben Martinez-Cantin. BayesOpt: a Bayesian optimization library for nonlinear optimization, experimental design and bandits. Journal of Machine Learning Research, 15(1):3735–3739, 2014.
- [30] In Jae Myung. Tutorial on maximum likelihood estimation. Journal of Mathematical Psychology, 47(1):90–100, 2003.
- [31] Mary E Spilker and Paolo Vicini. An evaluation of extended vs weighted least squares for parameter estimation in physiological modeling. Journal of Biomedical Informatics, 34(5):348–364, 2001.
- [32] Paul A Thompson and OH44106 Cleveland. A tutorial on bootstrapping in the sas system. SAS Institute Inc, 1996.
- [33] Weimo Zhu. Making bootstrap statistical inferences: A tutorial. Research Quarterly for Exercise and Sport, 68(1):44–55, 1997.
- [34] Nathalie Ferrand, Anne Gnanapragasam, Guillaume Dorothee, Gérard Redeuilh, Annette K Larsen, and Michèle Sabbah. Loss of WISP2/CCN5 in estrogen-dependent MCF7 human breast cancer cells promotes a stem-like cell phenotype. PloS One, 9(2):e87878, 2014.
- [35] Michèle Sabbah, Céline Prunier, Nathalie Ferrand, Virginie Megalophonos, Kathleen Lambein, Olivier De Wever, Nicolas Nazaret, Joël Lachuer, Sylvie Dumont, and Gérard Redeuilh. CCN5, a novel transcriptional repressor of the transforming growth factor signaling pathway. Molecular and Cellular Biology, 31(7):1459–1469, 2011.
- [36] Simon J Park, Chase P Smith, Ryan R Wilbur, Charles P Cain, Sankeerth R Kallu, Srijan Valasapalli, Arpit Sahoo, Maheedhara R Guda, Andrew J Tsung, and Kiran K Velpula. An overview of MCT1 and MCT4 in GBM: small molecule transporters with large implications. American Journal of Cancer Research, 8(10):1967, 2018.
- [37] Pierre Sonveaux, Frédérique Végran, Thies Schroeder, Melanie C Wergin, Julien Verrax, Zahid N Rabbani, Christophe J De Saedeleer, Kelly M Kennedy, Caroline Diepart, Bénédicte F Jordan, et al. Targeting lactate-fueled respiration selectively kills hypoxic tumor cells in mice. The Journal of Clinical Investigation, 118(12):3930–3942, 2008.
- [38] Tommaso Lorenzi, Rebecca H Chisholm, and Jean Clairambault. Tracking the evolution of cancer cell populations through the mathematical lens of phenotype-structured equations. Biology Direct, 11(1):43, 2016.
- [39] Rebecca H Chisholm, Tommaso Lorenzi, Laurent Desvillettes, and Barry D Hughes. Evolutionary dynamics of phenotype-structured populations: from individual-level mechanisms to population-level consequences. Zeitschrift für angewandte Mathematik und Physik, 67(4):1–34, 2016.
- [40] Tomáš Gedeon and Pavol Bokes. Delayed protein synthesis reduces the correlation between mrna and protein fluctuations. Biophysical Journal, 103(3):377–385, 2012.
- [41] Dov Greenbaum, Christopher Colangelo, Kenneth Williams, and Mark Gerstein. Comparing protein abundance and mrna expression levels on a genomic scale. Genome Biology, 4(9):1–8, 2003.
- [42] Maurice Zaoui, Mehdi Morel, Nathalie Ferrand, Soraya Fellahi, Jean-Philippe Bastard, Antonin Lamazière, Annette Kragh Larsen, Véronique Béréziat, Michael Atlan, and Michèle Sabbah. Breast-associated adipocytes secretome induce fatty acid uptake and invasiveness in breast cancer cells via CD36 independently of body mass index, menopausal status and mammary density. Cancers, 11(12):2012, 2019.
- [43] Peter Friedl and Katarina Wolf. Tumour-cell invasion and migration: diversity and escape mechanisms. Nature Reviews Cancer, 3(5):362–374, 2003.
- [44] Gabriel Helmlinger, Fan Yuan, Marc Dellian, and Rakesh K Jain. Interstitial pH and pO2 gradients in solid tumors in vivo: high-resolution measurements reveal a lack of correlation. Nature Medicine, 3(2):177–182, 1997.
- [45] Vera Miranda-Gonçalves, Sara Granja, Olga Martinho, Mrinalini Honavar, Marta Pojo, Bruno M Costa, Manuel M Pires, Célia Pinheiro, Michelle Cordeiro, Gil Bebiano, et al. Hypoxia-mediated upregulation of MCT1 expression supports the glycolytic phenotype of glioblastomas. Oncotarget, 7(29):46335, 2016.
- [46] Mohammed S Ullah, Andrew J Davies, and Andrew P Halestrap. The plasma membrane lactate transporter MCT4, but not MCT1, is up-regulated by hypoxia through a HIF-1-dependent mechanism. Journal of Biological Chemistry, 281(14):9030–9037, 2006.