Oxygen abundances in the narrow line regions of Seyfert galaxies and the metallicity–luminosity relation
Abstract
We present oxygen abundances relative to hydrogen (O/H) in the narrow line regions (NLRs) gas phases of Seyferts 1 (Sy 1s) and Seyferts 2 (Sy 2s) Active Galactic Nuclei (AGNs). We used fluxes of the optical narrow emission line intensities [Å] of 561 Seyfert nuclei in the local universe () from the second catalog and data release (DR2) of the BAT AGN Spectroscopic Survey, which focuses on the Swift-BAT hard X-ray ( keV) detected AGNs. We derived O/H from relative intensities of the emission lines via the strong-line methods. We find that the AGN O/H abundances are related to their hosts stellar masses and that they follow a downward redshift evolution. The derived O/H together with the hard X-ray luminosity () were used to study the X-ray luminosity-metallicity (-) relation for the first time in Seyfert galaxies. In contrast to the broad-line focused (-) studies, we find that the - exhibit significant anti-correlations with the Eddington ratio () and these correlations vary with redshifts. This result indicates that the low-luminous AGNs are more actively undergoing Interstellar Medium (ISM) enrichment through star formation in comparison with the more luminous X-ray sources. Our results suggest that the AGN is somehow driving the galaxy chemical enrichment, as a result of the inflow of pristine gas that is diluting the metal rich gas, together with a recent cessation on the circumnuclear star-formation.
keywords:
galaxies: abundances; galaxies: active; galaxies: evolution; galaxies: formation; galaxies: ISM; galaxies: SeyfertReleased 2021 Apr 20
1 Introduction
There are significant observational data which point to a direct link between the host galaxies and the accretion onto supermassive black holes (SMBHs). For instance, the masses of star bulges and the masses of their central SMBHs are tightly correlated (see Kormendy & Ho, 2013; Graham, 2016, for review). Active Galactic Nuclei (AGNs) activity can impact the host galaxy and the tenuous environment by ionizing or photo-dissociating the gas, heating the halo gas and reducing the rate of cold accretion onto the galaxy, and/or driving fast outflows that eject gas to large galactocentric distances and, thus in powerful AGNs, temporarily or permanently suppressing star formation (SF) by removing the gas supply from massive galaxies (see Somerville & Davé, 2015, for a review).
Global changes in the metallicity of galaxies are driven by stellar nucleosynthesis, and thus, it is fundamental to connect it with the star formation history (SFH) in galaxies. AGNs are crucial components of theoretical models of galaxy formation and evolution used in regulating the SF in galaxies. The constant gas ejection or heating and, as a result, SF suppression is expected in massive galaxies ( ) because of AGN nuclear emission. Although this mechanism is an important component of numerical simulations of galaxy formation, observational studies have not yet conclusively supported it. The negative AGN feedback from observational study is required for many findings to be reproduced by theoretical models, such as the substantial suppression of SF in the most massive galaxies (e.g. Springel et al., 2005; Hopkins & Elvis, 2010; Brownson et al., 2020; Smith et al., 2020). AGN-driven winds, shock compression or gas accretion may also cause SF in the host galaxy, a phenomenon known as positive feedback (e.g. Elbaz et al., 2009; Silk, 2013; Maiolino et al., 2017; Salomé et al., 2017; Gallagher et al., 2019; Koss et al., 2021; Kawamuro et al., 2021). However, some studies, particularly for moderate-luminosity AGNs, claim that star formation is independent of AGN activity (e.g. Stanley et al., 2015; Suh et al., 2019). From the foregoing, it is safe to posit that galaxy-scale warm-ionized and cold molecular outflows, which are powered by actively accreting SMBHs and traced by rest-frame optical (Heckman et al., 1981) and carbon monoxide (CO; Cicone et al., 2014) emission lines respectively, can be associated with both the suppression and triggering of star formation. However, a thorough understanding of the interactions between AGN accretion and star formation processes of the host galaxy is required to fully understand galaxy formation and evolution.
The elemental abundance and metallicity ()111The gas-phase metallicity is usually calculated as the oxygen abundance relative to hydrogen, and defined in units of [12 + log(O/H)]. Oxygen is used to define the overall gas-phase metallicity because it presents prominent temperature-sensitive collisionally excited lines (e.g. : [O ii] and : [O iii], [O iii]) in the optical spectrum of gaseous nebulae. For brevity, oxygen abundance and metallicity are used interchangeably in this work. estimations in the gas phase of AGNs are essential in the study of the chemical evolution of galaxies. The gas phase metallicity can be derived in both star-forming regions (SFs, i.e. H ii regions and star-forming galaxies) and AGNs through direct estimation of the electron temperature, usually known as -method222For a review of the -method for SFs see Peimbert et al. (2017), Pérez-Montero (2017) and AGNs see Dors et al. (2020b). and strong-line methods333For a review of strong-line methods for SFs and AGNs see Lopez-Sanchez & Esteban (2010) and Dors et al. (2020a), respectively.. It is worthwhile to note that SFs are ionized by massive stars (e.g. O- or early B-type stars), while AGNs have harder radiation fields as their ionization sources. Therefore, applying SFs metallicity formalism to AGNs will yield systematically biased metallicities (e.g. Dors et al., 2020b). There is consensus that the -method is the most reliable approach to estimate metallicity and elemental abundances in SFs (Pilyugin, 2003; Toribio San Cipriano et al., 2017). Recently, Dors et al. (2020b) proposed a new methodology of the -method for AGNs which produces reliable O/H abundances lower ( dex) than those derived from detailed photoionization models. For the first time, Armah et al. (2021), Monteiro & Dors (2021) and Dors et al. (2022), motivated by this new methodology derived the neon, argon and helium abundances, respectively, in 164 local Seyfert 2 nuclei (). The -method requires measurements of auroral lines (e.g. [O iii]4363, [N ii]5755, [S iii]6312) which are weak ( times weaker than H) and detected only in objects with high ionization and/or low metallicity (e.g. van Zee et al., 1998; Díaz et al., 2007; Dors et al., 2008). Thus, it is impossible to derive a direct measurement of abundance from the emission lines if the critical emission-line diagnostics for electron temperature and, to some extent, electron density are unavailable. To circumvent this problem, Pagel et al. (1979), following the original idea by Jensen et al. (1976), proposed a calibration between strong-emission lines, in the case of [O iii](5007)/H, and the O/H abundance. Thereafter this pioneering work, several authors have proposed calibrations for SFs (e.g. Marino et al., 2013; Pilyugin & Grebel, 2016; Curti et al., 2017; Jiang et al., 2019, and references therein) and for AGNs (e.g. Storchi-Bergmann et al., 1998; Dors et al., 2014, 2019; Castro et al., 2017; Carvalho et al., 2020; Dors, 2021, among others).
Therefore, by comparing AGN luminosity () and the metallicity, it is possible to study the origin and evolution of SMBHs and their host galaxies (e.g. Wang et al., 2010). Previous studies have shown a distinct relation between the metallicity from the narrow-line region () and the (e.g. Netzer et al., 2004; Nagao et al., 2006; Matsuoka et al., 2009). The ionized gas mass of the NLR is , which is far greater than that of the broad-line region (BLR) i.e. (e.g. Osterbrock, 1989; Baldwin et al., 2003a), suggesting that the - relation is an indication that AGN gas metallicity traces the gas enrichment in its host galaxy. Since the BLR has a very small radius (e.g. ; Kaspi et al., 2000; Bennert et al., 2006b; Suganuma et al., 2006) because of its proximity to the central source as compared to the NLR (e.g. ; Bennert et al., 2006a) in galactic nuclei, the - relation will be a better tracer of the evolution of the host galaxy than the metallicity from the BLR (- relation). Also, may be uniquely promising and better suited as a proxy for the properties of the host galaxy since the spatial extent of the NLR region is larger than the BLR in low- and high- as well as high , as observed by the strong correlation between the size of the NLR and the of the optical [O iii] emission line (e.g. Dempsey & Zakamska, 2018; Sun et al., 2018; Chen et al., 2019). Moreover, values have been found to be either solar or near the solar metallicity () i.e. (e.g. Nagao et al., 2006; Dors et al., 2019), hence estimates at all redshifts are higher by a factor of 2-15 times (e.g. Hamann & Ferland, 1993; Baldwin et al., 2003b; Bentz et al., 2004; Tang et al., 2019; Garnica et al., 2022), which indicates that the is not representative of the metallicity of the host galaxy, which is better traced by the . Although the BLRs are located in objects with high mass, where high metallicity values are expected (e.g. Xu et al., 2018), the higher values which are indirectly inferred from metallicity-sensitive broad emission-line flux ratios seem to be unreal (e.g. Temple et al., 2021, consideration for changes in the physical conditions of the emitting gas before metallicity estimation) as compared to direct estimates of the values. However, most of the studies have been based on small samples of objects and/or with no - relation studies (see Dors et al., 2020a, for example).
The stellar mass-metallicity relation (MZR; e.g. Tremonti et al., 2004; Boardman et al., 2022) indicates that the metallicities of galaxies increase with increasing stellar masses, while the fundamental metallicity relation (FMR; e.g. Lilly et al., 2013; Pistis et al., 2022) suggests that, for a given stellar mass, galaxies with higher star formation rates (SFRs) tend to have lower metallicities. For the first time, Matsuoka et al. (2018) found a correlation between and the host galaxy mass (- relation) for objects at . A comparison between observed ultraviolet emission-line flux ratios and photoionization model predictions by these authors showed that increases by 0.7 dex as increases from to . This relation was also confirmed by Dors et al. (2019) for type 2 AGNs in a wider redshift range () following a similar methodology by Matsuoka et al. (2018). Both studies indicate that AGNs and their host galaxies have similar metal enrichment and the - relation seems to complement similar estimates from star-forming galaxies (see Maiolino et al., 2008) for towards higher masses.
On the other hand, for the local Universe, a different scenario is found. For instance, Thomas et al. (2019) used the Bayesian code (NebulaBayes) which is based on photoionization model fitting of several optical emission lines and found that the increases by dex as a function of the over the range . However, this increase is lower than the uncertainty produced by the strong-line methods (e.g. Storchi-Bergmann et al., 1998; Denicoló et al., 2002)) or by the -method (e.g. Berg et al., 2020; Dors et al., 2022). Moreover, Dors et al. (2020a) applied all the methods available in the literature for deriving using spectroscopic data from SDSS-DR7 (York et al., 2000; Abazajian et al., 2009) but could not confirm the - relation for local objects (.
The aforementioned MZR studies suggest some discrepancies between the results from various studies and raise the question of whether there are differences in the - and MZR relations between the global parameters of low or/and high redshift(s) in AGNs, or if they are driven by small samples or due to the effects of the various selection criteria and methods have on the of galaxies. In view of this, we apply the strong-line methods to analyse the - relation using optical and X-ray data from a large sample of X-ray selected AGNs in this current study. In principle, the X-ray luminosity can yield more reliable results than the stellar mass because X-ray surveys are practically efficient for selecting AGNs since X-ray emissions are generated from the nuclear components with relatively clean signals which are less affected by obscuration and contamination from non-nuclear emissions. Hitherto, almost all the - and - relations in the literature have been obtained based on either optical or UV selection criteria. However, the hard ( keV) X-ray luminosity () of the Swift-BAT AGN Spectroscopic Survey (BASS; see Ricci et al., 2017a, for details) which have been relied on in this work, measures direct emission from the AGN which is unaffected by dust or contamination from SF, and is much less sensitive to obscuration in the line-of-sight as compared to soft X-ray or optical wavelengths, allowing a selection based on only the central engine properties. Compact, nuclear, and luminous X-ray emission is certainly a sign of an AGN due to the compact and dense plasma required to produce X-ray emission since at low-z an X-ray luminosity e.g. cannot be produced by anything else other than an accreting SMBH. Therefore, we compare the metallicity derived from optical emission lines of these hard X-ray selected AGNs with their X-ray properties to better understand the AGN - relation. This paper is organized as follows. We describe the observational data in § 2. Details to the calculations of the total oxygen abundances via the strong-line methods have been outlined in § 3. The results and discussions are presented in § 4. Finally, we summarize our findings in § 5. Throughout this paper, we adopt a spatially flat CDM cosmology with the parameters: = 0.3, = 0.7 and .
2 Observational Data and Sample Description
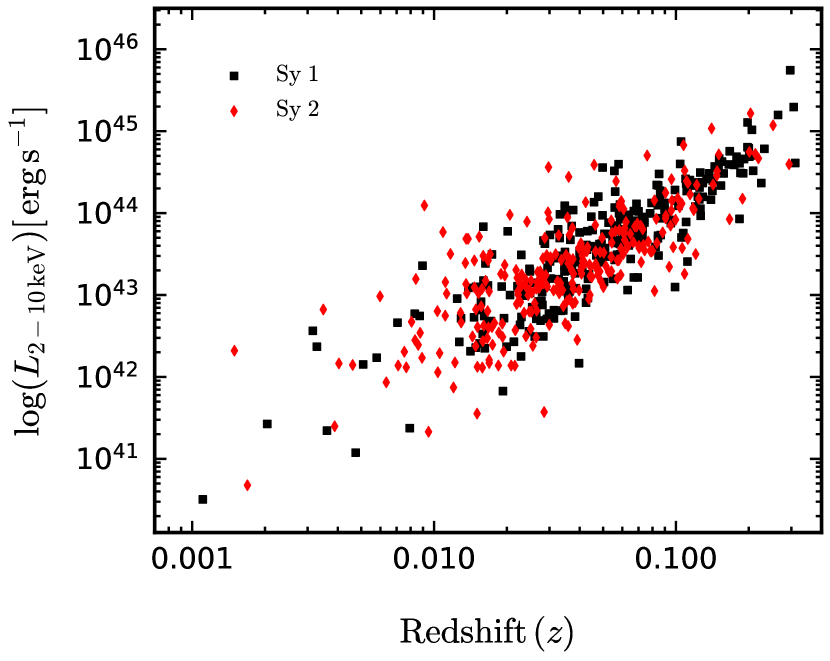
To calculate the oxygen abundances for the narrow line region of a sample of Seyfert nuclei, optical spectroscopic data taken from the literature are considered. Therefore, we selected AGN emission line intensities from the BASS DR2 presented by (Oh et al., 2022) for the O/H estimations. It is worth mentioning that these authors have taken special care to remove the broad components from the allowed emission lines as well as removing possible outflow asymmetries effects from the emission line fluxes (for details see Oh et al., 2022). In order to compare these abundances with AGN properties (e.g. , Eddington ratios) we cross-matched this sample with the BASS DR2, which provides X-ray observed and intrinsic luminosities (Ricci et al., 2017a), resulting in 743 common sources, more details are given below (see § 2.1). The luminosity values for the AGN sample are those measured in the two X-ray bands, 2-10 keV and 14-195 keV, and the metallicity estimated are calculated through optical emission lines. Figure 1 shows a plot of the selected X-ray luminosities in the Swift-BAT AGN sample together with their corresponding redshifts. Points with different colours represent the observed 2-10 keV luminosities for all the sources in our sample with spectroscopic redshifts.
2.1 The 70-month Swift-BAT Catalog and the emission line fluxes
The Burst Alert Telescope (BAT) instrument onboard the Swift satellite (Gehrels et al., 2004), which is undertaking an all-sky survey in the ultra-hard X-ray band ( keV), has identified 1210 objects (Baumgartner et al., 2013), of which 858 are classified as AGNs (Koss et al., 2022a) based on their cross-correlations with objects in the medium and soft energy X-ray bands.
The optical emission line fluxes (3 200-10 000 Å) of 743 sources presented by Oh et al. (2022) in the BASS DR2 were considered in this work. A complete summary of the instrument setups and observing parameters have been provided by Koss et al. (2022a). The BASS DR2 used targeted observations with the Palomar Double Spectrograph (DBSP), which is attached to the Hale 200-inch telescope (36.4 %, 271/743), the X-Shooter spectrograph mounted on the European Southern Observatory’s Very Large Telescope (ESO-VLT) (22.7 %, 169/743; Vernet et al., 2011), the Boller & Chivens (B & C) spectrograph mounted on the 2.5 m Irénée du Pont telescope at the Las Campanas Observatory (5.5 %, 41/743), observations from the Goodman spectrograph (4.3 %, 32/743; Clemens et al., 2004) on the Southern Astrophysical Research (SOAR) telescope, and the low-resolution imaging spectrometer (LRIS: 0.7 %, 5/743; Oke et al., 1995) on the Keck telescope. Spectra from publicly available surveys, such as SDSS Data Release 15 (15.9 %, 118/743; Aguado et al., 2019) and, 71 AGN spectra (see Koss et al., 2017) that were not in the DR2 were also used.
Due to its selection from the hard Xray band (14–195 keV), the BASS sample is almost insensitive to obscuration up to Compton-thick levels ( > 1024 cm-2, Ricci et al., 2015; Koss et al., 2016). Koss et al. (2017); Koss et al. (2022a) and Oh et al. (2022) have given a detailed overview of the optical spectroscopic data. Additionally, extended multi-wavelength campaigns from near-infrared (NIR) to soft X-ray wavelengths have made it possible to further characterize the BASS sample, for the scaling between global galaxy properties such as the correlations between X-ray and optical obscuration, NIR lines, X-ray photon index, absorption and coronal properties, AGN mass outflow rates and bolometric luminosity (e.g. Berney et al., 2015; Lamperti et al., 2017; Oh et al., 2017; Trakhtenbrot et al., 2017; Ricci et al., 2017b, 2018; Rojas et al., 2020; Liu et al., 2020; Koss et al., 2021; Ananna et al., 2022; Kakkad et al., 2022; Ricci et al., 2022, among others).
2.2 Our final sample
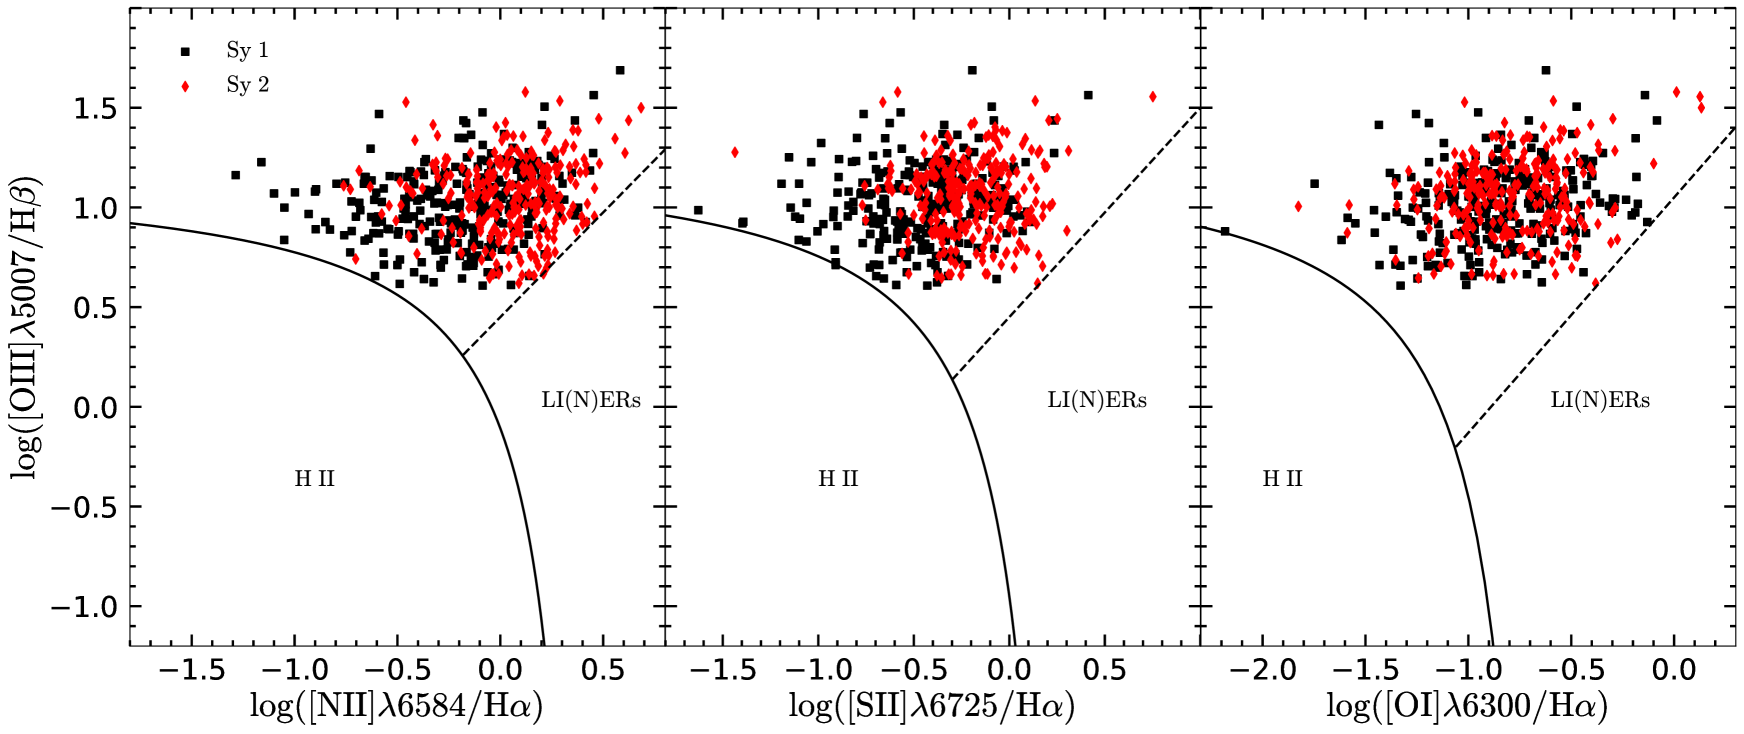
We selected Seyfert galaxies from the second catalog and data release of the BASS made available by Oh et al. (2022). For a better comparison with previous works with regards to the oxygen abundance, we consider only sources classified as Seyferts based on diagnostic diagrams (see § 2.3 below) as suggested by Baldwin et al. (1981). We consider the diagrams [O iii]5007/ versus [N ii]6583/, [S ii]6717,6731/, and [O i]6300/ that require the theoretical demarcation lines used by Kewley et al. (2001, 2006) proposed to separate AGNs, transition and star-forming regions and the empirical line proposed by Schawinski et al. (2007) to separate Seyferts from LI(N)ERs (also see Cid Fernandes et al., 2010).
Considering the selected Seyferts sample, we applied criteria for the optical data which consists of emission lines observed in the wavelength range of (Å) as well as the . These criteria are underscored below:
-
1.
The objects must have the narrow optical H, [O iii]5007, H, [N ii] and [S ii]6716,6731 emission-line fluxes measured, which gives a total sample consisting of 561 objects. We started with 743 sources, excluded 138 because they were not within Seyfert region (including 56 LI(N)ERs), 44 AGNs with high obscuration and non-detection of H were also discarded. We define Sy 1 as the sources with Sy 1-1.5 classification as defined by Oh et al. (2022) based on the strength of [O iii] to H and Sy 2 as those with Sy 1.8-2 classification444This choice was made because objects classified as Sy 1.8 shows very weak broad H and H in its optical spectrum while in Sy 1.9 only the weak broad component is detected at H (e.g Osterbrock, 1981), thus their overall spectrum is more close to a type 2 source than to a true type 1.. Therefore, the 561 objects comprise of 287 Sy 1s and 274 Sy 2s where the emission lines were detected at significance level for each target. This selection criterion permits to estimate the NLRs metallicities based on several strong-line methods (see Dors et al., 2020a, for a review of the methods).
-
2.
Finally, we selected objects with estimated Eddington ratios, / to analyse the - relation. We obtained a sub-sample for 282 Sy 1s and 264 Sy 2s from Koss et al. (2022a) with Eddington ratio estimates based on the intrinsic X-ray emission and black hole masses using velocity dispersions (Koss et al., 2022b) and broad Balmer lines (Mejía-Restrepo et al., 2016). Thus, we note that the analysis involving these quantities are with smaller samples than those with only .
We chose only the strong-line methods to determine the abundances because when the presence of the [O iii]4363 line is considered in the selection criteria for the sources, the sample will considerably be reduced to 218/561 sources. Moreover, considering the -method will lead to selection effect, specifically the high degree of uncertainties in the measurements of the strengths of the weak temperature-sensitive auroral oxygen line [O iii]4363 given that [O iii]4363 emission line should be at rest with respect to the -method associated rest-optical nebular emission lines, which could potentially introduce similar margin of high degree of uncertainties in the oxygen abundances derived using the -method.
2.3 Diagnostic diagrams
Although the objects considered in the present work have been classified as AGNs by the original authors, for consistency with our previous works we produced an additional test for a homogeneous sample selection based on the standard Baldwin-Phillips-Terlevich (BPT; Baldwin et al., 1981; Veilleux & Osterbrock, 1987) diagrams. Here we adopted the theoretical criterion which relied on photoionization model results, proposed by Kewley et al. (2001, 2006), where emission line objects with
| (1) |
| (2) |
and
| (3) |
are classified as AGNs. The [S ii]6725 line represents the sum of the [S ii]6717, 6731 doublet. Fig. 2 shows the diagnostic diagrams using the emission-line ratios of log([O iii]/H) versus log([N ii]/H), log([S ii]6725/H) and log([O i]6300/H) for our sample of galaxies. The dashed line shown in this figure represents the criterion proposed by Schawinski et al. (2007) to separate AGN-like and low ionisation (nuclear) emission line regions [LI(N)ERs] objects, given by
| (4) |
We notice that the objects cover a large range of ionization degree and metallicity since a wide range of [O iii]/H and [N ii]/H are observed (e.g. Feltre et al., 2016; Castro et al., 2017; Ji et al., 2020; Agostino et al., 2021).
2.4 Reddening correction
Seyfert galaxies can be strongly affected by internal reddening (see Schnorr-Müller et al., 2016; Lu et al., 2019, for example). However, the internal extinction can be derived from the ratio of the strongest recombination lines of hydrogen in the optical spectrum i.e. H/H. For a pure recombination and a temperature of K, this ratio is expected to have the value H/H = 2.86 (Case B recombination; Osterbrock, 1989). An observed ratio higher than this value can thus be attributed to reddening from dust. The corresponding colour excess from this ratio is expressed as,
| (5) |
where are the Galactic extinction coefficients, and are the reddening curve values at the and wavelengths, respectively. The logarithmic extinction coefficient, c(H), is the reddening constant simply defined as
| (6) |
The final logarithmic extinction coefficient can be thus calculated from the following relation as:
| (7) |
An extinction correction can then be applied to all observed emission line fluxes, normalized to the H flux using
| (8) |
where is the intensity (reddening corrected) of the emission line at a given wavelength , is the observed flux of the emission line, is the adopted reddening curve normalized to H and (H) is the interstellar extinction coefficient. The values were compiled from Table 7.1 by Osterbrock (1989). In order to provide supplementary interpolation data for further important nebular emission lines between different specific wavelength-dependent extinction factor values since not all lines were listed, we have derived the following reddening function555The wavelength dependence in the optical domain, is the reddening value for the line derived from the curve given by , such that and yields to the curve, considering the rest-frame wavelengths for permitted and forbidden lines from Moore (1945) and Bowen (1960), respectively.:
| (9) |
with in units of micrometers within the range .
Halpern (1982) and Halpern & Steiner (1983) used photoionization models and found that (H/H) is in AGNs with high and low ionization degree in comparison to the canonical Case B recombination value of 2.86. Therefore, (H/H) = 2.86 and 3.10 intrinsic ratios are usually considered to be estimations for galaxies dominated by star formation and for galaxies dominated by AGNs, respectively (Ferland & Netzer, 1983; Gaskell, 1982, 1984; Gaskell & Ferland, 1984; Veilleux & Osterbrock, 1987; Wysota & Gaskell, 1988). Particularly, in AGNs, there is a large transition zone, or partly ionized region, in which H0 coexists with H+ and free electrons (see Dors et al., 2022, and references therein). In this zone, collisional excitation is also important in addition to recombination (Ferland & Netzer, 1983; Halpern & Steiner, 1983). The main effect of collisional excitation is to enhance the intensity of H. The higher Balmer lines are less affected because of their large re-excitation energies and smaller excitation cross-sections. With this in mind, we have corrected the emission-line fluxes for extinction using the Balmer decrement and the Cardelli et al. (1989) reddening curve for the internal and Galactic reddening, respectively. We assumed an and an intrinsic H/H=3.1.
Since some measurements for the emission lines do not have their uncertainties listed (H: 29/561, H: 1/561, [O iii]4959: 25/561, [O iii]5007: 5/561, [N ii] 6548: 63/561, [N ii] 6584: 6/561 and [S ii]6716, 6731: 31/561 each), thus, we adopted a typical error of (see, for instance, Kraemer et al. 1994; Hägele et al. 2008). These errors were propagated through the estimations of the uncertainties in the derived values of the metallicity (in order of 0.1 dex). It worth to note that, for a lower redshift limit of , extraction aperture of 1.5-2′′ (Koss et al., 2022a) in radius and the aperture covering fraction of are sufficient for avoiding aperture effects on our metallicity estimates (see Kewley et al., 2005; Kewley & Ellison, 2008). Additionally, these authors posited that the derived metallicity can vary by 0.14 dex from the value determined when the total galaxy emission is taken into account for apertures that capture less than of the total galaxy emission. However, only the nuclear region abundances are considered in our study, so the aperture effect on our metallicity estimates is insignificant.
3 Methodology
The main goal of this work is to derive the oxygen abundance relative to hydrogen (O/H) from the NLRs of a sample of Seyfert nuclei in order to analyse the - relation. In view of that, we adopted the strong-line methods for optical emission lines to be applied in the studies of the NLR of Seyfert nuclei. In the following sections we describe to somewhat details of the aforementioned methods and the oxygen abundance computed from the data under consideration in this work.
3.1 AGN calibrations
In recent optical surveys such as the Sloan Digital Sky Survey (SDSS; York et al., 2000), the [O ii] line is measured in very few objects. Moreover, [O ii] line is more in the bluer part of the spectrum and it is more effectively scattered or affected by interstellar reddening. Furthermore, more than one-half of the current strong-line calibrations derived for AGNs consider the [O ii] line as data selection criterion (e.g. Storchi-Bergmann et al., 1994; Castro et al., 2017; Dors, 2021). Therefore, we note that when the presence of the [O ii] line is considered in the selection criteria of objects, the sample is considerably reduced. Hitherto, the only AGN calibrations which solely rely on [N ii]6548,6584/H and/or [O iii]4959,5007/H are the two calibrations proposed by Storchi-Bergmann et al. (1998) and Carvalho et al. (2020). We provide descriptions of these calibrations in the following sections.
3.1.1 Storchi-Bergmann et al. (1998) calibration
Storchi-Bergmann et al. (1998) used grid of photoionization models by assuming a typical AGN continuum, which were built with the Cloudy code (Ferland et al., 2017) and, for the first time proposed two AGN theoretical calibrations between the NLRs emission line ratios [N ii]6548,6584/H, [O ii]/[O iii] as well as [O iii]/H and the metallicity (traced by the oxygen abundance). The models were constructed assuming a gas density value of , and the calibrations were fitted within dex of the models. These calibrations are valid for the range of and the oxygen abundances obtained from these calibrations differ systematically by only dex (Storchi-Bergmann et al., 1998; Dors et al., 2020a).
In this work we used only one calibration proposed by Storchi-Bergmann et al. (1998, hereafter \textcolorblueSB98f1) because using the [O ii] line as a selection criterion will reduce the number of sources to 396/561. The \textcolorblueSB98f1 calibration is defined by:
| (13) |
where = [N ii]6548,6584/H and = [O iii]4959,5007/H.
3.1.2 Electron density
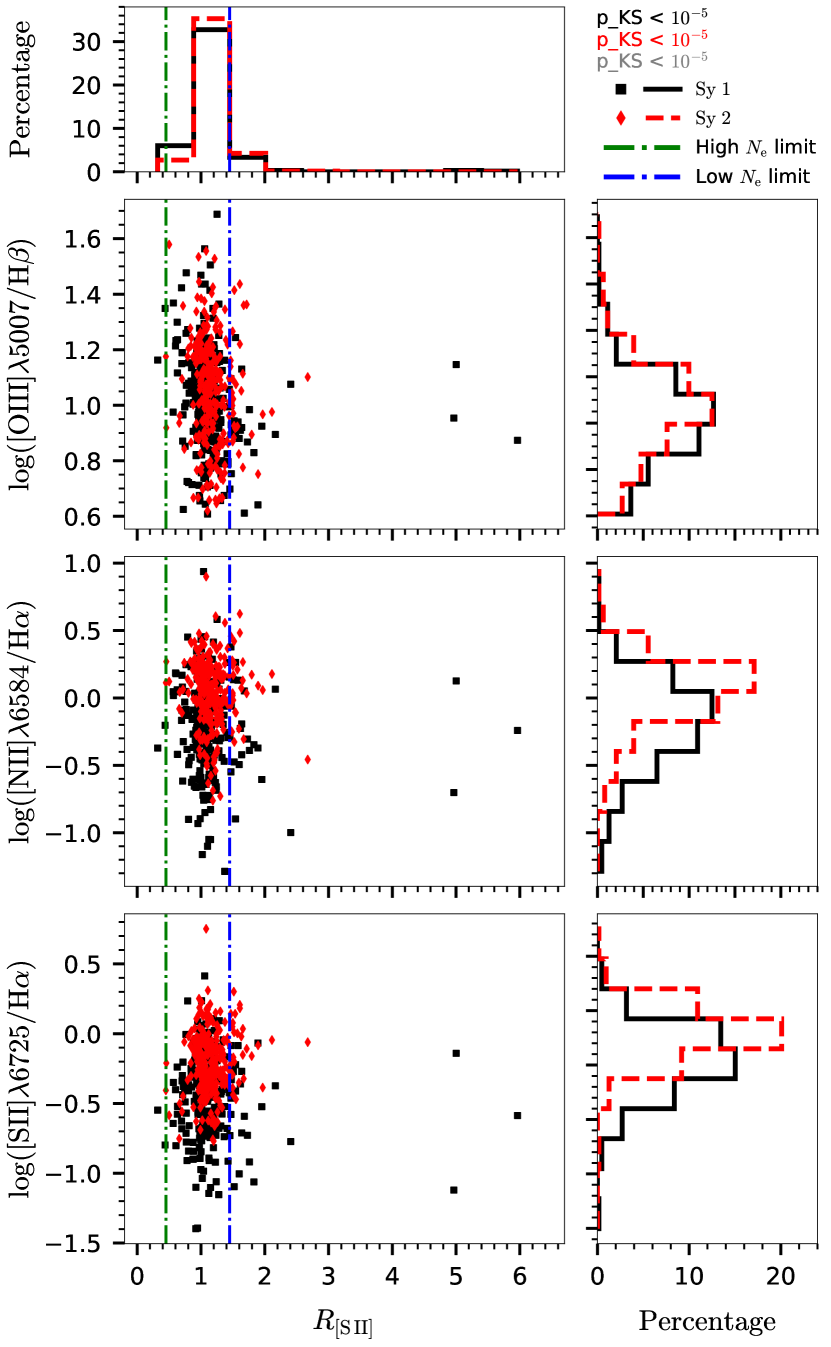
The electron density (), for each object, was calculated from the [S ii]6717,6731 doublet flux ratio, using the 1.1.16 version of PyNeb code (Luridiana et al., 2015) and assuming a constant electron temperature K, typical for photoionized gas in the NLRs. The PyNeb code allows an interactive procedure where is computed from the required forbidden lines depending on specific value of . Moreover, it is worth mentioning that [S ii]6717,6731 can only be applied to (where , see Osterbrock & Ferland 2006; Sanders et al. 2016), which translates into electron density values in the range of , respectively. Therefore, for the objects with emission line ratios outside these theoretical constraints, we assumed the electron density to be if , in order to avoid collisional de-excitation666 The critical density values for [S ii] and [S ii] are and cm-3, respectively, see Vaona et al. (2012). effect and if , which is the minimum electron density value for the calibration by \textcolorblueSB98f1. From the 561 objects considered for the strong-line method calibrations777It is worthwhile to note that only the calibration by \textcolorblueSB98f1 considers electron density in the formalism given by Eq. 14., there are 5 with and 62 with i.e. of the total sample. While some of the values are extreme and beyond the low-density regime other emission lines from the sources are not aberrant.
In order to verify if there is a correlation between the electron density and the intensity of the strong emission line ratios involved in the metallicity calculations, in Fig. 3, we plotted the logarithm of [O iii]/H (top panel), [N ii]/H (middle panel) and [S ii]/H (bottom panel) versus . Also in Fig. 3, we have presented histograms showing the distributions of values from the emission lines considered, where Sy 1 and Sy 2 are indicated by black and red colours, respectively. We applied the two-sample Kolmogorov–Smirnov (KS) statistical test to the frequency distributions of the line ratios in Fig. 3 for the Sy 1 and Sy 2 nuclei of our sample. The KS tests show that the probability of any two distributions being taken from the same parent distribution is lower than , which suggests that the difference in the distributions of the density sensitive and the diagnostic emission line ratios between Sy 1 and Sy 2 is statistically significant. However, this difference does not necessarily translate into a similar significant difference in the metallicity distributions of Sy 1 and Sy 2 due to the electron density, in fact, it signifies that the electron density from has no effect on any discrepancy which may arise from the metallicities between Sy 1 and Sy 2. The KS test values (black, red and grey coloured p-values are for Sy 1, Sy 2 and the combined data-set, respectively) from all the diagnostics, shown in Fig. 3, are lower than , therefore, the electron density has no significant effect on the metallicity values derived.
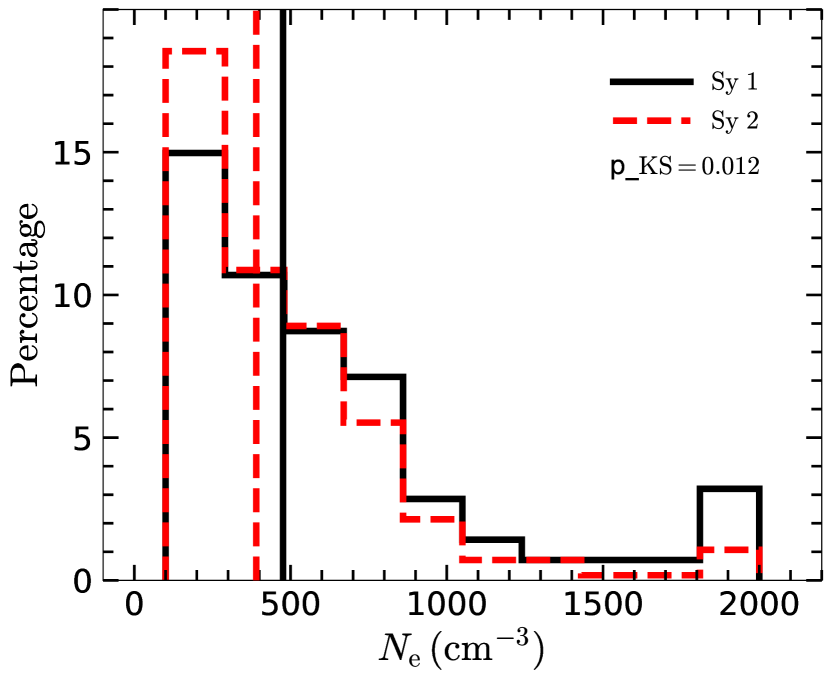
We derived electron density values from Sy 1s and Sy 2s in the range , with median values of and , respectively (see Fig. 4).
3.1.3 Carvalho et al. (2020) calibration
Carvalho et al. (2020, hereafter \textcolorblueC20) presented a comparison using photoionization model predictions built with the Cloudy code (Ferland et al., 2017), considering a wide range of nebular parameters, and a [O iii]/[O ii] versus [N ii]6584/H diagram obtained from observational data of 463 Seyfert 2 nuclei (). From this comparison, these authors derived a semi-empirical calibration between the =log([N ii]6584/H) line ratio and the metallicity , given by
| (15) |
which is valid for . The metallicity results obtained from Eq. 15 can be converted to oxygen abundance via the relation:
| (16) |
where is the solar oxygen abundance value taken from Allende Prieto et al. (2001). The index has an advantage over other metallicity indicators such as [N ii]/[O ii] because it involves emission lines with very close wavelengths: thus, is not strongly affected by dust extinction and uncertainties produced by flux calibration (Marino et al., 2013; Castro et al., 2017).
4 Results and Discussion
4.1 Electron density effect
Since the \textcolorblueSB98f1 calibration depends on the electron density, as shown above (see § 3.1.1), it is important to analyse the potential impact of the electron density on our metallicity results.
The observed forbidden lines from the NLRs are indicative of a low density and are very useful to measure several physical parameters of the region, such as temperature and electron density. In order to examine the distributions of the electron density between Sy 1 and Sy 2, we used a two-sample KS test, as shown in Fig. 4. We find that the significant difference between the samples with the p-value, p_KS , indicates that Sy 1 and Sy 2 are from different distribution for a confidence level of 95 %, although, the same ionization mechanism is responsible for the trends between the electron density distributions of Sy 1 and Sy 2. Our derived aforementioned electron density values (see § 3.1.2) are more in agreement with the typical densities in the NLRs of Seyferts (; e.g. Osterbrock & Ferland, 2006; Ho, 2008).
From the unified model scheme, the narrow forbidden and permitted emission lines in Sy 1 and Sy 2 sources come from the NLR, a region well outside the BLR, spanning a few tens of pc to about 1 kpc (Antonucci, 1993). The mere presence of forbidden lines in the NLR indicates that the gas densities are lower than in the BLR. However, the electron density distribution in Fig. 4 shows that Sy 1 still exhibits slightly higher electron density (also see Peterson et al., 2013) in comparison to Sy 2 (Sy 1 dominates the density distribution at , and vice versa), suggesting that the Sy 1 and Sy 2 are not only a geometrical phenomenon but sources with different physical properties (see Audibert et al., 2017, for other examples). It is noteworthy to emphasize that the values from both Sy 1s and Sy 2s are lower than the critical density ([S ii]6717: and [S ii]6731: , see Vaona et al. 2012) for the emission lines involved in the derivation of the electron density in this work, therefore, collisional de-excitation effect has no influence on our abundance estimates (e.g. Osterbrock & Ferland, 2006; Vaona et al., 2012). It is worth mentioning that similar trends are found even using higher ionization potential lines, such as [Ar iv]4711, 4740 (Vaona et al., 2012; Congiu et al., 2017; Cerqueira-Campos et al., 2021).
Additionally, the electron density determined from the is much lower than those obtained using auroral and transauroral lines, as well as ionization parameter based approach (e.g. Davies et al., 2020). Furthermore, even considering the highest value we assumed for (), the O/H correction is dex, which is in order of the uncertainty of abundances via direct measurements of the electron temperature (e.g. Kennicutt et al., 2003; Hägele et al., 2008) and even lower than those ( dex) via strong line methods (e.g. Denicoló et al., 2002; Marino et al., 2013). Thus, the abundances derived from our sample are only marginally influenced by the electron density.
The NLR can be explained by high-density gas clouds transfer from the nuclear region to the outer part in the host galaxy through the outflows driven by the AGN as shown by photoionization models (e.g. Wada et al., 2018), implying that the NLR gas density increases toward small radii (e.g. Bennert et al., 2006a, b). For instance, spatially resolved observational studies of the NLRs have revealed a profile of electron density along the AGN radius, i.e. electron densities ranging from at the central parts to at the outskirts (e.g. Congiu et al., 2017; Kakkad et al., 2018; Freitas et al., 2018; Revalski et al., 2018; Mingozzi et al., 2019). Since our spectra were integrated in the central parts of the galaxies, the electron density values obtained in the present work must be considered as mean values for the NLRs. The existence of the density effect has already been taken into account in the strong-line calibration by \textcolorblueC20, while \textcolorblueSB98f1 has proposed a correction (Eq. 14 ), which is valid for the gas density in the range , and would have a maximum impact of 0.1 dex (e.g. Dors, 2021) on the metallicity correction. While the use of is still a subject of ongoing debate (e.g. Shimizu et al., 2019; Davies et al., 2020; Nicholls et al., 2020), it is still better suited to probe the NLR gas density for the proposed correction by \textcolorblueSB98f1. Finally, even electron density values derived from spatially observed AGNs and from emission lines emitted by ions (e.g. ) with higher ionization potentials than support the phenomenon that the NLR is indicative of a low density regime (). Thus, collisional de-excitation has a minimum effect on the formation of the emission lines we used to estimate the metallicity (e.g. [O iii]: and [N ii]: , see Vaona et al. 2012).
4.2 Caveats for the Seyfert 1 metallicity
As widely accepted in the AGNs phenomena (e.g. Antonucci, 1993), two distinct emission-line regions are expected to exist around the accretion disk: i) A BLR, which consists of relatively dense clouds () and highly perturbed gas. In this region forbidden emission lines are suppressed by collisional de-excitation while broad permitted lines are emitted with , and ii) the NLR with low electron density clouds () where the narrow forbidden and permitted emission lines () are produced.
Despite these two distinct regions, some studies have shown that, at least in some Sy 1 nuclei, some forbidden lines can also be emitted near the BLRs or, in other words, the NLRs present very high electron density values. Peterson et al. (2013) used observational data from the International AGN Watch campaign via the Hubble Space Telescope, found a variability of the flux of [O iii] and the continuum ( Å) in the well-studied Seyfert 1 NGC 5548. These authors (see also Zhang & Feng, 2016; Sergeev et al., 2017; Landt et al., 2019; Horne et al., 2021) showed that the [O iii] emission occurs preferentially in a compact NLR (1–3 pc) with an electron density , which is close to the critical density for this line (; Vaona et al., 2012). This scenario precludes any direct electron density estimation in the gas region where most of the [O iii] is emitted, even using the [Ar iv] line ratio.
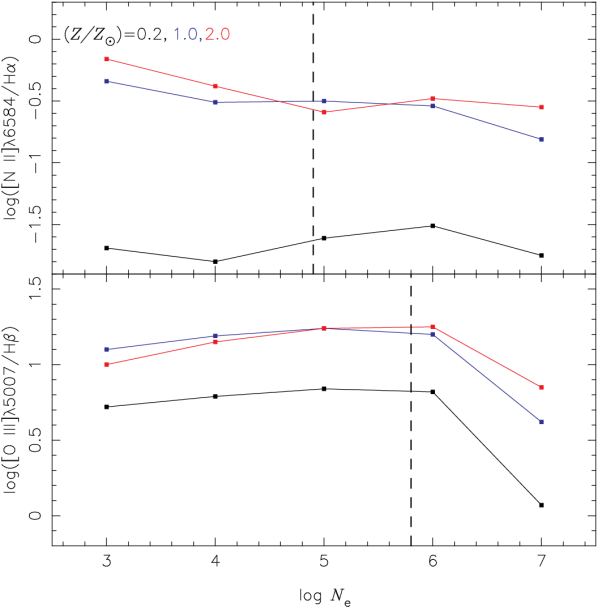
Since \textcolorblueSB98f1 and \textcolorblueC20 calibrations were obtained based on photoionization models assuming low () and constant electron density values along the AGN radius, we can have some biases in the Seyfert 1 oxygen abundance estimates. In order to verify the possible effect of high-density clouds on the strong emission lines used in our metallicity estimates, we performed photoionization model simulations following a similar procedure adopted by Dors et al. (2019). We used AGN models, which were built from version 17.00 of the spectral synthesis code Cloudy (Ferland et al., 2017), with radial density profiles , where is the distance to the center of the AGN, as derived observationally from the Sy 2 galaxy Mrk 573 by Revalski et al. (2018). We assumed the same nebular parameters used by \textcolorblueC20 but for metallicity , an innermost radius of 0.1 pc, the outermost radius where the gas temperature reaches 4 000 K (standard value in the Cloudy code), logarithm of the number of ionizing photons emitted by the central source is considered to be , the slope of the spectral energy distribution, and ranging from 3 to 7 with a step of 1.0 dex. In Fig. 5, the predicted intensities of [O iii]/H, [N ii]/H emission line ratios versus the are shown. Also in this figure the critical density values for [N ii] and [O iii] are indicated. It can be seen that the variations in electron density, for density values lower than the critical density (), have practically insignificant effects on the emission line ratios considered for our metallicity estimations, thus validating the employed metallicity methodology for the Sy 1 sources.
It is worth mentioning that the application of strong emission line calibrations to the derivation of metallicity must be considered in a statistical analysis considering a large object sample, as performed in this work. Obviously, estimates based on detailed photoionization models which take into account a wide spectral wavelength range, as performed by Kraemer et al. (1994) for the two Sy 2 galaxies NGC 7674 and IZw 92, produce more precise metallicity values, but such results are available from a few objects.
4.3 Gas phase abundances
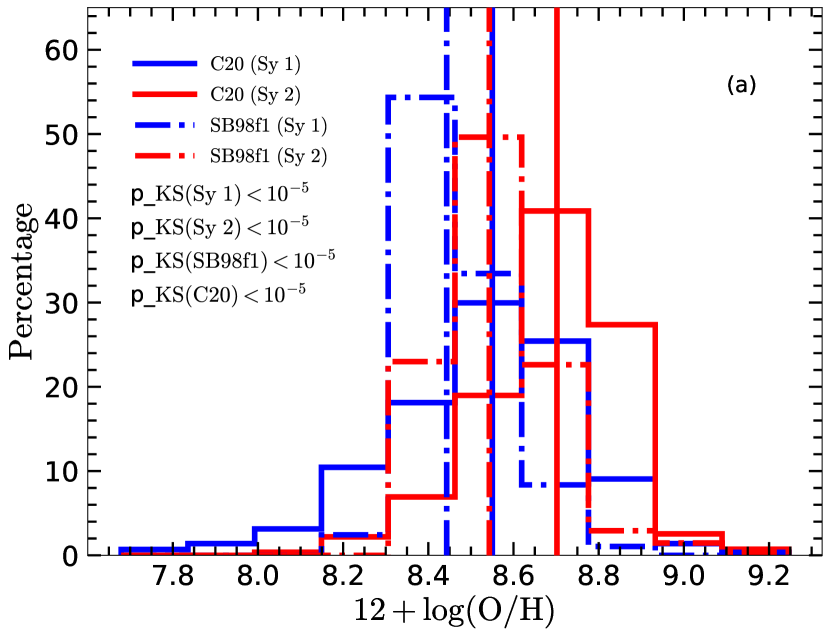
In Fig. 6(a), we show the distribution of oxygen abundances in this study estimated from the NLRs of 287 Sy 1s and 274 Sy 2s with respect to the calibrations by \textcolorblueSB98f1 and \textcolorblueC20 (blue lines for Sy 1 and red for Sy 2). We also show a KS test p_values as follows: i) for Sy 1 sources comparing the two different methods: p_KS(Sy 1) ; ii) for Sy 2 sources comparing the two different methods: p_KS(Sy 2) ; iii) comparing Sy 1 and Sy 2 abundances using the \textcolorblueSB98f1 method: p_KS(SB98f1) and, iv) comparing Sy 1 and Sy 2 abundances using the \textcolorblueC20 method: p_KS(C20) .
It is clear that the O/H distribution from Sy 1 covers a wide range of metallicities as compared to Sy 2, with Sy 1 sources showing median values ( for SB98f1 and for \textcolorblueC20) lower than those in type 2 objects ( for SB98f1 and for \textcolorblueC20). This difference is interpreted as different chemical enrichment paths for type 1 and type 2 sources. This could be due to a more active previous star-formation in the type 2 sources than in type 1s, thus enriching the ISM with recycled material from stellar evolution. In this hypotheses, the AGN would be quenching the star-formation in the nuclear region of type 1 sources. Another possible scenario would be that type 1 sources are experiencing an inflow of low metallicity gas that is diluting the richer gas available in the centre of the galaxies, making the overall abundance lower in type 1 sources. Indeed this hypothesis is in agreement with the findings by \textcolorblueN22 when studying the abundances radial profiles of a sample of Sy 2 sources and comparing them with the nuclear region (e.g. the disc extrapolated values are higher than those obtained for the nuclear region).
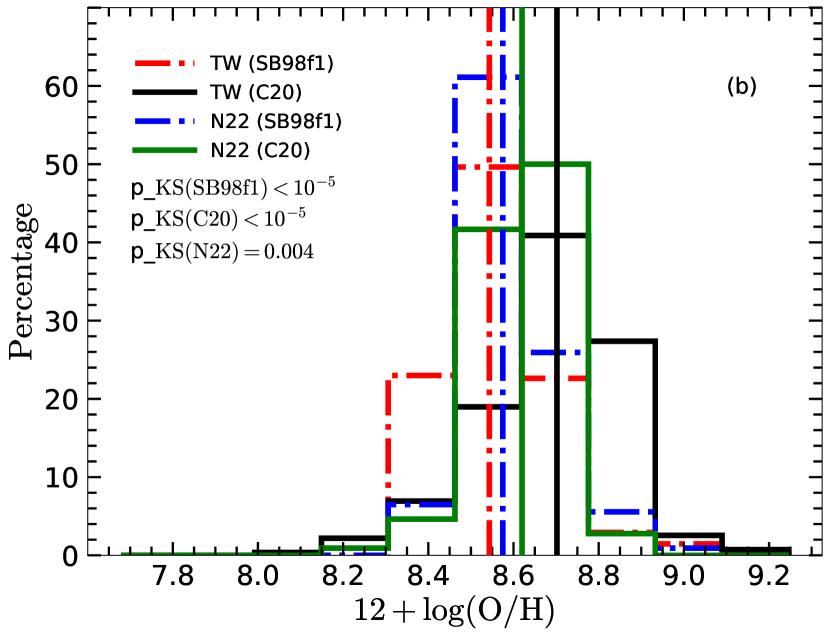
To compare our results with the literature, in Fig. 6(b), we show the distribution of the gas phase abundance estimates for the Sy 2 galaxies in this study in comparison with similar estimations by do Nascimento et al. (2022, hereafter \textcolorblueN22) using observational data from the SDSS-IV MaNGA survey. In addition we also performed KS tests to compare both samples, as follows: i) comparison between our results and those from \textcolorblueN22 using the \textcolorblueSB98f1 method: p_KS(SB98f1); ii) comparison between our results and those from \textcolorblueN22 using the \textcolorblueC20 method: p_KS(C20) and, iii) a comparison between the results found by \textcolorblueN22 from the MaNGA Sy 2 sources using the two different calibrations (\textcolorblueSB98f1 and \textcolorblueC20): p_KS(N22) = 0.004. We observe that there is a good agreement between our estimates and those obtained by \textcolorblueN22 from the two different calibrations. However, comparing the results from Sy 2s using the two calibrations we notice that there is a slight difference, which is obvious in the KS p_values [p_KS(Sy 2) p_KS(N22)] between our estimates and those obtained by \textcolorblueN22, but the difference is not statistically significant.
4.4 Oxygen abundance and AGN properties
4.4.1 X-ray luminosity
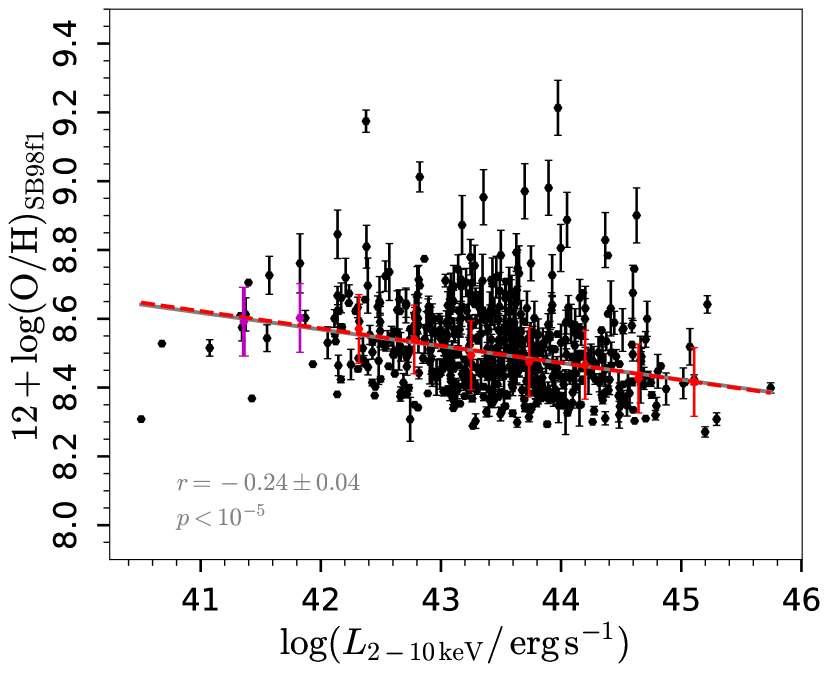
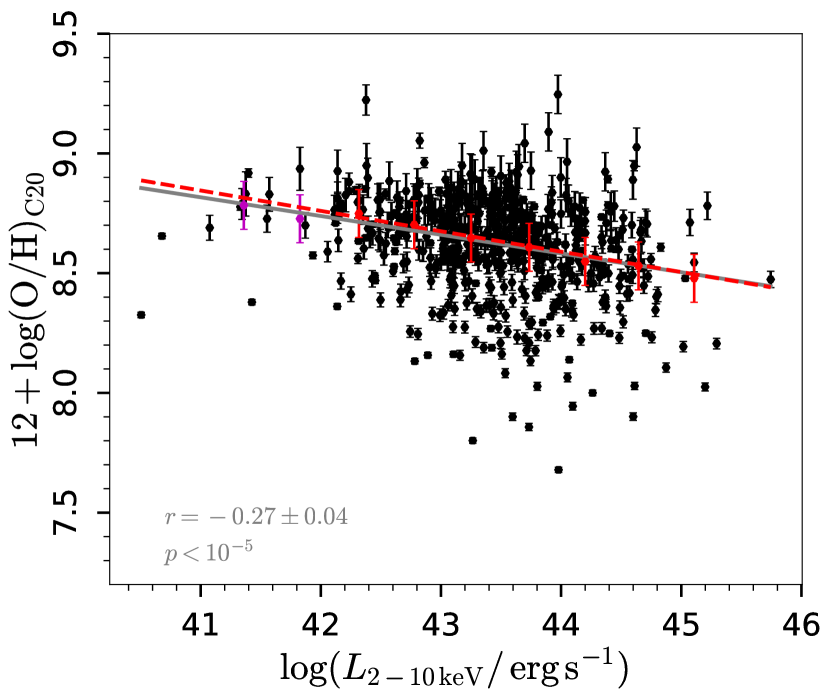
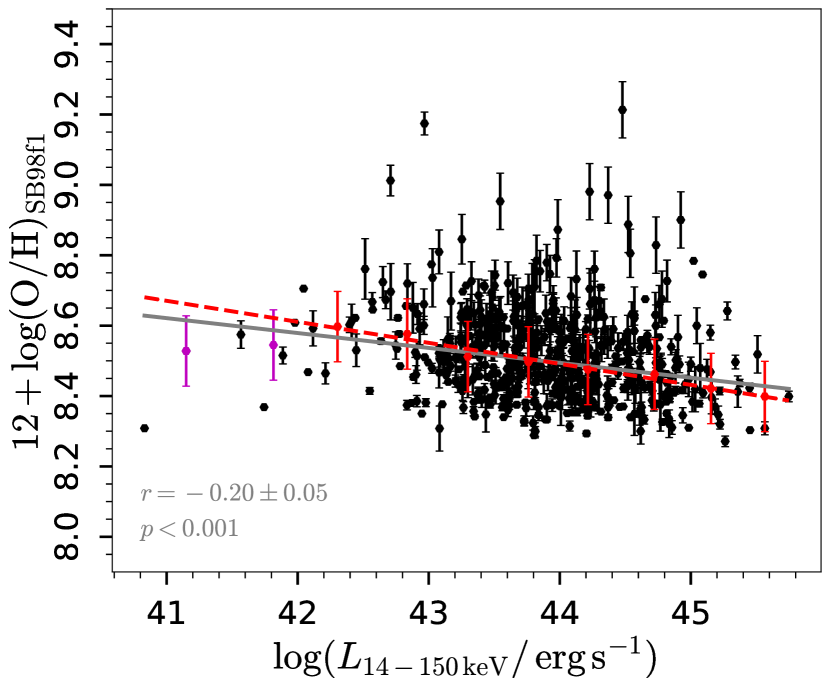
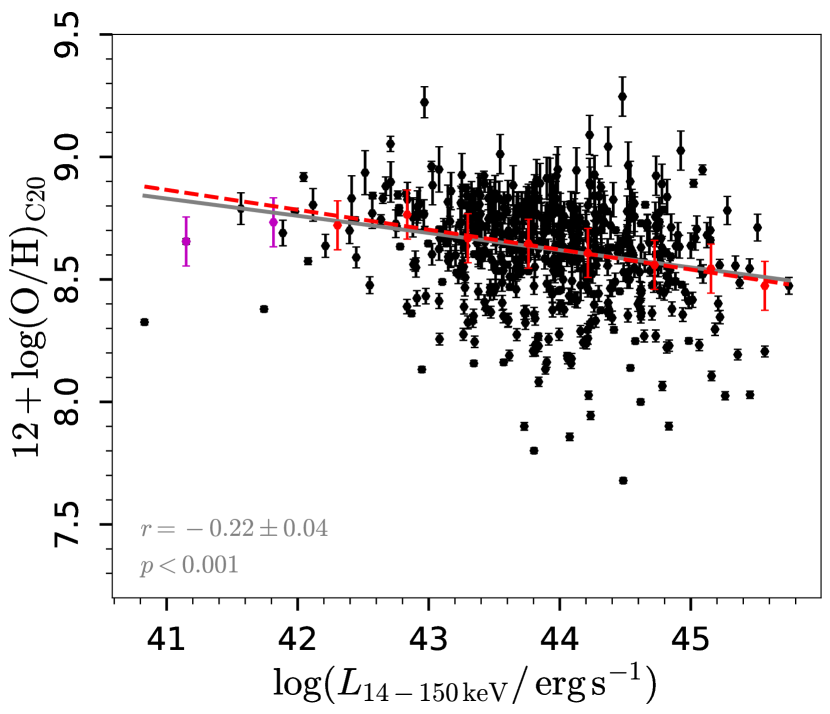
In this section we compare the X-ray luminosities with the oxygen abundances determined for the 561 sources using the different calibrations (see Sect. 2.2). In Figs. 7 and 8, we show the the - relations which indicate anti-correlations between the X-ray luminosities (observed and intrinsic, respectively) and metallicities from the NLR. The solid grey lines show the linear relation between the two parameters ( and ). These lines were obtained following Riffel et al. (2021) using 1000 bootstrap realisations (Davison & Hinkley, 1997) with Huber Regressor model that is robust to outliers (Owen, 2007). The Pearson correlation coefficients and p-values are quoted (they are the mean value of the bootstrap realizations). We also average the oxygen abundance values in bins of 0.5 dex of , which are shown in red, and a liner regression (red dashed line) fit was performed over them (removing the points which are the average of a small number of objects – shown in magenta). We notice that the metallicity estimates show a dependence on the various X-ray luminosities, as seen from the Pearson correlation p-values. In addition, there is a higher correlation from the calibration by \textcolorblueC20 () in comparison with \textcolorblueSB98f1 () at both the observed () and intrinsic () X-ray luminosities. At this point, it is difficult to reconcile which physical quantity is responsible for the observed correlation difference. However, the metallicity exhibits somewhat dependence on the X-ray luminosity regardless of the method used (also see Oh et al., 2017), indicating that there may be a common physical driving mechanism. It is important to highlight that we tested for the correlations separating type 1 and type 2 sources, as a result of this exercise, we note that the metallicity estimates from Sy 1 and Sy 2 follow the same trend with respect to (e.g. the values are the same within the margin of error).
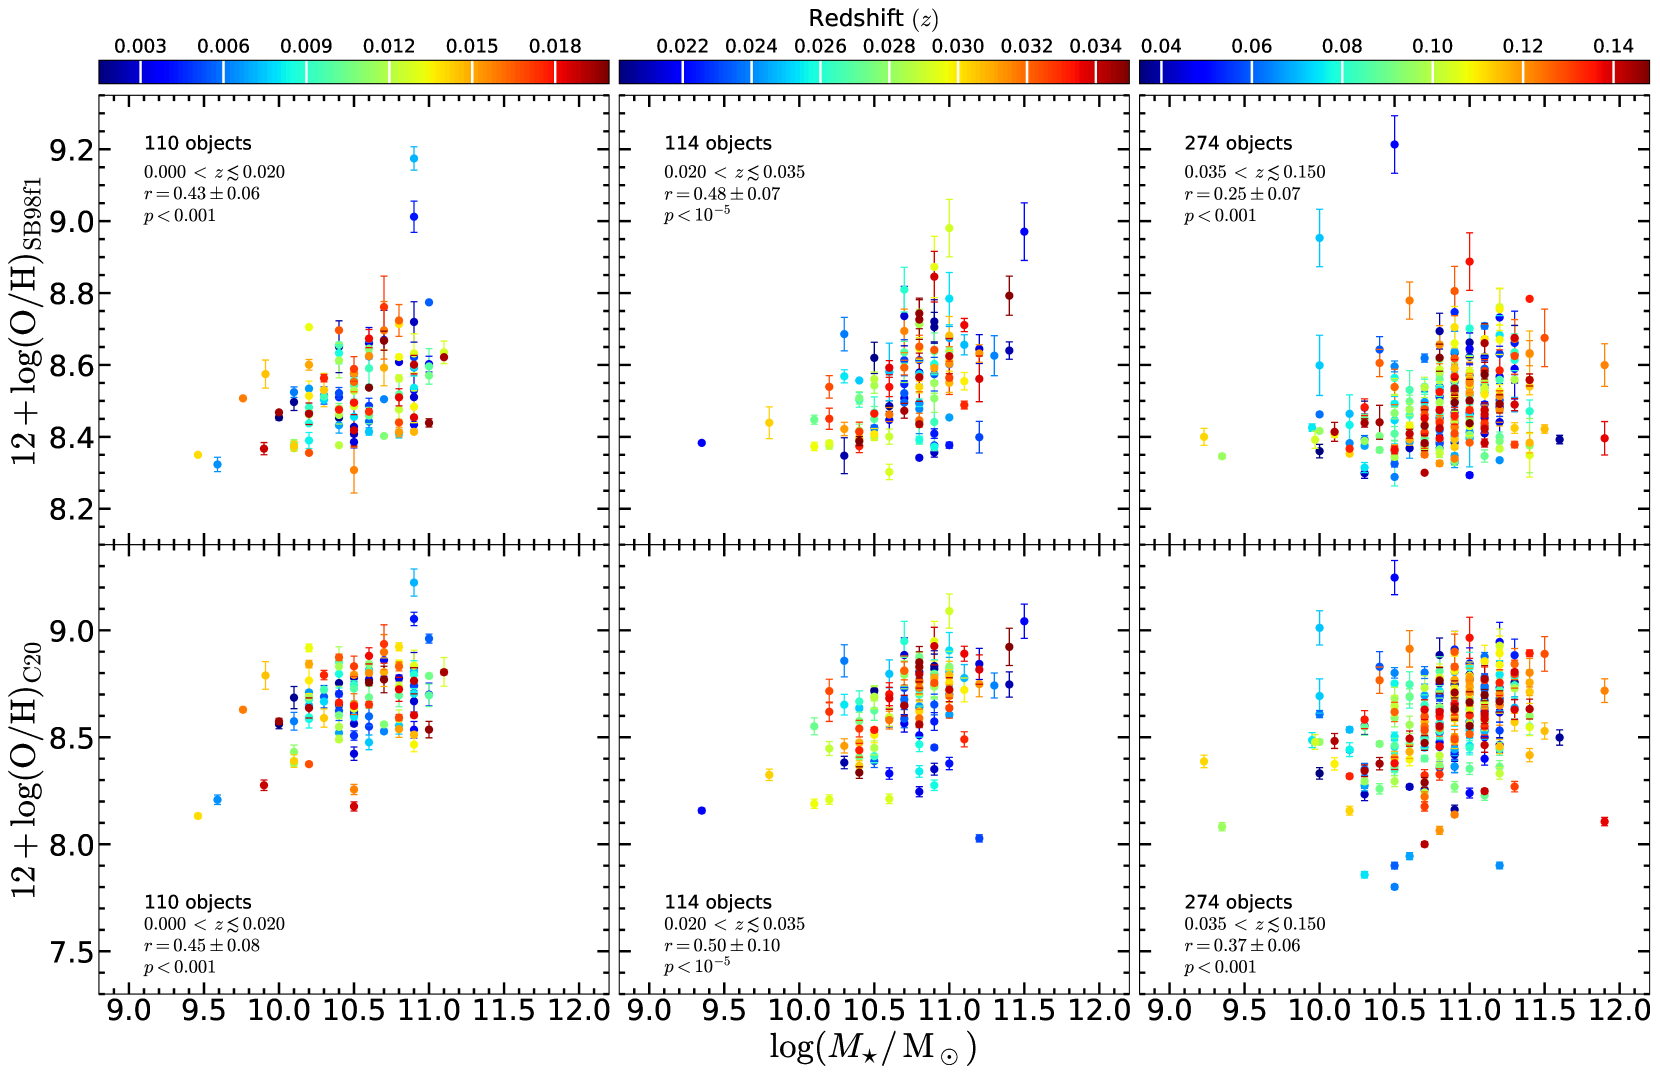
4.4.2 The mass-metallicity relation
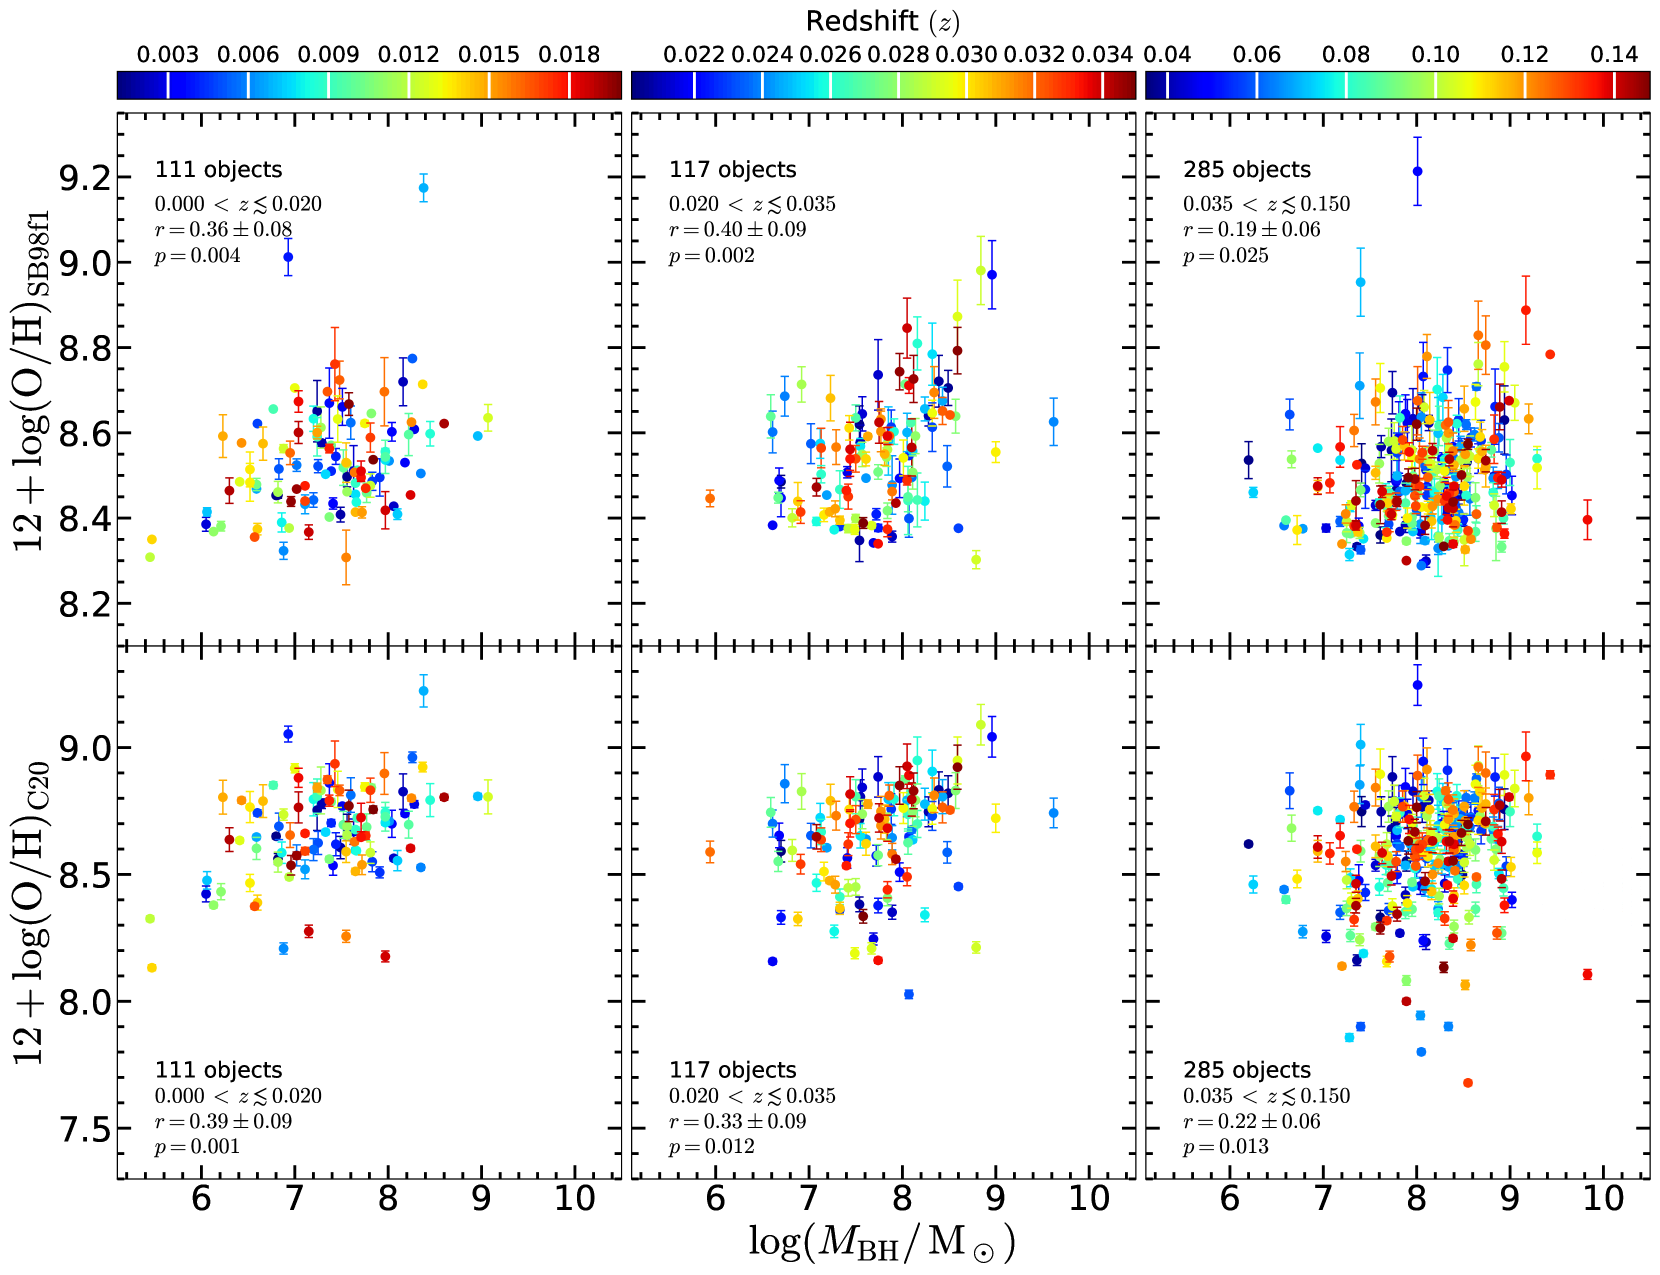
The inflows of metal-poor gas which activate the star formation and dilute the metallicity of the ISM or the outflows of metal-rich gas which stop the star formation are some mechanisms which depend on MZR. In Figs. 9 and 10, we plot the metallicity as a function of the black hole mass and the host stellar mass for individual galaxies in the sample, respectively. The MZR has been shown to be dependent on redshift and various galaxy properties in the NLRs of AGNs (Matsuoka et al., 2018) and other SFs (e.g Kewley & Ellison, 2008; Huang et al., 2019; Curti et al., 2020). It has generally been shown that, at a given stellar mass, lower redshift galaxies have higher gas-phase metallicities than their higher redshift counterparts, while the MZR always shows a positive correlation. In Fig. 9, we investigate the redshift evolution of the MZRs between the metallicities and the black hole mass. We found weak correlations (; , for \textcolorblueSB98f1 and ; for \textcolorblueC20 across the full redshift range ), which is consistent with the findings by Oh et al. (2017), who found a weak correlation of the [O iii]/H line ratio with the SMBH mass. We show the distribution of the NLR metallicities as a function of the stellar masses of the hot galaxies in Fig. 10. We find positive correlations between NLR metallicities and the stellar masses at three different redshifts bins. This implies that the gas-phase metallicities in the NLRs of AGNs are connected to the properties of the hot galaxies.
The MZRs and FMRs have widely been investigated in SFs but such relations have rarely been found in AGNs. However, the origin of the MZRs and FMRs remain active research in astrophysics. Therefore, we further test this hypothesis by comparing the oxygen abundances values computed here with those obtained in star forming galaxies. A direct comparison between findings using samples from the same source might not reveal the actual properties which influence the MZRs, as we have demonstrated above. Therefore, it is important to show a comparison between our results and other findings from the literature. We briefly highlight some of the MZRs from the literature in the following.
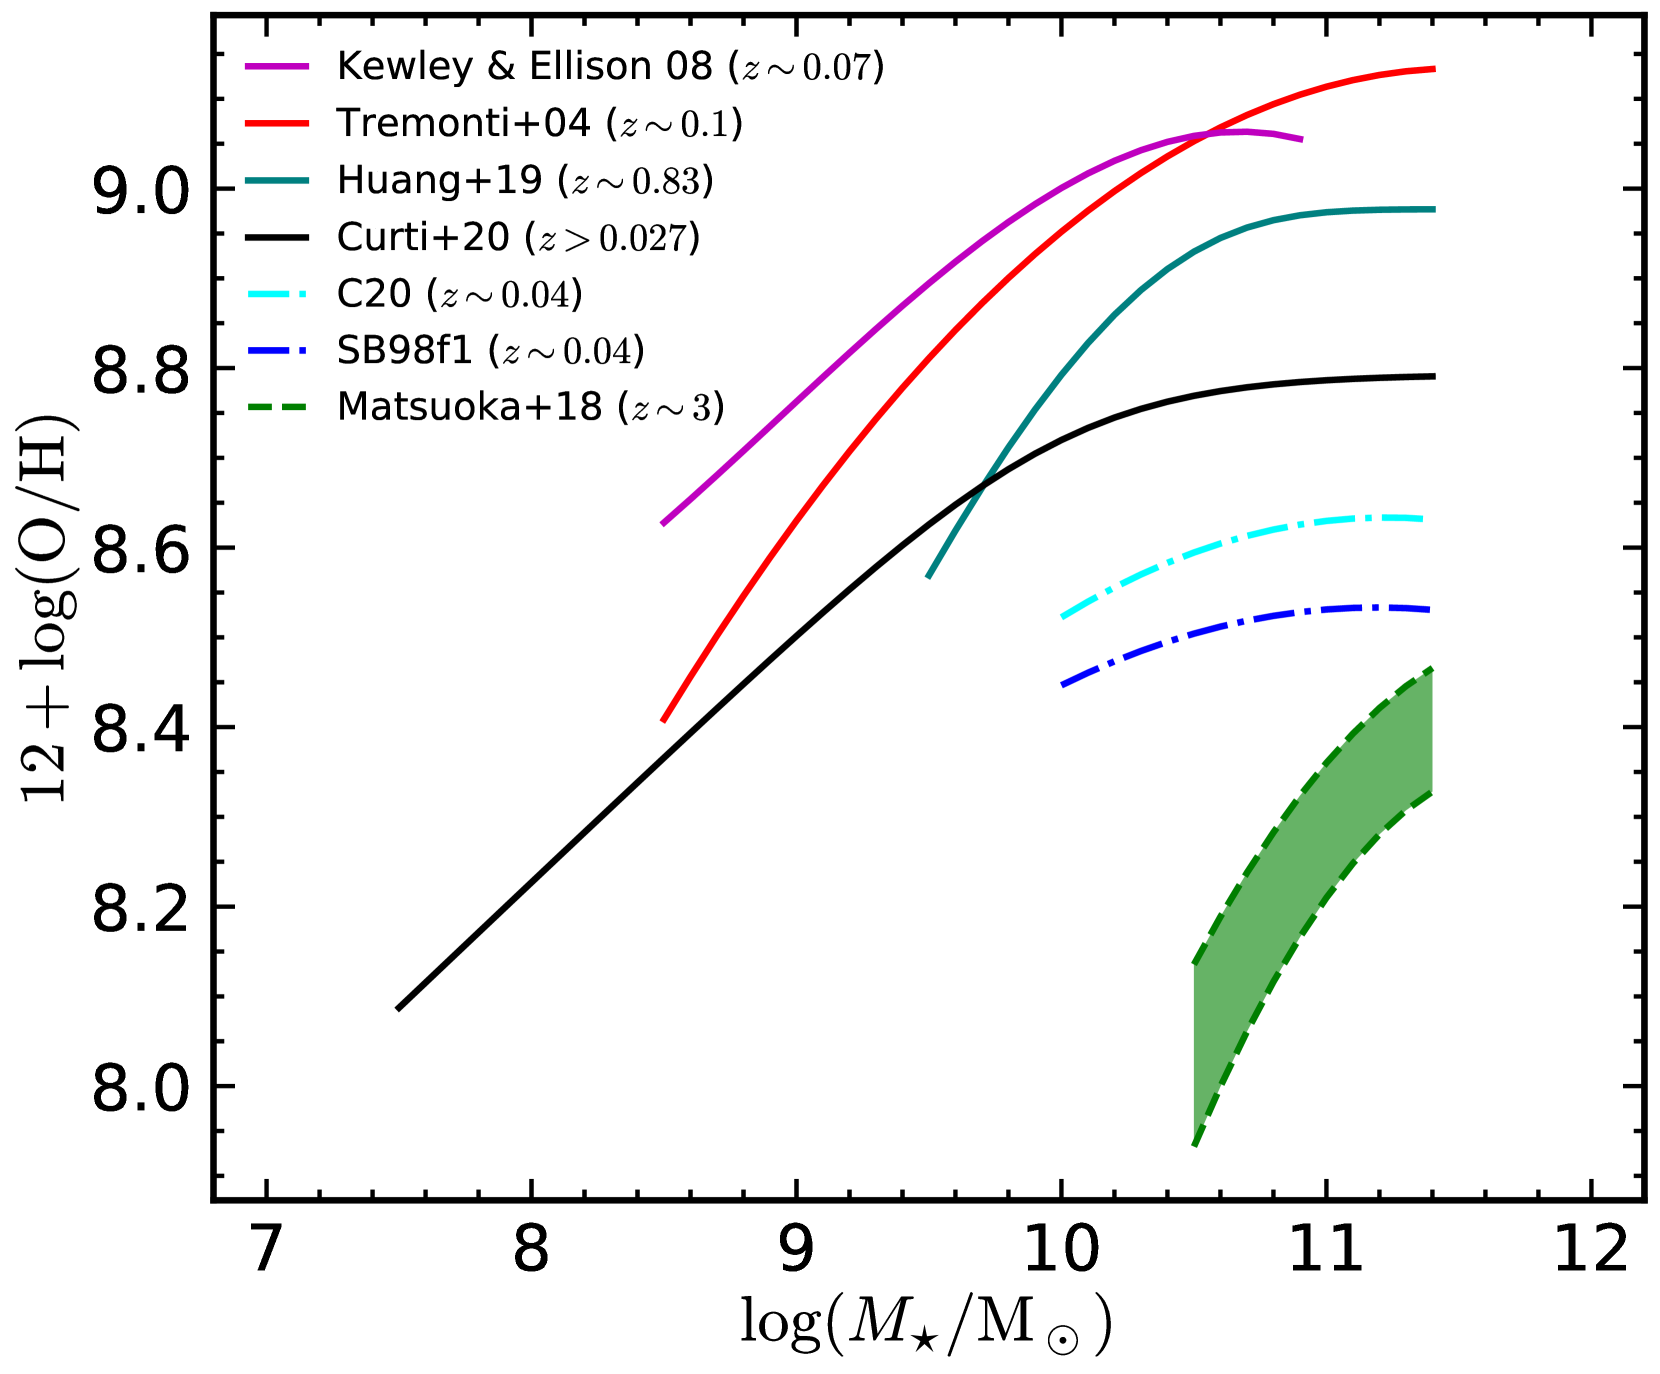
We considered the first MZR by Tremonti et al. (2004), who used SDSS spectroscopic data to demonstrate the MZR with dex scatter at considering stellar masses in the range . We also took into consideration the MZR at derived by Kewley & Ellison (2008) based on the calibration by Kobulnicky & Kewley (2004). Additionally, Matsuoka et al. (2018) found the MZR for type-2 AGNs at , using high- radio galaxies (HzRGs) and X-ray selected radio-quiet AGNs. Furthermore, Huang et al. (2019) used the composite spectra of galaxies from the extended Baryon Oscillation Spectroscopic Survey of the Sloan Digit Sky Survey (SDSS IV/eBOSS) with a median redshift of . They found a redshift evolution of the MZR described by the relation
| (17) |
where , and for the redshift range – with the stellar mass covering the range . Finally, Curti et al. (2020) parametrized the median MZR via the relation:
| (18) |
where is the asymptotic metallicity at high , is the turnover mass below which the MZR reduces to a power law of index and is a measure of how fast the relation reach the asymptotic value.
In Fig. 11, we show the redshift evolution of the MZR in terms of the metallicities and the stellar mass of the host galaxies in this work as well as a comparison with similar MZRs from the literature. The comparison among previous studies of SFs in Fig. 11 show a unique MZR downward evolution trend from (Kewley & Ellison, 2008), Tremonti et al. (2004), Huang et al. (2019), to Curti et al. (2020), which is consistent with the fact that as redshift increases, the MZR shifts downward, indicating that more evolved galaxies tend to be more metal-rich (e.g. Maiolino et al., 2008; Huang et al., 2019). Similarly, a comparison between our result at a median redshift of and the MZR derived by Matsuoka et al. (2018) for AGNs at follow the same downward trend. The X-ray selected AGNs have reveal the redshift evolution of the - relations, which is consistent with the findings by Matsuoka et al. (2018) and other star-forming galaxies (e.g. Huang et al., 2019; Sanders et al., 2021). We note that the origin of the differences between the MZRs is outside the purview of this study. However, we highlight some possible scenarios which could be attributed to the differences in MZRs between SFs and AGNs. Comparing our results with those by Matsuoka et al. (2018, for AGN with 3), we find that the curves from our sample is more flat and that the values are on average dex higher than those estimated from higher redshift sources. We interpret this as the redshift evolution of MZR in AGNs, in the sense that metal-rich gas are usually found in the more evolved galaxies. However, when comparing the mean values obtained from SF galaxies, reported by Tremonti et al. (2004, red line), Kewley & Ellison (2008, magenta line), Huang et al. (2019, teal line) and Curti et al. (2020, black line) in the stellar mass range of our sample (see Fig. 11), it can be seen that our AGN hosts (dashed cyan and blue lines) do present values that are dex lower than SF galaxies (solid lines). We note that different metallicity calibrations, even when based on the same diagnostics, are typically not consistent with one another and usually result in systematic abundance discrepancies from -0.09 up to 0.8 dex (e.g. Kewley & Ellison, 2008; Blanc et al., 2015; Bian et al., 2017; Dors et al., 2020a), which is consistent with the correlation differences between our estimates and the aforementioned previous results obtained from SFs and AGNs. This discrepancy can not, however, be associated with the redshift evolution of the MZR, since the sources studied here are in the lower redshift range (see Fig. 11) with different ionization mechanisms from SFs, thus, it indicates that AGNs and SF galaxies have different chemical evolution paths, suggesting that the abundances of AGN hosts are somehow affected by the central engine.
In fact, the SF around SMBH may be affected in many aspects (as a consequence of the abundances too). For example, while some studies associate the AGN outflows with the suppression of the SF (e.g. Granato et al., 2004; Fabian, 2012; King & Pounds, 2015; Zubovas & Bourne, 2017; Trussler et al., 2020) other studies suggest that these outflows and jets can compress the galactic gas, thus acting as a catalyzer and boosting the SF (e.g. Rees, 1989; Hopkins, 2012; Nayakshin & Zubovas, 2012; Bieri et al., 2016; Zubovas et al., 2013; Zubovas & Bourne, 2017) and even form stars inside the outflow (e.g. Ishibashi & Fabian, 2012; Zubovas et al., 2013; El-Badry et al., 2016; Wang & Loeb, 2018; Gallagher et al., 2019). Using high spatial resolution observations taken with adaptive-optics assisted integral field spectroscopy Riffel et al. (2022, see also references therein) have shown that, once the AGN is triggered, it precludes further SF, in the sense that it can be associated with the lack of new star formation in the inner few hundred of pc of AGN hosts. \textcolorblueN22 studied spatial variation of oxygen abundances on a sample of AGN, and has suggested that the drop in the O/H abundance in the AGN dominated region when compared with the values obtained for the disc region is due to the inflow of less metallic gas towards the central region of the galaxy. All these processes contribute to a chaotic chemical evolution of AGNs.
4.4.3 Metallicity and accretion rate
In order to test for a possible influence of the AGN on the metallicity of the host galaxies, we have compared the metallicities with the Eddington ratio, which is a function of luminosity and , shown in Fig. 12 and since there is a similar distribution on the plane log between Sy 1 and Sy 2 we do not discriminate between them in subsequent analysis. This assertion reiterate the fact that there are no significant variations between the SFRs of type 1 and type 2 AGNs, which is consistent with earlier findings using SFRs derived from infrared indicators (e.g. Zou et al., 2019).
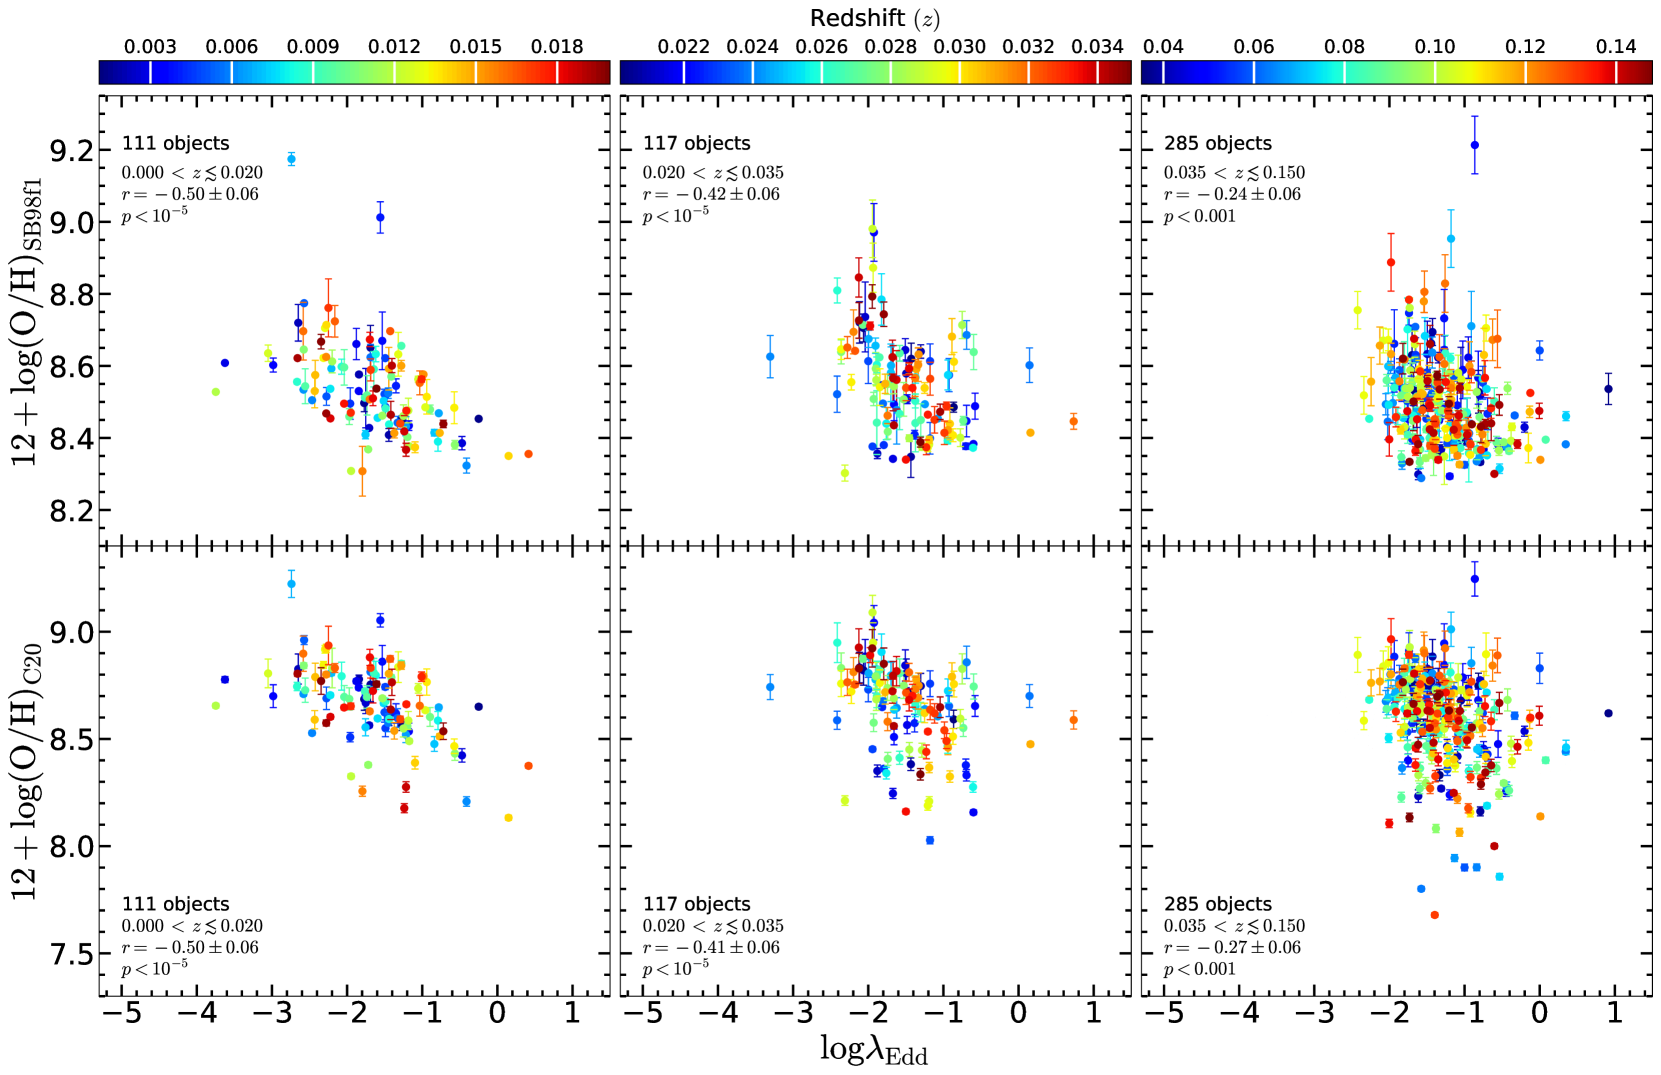
Furthermore, from Fig. 12, it can be seen that there is anti-correlation between the accretion rate and the metallicity, for different redshift bins, with Person correlation coefficients ranging from -0.24 to -0.50 and p-value depending on the redshift range and the adopted calibration. These results are more in agreement with those found by Oh et al. (2017) who compared [N ii]6583/H, which is sensitive to O/H abundances, with for a sub-sample of the local hard X-ray-selected BAT AGNs (297 sources at ) as well as at redshift beyond the local Universe (e.g. 53 sources at ; Oh et al., 2019) and found a clear anti-correlation between those two quantities. Moreover, Matsuoka et al. (2011) used optical spectra of high redshift () quasars and compared different metallicity sensitive emission line ratios with . They obtained mostly positive correlations888It is worth mentioning that depending on the line ratio and the black hole mass bins there is no correlation found in some cases. from the comparison between the metalicity sensitive line ratios and , as can be observed from their Fig. 6. Furthermore, they found that the - trend is as a result of the positive correlations between these same line ratios and the SMBH mass. Also, Shemmer et al. (2004, and references therein) found that in high redshift (2.0 < z < 3.5) quasars there is a positive correlation between luminosity (or SMBH mass) and BLR metallicity sensitive line ratios (N v/C iv).
The correlation of the and/or metallicity sensitive emission line ratios with the , or in Seyferts is in contrast with the results that were obtained based on measurements of UV broad emission lines in quasar. Additionally, the correlation of - relation, is extremely weak (or absent) in Seyferts as compared to quasars. These discrepancies might be due to the fact that Seyferts are moderate-luminous AGNs whereas quasars are the most-luminous AGNs as well as the different methodologies used in the estimation of the , which has a strong dependence on the - relation. It is worthwhile to note that, the is responsible for the AGN fueling while the metal enrichment of the nuclear gas is due to nuclear/circumnuclear star-formation.
Moreover, it is challenging to fairly compare the results obtained from the BLR using high quasars with those found from the NLR of local Universe sources. Even, to compare the NLR gas from local Universe sources with quasar is very difficult, as has been shown by Netzer et al. (2004), the NLR properties in high-luminosity quasars are very different from those observed in nearby AGNs, for example, they may be in a phase of violent star-forming events that release high quantities of metals into the gas. This would naturally explain the differences we observe between our results and those from high redshift objects. In fact, this is fully supported by our finding in Fig. 12, since the "strength" of the anti-correlation (measured by the ) drops when we consider the higher redshift sources (0.035 < z < 0.150), indicating that there is a change in the chemical evolution path of AGNs with redshift.
The anti-correlation observed in Fig. 12, where increases with decreasing metallicity suggest that the chemical evolution of the host galaxy seems to be affected by the AGN activity through suppression of their nuclear SF, and thus stopping the enrichment, or the sources with higher Eddington ratio experiencing an inflow of a lower metallicity gas from the outskirts of the galaxy and/or from the cosmic web. Thus, this metal-poor gas would be diluting the more metal-rich gas in the inner regions and feeding/triggering the AGN. The scatter we observe from the in Fig. 12 (e.g. for a fixed luminosity, there is a range of possible metallicity values), could be explained by the fact that the gas reaching the SMBH is probably originating from mass loss from intermediate-age stellar population (Riffel et al., 2022). In this sense, the outskirts low metallicity gas reaching the AGN, will get an extra supply of gas that has already been processed by stellar nucleo-synthesis, and thus enhancing the . Therefore, the values of oxygen abundances, for a fixed would be the balance between the pristine and the processed gas phases.
From the above, we interpret the anti-correlation found in Fig. 12 as due to the combination of the inflow of pristine gas diluting the metal-rich gas, activating the AGNs, which in turn suppress the nuclear SF, thus stopping the gas enriching process. In this framework, the more luminous sources will have lower metallicities (no SF + pristine gas), while the less luminous would have higher values since they may still have some level of nuclear SF but no (or a small amount of) pristine gas is reaching their SMBHs.
5 Concluding remarks
We derived metallicities via the strong-line calibrations by Storchi-Bergmann et al. (1998) and Carvalho et al. (2020) for a sample of 561 Seyfert nuclei in the local universe () selected from the Swift-BAT 70-month AGN Data Release 2 (DR2) Catalog. These metallicities and the hard X-ray ( keV) luminosities were used to study the - relation for the first time in Seyfert galaxies. We also studied the relation between the metallicities and the AGN properties. The physical properties comparison between Sy 1s and Sy 2s indicate that even in the narrow line regions of both AGN classes, Sy 1 still exhibit higher electron density in comparison to Sy 2. We found that the AGN metallicities are related to the hosts stellar masses following a downward redshift evolution, similar to that of SF galaxies, from lower to higher redshifts, but with lower values of O/H abundances (with a mean difference of 0.2-0.5 dex) in AGN hosts than in SF galaxies. We also found that the metallicities decrease with increasing X-ray luminosities and have significant correlations with at the redshift range (the overall oxygen and nitrogen dependent: r, , dex) and at the full redshift range (oxygen dependent: r, , dex and nitrogen dependent: r, , dex). We argue that, these anti-correlations are driven by the X-ray luminosities, and they change with redshift, indicating that the AGNs are somehow driving the chemical enrichment of their host galaxies, as a result of the inflow of pristine gases that are diluting the metal-rich gases, together with a recent cessations on the star formation.
Acknowledgements
We thank the anonymous referee for insightful comments and suggestions. MA gratefully acknowledges support from Coordenação de Aperfeiçoamento de Pessoal de Nível Superior (CAPES). RR thanks Conselho Nacional de Desenvolvimento Científico e Tecnológico (CNPq, Proj. 311223/2020-6, 304927/2017-1 and 400352/2016-8), Fundação de amparo à pesquisa do Rio Grande do Sul (FAPERGS, Proj. 16/2551-0000251-7 and 19/1750-2), Coordenação de Aperfeiçoamento de Pessoal de Nível Superior (CAPES, Proj. 0001). OLD is grateful to the Fundação de Amparo à Pesquisa do Estado de São Paulo (FAPESP) and to Conselho Nacional de Desenvolvimento Científico e Tecnológico (CNPq) for the financial support. KO acknowledges support from the Korea Astronomy and Space Science Institute under the R&D program (Project No. 2023-1-830-01) supervised by the Ministry of Science and ICT and from the National Research Foundation of Korea (NRF- 2020R1C1C1005462). BT acknowledges support from the European Research Council (ERC) under the European Union’s Horizon 2020 research and innovation program (grant agreement 950533) and from the Israel Science Foundation (grant 1849/19). M.V. acknowledges support from grant "ESTANCIAS POSDOCTORALES POR MÉXICO 2022" by CONACYT. CR acknowledges support from the Fondecyt Iniciacion grant 11190831 and ANID BASAL project FB210003.
6 DATA AVAILABILITY
The data underlying this article will be shared on reasonable request with the corresponding author.
References
- Abazajian et al. (2009) Abazajian K. N., et al., 2009, ApJS, 182, 543
- Agostino et al. (2021) Agostino C. J., et al., 2021, ApJ, 922, 156
- Aguado et al. (2019) Aguado D. S., et al., 2019, ApJS, 240, 23
- Allende Prieto et al. (2001) Allende Prieto C., Lambert D. L., Asplund M., 2001, ApJ, 556, L63
- Ananna et al. (2022) Ananna T. T., et al., 2022, ApJS, 261, 9
- Antonucci (1993) Antonucci R., 1993, ARA&A, 31, 473
- Armah et al. (2021) Armah M., et al., 2021, MNRAS, 508, 371
- Audibert et al. (2017) Audibert A., Riffel R., Sales D. A., Pastoriza M. G., Ruschel-Dutra D., 2017, MNRAS, 464, 2139
- Baldwin et al. (1981) Baldwin J. A., Phillips M. M., Terlevich R., 1981, PASP, 93, 5
- Baldwin et al. (2003a) Baldwin J. A., Ferland G. J., Korista K. T., Hamann F., Dietrich M., 2003a, ApJ, 582, 590
- Baldwin et al. (2003b) Baldwin J. A., Hamann F., Korista K. T., Ferland G. J., Dietrich M., Warner C., 2003b, ApJ, 583, 649
- Baumgartner et al. (2013) Baumgartner W. H., Tueller J., Markwardt C. B., Skinner G. K., Barthelmy S., Mushotzky R. F., Evans P. A., Gehrels N., 2013, ApJS, 207, 19
- Bennert et al. (2006a) Bennert N., Jungwiert B., Komossa S., Haas M., Chini R., 2006a, A&A, 456, 953
- Bennert et al. (2006b) Bennert N., Jungwiert B., Komossa S., Haas M., Chini R., 2006b, A&A, 459, 55
- Bentz et al. (2004) Bentz M. C., Hall P. B., Osmer P. S., 2004, AJ, 128, 561
- Berg et al. (2020) Berg D. A., Pogge R. W., Skillman E. D., Croxall K. V., Moustakas J., Rogers N. S. J., Sun J., 2020, ApJ, 893, 96
- Berney et al. (2015) Berney S., et al., 2015, MNRAS, 454, 3622
- Bian et al. (2017) Bian F., Kewley L. J., Dopita M. A., Blanc G. A., 2017, ApJ, 834, 51
- Bieri et al. (2016) Bieri R., Dubois Y., Silk J., Mamon G. A., Gaibler V., 2016, Monthly Notices of the Royal Astronomical Society, 455, 4166
- Blanc et al. (2015) Blanc G. A., Kewley L., Vogt F. P. A., Dopita M. A., 2015, ApJ, 798, 99
- Boardman et al. (2022) Boardman N., et al., 2022, MNRAS, 514, 2298
- Bowen (1960) Bowen I. S., 1960, ApJ, 132, 1
- Brownson et al. (2020) Brownson S., Belfiore F., Maiolino R., Lin L., Carniani S., 2020, MNRAS, 498, L66
- Cardelli et al. (1989) Cardelli J. A., Clayton G. C., Mathis J. S., 1989, ApJ, 345, 245
- Carvalho et al. (2020) Carvalho S. P., et al., 2020, MNRAS, 492, 5675
- Castro et al. (2017) Castro C. S., Dors O. L., Cardaci M. V., Hägele G. F., 2017, MNRAS, 467, 1507
- Cerqueira-Campos et al. (2021) Cerqueira-Campos F. C., Rodríguez-Ardila A., Riffel R., Marinello M., Prieto A., Dahmer-Hahn L. G., 2021, MNRAS, 500, 2666
- Chen et al. (2019) Chen J., et al., 2019, MNRAS, 489, 855
- Cicone et al. (2014) Cicone C., et al., 2014, A&A, 562, A21
- Cid Fernandes et al. (2010) Cid Fernandes R., Stasińska G., Schlickmann M. S., Mateus A., Vale Asari N., Schoenell W., Sodré L., 2010, MNRAS, 403, 1036
- Clemens et al. (2004) Clemens J. C., Crain J. A., Anderson R., 2004, in Moorwood A. F. M., Iye M., eds, Society of Photo-Optical Instrumentation Engineers (SPIE) Conference Series Vol. 5492, Ground-based Instrumentation for Astronomy. pp 331–340, doi:10.1117/12.550069
- Congiu et al. (2017) Congiu E., et al., 2017, MNRAS, 471, 562
- Curti et al. (2017) Curti M., Cresci G., Mannucci F., Marconi A., Maiolino R., Esposito S., 2017, MNRAS, 465, 1384
- Curti et al. (2020) Curti M., Mannucci F., Cresci G., Maiolino R., 2020, MNRAS, 491, 944
- Davies et al. (2020) Davies R., et al., 2020, MNRAS, 498, 4150
- Davison & Hinkley (1997) Davison A., Hinkley D., 1997, Technical report, Bootstrap Methods and Their Application. Cambridge University Press
- Dempsey & Zakamska (2018) Dempsey R., Zakamska N. L., 2018, MNRAS, 477, 4615
- Denicoló et al. (2002) Denicoló G., Terlevich R., Terlevich E., 2002, MNRAS, 330, 69
- Díaz et al. (2007) Díaz Á. I., Terlevich E., Castellanos M., Hägele G. F., 2007, MNRAS, 382, 251
- Dors (2021) Dors O. L., 2021, MNRAS, 507, 466
- Dors et al. (2008) Dors O. L. J., Storchi-Bergmann T., Riffel R. A., Schimdt A. A., 2008, A&A, 482, 59
- Dors et al. (2014) Dors O. L., Cardaci M. V., Hägele G. F., Krabbe Â. C., 2014, MNRAS, 443, 1291
- Dors et al. (2019) Dors O. L., Monteiro A. F., Cardaci M. V., Hägele G. F., Krabbe A. C., 2019, MNRAS, 486, 5853
- Dors et al. (2020a) Dors O. L., et al., 2020a, MNRAS, 492, 468
- Dors et al. (2020b) Dors O. L., Maiolino R., Cardaci M. V., Hägele G. F., Krabbe A. C., Pérez-Montero E., Armah M., 2020b, MNRAS, 496, 3209
- Dors et al. (2022) Dors O. L., et al., 2022, MNRAS, 514, 5506
- El-Badry et al. (2016) El-Badry K., Wetzel A., Geha M., Hopkins P. F., Kereš D., Chan T. K., Faucher-Giguère C.-A., 2016, The Astrophysical Journal, 820, 131
- Elbaz et al. (2009) Elbaz D., Jahnke K., Pantin E., Le Borgne D., Letawe G., 2009, A&A, 507, 1359
- Fabian (2012) Fabian A. C., 2012, Annual Review of Astronomy and Astrophysics, 50, 455
- Feltre et al. (2016) Feltre A., Charlot S., Gutkin J., 2016, MNRAS, 456, 3354
- Ferland & Netzer (1983) Ferland G. J., Netzer H., 1983, ApJ, 264, 105
- Ferland et al. (2017) Ferland G. J., et al., 2017, Rev. Mex. Astron. Astrofis., 53, 385
- Freitas et al. (2018) Freitas I. C., et al., 2018, MNRAS, 476, 2760
- Gallagher et al. (2019) Gallagher R., Maiolino R., Belfiore F., Drory N., Riffel R., Riffel R. A., 2019, MNRAS, 485, 3409
- Garnica et al. (2022) Garnica K., Negrete C. A., Marziani P., Dultzin D., Śniegowska M., Panda S., 2022, A&A, 667, A105
- Gaskell (1982) Gaskell C. M., 1982, PASP, 94, 891
- Gaskell (1984) Gaskell C. M., 1984, Astrophys. Lett., 24, 43
- Gaskell & Ferland (1984) Gaskell C. M., Ferland G. J., 1984, PASP, 96, 393
- Gehrels et al. (2004) Gehrels N., et al., 2004, ApJ, 611, 1005
- Graham (2016) Graham A. W., 2016, in Laurikainen E., Peletier R., Gadotti D., eds, Astrophysics and Space Science Library Vol. 418, Galactic Bulges. p. 263 (arXiv:1501.02937), doi:10.1007/978-3-319-19378-6_11
- Granato et al. (2004) Granato G. L., De Zotti G., Silva L., Bressan A., Danese L., 2004, The Astrophysical Journal, 600, 580
- Hägele et al. (2008) Hägele G. F., Díaz Á. I., Terlevich E., Terlevich R., Pérez-Montero E., Cardaci M. V., 2008, MNRAS, 383, 209
- Halpern (1982) Halpern J. P., 1982, PhD thesis, Harvard University, Cambridge, MA.
- Halpern & Steiner (1983) Halpern J. P., Steiner J. E., 1983, ApJ, 269, L37
- Hamann & Ferland (1993) Hamann F., Ferland G., 1993, ApJ, 418, 11
- Heckman et al. (1981) Heckman T. M., Miley G. K., van Breugel W. J. M., Butcher H. R., 1981, ApJ, 247, 403
- Ho (2008) Ho L. C., 2008, ARA&A, 46, 475
- Hopkins (2012) Hopkins P. F., 2012, Monthly Notices of the RAS, 420, L8
- Hopkins & Elvis (2010) Hopkins P. F., Elvis M., 2010, MNRAS, 401, 7
- Horne et al. (2021) Horne K., et al., 2021, ApJ, 907, 76
- Huang et al. (2019) Huang C., et al., 2019, ApJ, 886, 31
- Ishibashi & Fabian (2012) Ishibashi W., Fabian A. C., 2012, Monthly Notices of the Royal Astronomical Society, 427, 2998
- Jensen et al. (1976) Jensen E. B., Strom K. M., Strom S. E., 1976, ApJ, 209, 748
- Ji et al. (2020) Ji X., Yan R., Riffel R., Drory N., Zhang K., 2020, MNRAS, 496, 1262
- Jiang et al. (2019) Jiang T., Malhotra S., Rhoads J. E., Yang H., 2019, ApJ, 872, 145
- Kakkad et al. (2018) Kakkad D., et al., 2018, A&A, 618, A6
- Kakkad et al. (2022) Kakkad D., et al., 2022, MNRAS, 511, 2105
- Kaspi et al. (2000) Kaspi S., Smith P. S., Netzer H., Maoz D., Jannuzi B. T., Giveon U., 2000, ApJ, 533, 631
- Kawamuro et al. (2021) Kawamuro T., Ricci C., Izumi T., Imanishi M., Baba S., Nguyen D. D., Onishi K., 2021, ApJS, 257, 64
- Kennicutt et al. (2003) Kennicutt Robert C. J., Bresolin F., Garnett D. R., 2003, ApJ, 591, 801
- Kewley & Ellison (2008) Kewley L. J., Ellison S. L., 2008, ApJ, 681, 1183
- Kewley et al. (2001) Kewley L. J., Dopita M. A., Sutherland R. S., Heisler C. A., Trevena J., 2001, ApJ, 556, 121
- Kewley et al. (2005) Kewley L. J., Jansen R. A., Geller M. J., 2005, PASP, 117, 227
- Kewley et al. (2006) Kewley L. J., Groves B., Kauffmann G., Heckman T., 2006, MNRAS, 372, 961
- King & Pounds (2015) King A., Pounds K., 2015, Annual Review of Astronomy and Astrophysics, 53, 115
- Kobulnicky & Kewley (2004) Kobulnicky H. A., Kewley L. J., 2004, ApJ, 617, 240
- Kormendy & Ho (2013) Kormendy J., Ho L. C., 2013, ARA&A, 51, 511
- Koss et al. (2016) Koss M. J., et al., 2016, ApJ, 825, 85
- Koss et al. (2017) Koss M., et al., 2017, ApJ, 850, 74
- Koss et al. (2021) Koss M. J., et al., 2021, ApJS, 252, 29
- Koss et al. (2022a) Koss M. J., et al., 2022a, ApJS, 261, 2
- Koss et al. (2022b) Koss M. J., et al., 2022b, ApJS, 261, 6
- Kraemer et al. (1994) Kraemer S. B., Wu C.-C., Crenshaw D. M., Harrington J. P., 1994, ApJ, 435, 171
- Lamperti et al. (2017) Lamperti I., et al., 2017, MNRAS, 467, 540
- Landt et al. (2019) Landt H., et al., 2019, MNRAS, 489, 1572
- Lilly et al. (2013) Lilly S. J., Carollo C. M., Pipino A., Renzini A., Peng Y., 2013, ApJ, 772, 119
- Liu et al. (2020) Liu T., et al., 2020, ApJ, 896, 122
- Lopez-Sanchez & Esteban (2010) Lopez-Sanchez A. R., Esteban C., 2010, arXiv e-prints, p. arXiv:1004.5251
- Lu et al. (2019) Lu K.-X., Zhao Y., Bai J.-M., Fan X.-L., 2019, MNRAS, 483, 1722
- Luridiana et al. (2015) Luridiana V., Morisset C., Shaw R. A., 2015, A&A, 573, A42
- Maiolino et al. (2008) Maiolino R., et al., 2008, A&A, 488, 463
- Maiolino et al. (2017) Maiolino R., et al., 2017, Nature, 544, 202
- Marino et al. (2013) Marino R. A., et al., 2013, A&A, 559, A114
- Matsuoka et al. (2009) Matsuoka K., Nagao T., Maiolino R., Marconi A., Taniguchi Y., 2009, A&A, 503, 721
- Matsuoka et al. (2011) Matsuoka K., Nagao T., Marconi A., Maiolino R., Taniguchi Y., 2011, A&A, 527, A100
- Matsuoka et al. (2018) Matsuoka K., Nagao T., Marconi A., Maiolino R., Mannucci F., Cresci G., Terao K., Ikeda H., 2018, A&A, 616, L4
- Mejía-Restrepo et al. (2016) Mejía-Restrepo J. E., Trakhtenbrot B., Lira P., Netzer H., Capellupo D. M., 2016, MNRAS, 460, 187
- Mingozzi et al. (2019) Mingozzi M., et al., 2019, A&A, 622, A146
- Monteiro & Dors (2021) Monteiro A. F., Dors O. L., 2021, MNRAS, 508, 3023
- Moore (1945) Moore C. E., 1945, Contributions from the Princeton University Observatory, 20, 1
- Nagao et al. (2006) Nagao T., Maiolino R., Marconi A., 2006, A&A, 447, 863
- Nayakshin & Zubovas (2012) Nayakshin S., Zubovas K., 2012, Monthly Notices of the Royal Astronomical Society, 427, 372
- Netzer et al. (2004) Netzer H., Shemmer O., Maiolino R., Oliva E., Croom S., Corbett E., di Fabrizio L., 2004, ApJ, 614, 558
- Nicholls et al. (2020) Nicholls D. C., Kewley L. J., Sutherland R. S., 2020, PASP, 132, 033001
- Oh et al. (2017) Oh K., et al., 2017, MNRAS, 464, 1466
- Oh et al. (2019) Oh K., Ueda Y., Akiyama M., Suh H., Koss M. J., Kashino D., Hasinger G., 2019, ApJ, 880, 112
- Oh et al. (2022) Oh K., et al., 2022, ApJS, 261, 4
- Oke et al. (1995) Oke J. B., et al., 1995, PASP, 107, 375
- Osterbrock (1981) Osterbrock D. E., 1981, ApJ, 249, 462
- Osterbrock (1989) Osterbrock D. E., 1989, Astrophysics of gaseous nebulae and active galactic nuclei. UNIVERSITY SCIENCE BOOKS
- Osterbrock & Ferland (2006) Osterbrock D. E., Ferland G. J., 2006, Astrophysics of gaseous nebulae and active galactic nuclei. UNIVERSITY SCIENCE BOOKS
- Owen (2007) Owen A. B., 2007, Contemporary Mathematics, 443, 59
- Pagel et al. (1979) Pagel B. E. J., Edmunds M. G., Blackwell D. E., Chun M. S., Smith G., 1979, MNRAS, 189, 95
- Peimbert et al. (2017) Peimbert M., Peimbert A., Delgado-Inglada G., 2017, PASP, 129, 082001
- Pérez-Montero (2017) Pérez-Montero E., 2017, PASP, 129, 043001
- Peterson et al. (2013) Peterson B. M., et al., 2013, ApJ, 779, 109
- Pilyugin (2003) Pilyugin L. S., 2003, A&A, 399, 1003
- Pilyugin & Grebel (2016) Pilyugin L. S., Grebel E. K., 2016, MNRAS, 457, 3678
- Pistis et al. (2022) Pistis F., et al., 2022, A&A, 663, A162
- Rees (1989) Rees M. J., 1989, Monthly Notices of the Royal Astronomical Society, 239, 1P
- Revalski et al. (2018) Revalski M., Crenshaw D. M., Kraemer 2018, ApJ, 856, 46
- Ricci et al. (2015) Ricci C., Ueda Y., Koss M. J., Trakhtenbrot B., Bauer F. E., Gandhi P., 2015, ApJ, 815, L13
- Ricci et al. (2017a) Ricci C., et al., 2017a, ApJS, 233, 17
- Ricci et al. (2017b) Ricci C., et al., 2017b, Nature, 549, 488
- Ricci et al. (2018) Ricci C., et al., 2018, MNRAS, 480, 1819
- Ricci et al. (2022) Ricci C., et al., 2022, ApJ, 938, 67
- Riffel et al. (2021) Riffel R., et al., 2021, MNRAS, 501, 4064
- Riffel et al. (2022) Riffel R., et al., 2022, MNRAS, 512, 3906
- Rojas et al. (2020) Rojas A. F., et al., 2020, MNRAS, 491, 5867
- Salomé et al. (2017) Salomé Q., Salomé P., Miville-Deschênes M. A., Combes F., Hamer S., 2017, A&A, 608, A98
- Sanders et al. (2016) Sanders R. L., et al., 2016, ApJ, 816, 23
- Sanders et al. (2021) Sanders R. L., et al., 2021, ApJ, 914, 19
- Schawinski et al. (2007) Schawinski K., Thomas D., Sarzi M., Maraston C., Kaviraj S., Joo S.-J., Yi S. K., Silk J., 2007, MNRAS, 382, 1415
- Schnorr-Müller et al. (2016) Schnorr-Müller A., et al., 2016, MNRAS, 462, 3570
- Sergeev et al. (2017) Sergeev S. G., Nazarov S. V., Borman G. A., 2017, MNRAS, 465, 1898
- Shemmer et al. (2004) Shemmer O., Netzer H., Maiolino R., Oliva E., Croom S., Corbett E., di Fabrizio L., 2004, ApJ, 614, 547
- Shimizu et al. (2019) Shimizu T. T., et al., 2019, MNRAS, 490, 5860
- Silk (2013) Silk J., 2013, ApJ, 772, 112
- Smith et al. (2020) Smith K. L., Koss M., Mushotzky R., Wong O. I., Shimizu T. T., Ricci C., Ricci F., 2020, ApJ, 904, 83
- Somerville & Davé (2015) Somerville R. S., Davé R., 2015, ARA&A, 53, 51
- Springel et al. (2005) Springel V., Di Matteo T., Hernquist L., 2005, MNRAS, 361, 776
- Stanley et al. (2015) Stanley F., Harrison C. M., Alexander D. M., Swinbank A. M., Aird J. A., Del Moro A., Hickox R. C., Mullaney J. R., 2015, MNRAS, 453, 591
- Storchi-Bergmann et al. (1994) Storchi-Bergmann T., Calzetti D., Kinney A. L., 1994, ApJ, 429, 572
- Storchi-Bergmann et al. (1998) Storchi-Bergmann T., Schmitt H. R., Calzetti D., Kinney A. L., 1998, AJ, 115, 909
- Suganuma et al. (2006) Suganuma M., et al., 2006, ApJ, 639, 46
- Suh et al. (2019) Suh H., et al., 2019, ApJ, 872, 168
- Sun et al. (2018) Sun A.-L., et al., 2018, MNRAS, 480, 2302
- Tang et al. (2019) Tang J.-J., et al., 2019, MNRAS, 484, 2575
- Temple et al. (2021) Temple M. J., Ferland G. J., Rankine A. L., Chatzikos M., Hewett P. C., 2021, MNRAS, 505, 3247
- Thomas et al. (2019) Thomas A. D., Kewley L. J., Dopita M. A., Groves B. A., Hopkins A. M., Sutherland R. S., 2019, ApJ, 874, 100
- Toribio San Cipriano et al. (2017) Toribio San Cipriano L., Domínguez-Guzmán G., Esteban C., García-Rojas J., Mesa-Delgado A., Bresolin F., Rodríguez M., Simón-Díaz S., 2017, MNRAS, 467, 3759
- Trakhtenbrot et al. (2017) Trakhtenbrot B., et al., 2017, MNRAS, 470, 800
- Tremonti et al. (2004) Tremonti C. A., et al., 2004, ApJ, 613, 898
- Trussler et al. (2020) Trussler J., Maiolino R., Maraston C., Peng Y., Thomas D., Goddard D., Lian J., 2020, Monthly Notices of the Royal Astronomical Society, 491, 5406
- Vaona et al. (2012) Vaona L., Ciroi S., Di Mille F., Cracco V., La Mura G., Rafanelli P., 2012, MNRAS, 427, 1266
- Veilleux & Osterbrock (1987) Veilleux S., Osterbrock D. E., 1987, ApJS, 63, 295
- Vernet et al. (2011) Vernet J., et al., 2011, A&A, 536, A105
- Wada et al. (2018) Wada K., Yonekura K., Nagao T., 2018, ApJ, 867, 49
- Wang & Loeb (2018) Wang X., Loeb A., 2018, New Astronomy, 61, 95
- Wang et al. (2010) Wang J.-M., Yan C.-S., Gao H.-Q., Hu C., Li Y.-R., Zhang S., 2010, ApJ, 719, L148
- Wysota & Gaskell (1988) Wysota A., Gaskell C. M., 1988, in Miller H. R., Wiita P. J., eds, , Vol. 307, Active Galactic Nuclei. pp 79–82, doi:10.1007/3-540-19492-4_171
- Xu et al. (2018) Xu F., Bian F., Shen Y., Zuo W., Fan X., Zhu Z., 2018, MNRAS, 480, 345
- York et al. (2000) York D. G., et al., 2000, AJ, 120, 1579
- Zhang & Feng (2016) Zhang X.-G., Feng L.-L., 2016, MNRAS, 457, L64
- Zou et al. (2019) Zou F., Yang G., Brandt W. N., Xue Y., 2019, ApJ, 878, 11
- Zubovas & Bourne (2017) Zubovas K., Bourne M. A., 2017, Monthly Notices of the RAS, 468, 4956
- Zubovas et al. (2013) Zubovas K., Nayakshin S., King A., Wilkinson M., 2013, Monthly Notices of the Royal Astronomical Society, 433, 3079
- do Nascimento et al. (2022) do Nascimento J. C., et al., 2022, MNRAS, 513, 807
- van Zee et al. (1998) van Zee L., Salzer J. J., Haynes M. P., O’Donoghue A. A., Balonek T. J., 1998, AJ, 116, 2805