[a]L. Mohrmann
Revisiting HESS J1809193 — a very-high-energy gamma-ray source in a fascinating environment
Abstract
HESS J1809193 is one of the unidentified very-high-energy gamma-ray sources in the H.E.S.S. Galactic Plane Survey (HGPS). It is located in a rich environment, with an energetic pulsar and associated X-ray pulsar wind nebula, several supernova remnants, and molecular clouds in the vicinity. Furthermore, HESS J1809193 was recently detected at energies above 56 TeV with HAWC, which makes it a PeVatron candidate, that is, a source capable of accelerating cosmic rays up to PeV energies.
We present a new analysis of the TeV gamma-ray emission of HESS J1809193 with H.E.S.S., based on improved analysis techniques. We find that the emission is best described by two components with distinct morphologies and energy spectra. We complement this study with an analysis of Fermi-LAT data in the same region. Finally, taking into account further multi-wavelength data, we interpret our results both in a hadronic and leptonic framework.
1 Introduction
HESS J1809193 is an unassociated very-high-energy (VHE; ) -ray source that was discovered in 2007 [1] as part of the H.E.S.S. Galactic Plane Survey (HGPS; [2]). It is located close to the energetic pulsar PSR J18091917 (spin-down power , characteristic age [3], distance [4]), which powers an X-ray pulsar wind nebula (PWN; see e.g. [5]). Initially, HESS J1809193 was interpreted as being connected to this PWN, that is, due to inverse Compton (IC) emission from high-energy electrons accelerated in the pulsar wind (the “leptonic scenario”; [1]). However, the region also harbours several supernova remnants (e.g. G011.000.0, at a distance of [6], which has been proposed as the progenitor SNR of PSR J18091917 [7], although the association is not firm) as well as dense molecular clouds [6, 7]. This has motivated an interpretation of HESS J1809193 in a “hadronic scenario”, in which the -ray emission is due to the interaction of cosmic-ray nuclei – accelerated at the SNR shock front – with gas in the molecular clouds [6, 8]. Recently, the HAWC experiment has detected -ray emission from HESS J1809193 up to energies of [9]. Here, we present a summary of a new H.E.S.S. analysis of HESS J1809193, which is complemented by a Fermi-LAT analysis of the same region. For further details, we refer to the full publication about this study, which is currently under journal review [10].
2 Data analysis
H.E.S.S. is an array of Cherenkov telescopes sensitive to rays in the – energy range, located in Namibia [11]. Here, we used of data taken on HESS J1809193 with the four diameter telescopes. For the high-level analysis, we have employed the Gammapy package (v0.17; [12, 13]) and carried out a spectro-morphological likelihood analysis that uses as input a background model constructed from archival H.E.S.S. observations (see [14] for details). The energy threshold of the combined data set is .
Fermi-LAT is a pair conversion detector onboard the Fermi satellite, sensitive to rays between and [15]. For the Fermi-LAT analysis, we have used of data and employed the Fermitools111https://fermi.gsfc.nasa.gov/ssc/data/analysis/software (v2.2.0) and Fermipy222https://fermipy.readthedocs.io (v1.1.5) packages. We analysed events passing the P8R3_SOURCE event selection (event class 128, event type 3), using a binned analysis.
3 Results
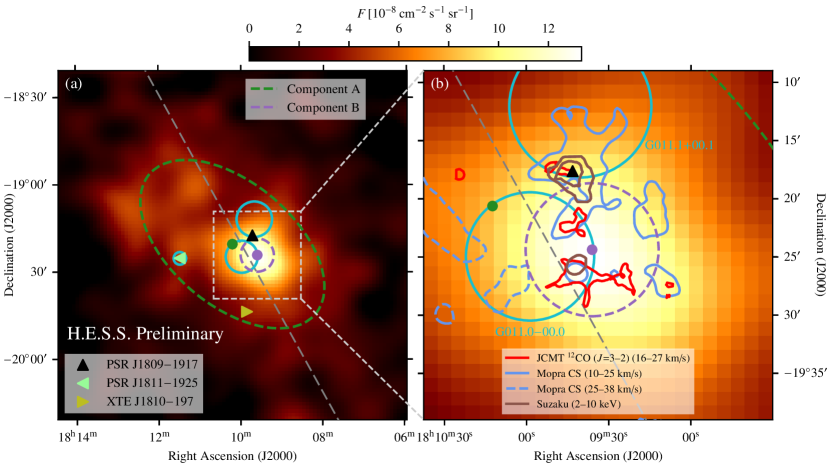
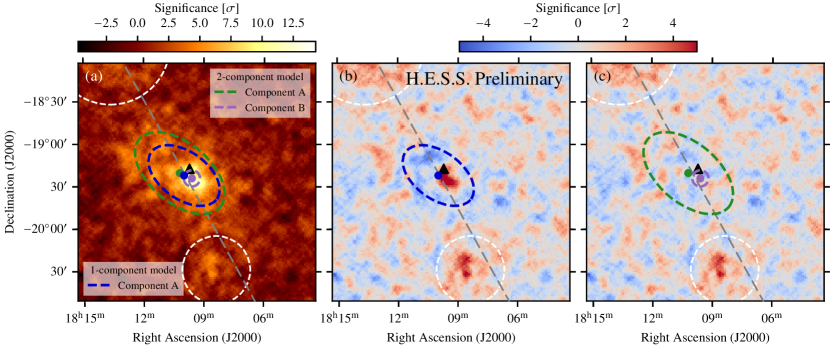
In Fig. 1 we show flux maps of the HESS J1809193 region. The source is extended on a scale of about , and shows a bright peak of emission close to its centre. The significance maps in Fig. 2 illustrate our modelling of HESS J1809193. First, we have attempted to model the source with a single component that uses an elongated Gaussian as the spatial model. However, as is evident from Fig. 2(b), the model is not capable of describing the extended emission and the bright peak simultaneously. We therefore adopted a 2-component model, in which a second component is added to describe the compact bright peak (using a symmetric Gaussian as the spatial model). Fig. 2(c) shows that this model yields a satisfactory description of the data (statistically, it is preferred by over the 1-component model). We refer to the two components as component A and B, respectively. Component A has a 1- major-axis extent of and an eccentricity of , whereas for component B .
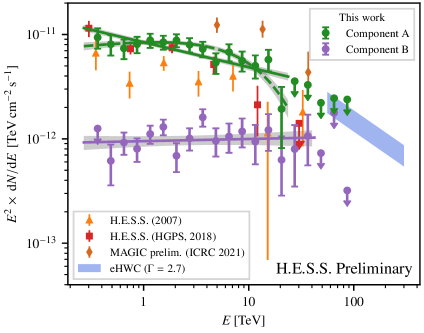
The energy spectra of the two components – which are modelled simultaneously – are shown in Fig. 3. When fitting power-law (PL) models, , to both components, we obtained spectral indices of and for component A and B, respectively. However, the upper limits at high energies for component A indicate that the spectrum may cut off before reaching . Indeed, a power law with exponential cut-off (ECPL), , is preferred (by ) for this component, in which case we obtained a spectral index and a cut-off energy of . For component B, an ECPL model is not significantly preferred over the PL model.
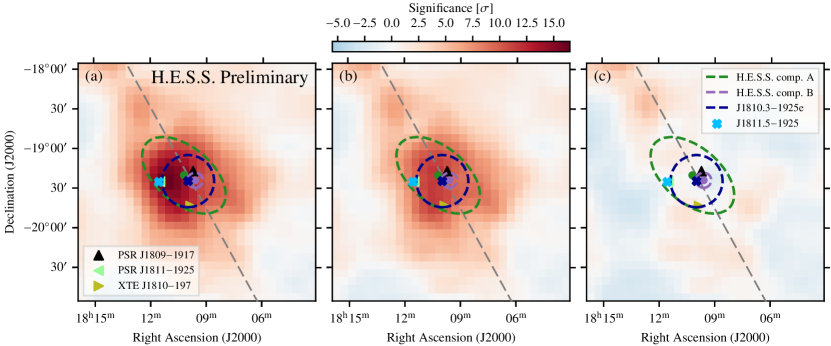
In Fig. 4, we illustrate the results of the Fermi-LAT analysis. Similarly to the case of H.E.S.S., extended emission around PSR J18091917 is visible, although no bright peak that would correspond to component B of HESS J1809193 can be identified. Following the Fermi-LAT 4FGL-DR2 catalogue [17, 18], we modelled the emission with two sources: J1811.51925, which is modelled as a point source and connected to the nearby pulsar PSR J18111925 (i.e. unrelated to HESS J1809193), and J1810.31925e, which is modelled as an extended source. The energy spectrum of J1810.31925e, exhibiting a spectral index of , is displayed in Fig. 5.
4 Discussion
The similarity of the spatial models of component A of HESS J1809193 and the Fermi-LAT source J1810.31925e (cf. Fig. 4) suggests a connection between these two components. However, the energy spectrum of J1810.31925e below is considerably steeper than that of component A, implying the need of a spectral break at around if both are connected. On the other hand, the spectrum of J1810.31925e could be connected to that of component B more smoothly (although a break would still be required), but in this case its spatial extent would greatly exceed that of its counterpart. This illustrates that a joint modelling of the emission detected with H.E.S.S. and Fermi-LAT is very challenging. We focus here on modelling the H.E.S.S. components.
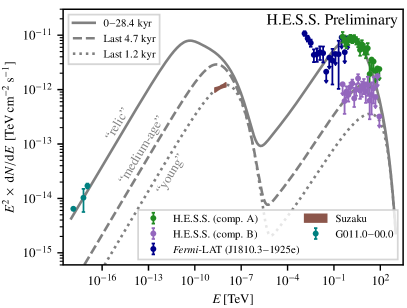
First, we have modelled the entire emission of HESS J1809193 in a leptonic (PWN) scenario.
We performed a time-dependent modelling that takes into account the pulsar braking, employing the GAMERA library [19].
Two describe both H.E.S.S. components and the X-ray nebula (which is offset from the peak in -ray emission, cf. Fig. 1), we invoked three “generations” of electrons:
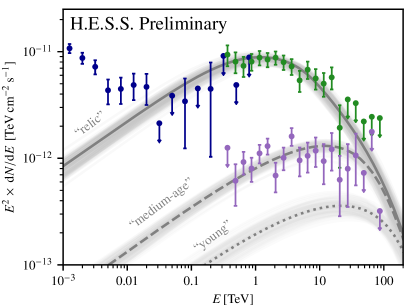
(i) “relic” electrons, associated with component A and injected over the system life time ();
(ii) “medium-age” electrons, associated with component B and injected within the last ;
(iii) “young” electrons, associated with the X-ray nebula and injected within the last .
The results of the model are displayed in Fig. 5.
From the approximate age of the system and the measured extent of component A, it is possible to derive a diffusion coefficient for the “relic” electrons.
We obtained , which is of the same order as the coefficient measured in the vicinity of the Geminga PWN [20].
In such a scenario, one would furthermore expect a cut-off in the energy spectrum of component A, as the highest-energy electrons should have cooled due to IC scattering by now.
This is consistent with the measured cut-off for this component at .
In summary, the PWN model shows that the -ray emission of HESS J1809193 can be modelled in a PWN scenario, and that in particular component A of HESS J1809193 can be well described as a halo of old electrons that surround the compact PWN.
The presence of SNRs and molecular clouds in the region motivates to also consider a hadronic scenario in which (part of) the emission is due to cosmic-ray nuclei accelerated by the SNRs and interacting with gas in the clouds. We focus here in particular on component B of HESS J1809193, which coincides in position with the edge of G011.000.0 and several of the dense molecular clouds (cf. Fig. 1). Using the Naima package [22], we have fitted a proton-proton model to component B, obtaining a required energy in primary protons of . Considering that gas densities are expected in the clouds [6], this presents a viable alternative interpretation.
5 Conclusion
We have presented a new H.E.S.S. analysis of the unassociated -ray source HESS J1809193. For the first time, we were able to resolve the emission into two components that exhibit distinct spectra and morphologies. Our Fermi-LAT analysis has confirmed the presence of extended emission also in the GeV energy range, which is however challenging to associate with either of the components of HESS J1809193. The extended component A of HESS J1809193 is compatible with a halo of old electrons around the compact PWN. The compact component B could plausibly be of either leptonic or hadronic origin.
References
- [1] F. Aharonian et al. (H.E.S.S. Collaboration), A&A 472 (2007) 489 [0705.1605].
- [2] H. Abdalla et al. (H.E.S.S. Collaboration), A&A 612 (2018) A1 [1804.02432].
- [3] R.N. Manchester et al., AJ 129 (2005) 1993 [astro-ph/0412641].
- [4] A. Parthasarathy et al., MNRAS 489 (2019) 3810 [1908.11709].
- [5] T. Anada et al., PASJ 62 (2010) 179 [0912.1931].
- [6] G. Castelletti et al., A&A 587 (2016) A71 [1601.04962].
- [7] F. Voisin et al., PASA 36 (2019) e014 [1905.04517].
- [8] M. Araya, ApJ 859 (2018) 69 [1804.03325].
- [9] A.U. Abeysekara et al. (HAWC Collaboration), PRL 124 (2020) 021102 [1909.08609].
-
[10]
F. Aharonian et al. (H.E.S.S. Collaboration), HESS J1809193: a halo of escaped
electrons
around a pulsar wind nebula?, submitted (2022) . - [11] F. Aharonian et al. (H.E.S.S. Collaboration), A&A 457 (2006) 899 [astro-ph/0607333].
- [12] C. Deil et al., in Proc. 35th ICRC, vol. 301, p. 766, 2017, DOI [1709.01751].
- [13] C. Deil et al., Gammapy: v0.17, Zenodo (2020) .
- [14] L. Mohrmann et al., A&A 632 (2019) A72 [1910.08088].
- [15] W.B. Atwood et al., ApJ 697 (2009) 1071 [0902.1089].
- [16] D. Zarić et al., in Proc. 37th Int. Cosmic Ray Conf. (ICRC2021), vol. 395, p. 818, 2021, DOI.
- [17] S. Abdollahi et al. (Fermi-LAT Collaboration), ApJS 247 (2020) 33 [1902.10045].
- [18] J. Ballet et al., ArXiv e-prints (2020) [2005.11208].
- [19] J. Hahn, in Proc. 34th Int. Cosmic Ray Conf. (ICRC2015), vol. 236, p. 917, 2016, DOI.
- [20] A.U. Abeysekara et al. (HAWC Collaboration), Science 358 (2017) 911 [1711.06223].
- [21] C.L. Brogan et al., ApJ 639 (2006) L25 [astro-ph/0601451].
- [22] V. Zabalza, in Proc. 34th Int. Cosmic Ray Conf. (ICRC2015), vol. 236, p. 922, 2016, DOI.