The Chance of Winning Election Impacts on Social Media Strategy
Abstract
Social media has been a paramount arena for election campaigns for political actors. While many studies have been paying attention to the political campaigns related to partisanship, politicians also can conduct different campaigns according to their chances of winning. Leading candidates, for example, do not behave the same as fringe candidates in their elections, and vice versa. We, however, know little about this difference in social media political campaign strategies according to their odds in elections. We tackle this problem by analyzing candidates’ tweets in terms of users, topics, and sentiment of replies. Our study finds that, as their chances of winning increase, candidates narrow the targets they communicate with, from people in general to the electoral districts and specific persons (verified accounts or accounts with many followers). Our study brings new insights into the candidates’ campaign strategies through the analysis based on the novel perspective of the candidate’s electoral situation.
1 Introduction
Social media has become an important tool in election campaigns. Political actors receive a variety of benefits from using social media; for example, causing voting behavior (Kovic et al. 2020), attracting new party members (Gibson, Greffet, and Cantijoch 2018), and provoking political debate (Paul et al. 2017). Consequently, they increasingly expect their messages on social media to have the above-mentioned effects. General users are also often exposed to political topics on social media. On Twitter, the U.S. election alone was the second most tweeted event in 2016 (Goulding 2016). Thus, the way to use social media has a strong influence on politics and election topics.
How electoral candidates handle social media according to their chances of winning an election is unclear. Existing many studies addressing political communication on social media often focus on binary opposition, such as the two-party system, i.e., ruling and opposition parties (Heiss, Schmuck, and Matthes 2019; Keller and Kleinen-von Königslöw 2018; Bobba 2019). Not much research has been conducted on fringe candidates’ political communication on social media because they have little influence and are unlikely to affect the overall outcome of an election in a two-party system like the U.S. In recent years, however, they often activate political discussions on social media and turn out their followers, with running as candidates even though they have low chances of winning elections for fusion voting (MSNBC 2014) and issue awareness (Taylor 2012; Kitunzi, Helen, and Consolate 2016). The freshness of their slogans and their substandard movement sometimes succeed in attracting people’s attention and contributing to their win; for example, in Japan, the Trumpian-inspired party (Sanseito) won a seat in the House of Councilors in 2022 (WorldTribune 2022). Their increasing presence makes it important to understand their behaviors and strategies on social media, which could not be covered by an analysis of the existing two-party system against the backdrop of U.S. society. Likewise, it is not well understood how leading candidates who rarely lose elections use social media, compared to them.
In this work, we aim to deepen our understanding of the differences in their social media strategies during elections in response to the chances of winning. To this aim, we collect the candidates’ posts and user information in the Japanese Twitter-sphere leading up to the 2022 Upper House election and attempt to characterize them classified into four groups according to the chances of winning (almost winning, even, almost losing, and proportional representation group).
We tackle the following research questions by the comparison between four groups.
RQ1: What are the characteristics of the frequency of tweets and user information? We attempt to examine and find a statistical difference between the four groups according to the chances of winning (almost winning, even, almost losing, and proportional representation group) in basic tweet behavior and user information. It provides useful insight into how each group is dealing with social media.
RQ2: What kind of content does each group post during the election period? We analyze what kind of content is likely to be posted during election periods through the topic model. By identifying differences in the content that each group is most likely to discuss, it becomes clear what election issues they want the public to pay attention to and what they want to claim. We expect to see differences in social media strategies based on the chances of winning.
RQ3: What type of content affects user engagement? We analyze which content is more likely to gain user engagement through the regression analysis method. The mechanism of what content they encourage their followers to share their content has so far not been a focus of extensive study. We seek to fill the gap by understanding how users are likely to respond to content in each group on Twitter communication during an election. This also helps all parties effectively promote participatory democracy globally and their campaign policies.
RQ4: Is there a difference in the way they communicate with other users on social media? One of the most efficient ways for candidates to communicate directly with voters and other candidates is to utilize reply functions. We attempt to elucidate how the electoral situation makes a difference in the way they communicate with them.
By answering these research questions, we made the following contribution:
-
•
We revealed that the number of followers, i.e., the popularity on social media, does not necessarily increase the chances of winning an election. Nonetheless, our analysis also finds that candidates with little chance of winning are more aggressive in their social media strategies than other candidates (Section 4).
-
•
Candidates in a state of close competition tend to tweet more about the neighborhoods where their constituents live, while candidates with little chance of winning the election tend to post tweets asking all of their followers to vote or share (Section 5).
-
•
Tweets asking all of their followers to vote or share, which candidates with little chance of winning the election frequently post, were unpopular in terms of user engagement (Section 6).
-
•
Candidates who are more likely to win use social media for broadcasting rather than for iterating with voters. Also, unlike the findings of existing studies, candidates in a state of close competition have fewer interactions with other users (Section 7).
To the best of our knowledge, this is the first study to examine candidates’ behavior in social media according to the odds of winning an election. Our study can benefit from exploring how variations in candidates’ situations may directly affect the way candidates engage with voters through social media. We can gain insight into how each candidate faces social media communications in an election context.
2 Related Work
2.1 Political communication on social media
The impact of social media on political communication has been a significant topic (Haq et al. 2020). Before the advent of social media, political communication based on democracy was mainly performed to be mediated by traditional mass media. The emergence of social media has profoundly changed the form of political communication by providing new spaces for conversation and social interaction (Papacharissi 2004). This change brought benefits such as revitalizing political debate and increased diversity (Chadwick 2008). On the other hand, social media also brings negative aspects, such as political filter bubbles or echo chambers (Barberá et al. 2015). Despite the advantages and disadvantages of the emergence of social media, there is no doubt that it is currently the most important source of political information for voters and an important forum for political actors to disseminate information (Knoll, Matthes, and Heiss 2020; Center 2016).
Much research has been conducted on how public users participate in political communication on social media (Stier et al. 2020; Blassnig and Wirz 2019). In particular, public users with a strong voice in the domain of politics have received attention in studies of political behavior. Even though they are not politicians, they have many followers and influence the behavior of other users (Bode and Dalrymple 2016; Vaccari and Valeriani 2015). On the other hand, it is said that their views do not necessarily represent the views of the groups to which they belong (Barberá and Rivero 2015).
For political actors, the use of social media plays an important role because it can achieve various purposes; they can inform a broader belief, interact with voters, or mobilize their followers (Magin et al. 2017). They attempt to gain support and spread their claims through political communication on social media platforms (Klinger and Svensson 2015). They also make an attempt to get a lot of user engagement, e.g., liking, commenting, and sharing with other users, for success in social media communication (Popa et al. 2020). A large amount of user engagement depends on many factors; profile characteristics (Keller and Kleinen-von Königslöw 2018; Vaccari and Valeriani 2015), the post content (Xenos, Macafee, and Pole 2017), the sentiment and style characteristics (Blassnig et al. 2021; Heiss, Schmuck, and Matthes 2019), the attached images (Farkas and Bene 2021), and polarization rhetoric (Ballard et al. 2022). Political actors are (consciously or unconsciously) concerned about what content to show and how to show it, in order to gain user engagement.
Differences in political communication in social media also emerge depending on the position and affiliation of political actors; political party (Keller and Kleinen-von Königslöw 2018; Blassnig et al. 2021), right-wing or left-wing (Morstatter et al. 2018), political leader (Vaccari and Valeriani 2015; Jain et al. 2021), populist or not (Bobba 2019; Blassnig and Wirz 2019), and famous or not (Graham et al. 2013). These studies have shown that position and affiliation are strongly related to the content of posts, the ease of gaining engagement, and the manner of reply. However, it is still unclear how political communication on social media depends on the chance of winning an election.
2.2 Election campaigns
Elections are the prime of democracy. Elections tend to increase the volume of posts related to politics and are the catalyst for political discussion on social media (Ahmed and Skoric 2014; Jungherr 2016). Most political actors are naturally interested in the outcome of elections. Even in the field of research, social media in the role of the social sensor has been considered as an alternative to polls or a possible predictor of election outcomes (Tumasjan et al. 2010; Kulshrestha, Shah, and Lu 2017; Burnap et al. 2016). However, it is currently considered difficult to predict the outcome of elections from social media because of the complex relationship between post engagement and whether to win or not (Jungherr et al. 2017).
The political discussion among politicians and general users during the election period is very active, making it a useful subject for analysis. While most studies have focused on presidential and congressional elections in the U.S. (Paul et al. 2017; Bovet, Morone, and Makse 2018), some studies analyze the relationship between social media and elections in countries outside the U.S. because the relationship between social media and political communication is similar for elections in most countries; U.K. (Burnap et al. 2016), Germany (Jürgens, Jungherr, and Schoen 2011), Belgium (Boireau 2014), Egypt (Elghazaly, Mahmoud, and Hefny 2016). Our study focuses on the political communication of candidates in Japanese elections, same as (Yoshida and Toriumi 2018; Usui, Yoshida, and Toriumi 2018).
3 Data
3.1 2022 Japan Election
We employ tweet data of candidates running for the 2022 Upper House of Councilors Election in Japan, which was announced on June 22 and held on July 10, 2022, to elect 125 members of the upper house of the National Diet, as the subject of our analysis. There are some reasons why the election is a desirable case study for the aim. First, in the 2022 elections, candidates can choose between two election ways to run; a proportional representation system or a constituency system in each prefecture. A proportional representation system reflects the overall distribution of public support for each political party and ensures minority groups have a measure of representation proportionate to their electoral support. A constituency system selects one or several representatives, depending on the size of the electoral district, in proportion to the number of individual votes for candidates. In effect, two electoral ways are run in parallel during one election period, where we allow analyzing social media strategies from various perspectives. Second, Twitter is quite popular in Japan with approximately 60 million users, and is roughly the same number of daily active users as the U.S. (NHK 2022). It is said that 83% of the candidates in the election also campaigned through Twitter, which is a higher percentage than in any other social media service (Election.com 2022). For these reasons, looking at political communications on Twitter in Japan is useful in terms of post volume and multidimensional analysis, when analyzing social media strategies during an election term.
The result of the election is that the ruling Liberal Democratic Party (LDP) increased its seats, and the largest percentage of women have been elected so far. It is interesting to note that a new party, the Trump-inspired Party (Sanseito), won seats. Two days before the election, the assassination of the previous prime minister Shinzo Abe caused a great flutter.
| Group | Number of | % of winning | % of the |
|---|---|---|---|
| the candidates | the election | ruling party | |
| W | 60 (63) | 98.33% (98.41%) | 65.00% (65.07%) |
| E | 23 (23) | 47.82% (47.82%) | 39.13% (39.13%) |
| L | 217 (281) | 0.92% (0.71%) | 1.38% (1.06%) |
| PR | 124 (178) | 32.23% (28.09%) | 25.00% (28.08%) |
3.2 Data collection
We identified the Twitter accounts of the candidates in the 2022 House of Councilors Elections. In all, 433 of the 545 candidates had Twitter accounts, and we crawled their user profiles and their posts. We collect their data using Twitter Academic API (Pfeffer et al. 2022). We treat their tweets as the subject of analysis, which are divided into two term periods based on the date of the election announcement date; the term from the election announcement to the election date called as Election term and two months prior to the date of the election announcement called as Pre-election term, where there is an almost similar number of tweets as during the Election term.
Our study focuses on how political communication on social media differs depending on their chances of winning the election. We divided the candidates’ accounts into four groups; almost Winning (W), Even (E), almost Losing (L), and Proportional Representation (PR) group. In other words, constituency candidates assign to three groups depending on their chances of winning and proportional-representation candidates belong to the fourth group because whether they win the election depends largely on the popularity of the party to which they belong. The judgment criterion for the assignment of the groups of each candidate was based on the survey of the electoral situation published by the Asahi Shimbun, which is the third largest newspaper in the world, three days after the announcement of the election (Shimbun 2022). Their surveys are reported whether each candidate takes the lead in the election or not, based on their coordination of the situation and interviews. We assign the candidates judged to be superior or slightly superior to the “almost Winning (W)” group, those judged to be in a state of close competition to the “Even (E)” group, and those judged to be inferior or no mention to the “almost Losing (L)” group.
The basic stats are shown in Table 1. The percentage of Groups W and E with Twitter accounts is near 100%, while those of Groups L and PR are 77.2% and 69.6%, respectively. Groups that are likely to win or are unsure of their chances of winning appear to be more active in engaging in social media strategy. Also, since the percentage of candidates for each group that won the election decreases in order from group W to group L, the survey as the basis for the group assignment appears to be reasonable.
What is the relationship between group assignments and the ruling and opposition parties? The ratio of ruling parties shows an extreme bias in the “Almost Losing (L)” group. This is due to the fact that the ruling Liberal Democratic Party (LDP) is very selective in its candidates, and some opposition parties are fielding large numbers of candidates. The “Almost Losing (L)” group is mostly composed of members in the opposition parties, but the other groups are unbiased and mixed with both the ruling and opposition parties. Note that our study is based on the perspective of the chance of winning an election, and offers a new perspective on political communication on social media, that differs from the dichotomy perspective between the ruling party and the opposition.
4 RQ1: What are the characteristics of the frequency of tweets and user information?
This section characterizes the frequency of tweets and user information by the four groups we have defined to understand the differences among their strategies in social media.
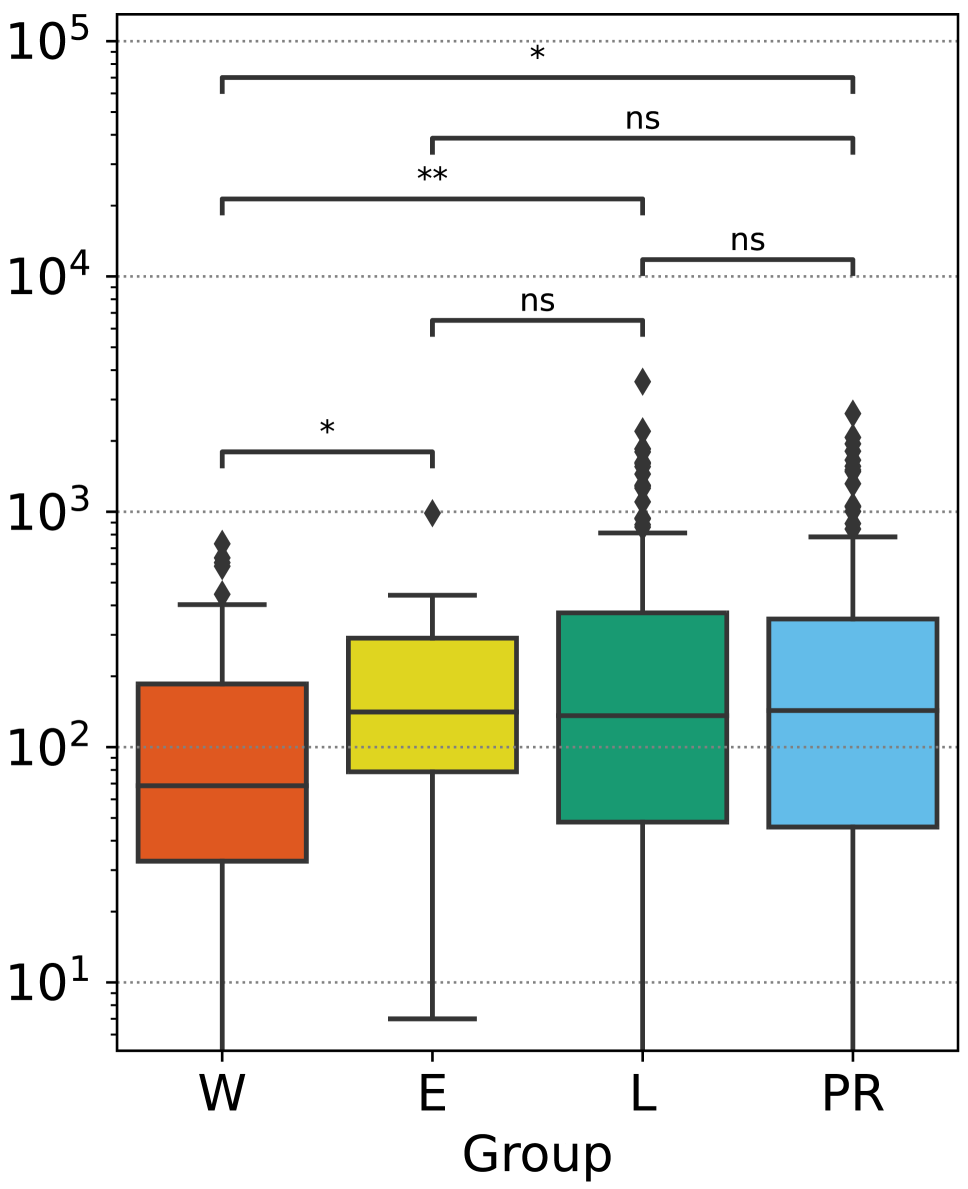
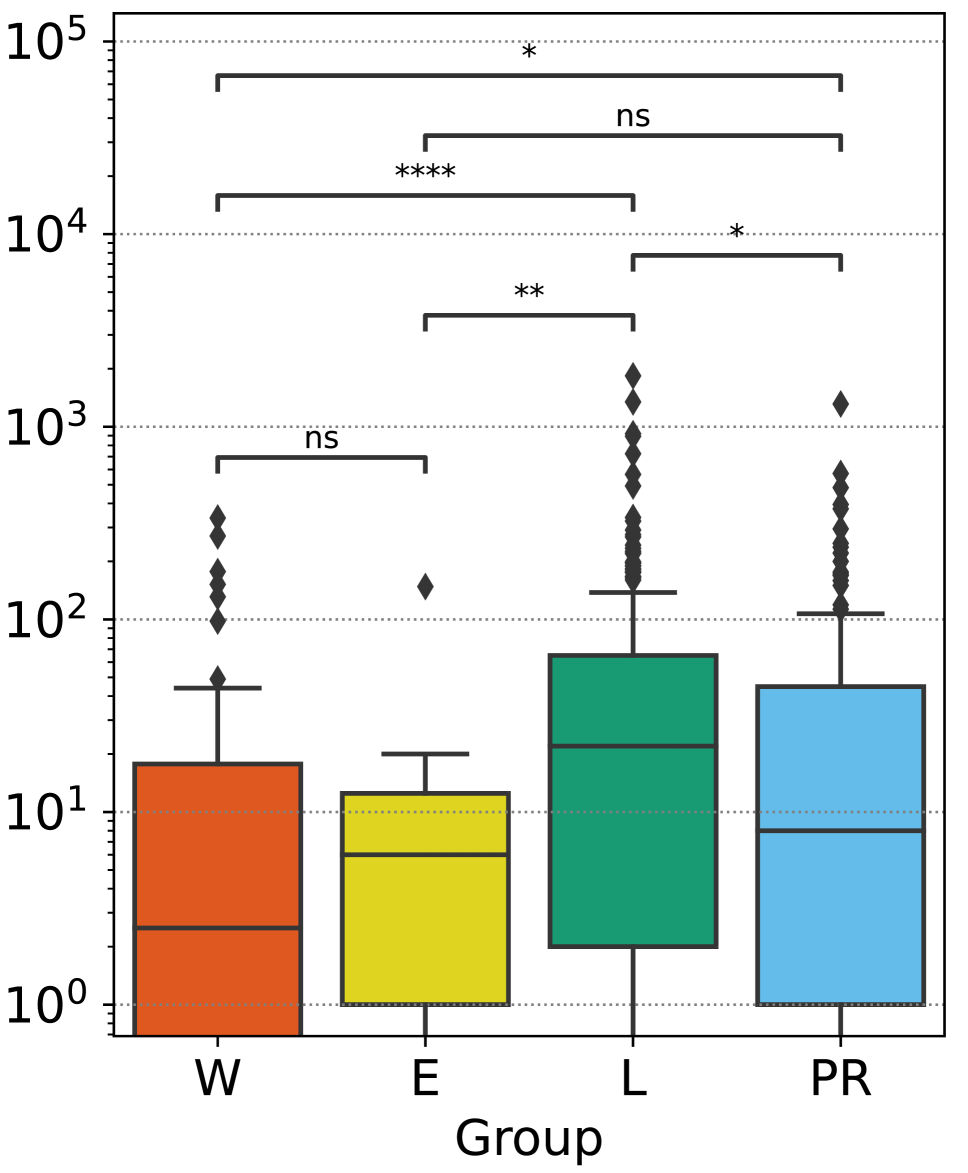
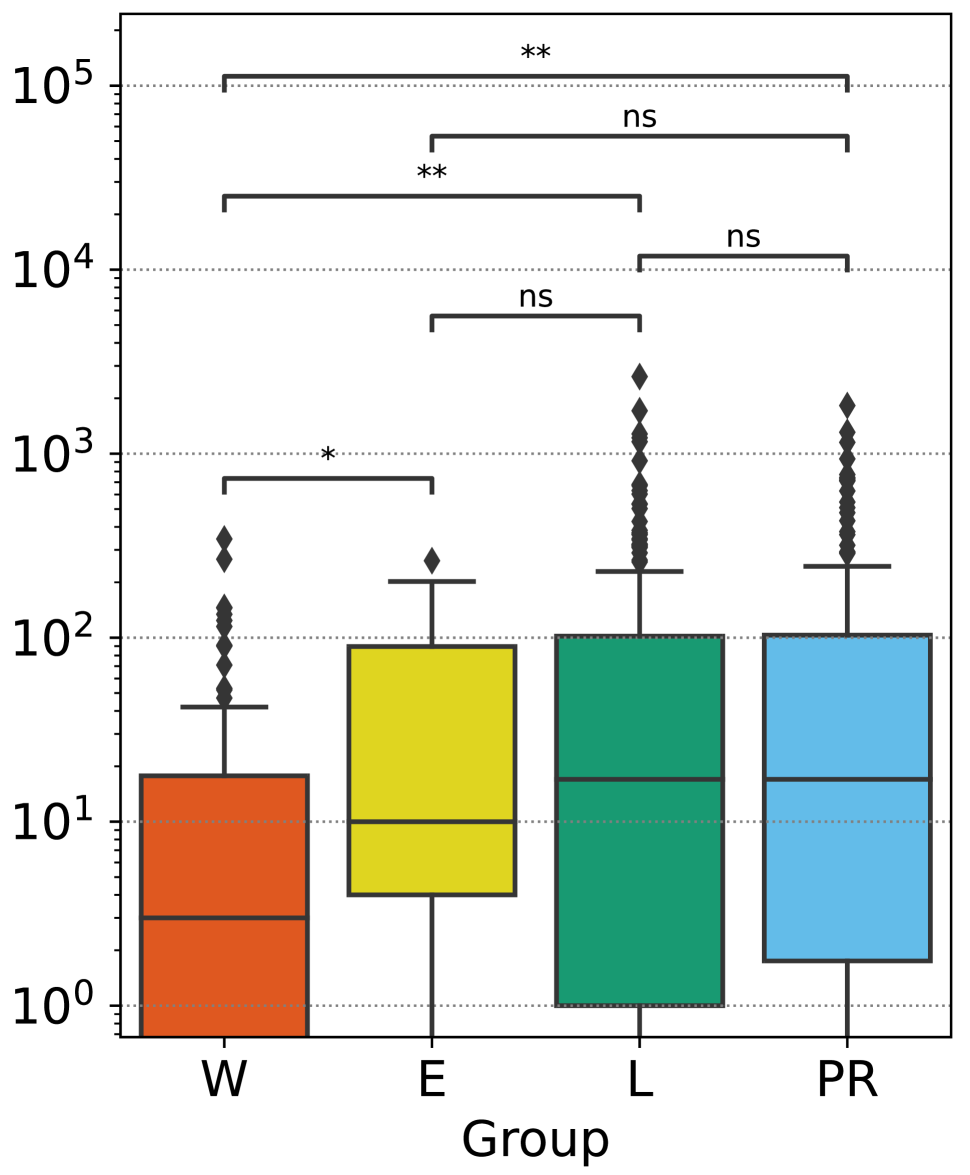
4.1 User characteristics
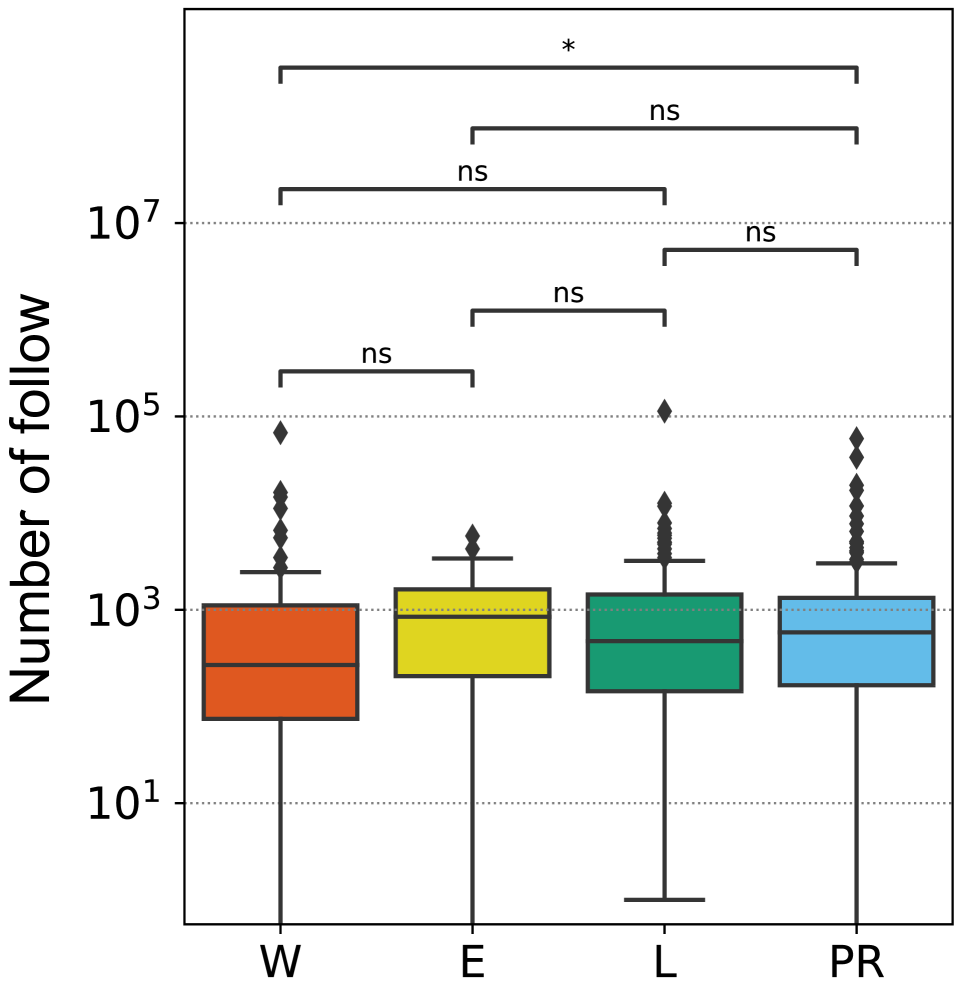
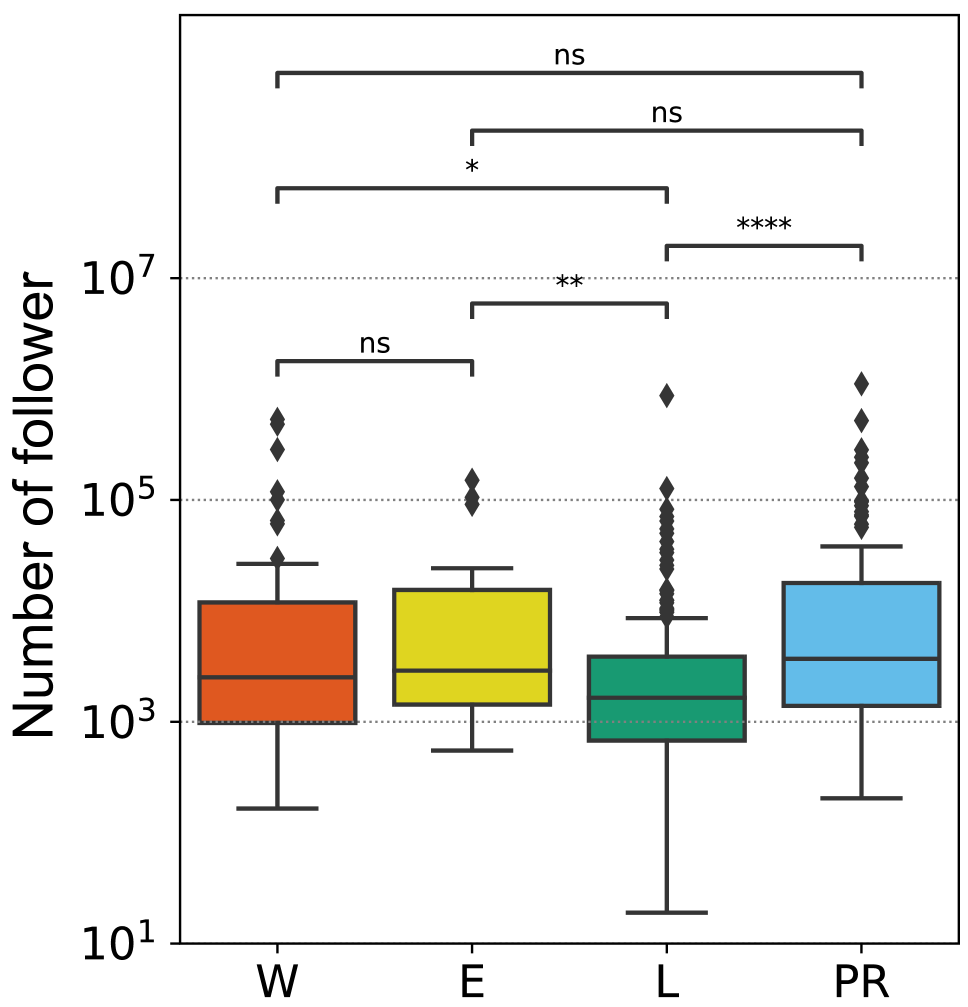
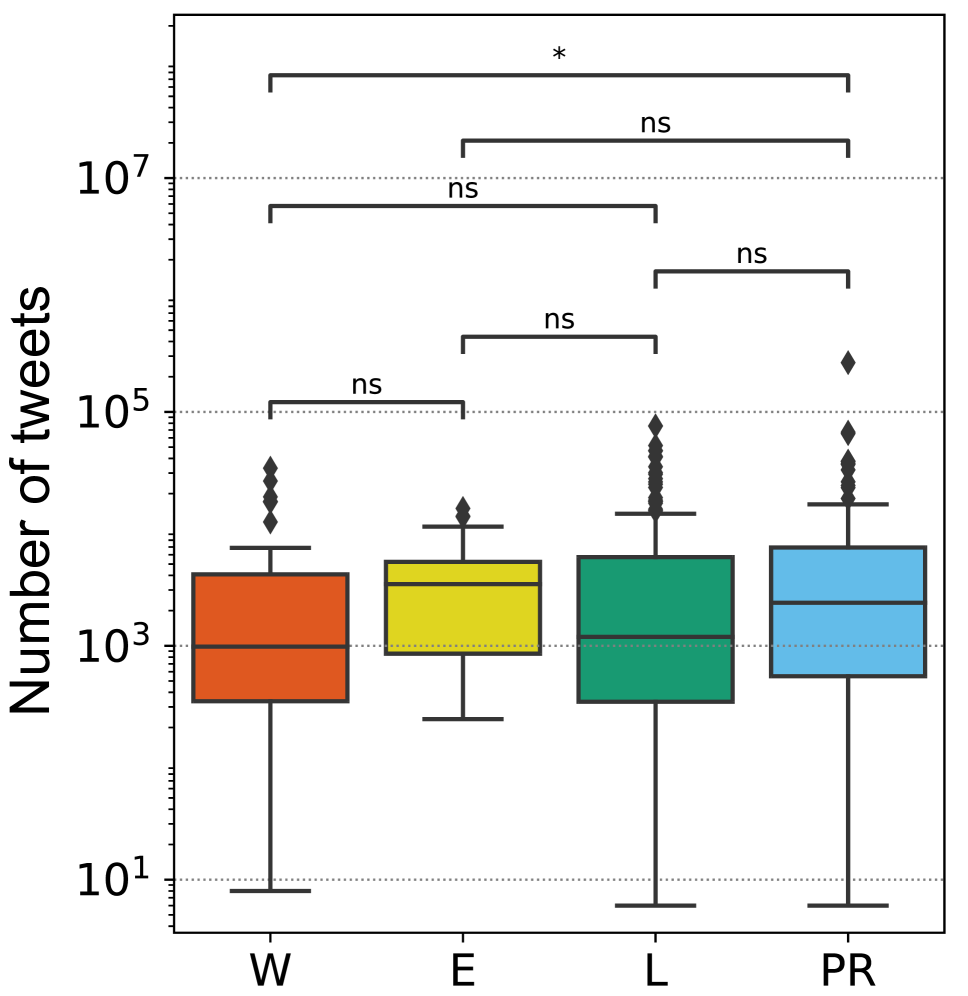
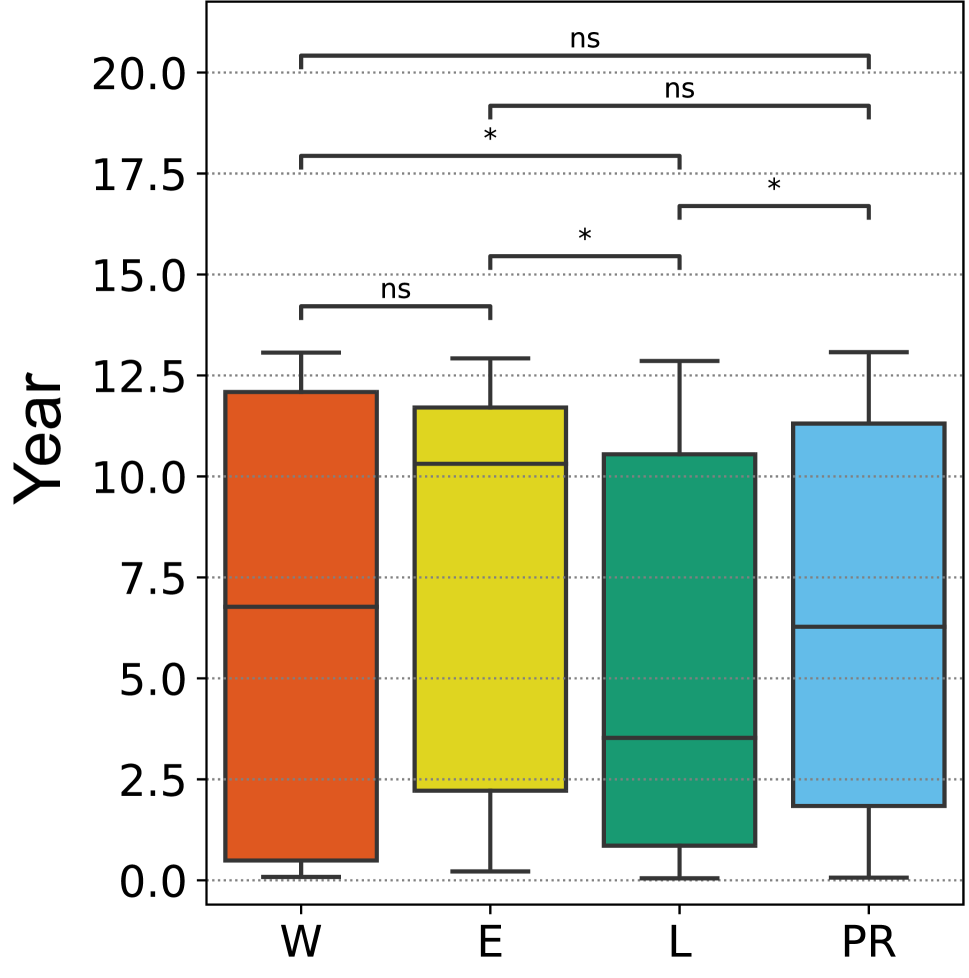
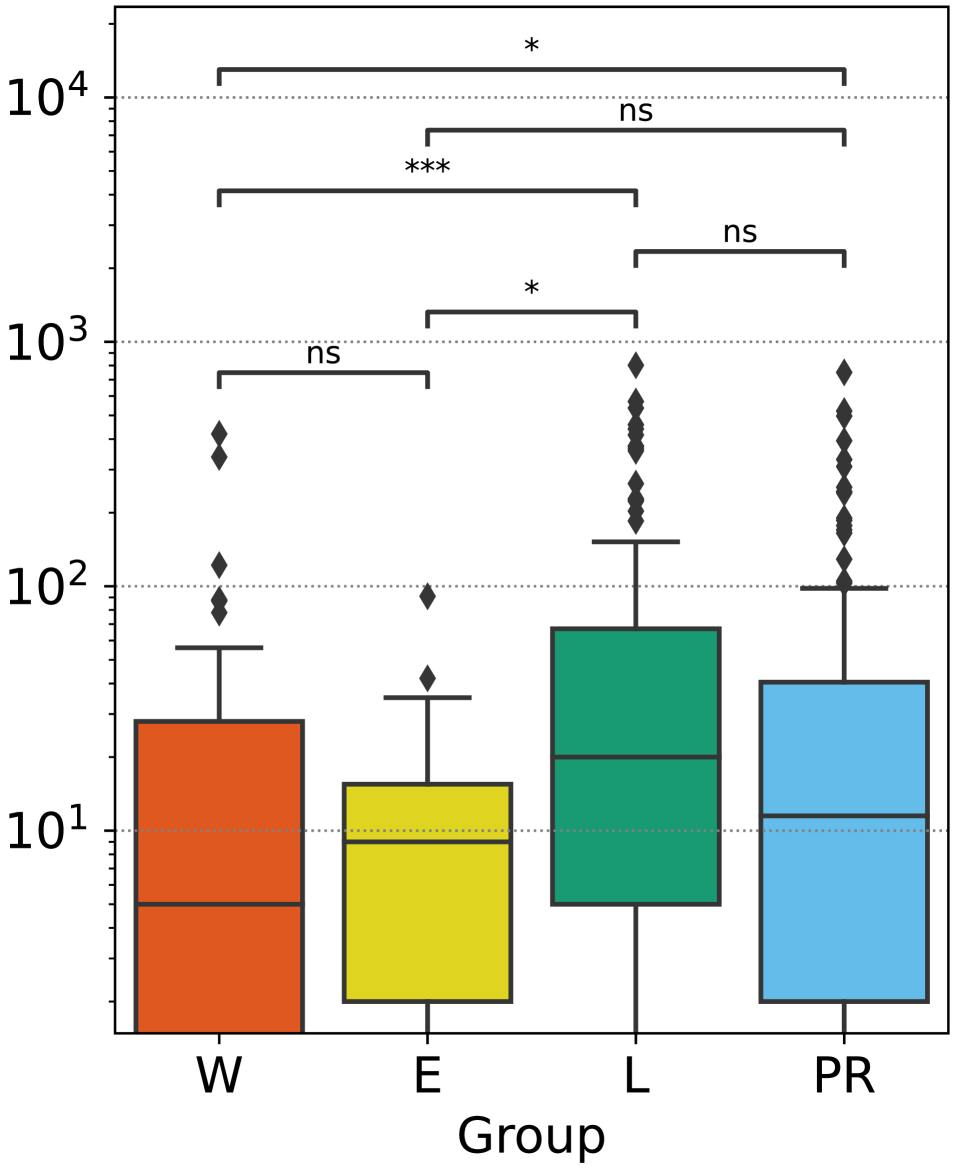
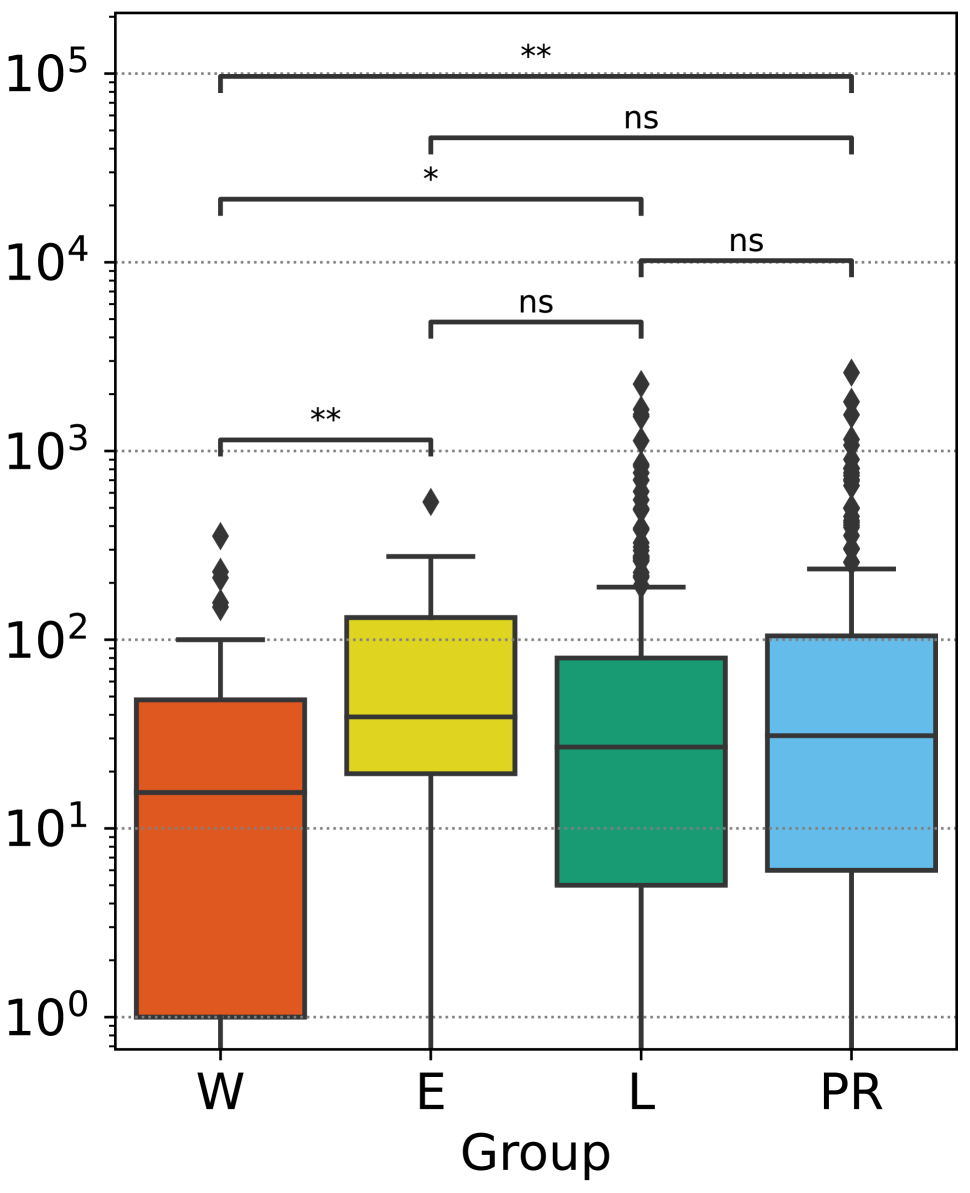
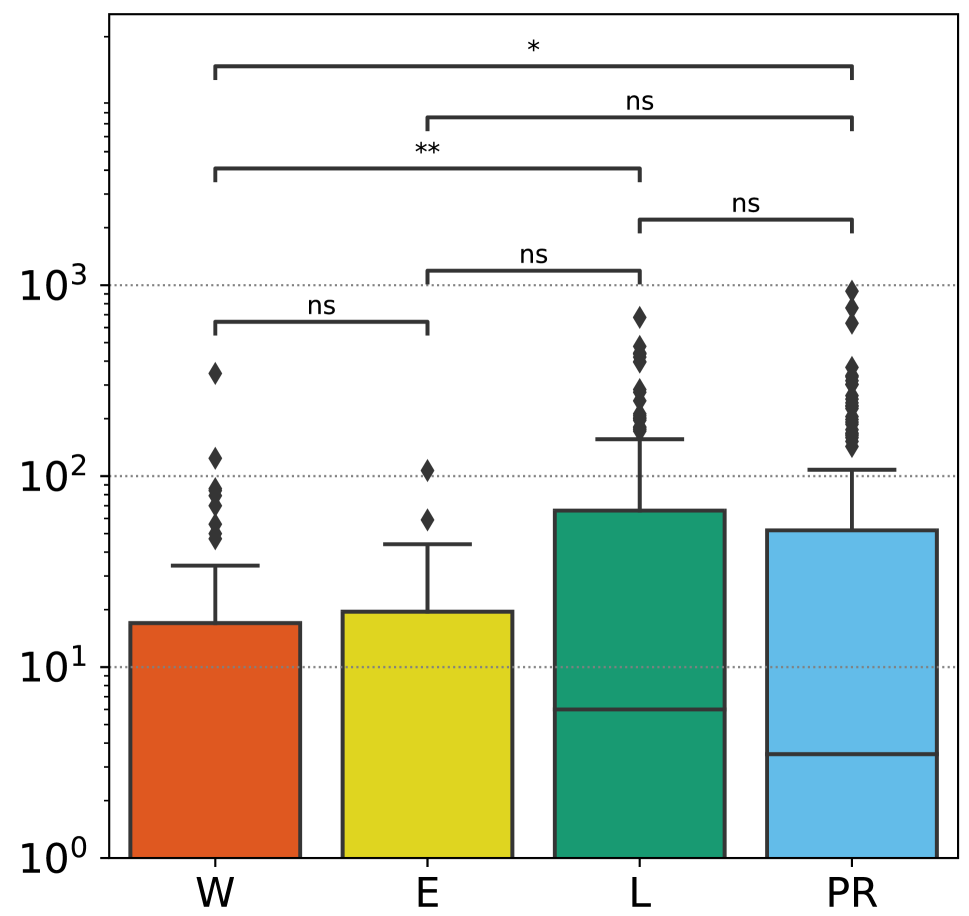
We examine the differences among the groups for four types of user characteristics; the number of following, the number of followers, the number of tweets, and account age. The results are shown in Figure 1. The comparison is expressed by box plot, and we use Mann Whitney U tests (Mann and Whitney 1947) for the statistical significance test.
The number of following of candidates does not differ significantly between any of the groups, except the pair of W and PR, as shown in Figure 1 (a). Although group E appears to tend to have fewer followers than the other groups, it is apparent that the majority of users only follow 100 – 1,000 users. The number of followers shows that group L was significantly different from the other groups, as shown in Figure 1 (b). The lower bar of the box plot in group L is spreading downwards, suggesting that some of the users in group L have not fully gained popularity on social media. For example, the median number of followers in group W is 31,835, while that in group L is 9,849. On the other hand, several candidates in group L have more than 100,000 followers. This implies that while more followers (the popularity on social media) does not necessarily increase the chance of winning an election, above a certain amount of followers is necessary to have a certain chance of winning, i.e., to join group W or E.
For the number of tweets, the result in Figure 1 (c) shows that W and PR are significantly different, the same as the number of following. It indicates that the facing of social media differs among the leading candidates depending on the election way. Both the number of followers and the number of tweets are higher for the PR group to which candidates running in the proportional representation system belong, showing that they differ in their engagement with other public users. Taking into account age, group L is significantly different from the other groups, as shown in Figure 1 (d). Both the number of followers and account age in group L are smaller than in other groups due to the fact that there is some first-time candidate in the group. Also, the number of tweets in group L is almost the same as those in the other groups despite the young age of the account, indicating that they are actively working on the social media strategy.

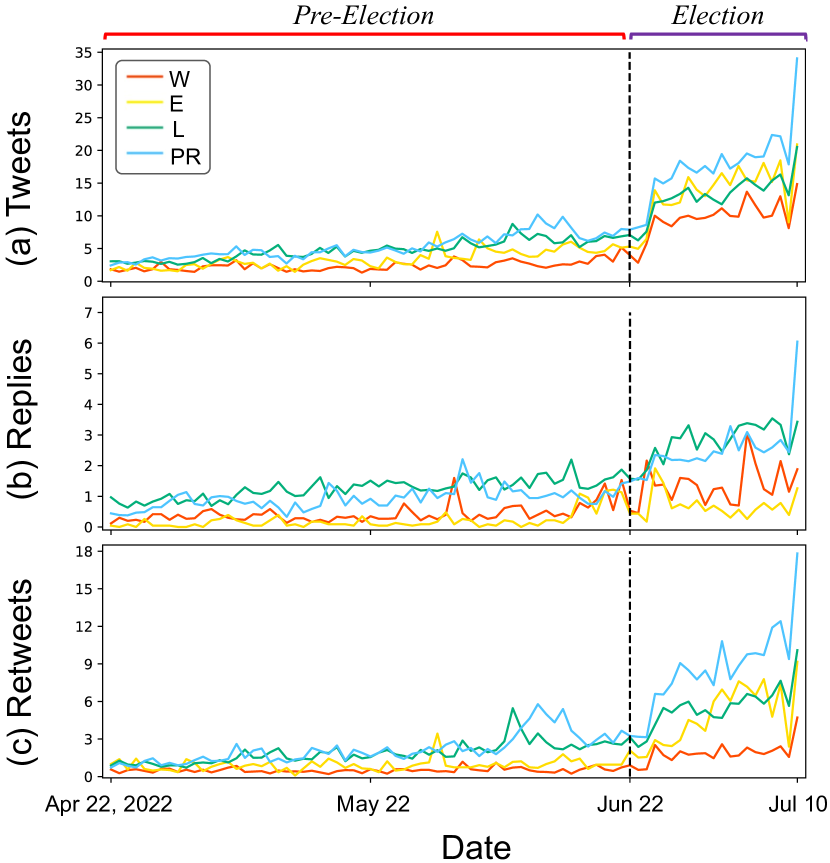
4.2 Time series in a number of tweets
We investigate whether there is a difference in the number of tweets by each group during Pre-Election and Election terms. The time series of the average number of tweets are shown in Figure 2, and the comparisons of the number of tweets in each term are shown in Figures 3 and 4.
The number of tweets during Election term tends to increase more than those during Pre-Election term because of the activation of electoral campaigns on social media. During Pre-Election term, the number of tweets, replies, and retweets is significantly fewer for group W than for other groups. Candidates who have already gained popularity use social media in smaller amounts. On the other hand, group L makes use of replies more than any other group during the Pre-Election term, indicating that it is aware of the dialogue with other users even before the election.
During Election term, group W significantly posts fewer tweets, replies, and retweets, which is similar characteristics as during Pre-Election term. Group E tends to have larger tweets but fewer replies than other groups. It suggests that the competitive state of their rivals has led to an increase in their own election campaign tweets. Group L focuses on interacting with other users through a reply function, the same as during Pre-Election term. Interestingly, group PR retweets during Election term more than other groups. We consider that the candidates in group PR frequently retweet their party’s propaganda because the rise in popularity of their party directly leads to their electoral triumph, due to the electoral system in which they run.
5 RQ2: What kind of content does each group post during the election period?
In this section, to better understand the topics to which each group tends to refer, we use a topic modeling approach to group tweets into meaningful topics. The identification of the content that each group talks about makes clear what election issues they want the public to pay attention to and what they want to claim.
5.1 Topic model
We use a topic model to group all 211,495 tweets except retweets posted by candidates belonging to each group from Apr 22 to Jul 10, 2022 (in Election and Pre-Election terms) into clusters and to describe their properties. We chose the Biterm Topic Model (BTM) (Yan et al. 2013) as our clustering method. This model is a derivative of Latent Dirichlet Allocation (LDA) (Blei, Ng, and Jordan 2003) and is known to be able to extract topics with high accuracy for short sentences. Specifically, this method assigns topics based on word sets with high co-occurrence rates among word pairs in a single tweet.
The input to BTM is word pairs for each tweet. Before creating these word pairs, as a text preprocessing step, we remove particles, auxiliaries, and stop words, and replace some words with specific words. Each candidate frequently uses one’s name and one’s party affiliation in tweets for his/her election campaign. To mitigate the impact of individual and party names in the topic model, we replace each individual name with PERSONAL_NAME and the party name with PARTY_NAME.
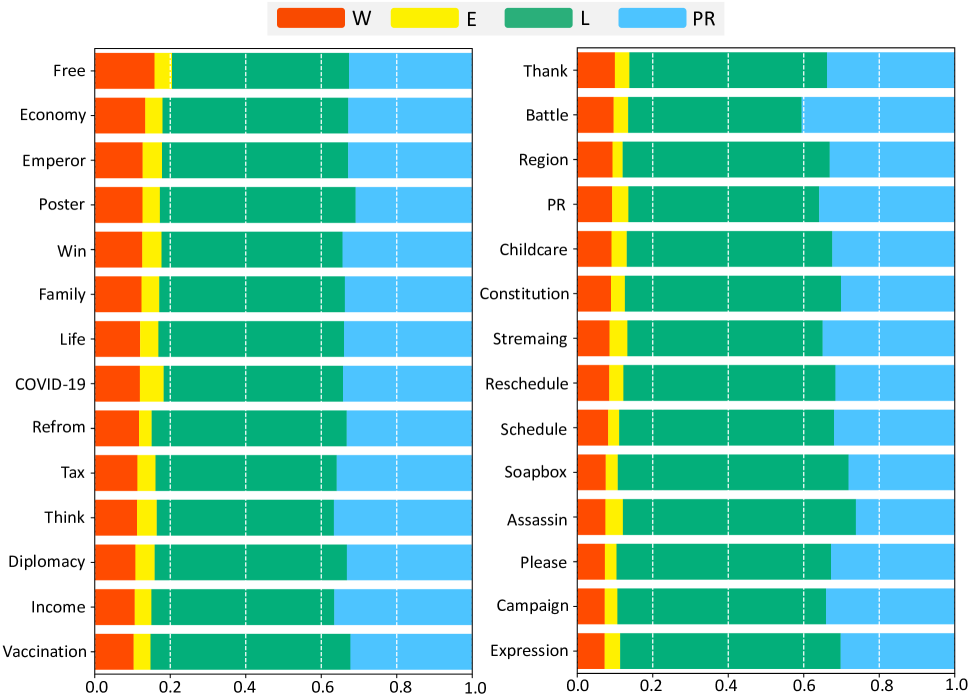
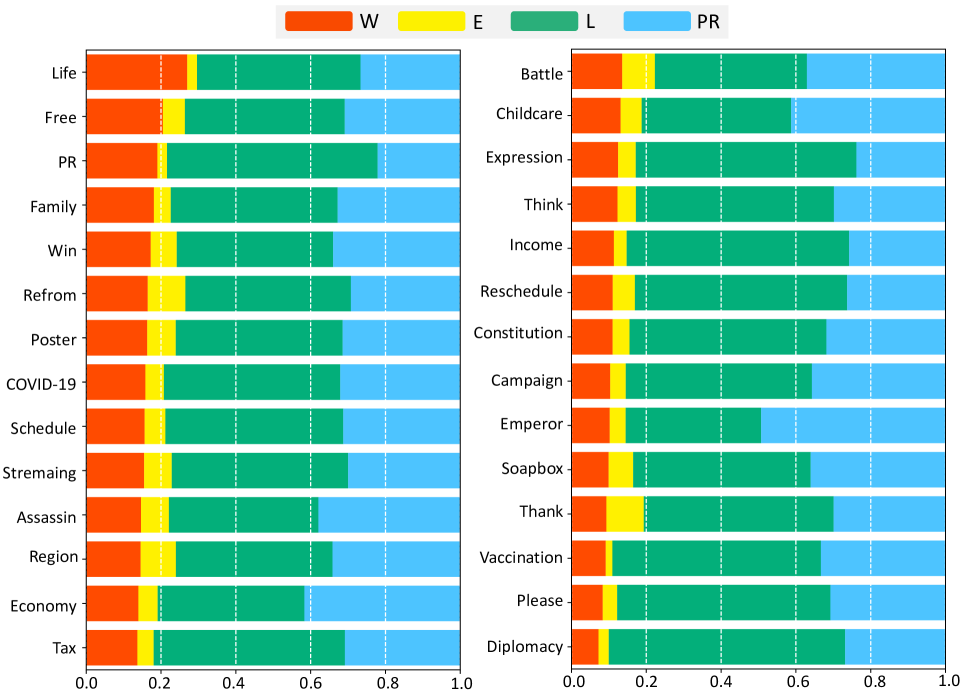
As the number of clusters, we searched for the appropriate number of topics by coherence score in increments of 5 in the range of 10 to 100, and chose 35 as the initial number of topics. We clustered the preprocessed tweets into 35 topics using BTM. Then, we merged pairs of topics that were similar among the estimated set of topics. Concretely, the top 50 words in each topic were extracted according to , which represents the distribution of words in the topic, and a pair of topics with more than 20% overlap between these words was merged as one topic. Finally, we set 28 topics, which one of the co-authors reviewed, inspecting the words as well as the context in which they appeared, and assigned a label to each topic; Free, Economy, Emperor, Poster, Win, Family, Life, COVID-19, Reform, Tax, Think, Diplomacy, Income, Vaccination, Thank, Battle, Region, Proportional Representation (PR), Childcare, Constitution, Streaming, Reschedule, Schedule, Soapbox, Assassin, Please, Campaign, and Expression. The percentage of each group for each topic is shown in Figure 5.
| Ranking | W | E | L | PR | |
|---|---|---|---|---|---|
| 1 | Schedule | Schedule | Schedule | Schedule | |
| 2 | Diplomacy | Diplomacy | Diplomacy | Diplomacy | |
| 3 | Please | Please | Campaign | Campaign | |
| Pre- | ⋮ | ||||
| Election | 26 | Constitution | Expression | Income | Income |
| 27 | Battle | Constitution | Reschedule | Reschedule | |
| 28 | Reschedule | Win | Battle | Win | |
| 1 | Please | Region | Please | Please | |
| 2 | Schedule | Diplomacy | Campaign | Diplomacy | |
| 3 | Streaming | Streaming | Diplomacy | Schedule | |
| Election | ⋮ | ||||
| 26 | Childcare | Constitution | Childcare | Childcare | |
| 27 | Income | Childcare | Economy | Income | |
| 28 | Constitution | Income | Income | Constitution |
5.2 Results
First, we examine the number of tweets belonging to each topic to identify popular and unpopular topics. In all tweets, the topic with the most tweets is Please (11.88%), which includes tweets asking users to do something please (e.g., vote), and the topic with the fewest tweets is Constitution (0.87%) related to constitutional amendments. The results of topics with high and low numbers for tweets in each group are shown in Table 2. The topics with a large number of tweets are similar in all groups. During Pre-Election term, it shows a high number of tweets on four topics; Schedule, Diplomacy, Please, and Campaign. Before the election announcement, there were many tweets on election-related topics such as Schedule, which reports the upcoming schedule, and Campaign, which reports the schedule of campaign speeches, suggesting that preparations for the election were being made early on. In addition, the tense situation in Russia and Ukraine has led to many tweets about Diplomacy. During Election term, in groups W and E, tweets on Streaming with respect to television and internet broadcast increase. The candidates with a high chance of winning increase to have opportunities to appear on TV, about which they tweet. Topics with a small number of tweets during Pre-Election naturally include subjects that are likely to be posted after the start of the election, such as Reschedule, Win, and Battle. During Election term, the number of tweets on topics that are usually central to political discussions, such as Childcare, Income, Constitution, and Economy, is few. It is apparent that during the election period, they do not discuss political issues but focus on the promotion of themselves and their political party.
Observations of popular and unpopular topics showed no big differences between the groups. Therefore, we introduce a new index, which is a form similar to Pearson’s Chi-square statistics () (Greenwood and Nikulin 1996), to discover topics that are distinctive in each group. This index quantifies the degree to which each group deviates upward from the expected probability on each topic, which we call Dev_Score. It is represented by the following equation;
, where represents the fraction of topic in group , represents the average of each except group . The deviation score indicates the degree of specificity of topic in group , compared to other groups.
Table 3 shows the top three topics of Dev_Score for each group. Group W tends to focus on Free such as freedom of expression more than other groups. Group E shows that the intensity of the elections triggered tweets related to the area in which they are running for office (Region). They tweeted extensively on Streaming about their own appearances on TV and the Internet to increase their visibility and attention. In addition, in the Election term, they posted more on Assassin, the topic of tweets about former Prime Minister Abe’s assassination, than any other group. This indicates a tendency to mention sensational incidents. Group L actively posted Please tweets, urging people to vote and support the campaign in both terms, suggesting that the campaign is in a tough state. In group PR, during Election term, they often tweet about the election, such as Please and Battle. While, during Pre-Election term, they are likely to mention political policies such as Reform and Childcare or express their own ideas (Think), suggesting that they are less aware of the election before the election than other groups because of the largely dependent on the popularity of their political party about winning the election.
| Ranking | W | E | L | PR | |
|---|---|---|---|---|---|
| Pre- | 1 | Free | Diplomacy | Please | Reform |
| Election | 2 | Poster | Streaming | Campaign | Think |
| 3 | Economy | Poster | PR | Childcare | |
| 1 | Life | Region | Please | Please | |
| Election | 2 | Free | Assassin | Campaign | Battle |
| 3 | PR | Streaming | Expression | Emperor |
6 RQ3: What type of content affects user engagement?


6.1 Regression model
What type of content is likely to gain user engagement in each group? This section examines the trade-off between tweet topics and user engagement using a linear mixed-effects model (Gelman and Hill 2006; Bates et al. 2014). The data is analyzed at the tweet level, while mixed effects account for variability across the characteristics of the user. Concretely, we set the number of user engagements measured by the number of retweets111We also performed a regression analysis of the number of likes as an independent variable, but the results were similar to those of the number of retweets as an independent variable in Figure 6. This section shows only the results for the number of retweets. as the independent variable and apply a log transformation to reduce the influence of extremes. We set the topic of the tweet, obtained in Section 5, as the explanatory dummy variable. Moreover, we set a random intercept per each candidate because the numbers of followers are highly correlated with user engagements (Uysal and Croft 2011). We use their political party as a control variable to mitigate the influence of the political party (Keller and Kleinen-von Königslöw 2018; Blassnig et al. 2021). The regression model is defined as below;
| (1) |
where is the number of retweets, is the random effect for one of all the candidates, and is the error term. We report the effect size , which is the coefficients of all topics, for each group in each term by fitting the model to their tweets.
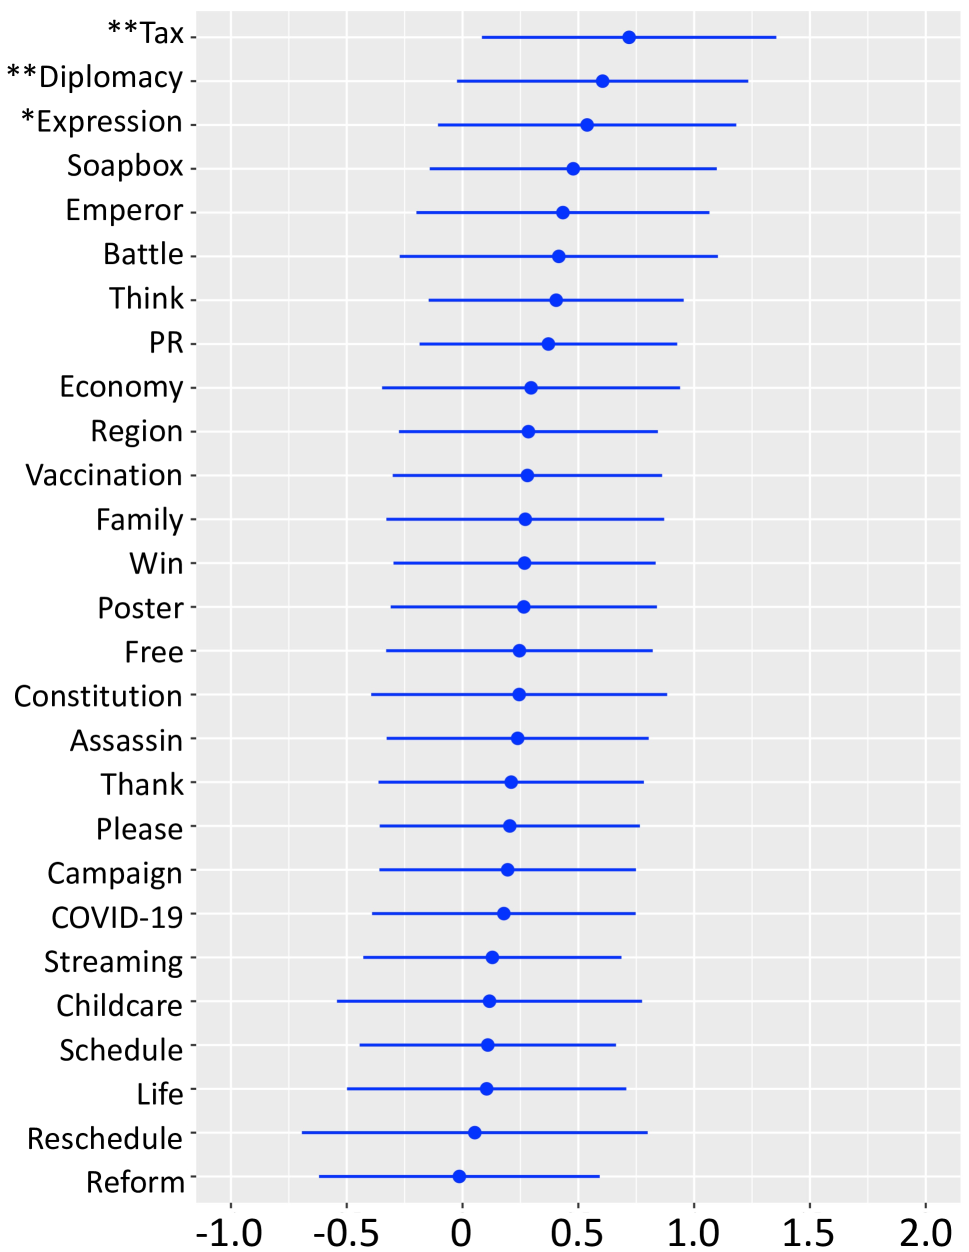
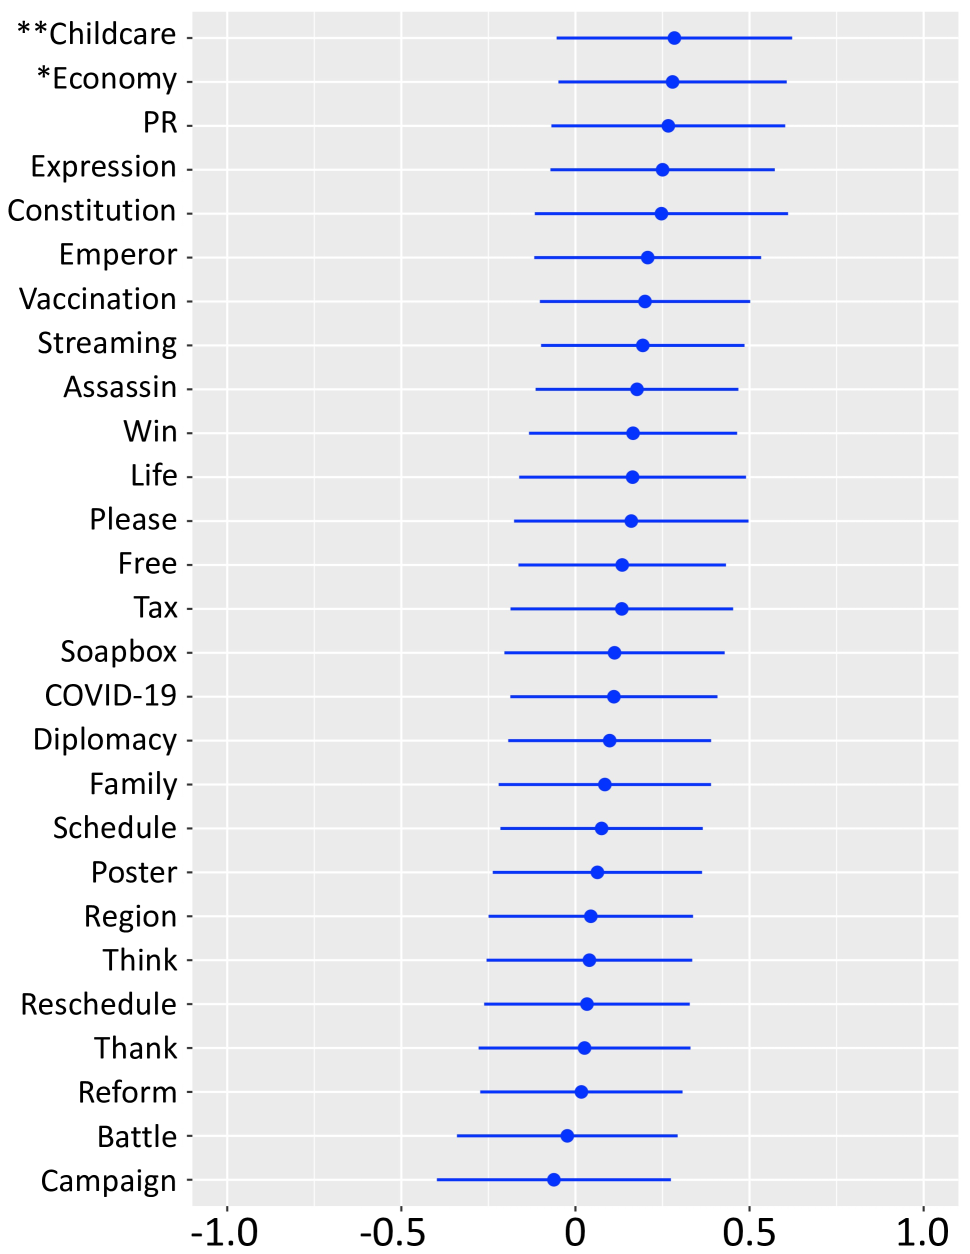
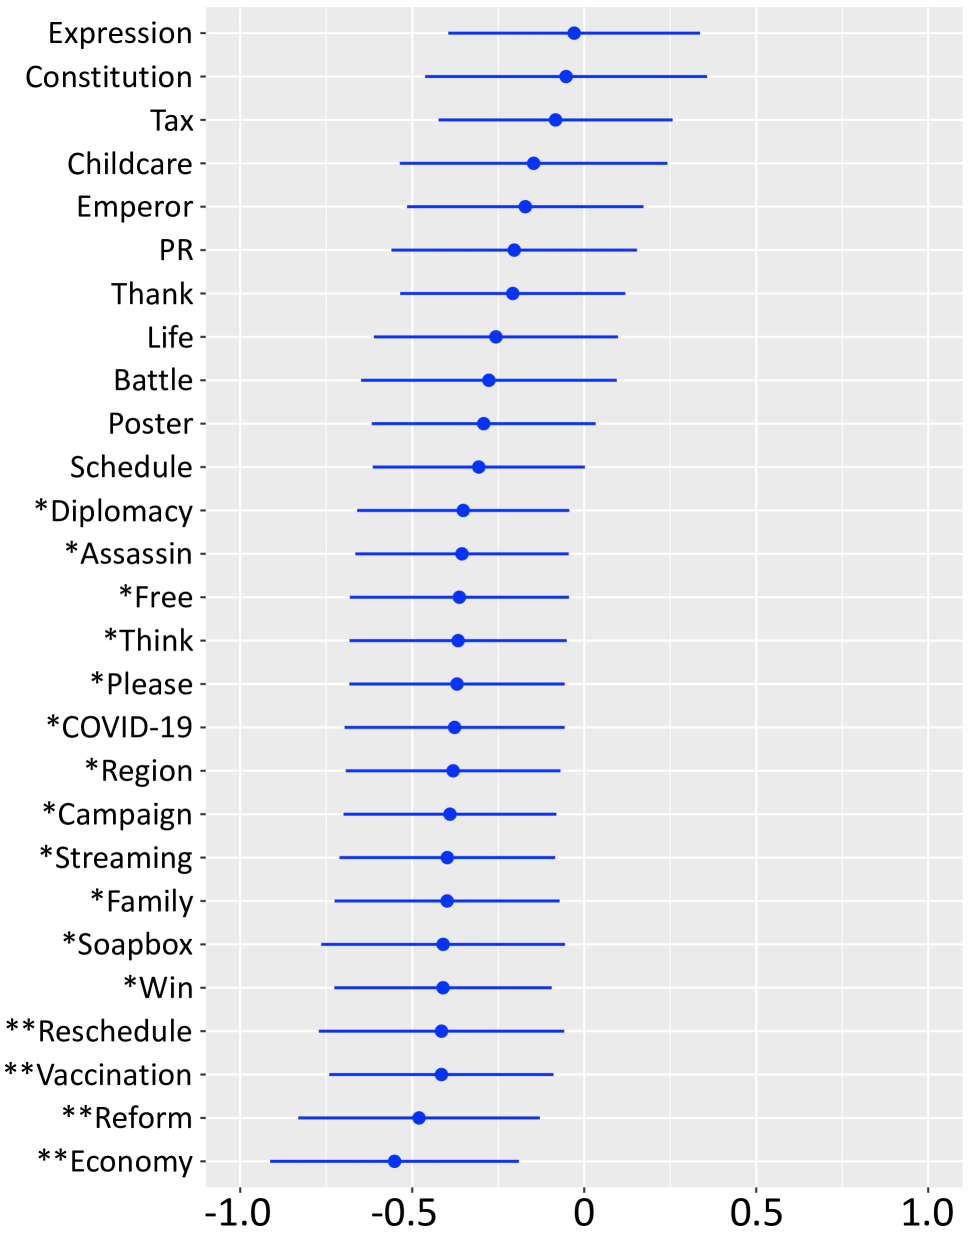
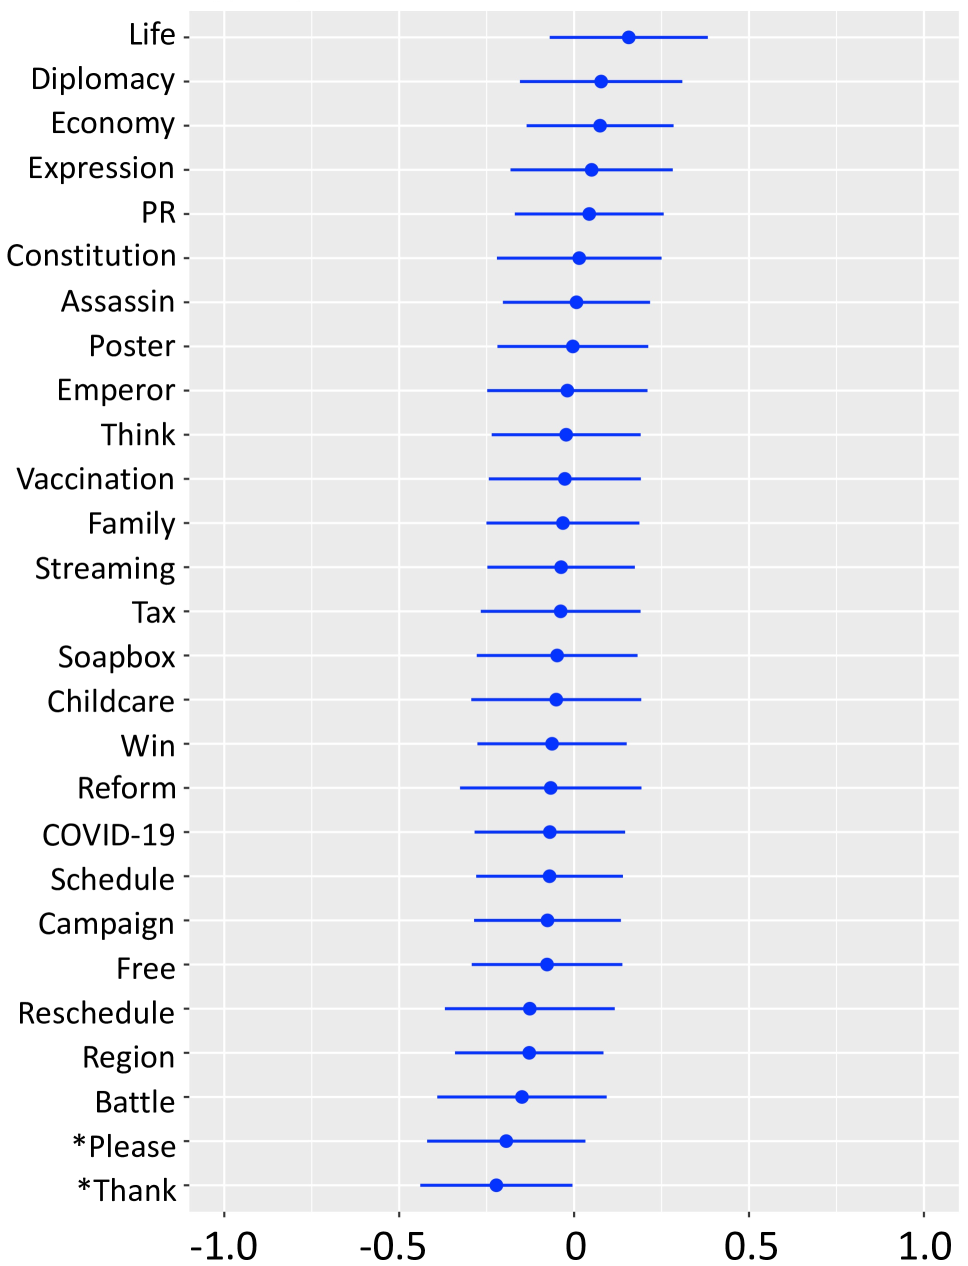
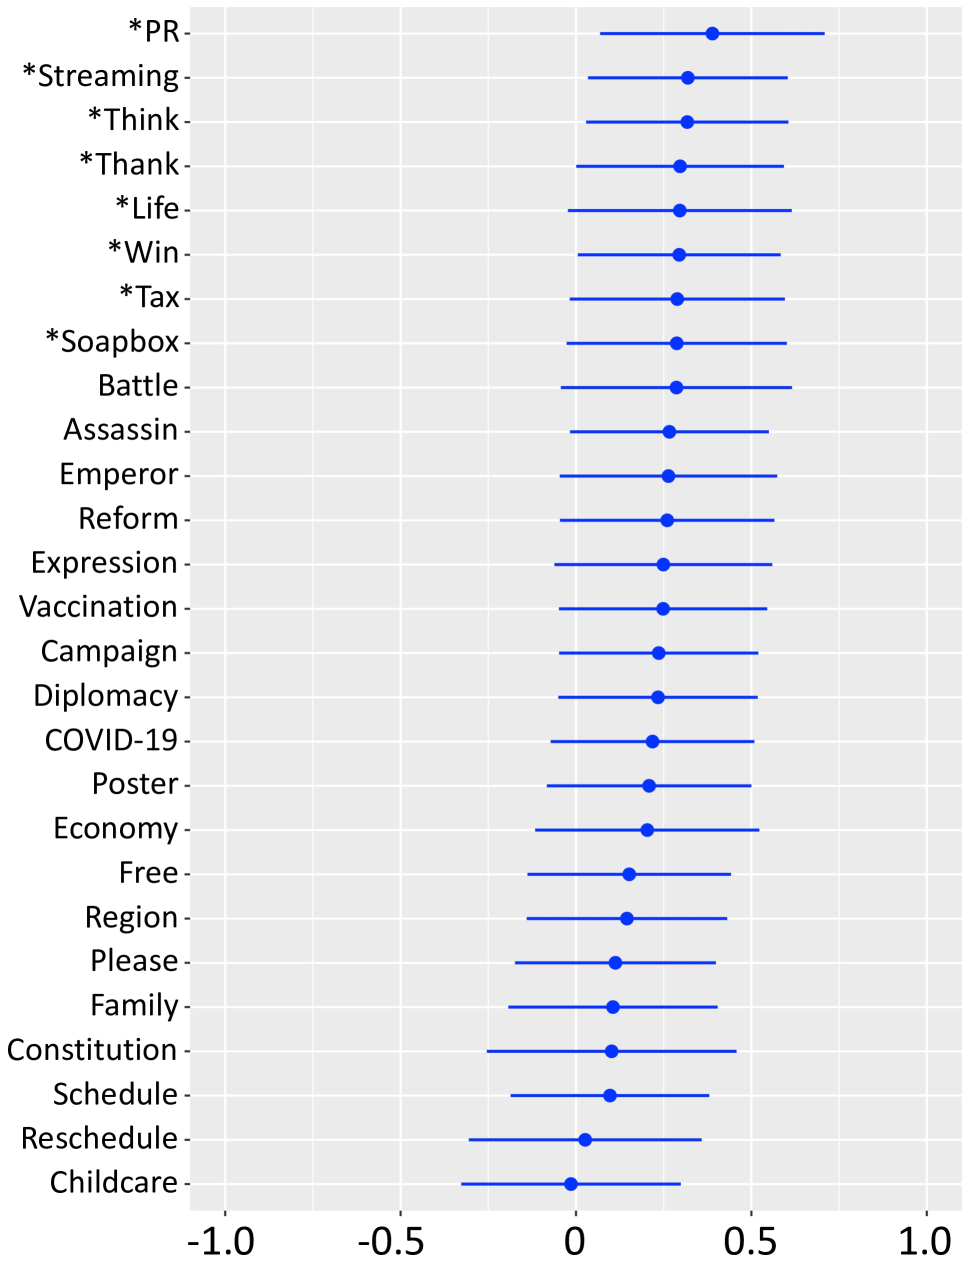
6.2 Results
We present all topics sorted by effect size in each group in Figure 6. During Pre-Election term, topics regarding political policies tend to get more retweets; Tax, Expression (the topic on the regulation of expression), Economy, Childcare, and Emperor (the topic on the Emperor System). On the Constitution topic that sparks national debate, tweets in group L and PR tend to get retweets, while those in group W are less likely to be retweeted. The candidates in group W, who have already gained popularity with the public, may be less likely to make tweets that generate public interest on sensational topics for fear of social media ablaze.
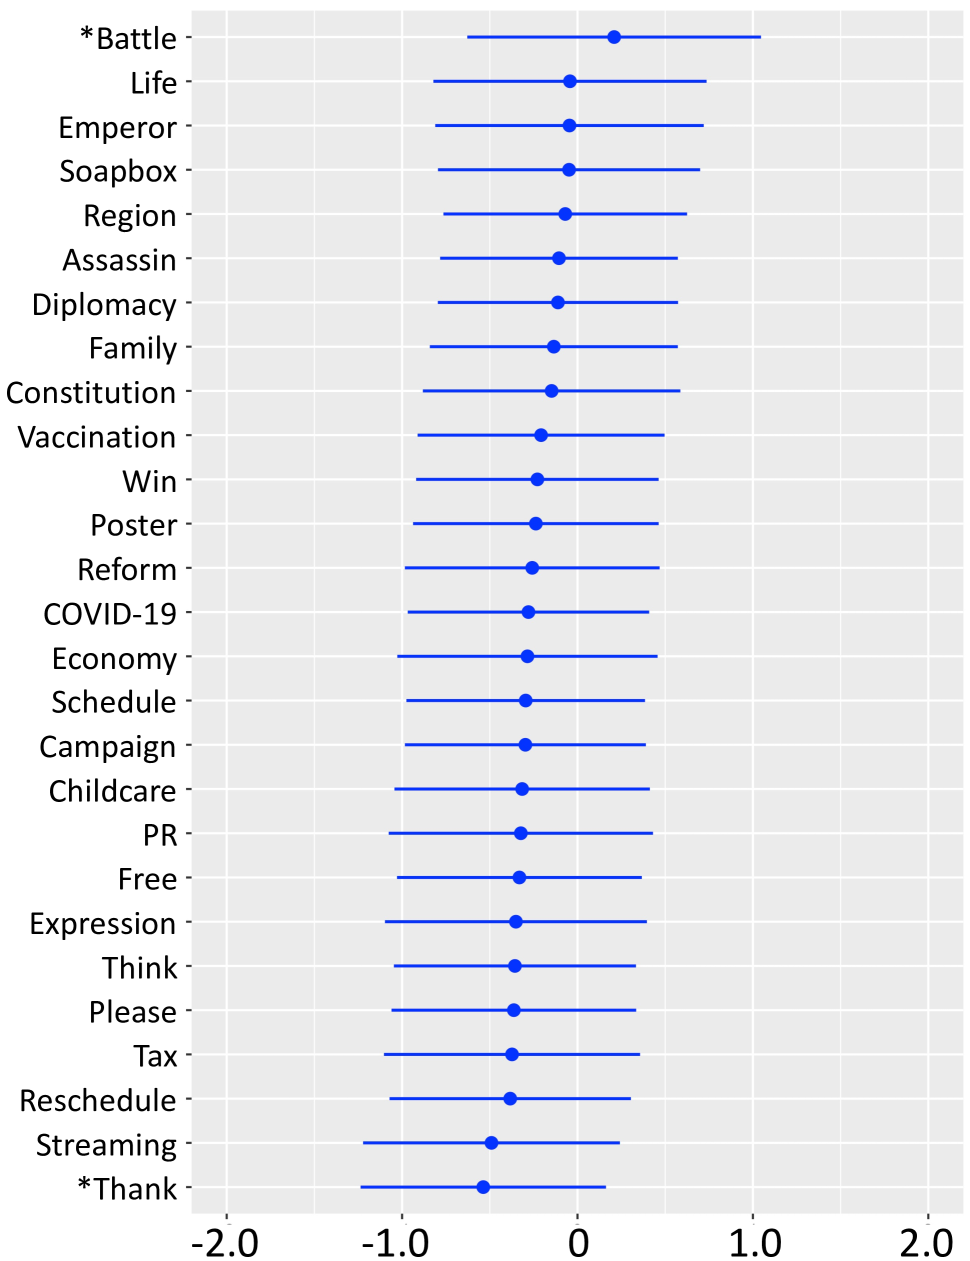
During Election term, topics regarding political policies tend to get more retweets, similar to the characteristics before the election announcement. Just because it is an election period does not necessarily mean that election-related topics such as Campaign (the topic of campaign speech) and Schedule (the topic of reporting upcoming events) are likely to get a lot of retweets. On the other hand, tweets in group E with no obvious election results tend to get more retweets for Soapbox (the topic of their own soapbox oratory) and PR (the topic of the support for proportional representation), suggesting that they are making an effort to spread information about the election. Group W gets retweets, especially for tweets about Assassin, which is the topic of tweets about former Prime Minister Abe’s assassination. They are better than other groups at expressing sympathy and anger over sensational incidents and have gained support. What is interesting is that Please, which is a distinctive topic in group L and PR (Table3), is not a topic that can get retweets. Candidates in these groups frequently ask their followers to vote and retweet, but it indicates that such tweets are unlikely to get a response from followers.
7 RQ4: Is there a difference in the way they communicate with other users on social media?
Figure 3 and 4 showed a significant difference in the level of activity in the use of the reply function in each group in Section 4. This section attempts to analyze the replies that communicate directly with other users and political actors in more detail.
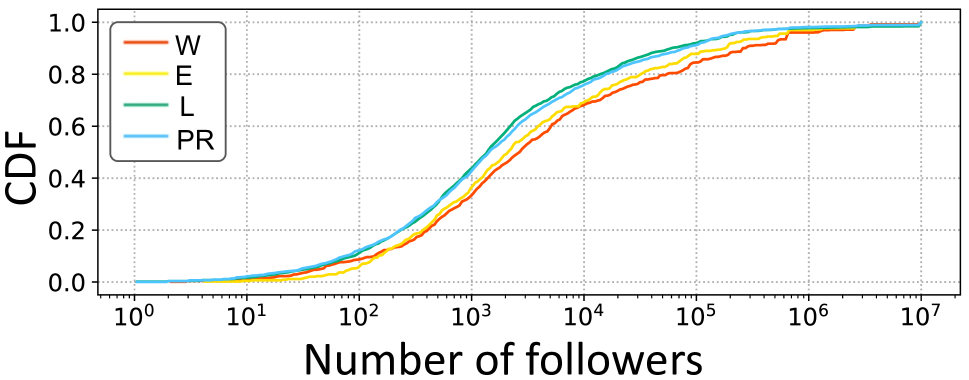
Reply target users: Figure 7 (a) and (b) show the number of the users to whom candidates in each group replied during Pre-Election and Election terms. Similar to the number of replies, groups W and E have far fewer users replied to than groups L and PR. Groups E and W had fewer than 10 users conversing via the reply function during the election period, while some in Group L conversed with more than 10 users. Then, figure 7 (c) shows the cumulative distribution of the number of followers, representing popularity on social media, of reply target users in each group. It represents the tendency of the conversation with users who have a large number of followers, in order of groups W, E, PR, and L. Concretely, while 68.30% of the users conversed with by candidates in group W have less than 10,000 followers, 75.31% of the users conversed with by candidates in group L have less than 10,000 followers. In addition, the verification accounts of the reply target users are 39.54%, 33.00%, 18.51%, and 17.7% in groups W, E, L, and PR, respectively. The percentage of candidates who have had at least one conversation with another candidate among their reply target users is 70.00%, 73.91%, 78.77%, and 72.58% in groups W, E, L, and PR. These results indicate that candidates in groups W and E, where there is above a certain chance of winning, focus more on conversations with users with a verified badge and with many followers than general users. In other words, they are using social media for broadcasting, not for interacting with voters (Graham et al. 2013). The finding that group E, who is in a state of close competition, has fewer interactions with other users than groups L and PR differs from the finding in previous study (Kahn and Kenney 2022), that the more intense the election campaign, the stronger the interaction with voters.

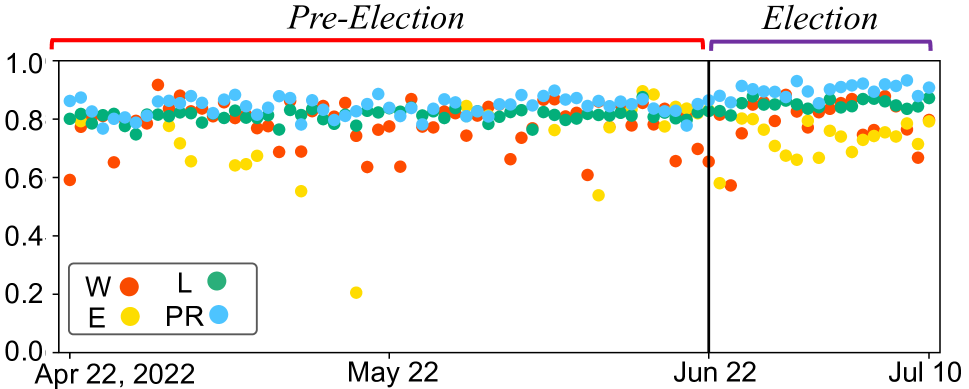
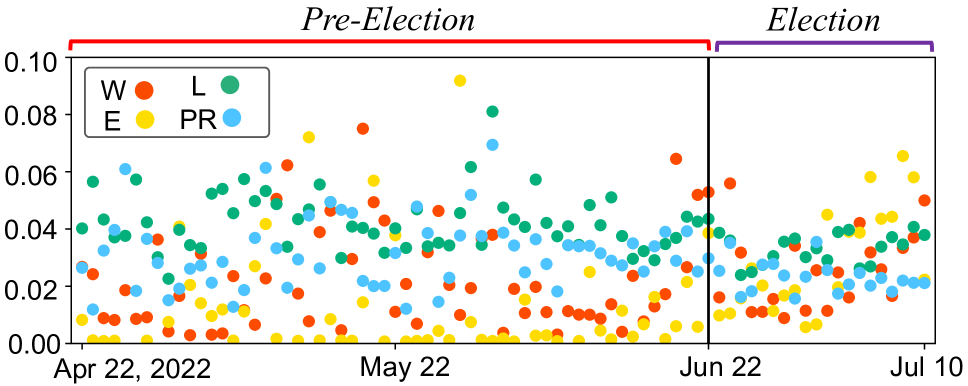
Sentiment and toxicity score in reply tweets The form of presentation such as whether the reply is positive or negative also significantly impacts voters’ impressions (Ferrucci, Hopp, and Vargo 2020). We investigate each group’s replies from two perspectives: sentiment and toxicity. For the sentiment analysis, we use Asari (Hirosan 2019), which returns a sentiment value between 0 and 1 (the closer to 1, the more positive) when a Japanese sentence is inputted. Asari, which is an open-source sentiment quantification model based on SVM, is reported to perform with compelling accuracy as BERT-based models and is faster. For the toxicity analysis, we use Jigsaw’s Perspective API (Jigsaw 2018), which is widely used for hate speech detection, to measure text toxicity using machine learning.
Figure 8 (a) shows the time series of the average score of replies in sentiment. There is a tendency for the average score of replies to increase for Election term than for Pre-Election term for all groups, e.g., the average score of replies in group W increased from 0.786 to 0.821. It means that more candidates are making positive replies during the election period than usual. The comparisons between groups show a high average score in the order of Groups PR, L, W, and E. For example, during Election term, the difference is remarkable, with an average score of 0.897 for group PR compared to 0.820 for Group E. It is interesting to note that the candidates who are more likely to be elected have fewer positive replies than those to run in the proportional representation or with little chance of winning the election.
Figure 8 (b) shows the time series of the average score of replies in toxicity. The change in toxicity scores over the two terms tended to vary by the group; in groups W and E, the toxicity score increases from Pre-Election term to Election term ( and ), while in groups L and PR, it decreases ( and ). The fact that there were more toxic replies in the two groups runs counter to the intuition to be cautious in replying to other users during the elections and requires further investigation.
8 Limitation and future work
This research attempts to shed light on the relationship between the chance of winning an election and candidates’ political communication on social media. However, it is necessary to acknowledge that there are several limitations to be considered. The first limitation is that it is unclear whether our findings targeting candidates in the Japanese election can be generalized to those in other countries. The application of our analysis to candidates’ tweets in other countries may lead to new findings; therefore, the analysis of other countries with different electoral systems and social backgrounds is also expected to be conducted. Second, we used data for the three months prior to the election, but it is not clear whether similar conclusions can be drawn for a period far from the election period or for other events. To clarify this point, it is essential to work with large datasets over a long period in the future. Finally, there is still much room to analyze the tweet contents. Our research focused on the topics, toxicity, and sentiment of their tweets; furthermore, by utilizing natural language processing techniques such as rhetorical analysis, stance detection, or discourse framing, we expect to grasp clues to understand the candidates’ intentions from the text in their tweets.
9 Conclusions
Our study advances our understanding of how the chance of winning an election affects political communication on social media. We grouped election candidates into four groups according to the chance and characterized their social media strategy in terms of users, topics, and reply behavior. Our analysis showed that the attitude with which they engage in political communication and the topics they talk about differ depending on the chance of winning an election. Furthermore, it discovered, as their chances of winning increase, candidates narrow the targets they communicate with, from people in general to the electoral districts and specific persons. Our findings highlighting candidate behavior from a new perspective are helpful for future election strategies.
Ethical Considerations
The data in this paper is derived from publicly-accessible user-generated content. We pay the utmost attention to the privacy of individuals in this study. When sharing our twitter data, we will publish only a list of tweet IDs.
Acknowledgement
This work was supported by JSPS KAKENHI Grant-in-Aid for Scientific Research Number JP20H00585, JP21H03446, JP22K20159, JP23K16889, NICT 03501, MIC/SCOPE JP192107004, JST-AIP JPMJCR21U4.
References
- Ahmed and Skoric (2014) Ahmed, S.; and Skoric, M. M. 2014. My name is Khan: the use of Twitter in the campaign for 2013 Pakistan General Election. In 2014 47th Hawaii International Conference on System Sciences, 2242–2251. IEEE.
- Ballard et al. (2022) Ballard, A. O.; DeTamble, R.; Dorsey, S.; Heseltine, M.; and Johnson, M. 2022. Dynamics of polarizing rhetoric in congressional tweets. Legislative Studies Quarterly.
- Barberá et al. (2015) Barberá, P.; Jost, J. T.; Nagler, J.; Tucker, J. A.; and Bonneau, R. 2015. Tweeting from left to right: Is online political communication more than an echo chamber? Psychological science, 26(10): 1531–1542.
- Barberá and Rivero (2015) Barberá, P.; and Rivero, G. 2015. Understanding the political representativeness of Twitter users. Social Science Computer Review, 33(6): 712–729.
- Bates et al. (2014) Bates, D.; Mächler, M.; Bolker, B.; and Walker, S. 2014. Fitting linear mixed-effects models using lme4. arXiv preprint arXiv:1406.5823.
- Blassnig et al. (2021) Blassnig, S.; Udris, L.; Staender, A.; and Vogler, D. 2021. Popularity on Facebook during election campaigns: An analysis of issues and emotions in parties’ online communication. International Journal of Communication, 15: 21.
- Blassnig and Wirz (2019) Blassnig, S.; and Wirz, D. S. 2019. Populist and popular: An experiment on the drivers of user reactions to populist posts on Facebook. Social Media+ Society, 5(4): 2056305119890062.
- Blei, Ng, and Jordan (2003) Blei, D. M.; Ng, A. Y.; and Jordan, M. I. 2003. Latent dirichlet allocation. Journal of machine Learning research, 3(Jan): 993–1022.
- Bobba (2019) Bobba, G. 2019. Social media populism: features and ‘likeability’of Lega Nord communication on Facebook. European Political Science, 18(1): 11–23.
- Bode and Dalrymple (2016) Bode, L.; and Dalrymple, K. E. 2016. Politics in 140 characters or less: Campaign communication, network interaction, and political participation on Twitter. Journal of Political Marketing, 15(4): 311–332.
- Boireau (2014) Boireau, M. 2014. Determining political stances from twitter timelines: The belgian parliament case. In Proceedings of the 2014 Conference on Electronic Governance and Open Society: Challenges in Eurasia, 145–151.
- Bovet, Morone, and Makse (2018) Bovet, A.; Morone, F.; and Makse, H. A. 2018. Validation of Twitter opinion trends with national polling aggregates: Hillary Clinton vs Donald Trump. Scientific reports, 8(1): 1–16.
- Burnap et al. (2016) Burnap, P.; Gibson, R.; Sloan, L.; Southern, R.; and Williams, M. 2016. 140 characters to victory?: Using Twitter to predict the UK 2015 General Election. Electoral Studies, 41: 230–233.
- Center (2016) Center, P. R. 2016. The 2016 Presidential Campaign – a News Event That’s Hard to Miss. https://www.pewresearch.org/journalism/2016/02/04/the-2016-presidential-campaign-a-news-event-thats-hard-to-miss/.
- Chadwick (2008) Chadwick, A. 2008. Web 2.0: New challenges for the study of e-democracy in an era of informational exuberance. Isjlp, 5: 9.
- Election.com (2022) Election.com. 2022. 83% of Candidates are on Twitter, and YouTube and Instagram are up significantly! Trends in Use of Online Election Tools by Candidates for House of Councillors Election 2022. https://go2senkyo.com/articles/2022/07/01/69336.html.
- Elghazaly, Mahmoud, and Hefny (2016) Elghazaly, T.; Mahmoud, A.; and Hefny, H. A. 2016. Political sentiment analysis using twitter data. In Proceedings of the International Conference on Internet of things and Cloud Computing, 1–5.
- Farkas and Bene (2021) Farkas, X.; and Bene, M. 2021. Images, politicians, and social media: Patterns and effects of politicians’ image-based political communication strategies on social media. The international journal of press/politics, 26(1): 119–142.
- Ferrucci, Hopp, and Vargo (2020) Ferrucci, P.; Hopp, T.; and Vargo, C. J. 2020. Civic engagement, social capital, and ideological extremity: Exploring online political engagement and political expression on Facebook. New Media & Society, 22(6): 1095–1115.
- Gelman and Hill (2006) Gelman, A.; and Hill, J. 2006. Data analysis using regression and multilevel/hierarchical models. Cambridge university press.
- Gibson, Greffet, and Cantijoch (2018) Gibson, R.; Greffet, F.; and Cantijoch, M. 2018. Friend or foe? Digital technologies and the changing nature of party membership. In Digital Politics: Mobilization, Engagement and Participation, 89–111. Routledge.
- Goulding (2016) Goulding, T. 2016. The most tweeted about topic of 2016 has been revealed. https://www.independent.co.uk/news/twitter-most-tweeted-moments-2016-donald-trump-brexit-black-lives-matter-rio-a7466236.html.
- Graham et al. (2013) Graham, T.; Broersma, M.; Hazelhoff, K.; and Van’t Haar, G. 2013. Between broadcasting political messages and interacting with voters: The use of Twitter during the 2010 UK general election campaign. Information, communication & society, 16(5): 692–716.
- Greenwood and Nikulin (1996) Greenwood, P. E.; and Nikulin, M. S. 1996. A guide to chi-squared testing, volume 280. John Wiley & Sons.
- Haq et al. (2020) Haq, E. U.; Braud, T.; Kwon, Y. D.; and Hui, P. 2020. A survey on computational politics. IEEE Access, 8: 197379–197406.
- Heiss, Schmuck, and Matthes (2019) Heiss, R.; Schmuck, D.; and Matthes, J. 2019. What drives interaction in political actors’ Facebook posts? Profile and content predictors of user engagement and political actors’ reactions. Information, communication & society, 22(10): 1497–1513.
- Hirosan (2019) Hirosan. 2019. Hironsan/asari: Japanese sentiment analyzer implemented in Python. https://github.com/Hironsan/asari.
- Jain et al. (2021) Jain, N.; Malviya, P.; Singh, P.; and Mukherjee, S. 2021. Twitter mediated Sociopolitical communication during the COVID-19 pandemic crisis in India. Frontiers in psychology, 12.
- Jigsaw (2018) Jigsaw. 2018. Perspective API. https://www.perspectiveapi.com/.
- Jungherr (2016) Jungherr, A. 2016. Twitter use in election campaigns: A systematic literature review. Journal of information technology & politics, 13(1): 72–91.
- Jungherr et al. (2017) Jungherr, A.; Schoen, H.; Posegga, O.; and Jürgens, P. 2017. Digital trace data in the study of public opinion: An indicator of attention toward politics rather than political support. Social Science Computer Review, 35(3): 336–356.
- Jürgens, Jungherr, and Schoen (2011) Jürgens, P.; Jungherr, A.; and Schoen, H. 2011. Small worlds with a difference: New gatekeepers and the filtering of political information on Twitter. In Proceedings of the 3rd international web science conference, 1–5.
- Kahn and Kenney (2022) Kahn, K. F.; and Kenney, P. J. 2022. The spectacle of US Senate campaigns. In The Spectacle of US Senate Campaigns. Princeton University Press.
- Keller and Kleinen-von Königslöw (2018) Keller, T. R.; and Kleinen-von Königslöw, K. 2018. Followers, spread the message! Predicting the success of Swiss politicians on Facebook and Twitter. Social Media+ Society, 4(1): 2056305118765733.
- Kitunzi, Helen, and Consolate (2016) Kitunzi, H.; Helen, M.; and Consolate, G. 2016. Influence of awareness on the usage of motor third party insurance: a case study of Kampala district. African health sciences, 16(4): 1169–1173.
- Klinger and Svensson (2015) Klinger, U.; and Svensson, J. 2015. The emergence of network media logic in political communication: A theoretical approach. New media & society, 17(8): 1241–1257.
- Knoll, Matthes, and Heiss (2020) Knoll, J.; Matthes, J.; and Heiss, R. 2020. The social media political participation model: A goal systems theory perspective. Convergence, 26(1): 135–156.
- Kovic et al. (2020) Kovic, M.; Rauchfleisch, A.; Metag, J.; Caspar, C.; and Szenogrady, J. 2020. Brute force effects of mass media presence and social media activity on electoral outcome. In Social Media Campaigning in Europe, 56–79. Routledge.
- Kulshrestha, Shah, and Lu (2017) Kulshrestha, A.; Shah, A.; and Lu, D. 2017. Politically predictive potential of social networks: Twitter and the indian general election 2014. In Proceedings of the 4th Multidisciplinary International Social Networks Conference, 1–10.
- Magin et al. (2017) Magin, M.; Podschuweit, N.; Haßler, J.; and Russmann, U. 2017. Campaigning in the fourth age of political communication. A multi-method study on the use of Facebook by German and Austrian parties in the 2013 national election campaigns. Information, communication & society, 20(11): 1698–1719.
- Mann and Whitney (1947) Mann, H. B.; and Whitney, D. R. 1947. On a test of whether one of two random variables is stochastically larger than the other. The annals of mathematical statistics, 50–60.
- Morstatter et al. (2018) Morstatter, F.; Shao, Y.; Galstyan, A.; and Karunasekera, S. 2018. From alt-right to alt-rechts: Twitter analysis of the 2017 german federal election. In Companion Proceedings of the The Web Conference 2018, 621–628.
- MSNBC (2014) MSNBC. 2014. How fusion voting played a role in American politics. https://www.msnbc.com/the-daily-rundown/fusion-votings-role-american-politics-msna299301.
- NHK (2022) NHK. 2022. Musk calls Twitter ’Japan-centric’ given high number of users — NHKWORLD-JAPAN News. https://www3.nhk.or.jp/nhkworld/en/news/20221123˙10.
- Papacharissi (2004) Papacharissi, Z. 2004. Democracy online: Civility, politeness, and the democratic potential of online political discussion groups. New media & society, 6(2): 259–283.
- Paul et al. (2017) Paul, D.; Li, F.; Teja, M. K.; Yu, X.; and Frost, R. 2017. Compass: Spatio temporal sentiment analysis of US election what twitter says! In Proceedings of the 23rd ACM SIGKDD international conference on knowledge discovery and data mining, 1585–1594.
- Pfeffer et al. (2022) Pfeffer, J.; Mooseder, A.; Hammer, L.; Stritzel, O.; and Garcia, D. 2022. This Sample seems to be good enough! Assessing Coverage and Temporal Reliability of Twitter’s Academic API. arXiv preprint arXiv:2204.02290.
- Popa et al. (2020) Popa, S. A.; Fazekas, Z.; Braun, D.; and Leidecker-Sandmann, M.-M. 2020. Informing the public: How party communication builds opportunity structures. Political Communication, 37(3): 329–349.
- Shimbun (2022) Shimbun, A. 2022. House of Councillors Election 2022 Asahi Situation Survey. #https://www.asahi.com/senkyo/saninsen/2022/josei.html.
- Stier et al. (2020) Stier, S.; Kirkizh, N.; Froio, C.; and Schroeder, R. 2020. Populist attitudes and selective exposure to online news: A cross-country analysis combining web tracking and surveys. The International Journal of Press/Politics, 25(3): 426–446.
- Taylor (2012) Taylor, G. 2012. ELECTION 2012: Third-party candidacies: Rarely successful, often influential. https://www.washingtontimes.com/news/2012/nov/6/third-party-candidacies-rarely-successful-often-in/.
- Tumasjan et al. (2010) Tumasjan, A.; Sprenger, T.; Sandner, P.; and Welpe, I. 2010. Predicting elections with twitter: What 140 characters reveal about political sentiment. In Proceedings of the International AAAI Conference on Web and Social Media, volume 4, 178–185.
- Usui, Yoshida, and Toriumi (2018) Usui, S.; Yoshida, M.; and Toriumi, F. 2018. Analysis of Information Polarization During Japan’s 2017 Election. In 2018 IEEE International Conference on Big Data (Big Data), 4383–4386. IEEE.
- Uysal and Croft (2011) Uysal, I.; and Croft, W. B. 2011. User oriented tweet ranking: a filtering approach to microblogs. In Proceedings of the 20th ACM international conference on Information and knowledge management, 2261–2264.
- Vaccari and Valeriani (2015) Vaccari, C.; and Valeriani, A. 2015. Follow the leader! Direct and indirect flows of political communication during the 2013 Italian general election campaign. New media & society, 17(7): 1025–1042.
- WorldTribune (2022) WorldTribune. 2022. China celebrated his assassination, but Abe’s legacy surged in Japan elections. https://www.worldtribune.com/china-celebrated-his-assassination-but-abes-legacy-surged-in-japan-elections/.
- Xenos, Macafee, and Pole (2017) Xenos, M. A.; Macafee, T.; and Pole, A. 2017. Understanding variations in user response to social media campaigns: A study of Facebook posts in the 2010 US elections. new media & society, 19(6): 826–842.
- Yan et al. (2013) Yan, X.; Guo, J.; Lan, Y.; and Cheng, X. 2013. A biterm topic model for short texts. In Proceedings of the 22nd international conference on World Wide Web, 1445–1456.
- Yoshida and Toriumi (2018) Yoshida, M.; and Toriumi, F. 2018. Information diffusion power of political party twitter accounts during japan’s 2017 election. In International Conference on Social Informatics, 334–342. Springer.