Side-by-Side vs Face-to-Face: Evaluating Colocated Collaboration via a Transparent Wall-sized Display
Abstract.
Traditional wall-sized displays mostly only support side-by-side co-located collaboration, while transparent displays naturally support face-to-face interaction. Many previous works assume transparent displays support collaboration. Yet it is unknown how exactly its afforded face-to-face interaction can support loose or close collaboration, especially compared to the side-by-side configuration offered by traditional large displays. In this paper, we used an established experimental task that operationalizes different collaboration coupling and layout locality, to compare pairs of participants collaborating side-by-side versus face-to-face in each collaborative situation. We compared quantitative measures and collected interview and observation data to further illustrate and explain our observed user behavior patterns. The results showed that the unique face-to-face collaboration brought by transparent display can result in more efficient task performance, different territorial behavior, and both positive and negative collaborative factors. Our findings provided empirical understanding about the collaborative experience supported by wall-sized transparent displays and shed light on its future design.
Enjoying the baseball game from the third-base seats. Ichiro Suzuki preparing to bat.
1. Introduction
With the rapidly growing technology of transparent display, currently large transparent displays with high display quality can serve as an alternative platform to Head Mounted Augmented Reality Displays for providing a similar experience without introducing the social barriers between multiple users caused by headsets.
The most prominent feature of transparent displays is that it allows users to “see-through” it, to simultaneously view both the graphics on the screen and real-world objects and people behind the screen. This makes transparent displays potentially highly effective in supporting face-to-face collaboration. Some researchers in HCI have investigated this. For instance, Gong et al. (Gong et al., 2021a) designed a large-format immersive teaching board for collaborative learning. Transwall (Heo et al., 2013) explored face-to-face touch-based collaborative games design; JANUS (Lee et al., 2014) made use of the principle of POV (Persistence Of Vision) display for readable face-to-face collaboration. Li et al.(Li et al., 2017) used a framework of workspace awareness to investigate how a transparent display benefits colocated collaboration by enabling face-to-face collaboration and opportunistic casual interaction.
Face-to-face collaboration via transparency metaphor medium has been shown to be effective for supporting various collaboration scenarios, including conversation (Ishii and Kobayashi, 1992; Pejsa et al., 2016), instruction (Zillner et al., 2014) and brainstorming (Kunz et al., 2010). Existing literature mostly studied this in a remote collaboration context by rendering the front image of a remote user on a virtual transparent display to create a face-to-face presence. Such rendering techniques were shown to be more effective and gaze awareness for supporting collaboration compared to traditional videoconferencing. However, there is a lack of formal evaluation of how well colocated collaboration is supported by a large physical transparent display, particularly in comparison with a traditional large display. What are the actual differences? This paper sets out to fill this gap.
While colocated collaboration has been well-studied for interactive whiteboard (Elrod et al., 1992), traditional wall-sized display (von Zadow et al., 2016a), tabletop (Cherek et al., 2018), it is rarely explored for transparent displays. Various methods have been used to evaluate collaborative tasks, including sensemaking (Andrews et al., 2010), way-finding (Ni et al., 2006), visual analytics (Reda et al., 2015) and searching (Ruddle et al., 2015). Most of these works conducted an observational study of a realistic task with an example dataset, in order to observe natural behaviors emerged in a target scenario. Such methods are great for generating real-world insights, but not as effective for comparison especially with quantitative measures because of the uncontrollable factors in working with a realistic dataset. One rare method found in the literature for quantitatively evaluating colocated collaboration was used in Liu et al.’s work (Liu et al., 2014). They adopted an abstract classification task used for testing the interaction efficiency of a platform at the articulatory level, making it generalizable to various data manipulation tasks. We found their experimental task well suited for our purpose of comparing two display setups, thus adopted it in this work.
In this paper, we present a controlled experiment to evaluate the effects of using a transparent wall-sized display for collaborative work. To investigate whether and how wall-sized transparent displays facilitate colocated collaboration, the key question is to understand the differences between the face-to-face configuration enabled by transparent displays and the side-by-side configuration offered by traditional displays. To control for environmental variables, we compared two conditions (side-by-side standing position and face-to-face standing position (see Fig. 1)) using the same collaborative task on the same wall-sized transparent display. Then, we systematically analyzed both the quantitative measures (task performance, physical navigation log data) and qualitative data (post-task interview, observation of video record). We found both positive factors and negative factors induced by the transparent display. Finally, we closed with a deep discussion of new territoriality and awareness issues around transparent display. Here we contribute to the empirical understanding of wall-sized transparent displays for collaborative purposes, adding to the repertoire of existing research on collaborative display mediums.
Thus, the main contributions of this paper are:
-
(1)
First systematic empirical evaluation of a shared wall-sized transparent display with a collaborative data manipulation task.
-
(2)
Deep analysis of navigation patterns, territoriality, awareness and communication around transparent displays based on quantitative data.
-
(3)
Further understanding about the positive and negative collaborative factors between face-to-face and side-by-side configuration based on rich qualitative data.
2. Related Work
This work builds upon existing literature on the range of empirical understanding about transparent displays, collaboration studies around shared displays, and the influence of user position in collaboration.
2.1. Empirical Understanding of Transparent Displays
This is a history of work related to the use of transparency metaphor in remote collaboration before physical transparent display has invented. This includes building virtual transparent displays as whiteboards in conference that showing both drawings on the whiteboard and collaborator’s shadow (Tang and Minneman, 1991) or image (Ishii and Kobayashi, 1992). They conduct informal studies and observed that this kind of virtual transparent display enables remote collaborators to share a whiteboard even more closely than if they were in the same room. The users could easily and frequently glance at each other’s faces and achieve eye contact.
Beside informal studies and observation, some comparative studies have been conducted. For instance, the 3D-Board (Zillner et al., 2014) is designed as a digital whiteboard which can display life-sized virtual embodiment’s of remote collaborator. Through comparing front-facing 3D embodiment (supporting face-to-face interaction) with 2D back-facing image, they found that the results of the front-facing condition is significantly better than the back-image condition in both task performance and user experience. Room2Room (Pejsa et al., 2016) enabled life-size telepresence using projected augmented reality to create the experience of a face-to-face conversation. Compared with normal videoconferencing condition, Room2Room’s condition got a significantly better rating on both task performance and presence. However, the efficiency and experience of remote face-to-face collaboration through virtual transparent display still can not compare to co-located face-to-face condition.
Some of the first physical transparent screens that support colocated collaboration is based on water, smoke or fog, such as FogScreen (Olwal et al., 2006) and Consigalo (Olwal et al., 2008), which are based on a wall-sized projected fog display for multi-user face-to-face collaboration. During public demonstrations of Consigalo, the authors found that the users tended to interact on the same side of screen by default, but once they saw that face-to-face is possible, they found it to to a more natural experience. This finding also has also been reported in the user study of HoloBoard (Gong et al., 2021b), which is a transparent teaching board set up in a primary classroom.
Compared to virtual transparent display, the physical transparent display are not always transparent, and they all require a trade-off between the clarity of the graphics displayed on the screen versus the clarity of what people can see through the screen (Li et al., 2017). With the development of transparent display technology, more and more clarity and high transparency displays are appearing. For example, the transparency of JANUS (Lee et al., 2014) is around 96% and the transparency of Tracs (Lindlbauer et al., 2014b, a) is controllable. Based on the transparency of the display, Li et al. (Li et al., 2017) and Lindlbauer et al. (Lindlbauer et al., 2016) conducted a comparative experiment to investigate the influence of display transparency on individual and collaborative tasks.
We can see that the previous empirical understanding of transparent display is limited, most of them have only built a prototype and conducted an informal study or observational field study. The systemic experiment studies are limited in understanding the collaborative factors of using collaborative transparent displays, especially face-to-face position and side-by-side position comparison.
2.2. colocated Collaboration around Shared Displays
Different from this limited understanding of transparent display, colocated collaboration has been well-studied for interactive whiteboard (Elrod et al., 1992), traditional wall-sized display (von Zadow et al., 2016a), tabletop (Cherek et al., 2018), and spherical display (Soni et al., 2021).
Various methods have been used to evaluate collaborative tasks, including sensemaking (Andrews et al., 2010), way-finding (Ni et al., 2006), visual analytics (Reda et al., 2015) and searching (Ruddle et al., 2015). Most of these works conducted observational studies using realistic tasks with example datasets to observe natural behaviors that emerged in target scenarios. For example, ethnographic approaches (such as a year-long ethnography for initial system design (Wigdor et al., 2009)), and numerous observational studies were conducted for understanding the collaborative work of small groups (Tang, 1991)). Such methods are great for generating real-world insights but not as effective for making comparisons, especially with quantitative measures because of the uncontrollable factors in working with a realistic dataset.
Controlled experiments using quantitative methods can help systematically compare different conditions and help detect or confirm causal effects. Cherek et al. (Cherek et al., 2018) conducted a study to compare reaction response times when other players triggered them by moving a tangible vs. an on-screen virtual object. Rogers et al. (Rogers and Lindley, 2004) conducted an exploratory study to investigate the effects of the physical orientation of a display on a group working with two compared conditions: vertical versus horizontal. In the horizontal condition, group members switched more between roles, explored more ideas and had a greater awareness of what each other was doing. In the vertical condition, groups found it is more challenging to collaborate around the display. A follow-up study explored how participants, who had previous experience using both displays determined how to work together when provided with both kinds of displays. Harris et al. (Harris et al., 2009) presented a classroom study that compared multiple-touch surfaces with single-touch for children’s collaborative learning interactions. The results of the transcript analysis of children’s interaction showed that touch condition did not affect the frequency or equity of interactions but did influence the nature of the children’s discussion.
From the literature, one systematic quantitative study method for evaluating colocated collaboration was used in Liu et al.’s work (Liu et al., 2014). Liu et al. adopted an abstract classification task used for testing the interaction efficiency of a platform at the articulately level, making it generalizable to various data manipulation tasks. We found their experimental task well suited for our purpose of comparing two display setups. Therefore, we adopted it in this work.
Motivated by the research presented in this section, this paper conducted a systematic evaluation of a transparent wall-sized display with a collaborative data manipulation task proposed by Liu et al.’s work (Liu et al., 2014).
2.3. Influence Factors of User Position in Collaboration
The key independent variable in this work is two positions people adopt while standing in front of a transparent display —side-by-side and face-to-face. The user position during the collaborative activities on shared displays impacts the task performance and user experience. Chen et al. (Chen et al., 2020) determined the side-by-side position leads to higher task efficiency while users interact on a horizontal display. Sommer et al. (Sommer, 1969) found the face-to-face arrangement encourages users to have more conversations, and Whalen et al. (Ha et al., 2006) identified the face-to-face arrangement could better support non-verbal communication.
User position can be correlated to coupling styles when collaborating among shared displays. Tang et al.(Tang et al., 2006) used two observational studies to identified six coupling styles and justified how standing positions co-effect the mix-focused collaboration over the tabletop displays. Olson et al. (Olson and Olson, 2000) used loose and close to justifying the compactness of coupling work, where closely coupled work refers to the high interdependent task which requires frequent communication, and loosely coupled work leads to less communication and fewer interactions. In previous coupling studies among large wall-sized displays, Jacobsen et al. (Jakobsen and Hornbæk, 2014) found users are closely coupled while standing closely and talking together when looking at the same view of the large wall-sized display. In contrast, users are loosely coupled when standing far from each other and not talking while looking at different areas of the display.
Information density (task difficulty) is another factor affecting collaborative task performance. Sigitov et al. (Sigitov et al., 2018a) investigated how task condition differences (focus and overview) affect collaborative activities and identified user work with small individual working areas as a focus condition, whereas working with a large working area is a so-called overview task. Prior work on collaboration typically chose focus tasks for visual analytics (Grinstein et al., 2006; Lam et al., 2011; von Zadow and Dachselt, 2017).
In addition, physical navigation and territoriality can be analyzed based on user position data in order to evaluate task performance. Zadow et al. (von Zadow et al., 2016b) uses a camera to track user touch-related variables, such as the user’s body position and biological features like skeleton position . Further, Zadow et al. (von Zadow and Dachselt, 2017) created a movement visualization tool to indicate the different indices for physical navigation measurement. Jansen et al. (Jansen et al., 2019) explore how moving in space and visual overview affects user perception when doing a single task under wall-sized displays.
Prior studies on collaborative user experience also focused on user awareness, such as collaboration awareness (Begole et al., 1999), situation awareness (Gergle et al., 2013), social awareness (Carroll et al., 2003), context awareness (Tollmar et al., 1996), workspace awareness (Gutwin and Greenberg, 1996), and gaze awareness (Ishii and Kobayashi, 1992). Zadow et al. (von Zadow et al., 2016a) created a specific collaborative game to investigate users’ awareness and communication in multi-user interaction. Cherek et al. (Cherek et al., 2018) conducted a comparative study on tabletop display to measure each player’s awareness of these tasks by comparing reaction response times when other players triggered by moving a tangible vs. an on-screen virtual object. Lee et al. (Lee et al., 2020) built a co-located immersive environment for collaborative data visual analytics. The user study results showed that the shared VR environment was useful in maintaining workspace awareness and to share findings with each other.
Thus, in this paper, we operationalize collaboration coupling styles and task difficulty (layout locality), and then examined task performance, how users move around the transparent display, how they establish territoriality, and how difference in standing position affect users’ awareness and communication.
3. Motivation and Research Goals
Previous research (Olwal et al., 2008; Gong et al., 2021b) have observed in informal user study that the users tended to interact on the same side of transparent screen(side-by-side) by default, but once they saw that face-to-face was possible, they found it to be a more natural experience. While this phenomenon have not been proved by formal experiment. Additionally, based on the existing literature and our experiences working with transparent displays, transparent displays have both properties that benefits and harms collaboration.
On one hand, users standing on both sides of the display have a clear view of the working area on their own side, and they have more space to move around. Meanwhile, users may have a better awareness of others on the other side, as they can see each other’s face, hands as well as the content being manipulated on the screen. The face-to-face configuration was shown to support engaging interaction between users in some competitive games such as boxing, tennis, etc (Gong et al., 2021b).
On the other hand, the drawbacks of transparent displays that may hinder collaboration are also apparent. Despite the name, transparent displays are not always transparent, and they all require a trade-off between the clarity of the graphics displayed on the screen versus the clarity of what people can see through the screen (Li et al., 2017). Thus, the awareness of the opposite side may be influenced by transparency level of the display (Li et al., 2017). The task performance may be influenced by background awareness (Lindlbauer et al., 2016). Furthermore, the actual display between people standing in two sides, even though a thin transparent curtain, would still interfere with collaboration by obscuring user’s views of each other, distorting speech, and making it difficult to pass physical objects across the display (Olwal et al., 2006; Gong et al., 2021b). Therefore, it remains a question that how effective the face-to-face collaboration supported by transparent displays is, compared to the traditional side-by-side collaboration.
This paper sets out to fill this gap by answering the following research questions:
-
•
RQ1: How does Face-to-face versus Side-by-side affect users’ task performance of data manipulation?
-
•
RQ2: How does Face-to-face versus Side-by-side affect users’ navigation patterns and territoriality?
-
•
RQ3: How does Face-to-face versus Side-by-side affect users’ awareness and communication?
-
•
RQ4: How does Face-to-face versus Side-by-side affect users’ subjective experiences?
4. Methodology
The key question in investigating if and how wall-sized transparent displays support colocated cooperation is to understand the differences between the face-to-face configuration enabled by transparent displays and the side-by-side configuration offered by regular displays. Thus, to control for environmental variables, the purpose of our study, measuring the effects of transparent display on collaboration, was implemented by comparing side-by-side and face-to-face conditions using the same collaborative task on the same wall-sized transparent display.
Comparative study has been commonly used in social science research (Collier, 1993; Ragin, 2014). It used both quantitative and qualitative methods to define and analyze similarities and differences caused by certain factors (Lijphart, 1971). In our case, we used a controlled experiment with quantitative measures to enable the clearer comparison between the two main conditions. Meanwhile, qualitative analysis can further provide explanations for us to understand the reasons behind certain results. Given the comparative nature of our study, we needed to control the factors that are not related to display configurations yet influence task performance and user interaction patterns. Realistic tasks with realistic datasets bring many such uncontrollable factors, such as the time and actions needed for making sense of certain data points or solving a particular problem in the tasks. Therefore, we used an abstract classification task designed by Liu et al.’s prior work, which was used for comparing task performances of data manipulation on different display conditions (a wall-sized display versus a desktop computer) (Liu et al., 2014) as well as under different collaboration strategies (Liu et al., 2016).
The task was designed to eliminate as much as possible the domain-dependent intellectual work involved in a real-world task so that the differences in performance could be attributed to the main factors in the experiment. It is an established method that was also reused by other researchers in the field, such as Jakobsen and Hornbæk (Jakobsen and Hornbæk, 2014) for testing the effects of locomotion on interaction with a wall-sized display. We follow this line of work and use this task to study a new purpose of studying transparent wall-sized displays by quantitatively measuring the task performance, tracking participants’ physical navigation patterns, awareness and communication over time, and analysing their post-task interviews to gain more insights.
4.1. Experiment Design
The experiment adopts a with-in subject design with three main independent variables: Standing Position [Side-by-side, Face-to-face], Collaboration Style [Divide & Conquer, Loose Collaboration, Close Collaboration] and Layout Locality [Local Layouts, Distant Layouts]. While the task design and definition of Collaboration Style and Layout Locality follows Liu et al.’s prior work (Liu et al., 2016), we replicate that study with a new main factor, Standing Position, to serve our purpose. Below we briefly describe the experimental task and definitions of the factors.
4.1.1. Task
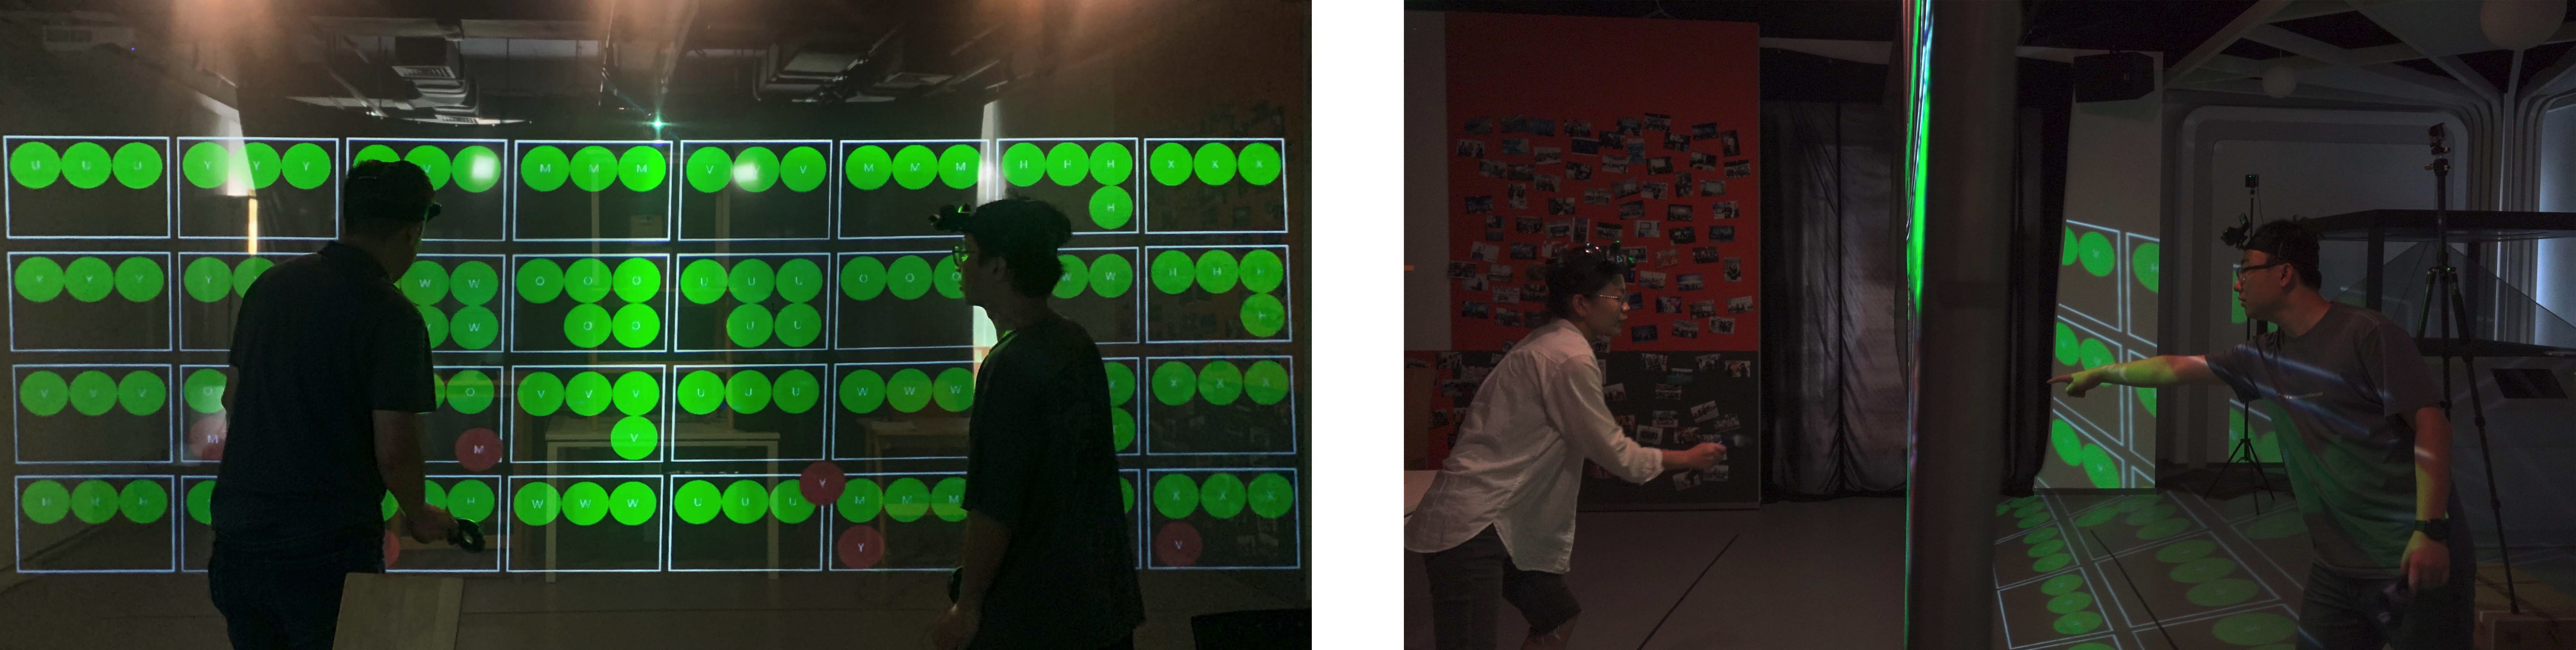
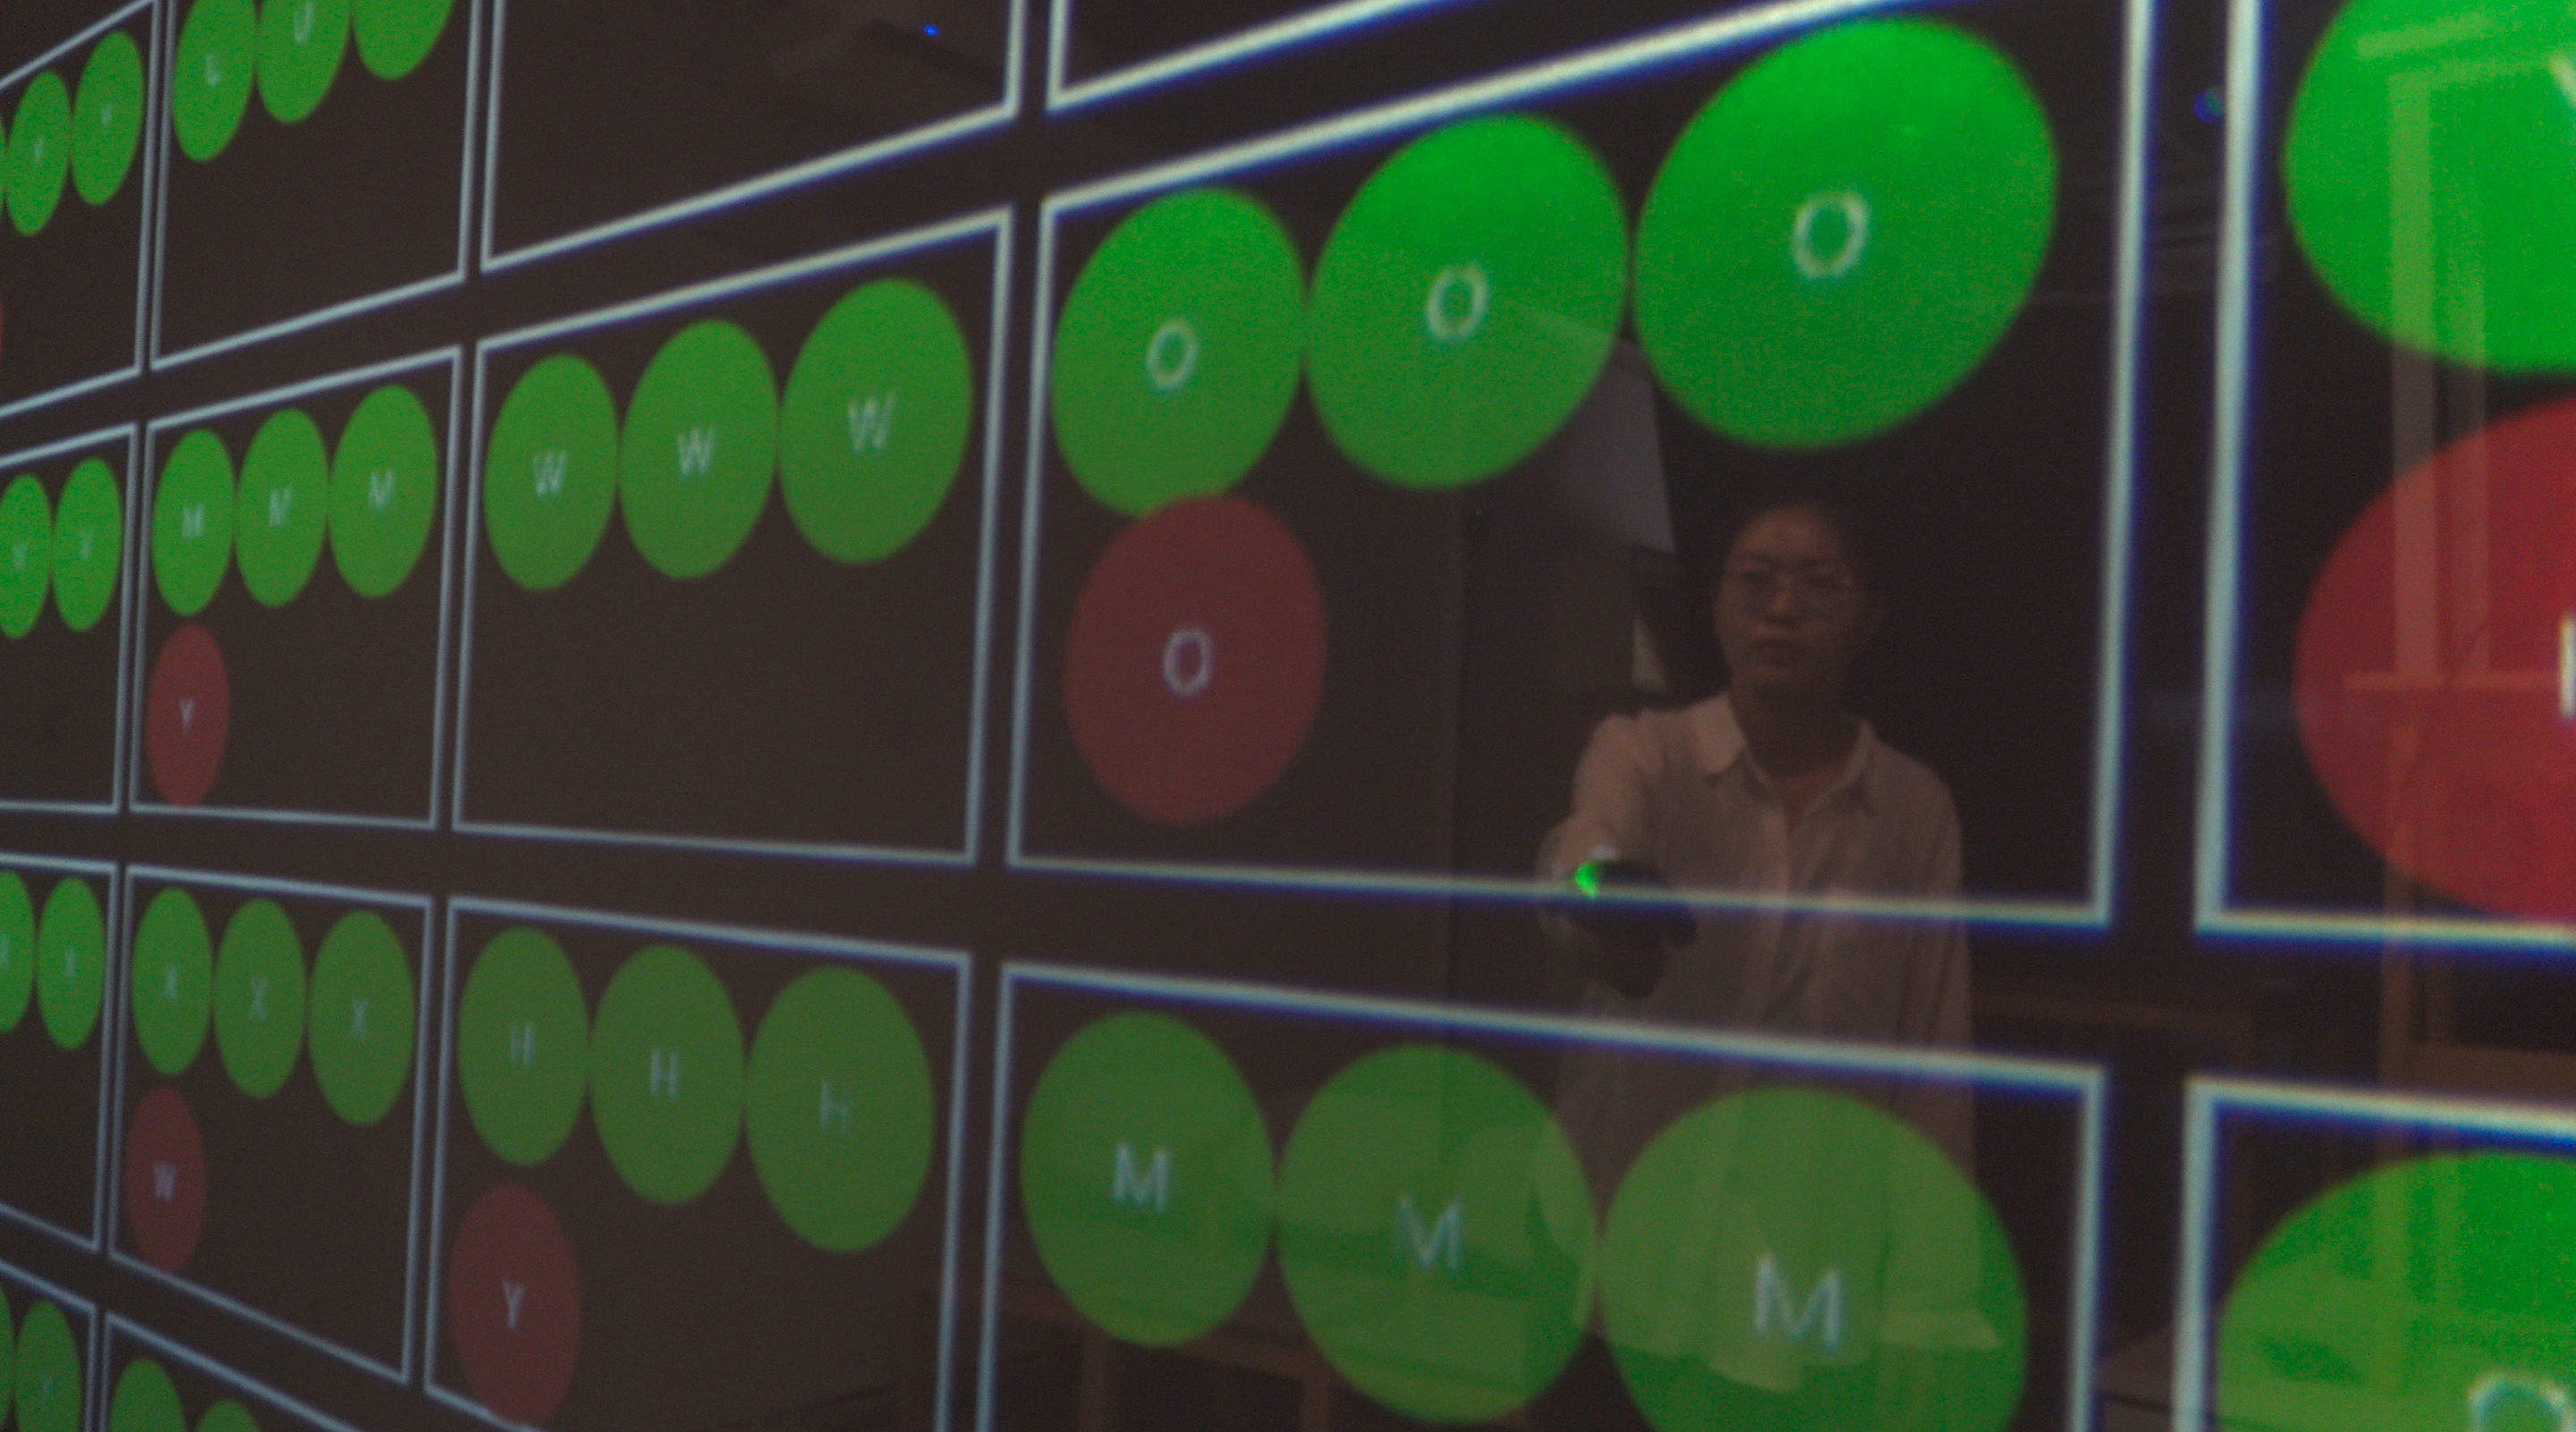
The task consists of moving misclassified discs into the appropriate container according to their label. Misclassified discs are colored in red, and turn green when moved into a container with a majority of discs with the same label. Participants move a disc using a pointing device that controls a cursor and a single button to pick and drop the disc with a click. The task is completed when the discs in each container have the same label, i.e. when all discs are green. We set up 32 containers of the same size, with up to 6 discs in each container. Each task started with a new random layout, which contained 16 misclassified red discs scattered around in containers of classified green discs.
The original task design in Liu et al.’s work chose 8 letters to represent 8 categories of discs by labelling a letter in the center of each disc. The choices of letters were purely based on controlling even difficulties of recognizing them. We selected eight symmetrical letters “H”, “M”, “O”, “U”, “V”, “W”, “X”, and “Y” instead to ensure the same legibility on both sides of the transparent screen, while also eliminating easier-to-recognize letters such as “A”, “I”, and “T”. We used the same font size as in their experiment - 12 pt for all the conditions to ensure the need of physical navigation (moving closer and further to the display) for completing the task.
4.1.2. Standing Position
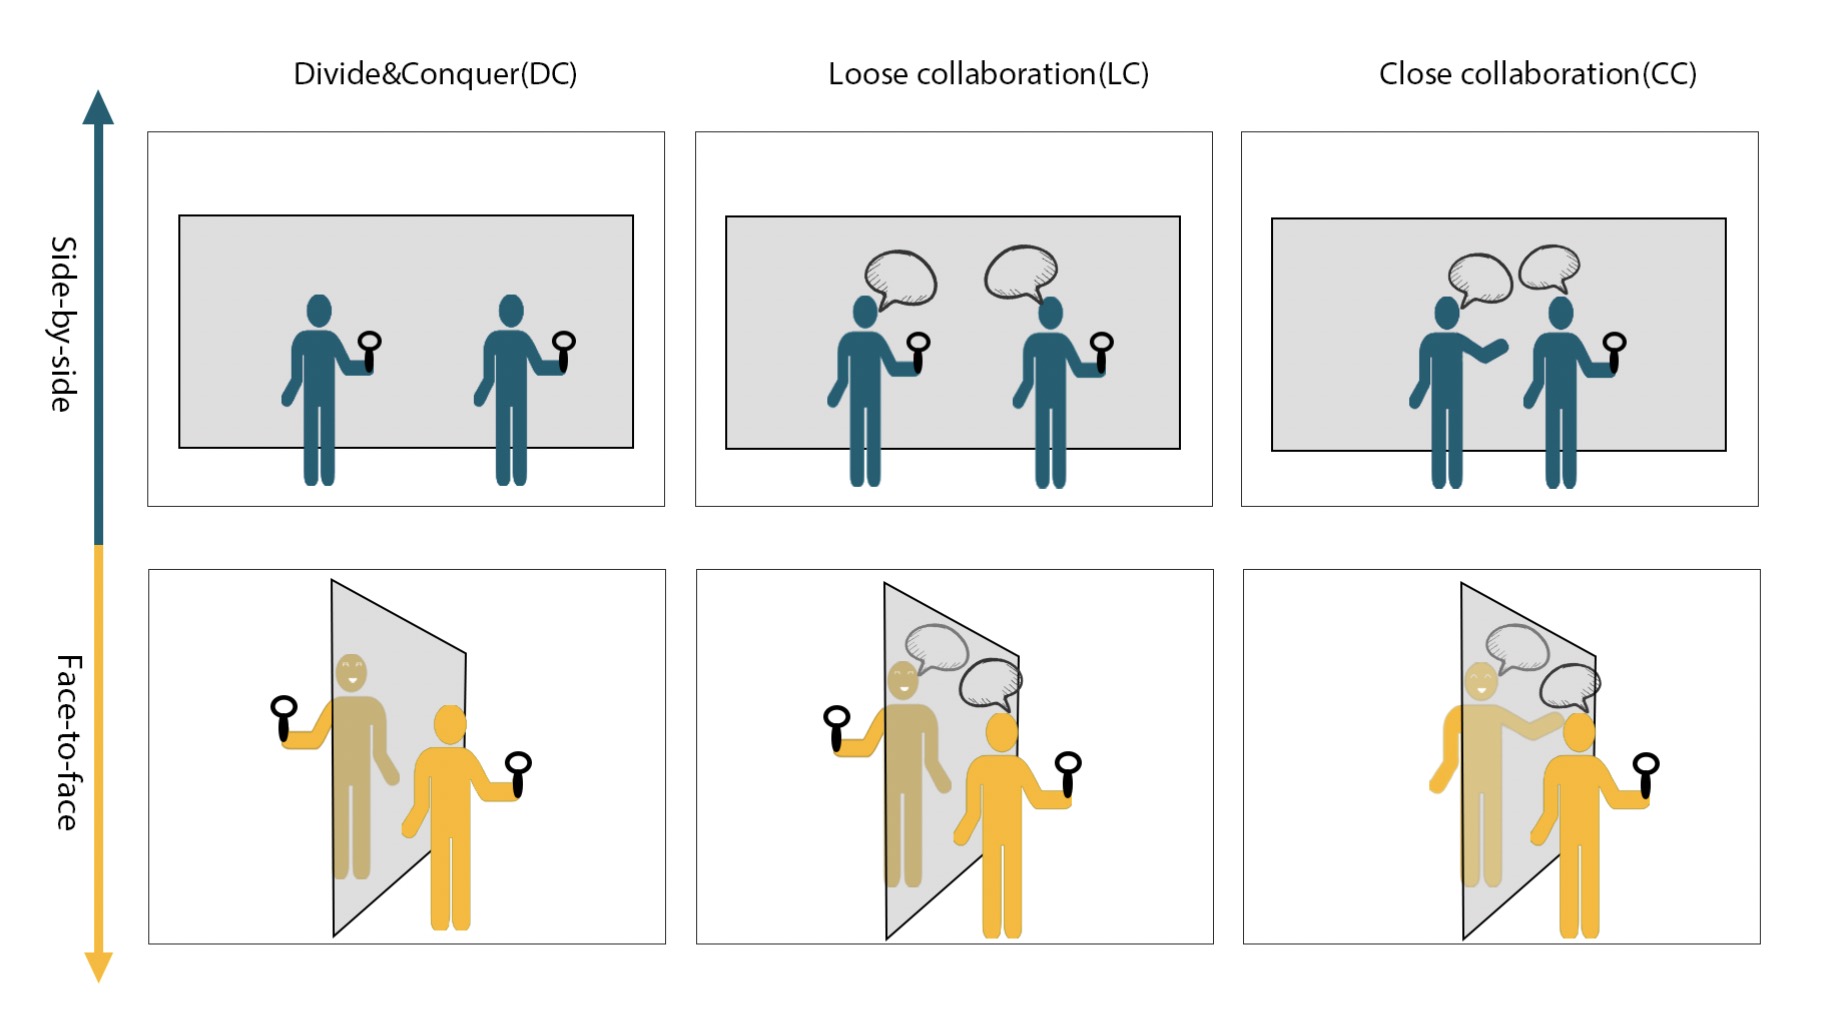
We used the same display to test two Standing Position as illustrated in Fig. 3). Each pair of participants were required to stand in one of the two ways depending on the condition:
-
(1)
Side-by-side: two participants stand on the same side of the transparent display to complete the task collaboratively.
-
(2)
Face-to-face: two participants stand on both sides of the transparent display to complete the task collaboratively.
4.1.3. Operationalized Collaboration Styles
We employed Liu et al.’s operationalization of collaboration styles based on the level of coupling, to test the interaction patterns in different collaborative scenarios (Liu et al., 2016). As illustrated in Fig. 3), three Collaboration Style were operationalized:
-
(1)
Divide & Conquer (DC): the task was performed by both partners in parallel. Each partner had a pointing device. Partners were not allowed to communicate with each other or help each other.
-
(2)
Loose Collaboration (LC): as above, except partners were allowed and encouraged to communicate and help each other. For example, when a partner couldn’t find a container of discs with “U”, he could say “where is ’U’ ?”, and the partner may respond “There is a ’U’.”.
-
(3)
Close Collaboration (CC): the tasks were executed sequentially. There was only one pointing device for each pair of participants. Only one partner could perform pick and drop operations, while the other could act as an assistant to help find the target container or disc.
4.1.4. Layout Locality.
We also adopted the two types of layout design in Liu et al.’s work (Liu et al., 2016) to operationalize the distribution of information (as well as the task difficulty) on a wall-sized display, namely Local and Distant:
-
(1)
Local Layouts: the target containers of all red discs were in their adjacent containers, and participants did not need to walk far to find one;
-
(2)
Distant Layouts: each pick-and-drop involved containers in non-adjacent columns. Participants needed to move left and right or even across the entire display to find a target container.
4.2. Apparatus
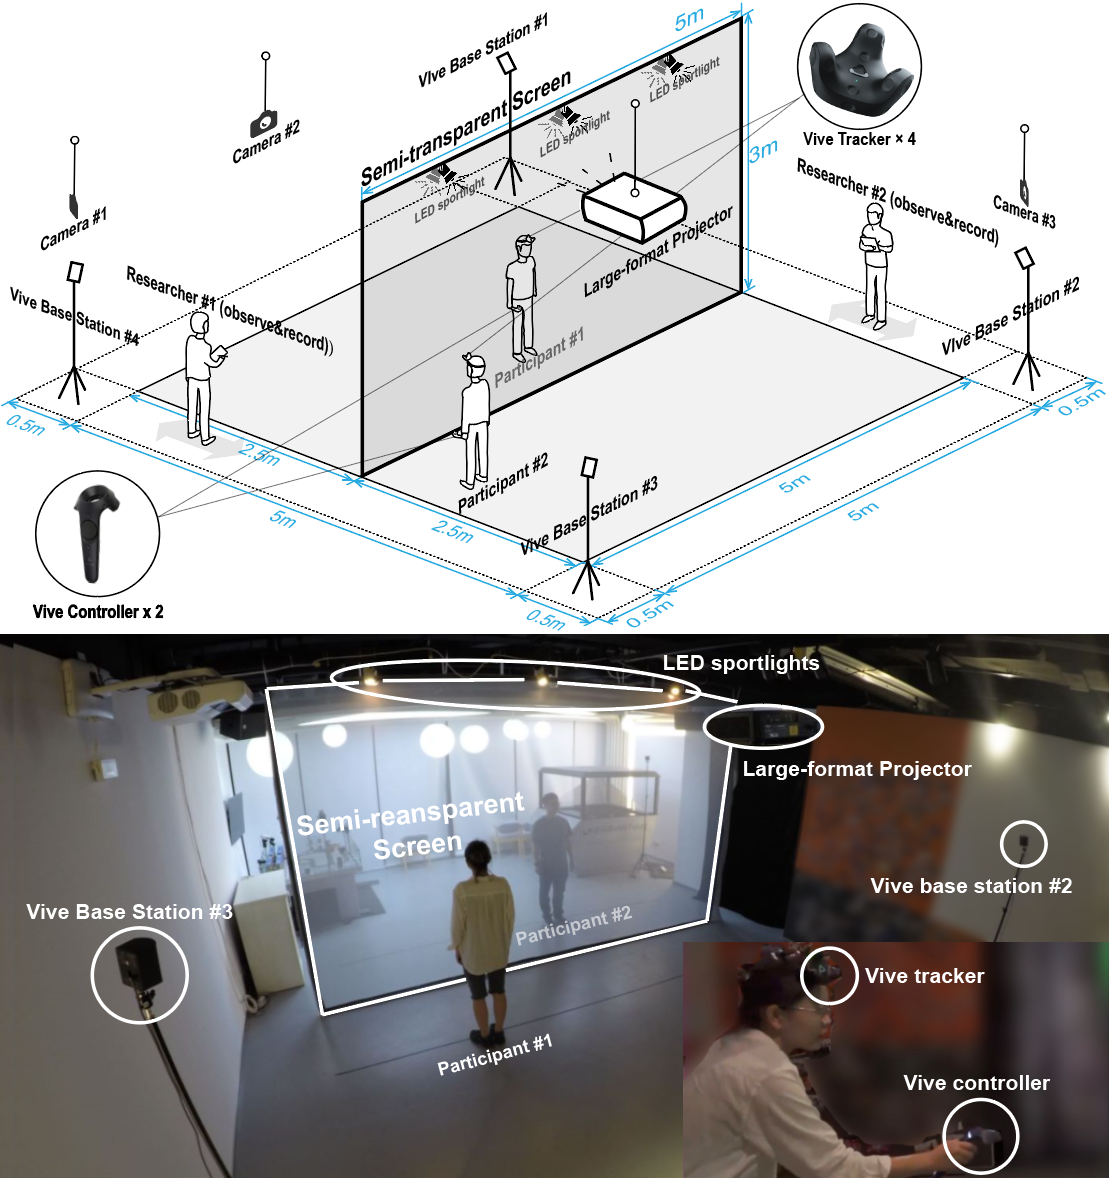
We used the same hardware set up as Gong et al. (Gong et al., 2021b). As shown in Fig. 4, we built a 5m × 3m wall-sized projected display made of translucent (semi-transparent and reflective) material to display digital material. The translucent material is constructed of glass fabric that is woven out with relatively wide holes (light transmittance is about 70%), enabling the user to see and hear their partner when standing on the opposite side of the screen (see in Fig. 6). Moreover, to further enhance the face-to-face collaboration, six LED spotlights were set up at the top of the display, three per side to illuminate the participant’s faces so that they could see each other’s facial expressions more clearly when cooperating face-to-face.
In terms of input device and motion tracking, we used 4 SteamVR 2.0 base stations at the 4 corners of the screen, one on each corner. Two of them were in front of the projection screen while the other two were behind the screen. We asked the users to hold the HTC Vive controllers to manipulate the cursor and controller corresponding vertically. Users picked and dropped the discs via using the trigger under the handle. Two VIVE trackers were worn on their head respectively to track their head (body) positions and orientations.
The system including the communication servers, graphic rendering, and demo applications were implemented with Unity. We divided the display area into a 4 × 8 grid with 32 rectangular containers of the same size, and each container and can holding a maximum of six discs.
4.3. Participants
We used posters and flyers to recruit participants from local corporate and a local university. Thus, some of them were college students and others were corporate employees. All of our participants have normal or corrected-to-normal vision and without red/green color blindness or other mental/physical disease. In addition to the 4 participants from the pilot study to adjust study parameters, 24 participants (ages 20 - 41) were recruited for the experiment. 5 pairs were male-only, 2 pairs were female-only and 5 pairs were mixed gender. 16 participants (8 pairs) knew each other as colleagues, others were introduced to each other before the formal experiment.
4.4. Procedure
The researcher first introduced the tasks and rules to the participants and familiarised them with the conditions. A training session was conducted to get participants try out the operation and interaction with the system. For each type of Layout Locality, participants were asked to practice for two trials. After the training session, participants were asked to start the measured trials and were instructed to complete the task as quickly as possible while minimizing errors.
The experiment is blocked by Standing Position, then by Collaboration Style, and final by Layout Locality. In order to avoid ordering effects, the task order was fully counterbalanced across the participants. The order of Standing Position blocks is counterbalanced through swapping, then the order of Collaboration Style is counterbalanced across pairs using a Latin Square for each Standing Position , and the order of Layout Locality is swapped for each Standing Position and Collaboration Style.
In order to avoid accidental factors affecting the experimental results, each pair performed for each Standing Position Collaboration Style Layout Locality. For Close collaboration (CC), we stipulated that the pairs should exchange roles when repeating trails, to minimize effects of individual differences. In total there were 24 trials blocked by Standing Position. After completing twelve trials for one Standing Position, participants were asked to have a short break. After all the tasks were completed, each participant was asked to join in a ten-minutes individual semi-structured interview to talk about their subjective experiences. Two researchers observed and recorded the whole process of the experiment. Each experiment took about one hour.
4.5. Data Collection
In total we collected 2 (standing position) × 3 (collaboration styles) × 2 (layouts) × 2 (replications) × 12 (pairs) = 288 trails. Similar to previous work (Liu et al., 2016), we implemented different data collection methods to further enrich our research findings. Especially noted, for two replications, we averaged the repeated data in the same condition if no accidental factor happen in two replications.
-
(1)
Log Data. We logged kinematic log data tracking the positions and rotations of two participant’s head trackers and controllers, button clicks, and movement of discs on the screen. From the log data, we can calculated rich time indices of task performance and detailed physical navigation information, the detailed data prepossessing and definitions of measures can be seen in Appendix A.1;
-
(2)
Video Record and Observation Data. The experiment was fully video recorded from different positions by three 4K GoPro cameras and semi-structured in-session observed by two trained researchers (see in Fig. 4). The observers noted down the number of occurrences of six types of events: (1) requested help, one participant asking their partner for the letter being searched for; (2) effective help, one participant finding the correct container for their partner that led to the success of the trial; (3) communication between partners; (4) eye-contact between partners; similar with other work (Jongerius et al., 2020), we only count for reciprocal eye contact, in which two participants look at each other simultaneously. (5) error as misplacing discs; (6) pick conflict, both participants picking the same disc at the same time. The observation data was recorded by two researchers during the experiment independently. After each experiment, the two researchers compared their records and reached the consensus of each number of events by discussed and double-checked against the video records for confirmation.
-
(3)
Self-report and Interview Data. We collected 288 NASA-TLX self-report data for each participate of each condition. Besides, we collected 24 post-task interview data, which was audio recorded and fully transcribed for further coding analysis. In total, about 350 minutes of audio record were collected.
4.6. Data Analysis
4.6.1. Quantitative analysis
Quantitative analyses were conducted on task performance data, collaboration indices, physical navigation data and NASA-TLX scores. For the NASA-TLX scale data, we compared the side-by-side score with the face-to-face score on each item with non-parametric permutation tests. For all the other quantitative measures, we first did normally test, after that we use t-tests comparing the overall difference between Side-by-side and Face-to-face by combining six other conditions (2 Layout Locality 3 Collaboration Style) together. Then we did two-way repeated measure ANOVA for Local Layouts and Distant Layouts separately, to analyze the effects of Standing Position and Collaboration Style as well as their interaction. After that, pairwise comparisons were performed with bonferroni corrections to compare Side-by-side and Face-to-face in each Collaboration Style (e.g. CC & side-by-side versus CC & face-to-face). Specifically, the significance level = 0.05 / 3 = 0.0167 in pairwise comparison tests for three comparisons were conducted.
4.6.2. Qualitative analysis
We conducted post-task interviews with the participants to collect their collaborative experiences. We asked questions regarding their overall experience, their preferences regarding standing positions, collaboration styles, layout localities, and their individual and collaboration strategies during the experiment. All the interviews were audio-recorded and transcribed. The interview transcripts were analyzed using the open coding method by three researchers respectively. Afterward, all codes were transcribed on sticky notes and analyzed with an affinity diagramming by four researchers.
5. Findings
5.1. RQ1: Task Performance
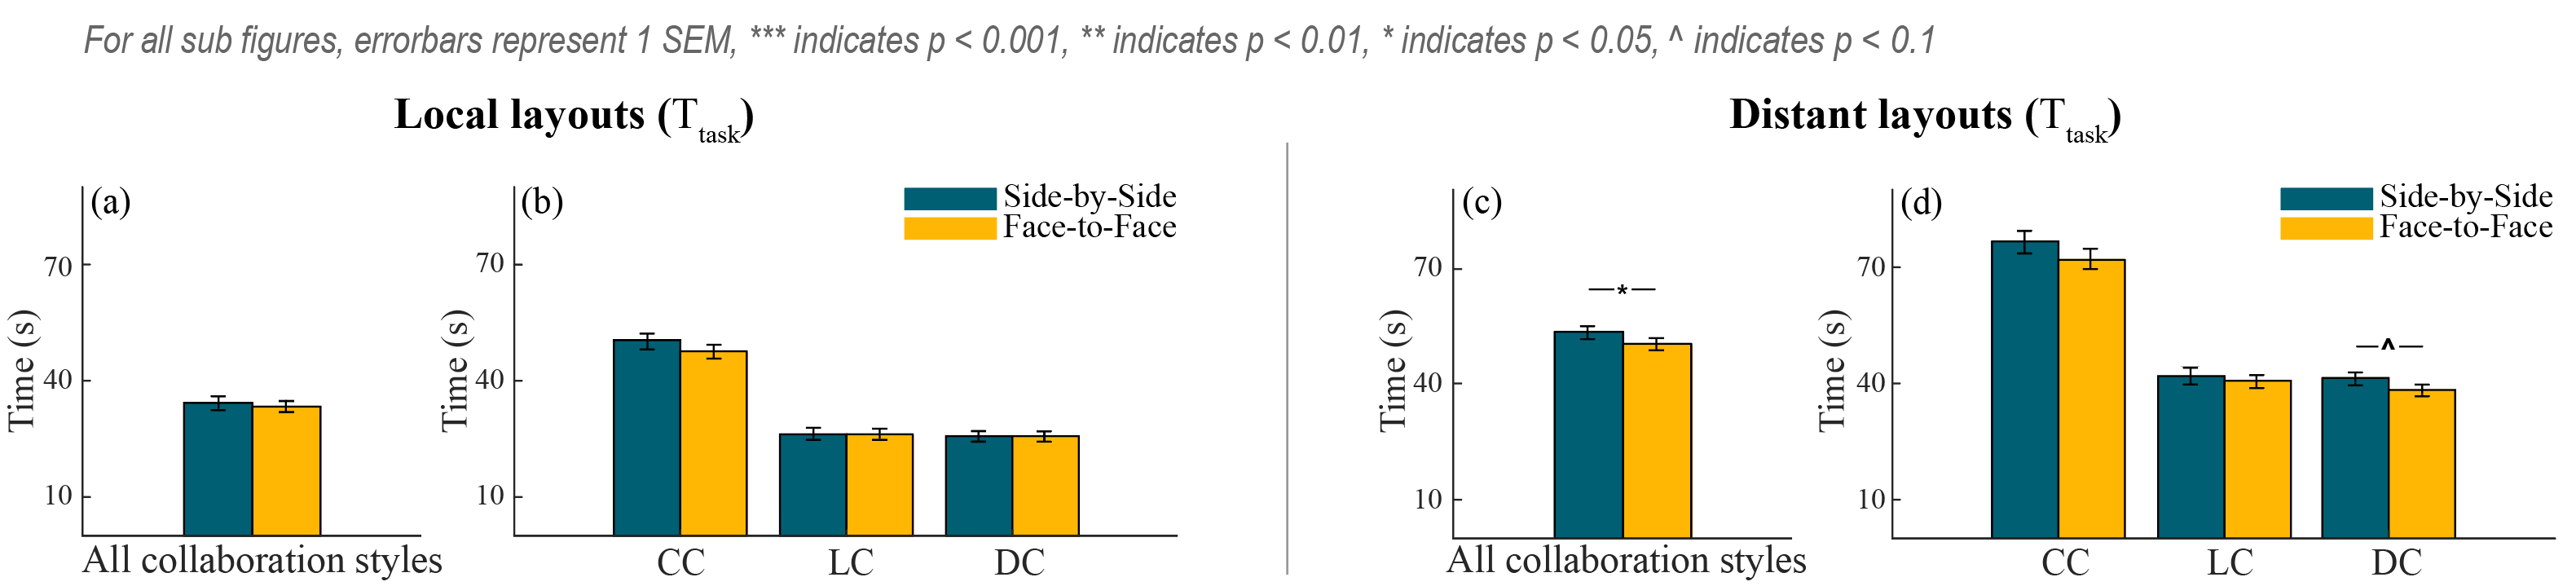
We used “task completion time” (Ttask) to evaluate task performance. For each trial, Ttask is the duration from picking up the first disc to dropping the last disc. Overall we found no significant difference in Ttask between Face-to-face and Side-by-side.
For Local Layouts, we found no significant difference between Side-by-side and Face-to-face on Ttask (Fig. 5(a,b)), no matter taking three collaboration styles together or respectively.
For Distant Layouts, we found it took participants less time in Face-to-face consistently on Ttask (MFace = 49.9s, SDFace = 5.42s, MSide = 53.29s, SDSide = 19.98s, F(1,23) = 4.73, p = 0.0401 ¡ 0.05, = 0.171, Fig. 5(c)) when combining three collaboration styles together (main effect), and no interaction effects.
Besides, less time consumption in Face-to-face was reflected in DC (MFace = 38.3s, SDFace = 5.41s, MSide = 41.32s, SDSide = 6.85s, t(23) = 1.89, p = 0.0711 ¡ 0.1, marginally significant, uncorrected) collaboration style on Ttask (Fig. 5(d)).
Taking task performance results together, we found that participants consumed less time in Face-to-face than in Side-by-side, mainly with Distant Layouts.
5.2. RQ2: Navigation patterns and territoriality
To understand user navigation patterns and territoriality, we logged participants’ positions around the screen and cursor positions on screen over time. Here we introduce several indices for comparing the user interaction patterns between Side-by-side and Face-to-face, including the distance between participants, speed of navigation, and trajectory crosses between participants. Furthermore, we visualized participants’ physical movements and cursor movements in the loose collaborative condition to analyze how the standing position affect territoriality while performing the same task.
5.2.1. Distance between pairs
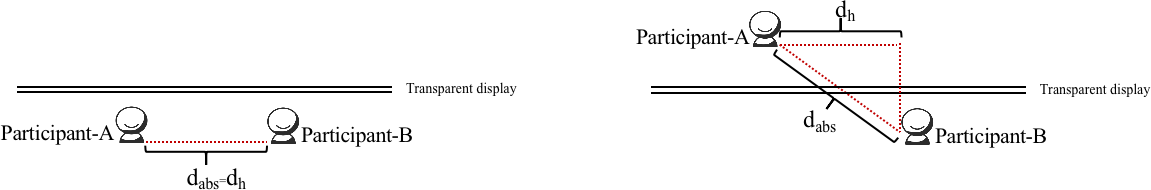
We introduced two distance indices including horizontal distance and absolute distance in this section. As illustrated in Fig. 6, we identified horizontal distance dh between pairs as the distance between two participants’ perpendicular projection points onto the screen. Absolute distance between pairs dabs refers to the actual distance between pairs. We averaged the distances over time within each trial to calculate dh and dabs for each trial. Overall, we found pairs stood horizontally more closely in Face-to-face than Side-by-side, reflected by a smaller dh (MFace = 1.32m, SDFace = 0.68m, MSide = 1.64m, SDSide = 0.6m, t(11) = 9.88, p ¡ 0.001). On the other hand, we found the absolute distance dabs between pairs were farther away in Face-to-face than Side-by-side, reflected by a larger dabs distance (MFace = 2.91m, SDFace = 0.36m, MSide = 1.68m, SDSide = 0.59m, t(11) = -26.6, p ¡ 0.001).
For local layouts, the main effect between Side-by-side and Face-to-face is consistent with the overall T-Test. Participants were horizontally (dh) closer (MFace = 1.37m, SDFace = 0.75m, MSide = 1.7m, SDSide = 0.67m, F(1,11) = 48.4, p ¡ 0.001, = 0.815, Fig. 7(a)) but farther away in dabs (MFace = 2.93m, SDFace = 0.3m, MSide = 1.74m, SDSide = 0.66m, F(1,11) = 407, p ¡ 0.001, = 0.974, Fig. 7(e)) in Face-to-face compared to Side-by-side. There was a significant interaction effect on dabs (F(2,22) = 23.5, p ¡ 0.001, = 0.681) but no significant interaction effect on dh.
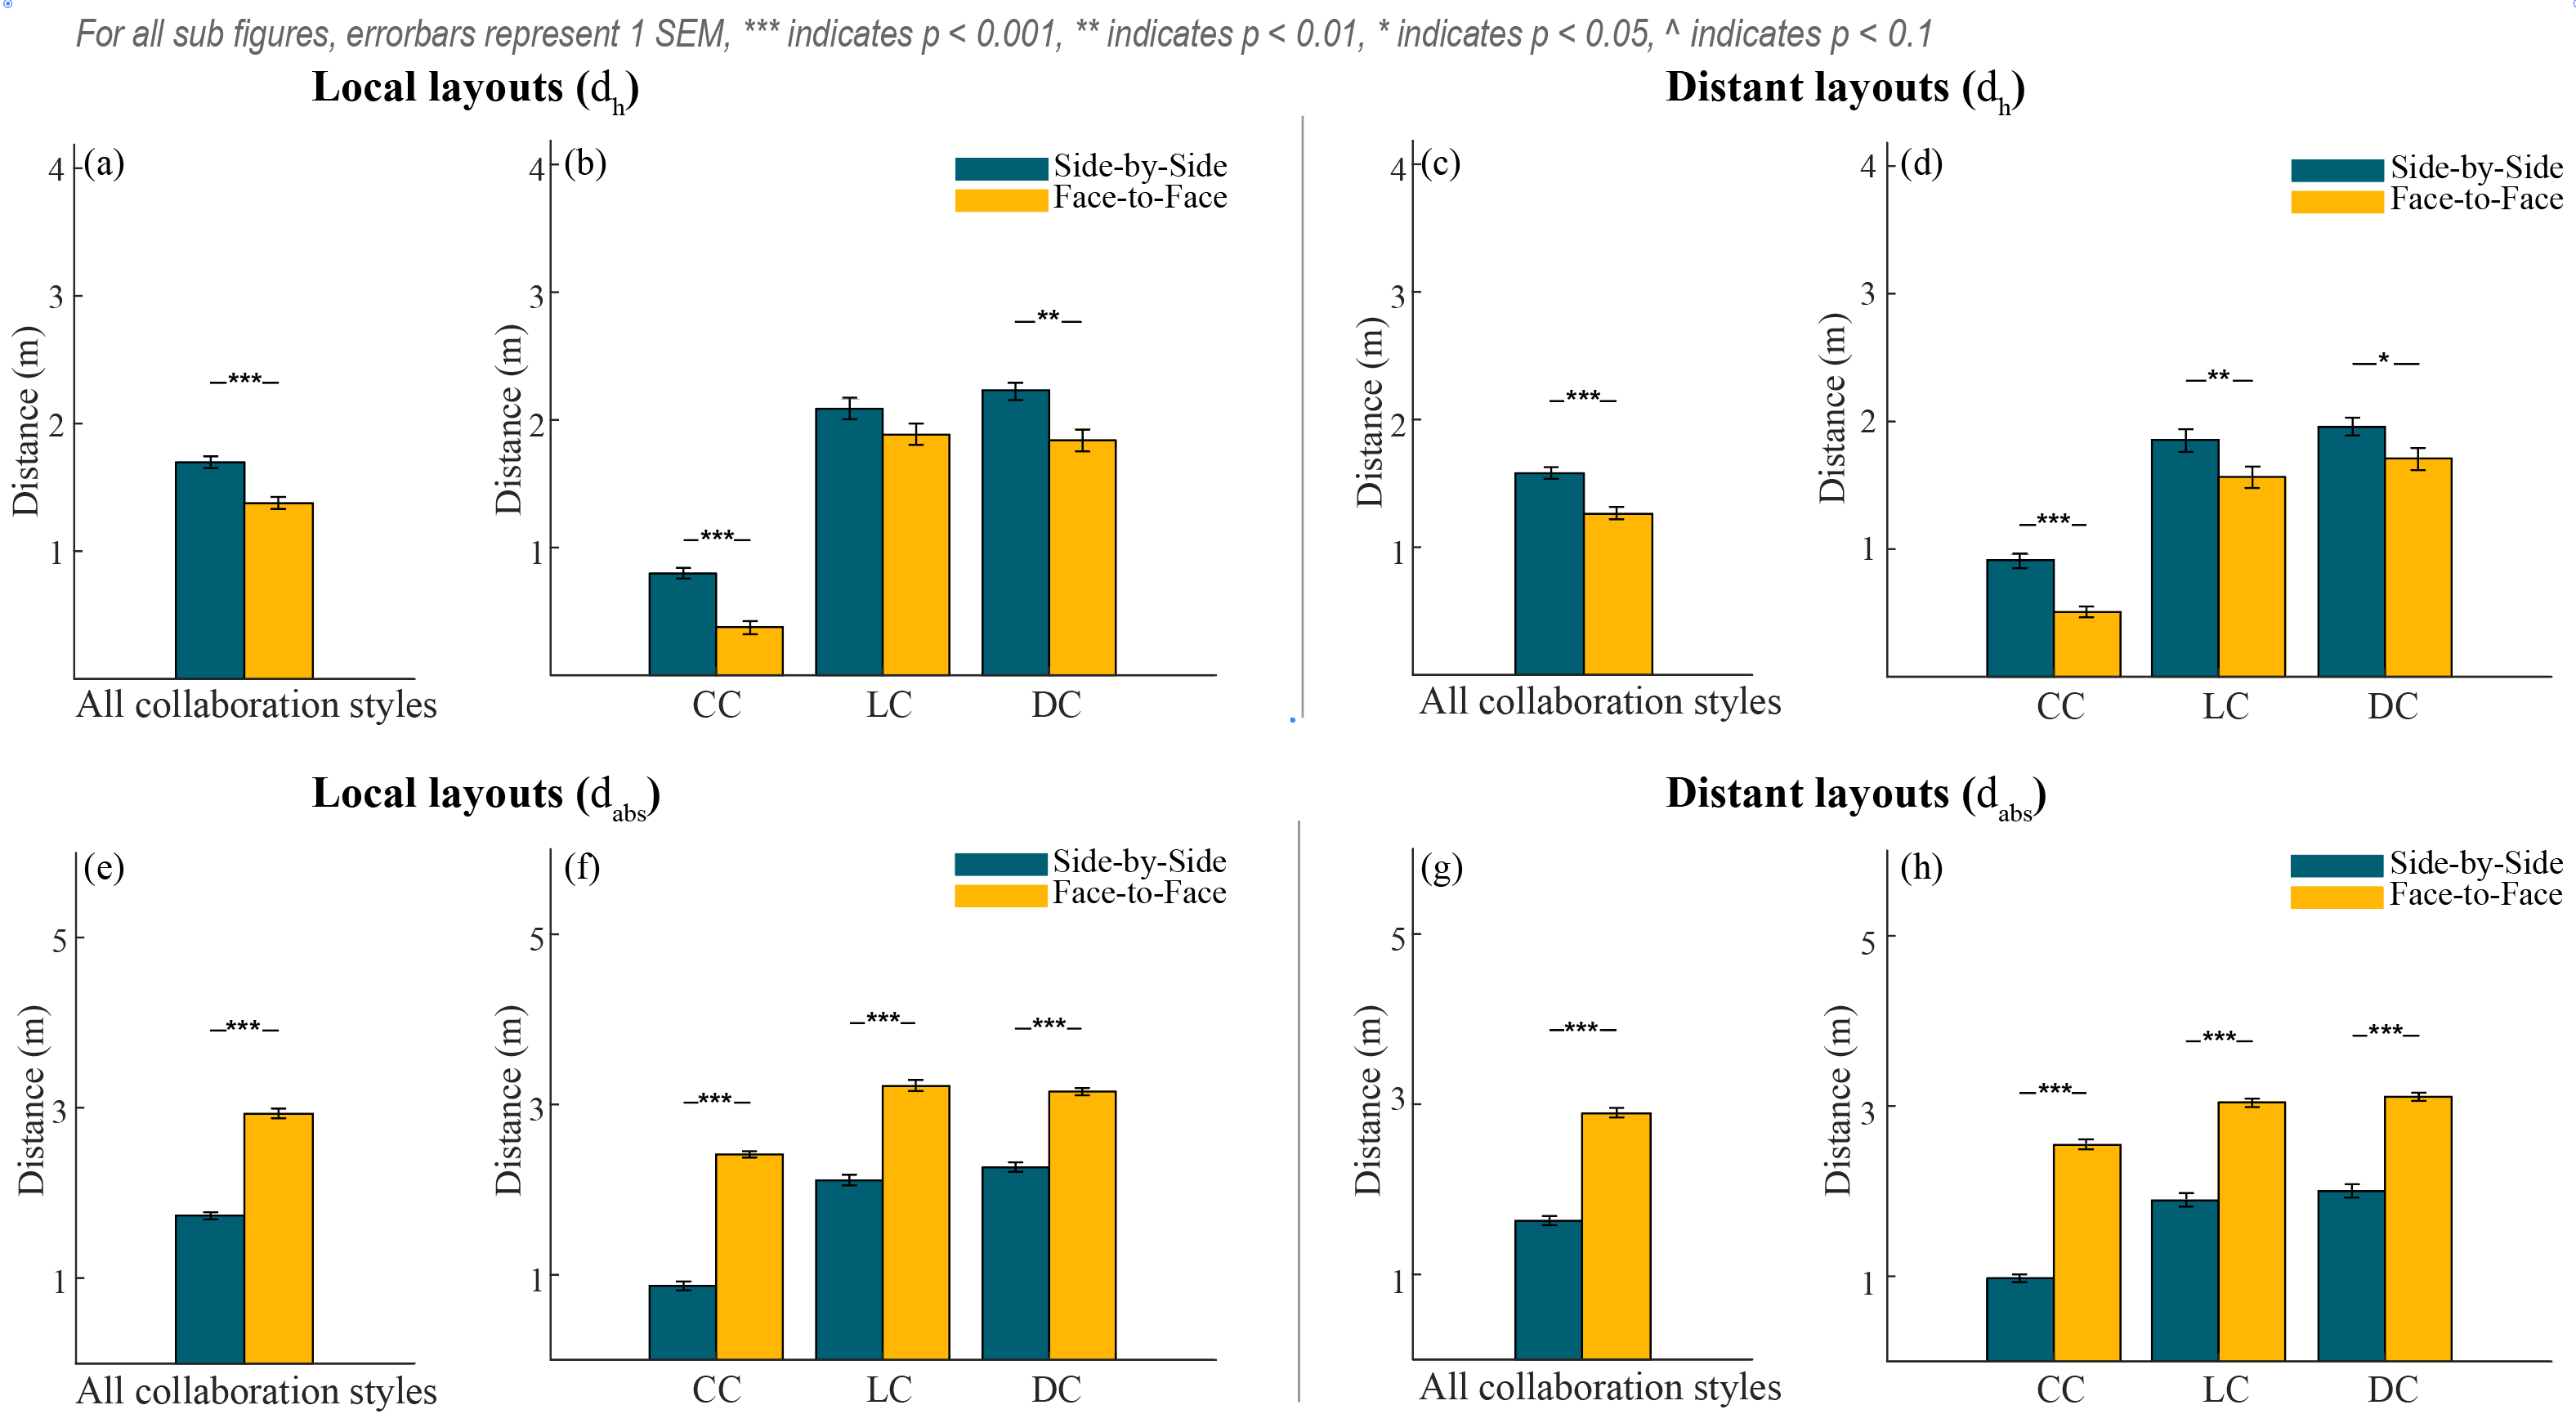
For distant layouts, the main effect between Side-by-side and Face-to-face is also consistent with the overall T-Test. Combining three collaboration styles together (main effect), we found participants were horizontally (dh) more closely (MFace = 1.26m, SDFace = 0.61m, MSide = 1.58m, SDSide = 0.52m, F(1,11) = 58.2, p ¡ 0.001, = 0.841, Fig. 7(c)) but absolutely farther away (MFace = 2.9m, SDFace = 0.3m, MSide = 1.63m, SDSide = 0.5m, F(1,11) = 748, p ¡ 0.001, = 0.986, Fig. 7(g)) in face-to-face position.There was a significant interaction effect on dabs (F(2,22) = 11.5, p ¡ 0.001, = 0.510) but no significant interaction effect on dh.
Significant differences in pairwise comparison with in each Collaboration Style were annotated in Fig. 7 for Local Layouts and Distant Layouts respectively. As we can observe, the main trend was that the participants were horizontally closer while absolutely farther away in face-to-face position, and this trend was consistent across different layouts and in different collaboration styles. The significant interaction effects on dabs show the level of differences between Side-by-side and Face-to-face were affected by Collaboration Style. From the figure we can observe that partners were working on closer or the same area of the screen (dh) in Close Collaboration for both layouts, and Face-to-face allowed them to get even closer horizontally, while maintaining their physical territories separate with the transparent screen. Yet, the transparent screen did separate the partners further away in their absolute distance (dabs) than what was necessary for comfort, and this difference was larger in Close Collaboration than in other styles for both layouts.
5.2.2. Speed
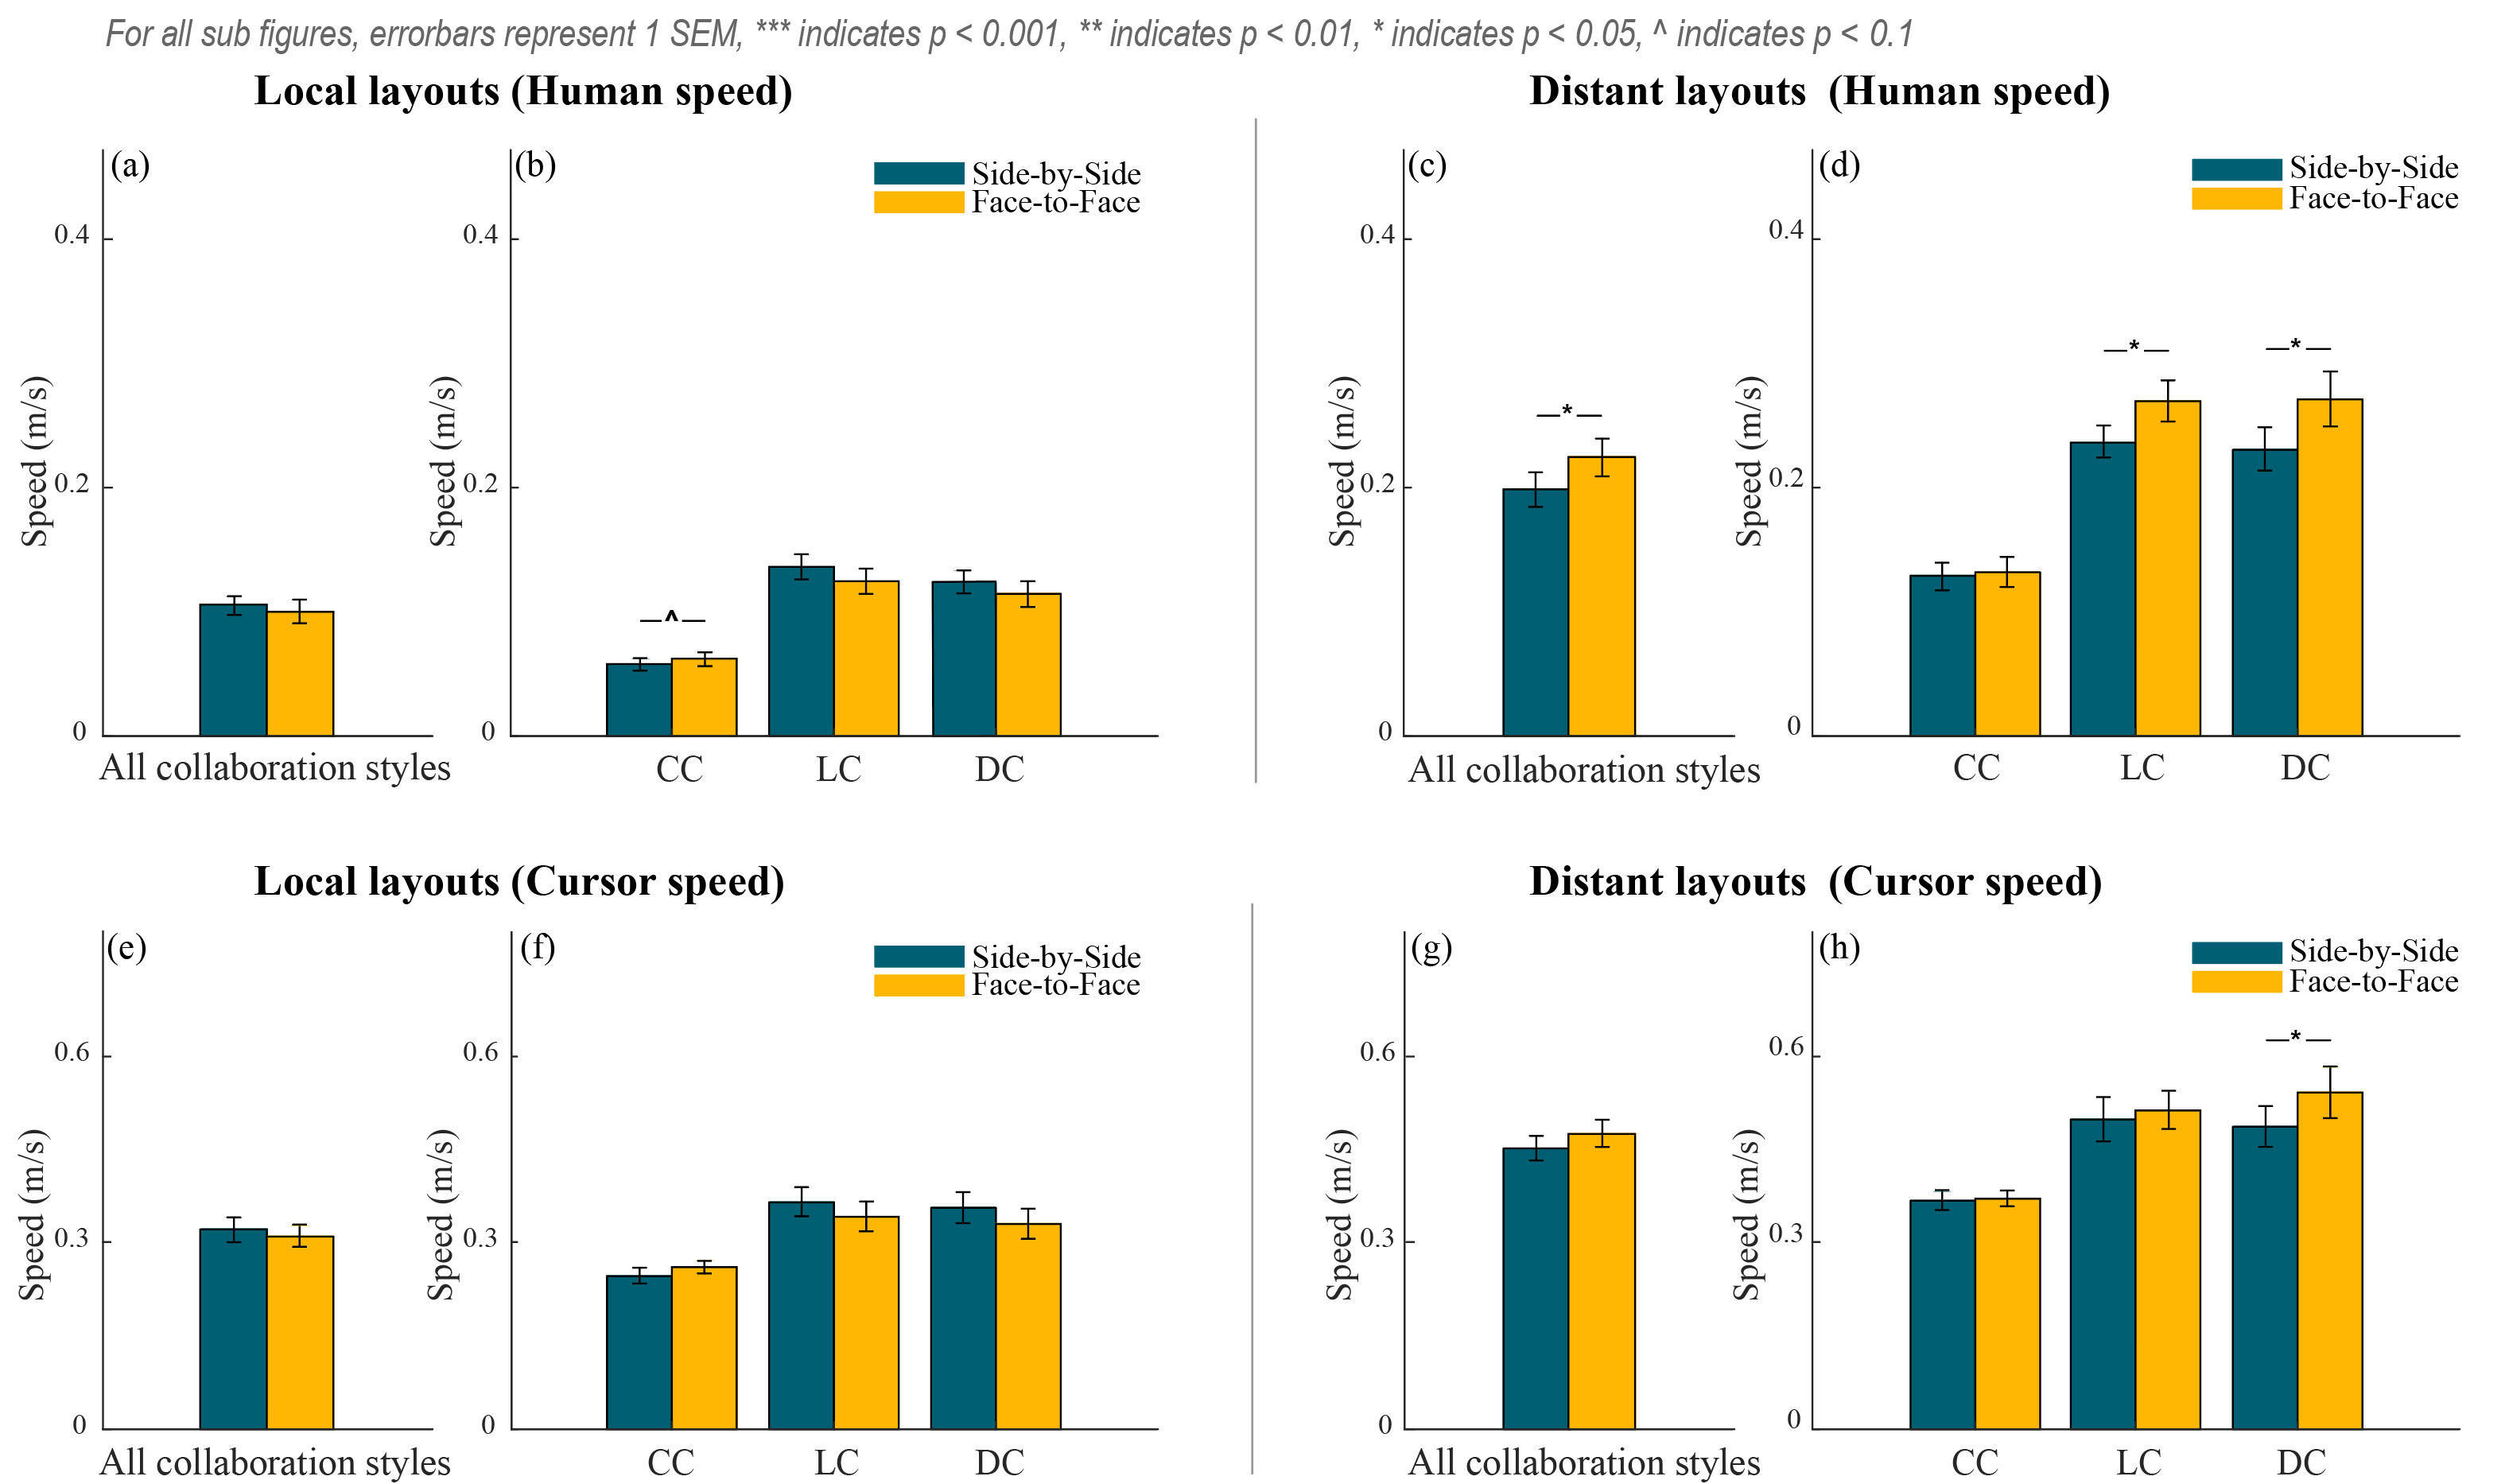
We introduced two speed measures, including the physical position movement speed of the participants (human speed) and the cursor movement speed (cursor speed). We calculated the human speed within each recording time interval(0.3s) by dividing the horizontal distance participant traveled within this time interval by 0.3s. Then we averaged the speed across time within one trail to get one human speed value for this trail. We calculated the cursor speed within each recording time interval (0.3s) by dividing the distance cursor trial to get one cursor speed value for this trail.
Overall, we found no significant differences on human speed or cursor speed between Face-to-face and Side-by-side.
For local layouts, there were significant interaction effects on human speed (F(2,46) = 3.47, p = 0.0396 ¡ 0.05 , = 0.131) and cursor speed (F(2,46) = 3.98, p = 0.0256 ¡ 0.05 , = 0.147). Specifically, we found participants moved faster in CC collaboration style (MFace = 0.063m/s, SDFace = 0.024m/s, MSide = 0.057m/s, SDSide = 0.025m/s, t(23) = -1.72, p = 0.0988 ¡ 0.1, marginally significant, uncorrected), see Fig. 8(b).
For distant layouts, there were significant interaction effects on human speed (F(2,46) = 3.63, p = 0.0343 ¡ 0.05 , = 0.136) and cursor speed (F(2,46) = 3.21, p = 0.0495 ¡ 0.05 , = 0.123). Combining three collaboration styles together (main effect), we found participants moved faster (MFace = 0.22m/s, SDFace = 0.12m/s, MSide = 0.2m/s, SDSide = 0.09m/s, F(2,46) = 7.12, p = 0.0138 ¡ 0.05 , = 0.236, Fig. 8(c)) in face-to-face position.
Specifically, faster human movements in Face-to-face compared to Side-by-side were found in Loose Collaboration (MFace = 0.27m/s, SDFace = 0.1m/s, MSide = 0.23m/s, SDSide = 0.09m/s, t(23) = -2.75, p = 0.0113 ¡ 0.0167, corrected) and Divide & Conquer (MFace = 0.27m/s, SDFace = 0.12m/s, MSide = 0.23m/s, SDSide = 0.08m/s, t(23) = -2.47, p = 0.0215 ¡ 0.05, uncorrected), see Fig. 8(d). We also found faster cursor movement in Face-to-face compared to Side-by-side in Divide & Conquer (MFace = 0.54m/s, SDFace = 0.2m/s, MSide = 0.49m/s, SDSide = 0.18m/s, t(23) = -2.63, p = 0.0151 ¡ 0.0167, corrected), see Fig. 8(h).
Overall, we found participants moved physically faster in Face-to-face than in Side-by-side in Distant Layouts when the collaboration was loose or the work was divided. Cursor movement followed the same trend but with less significant and smaller differences.
5.2.3. Trajectory cross
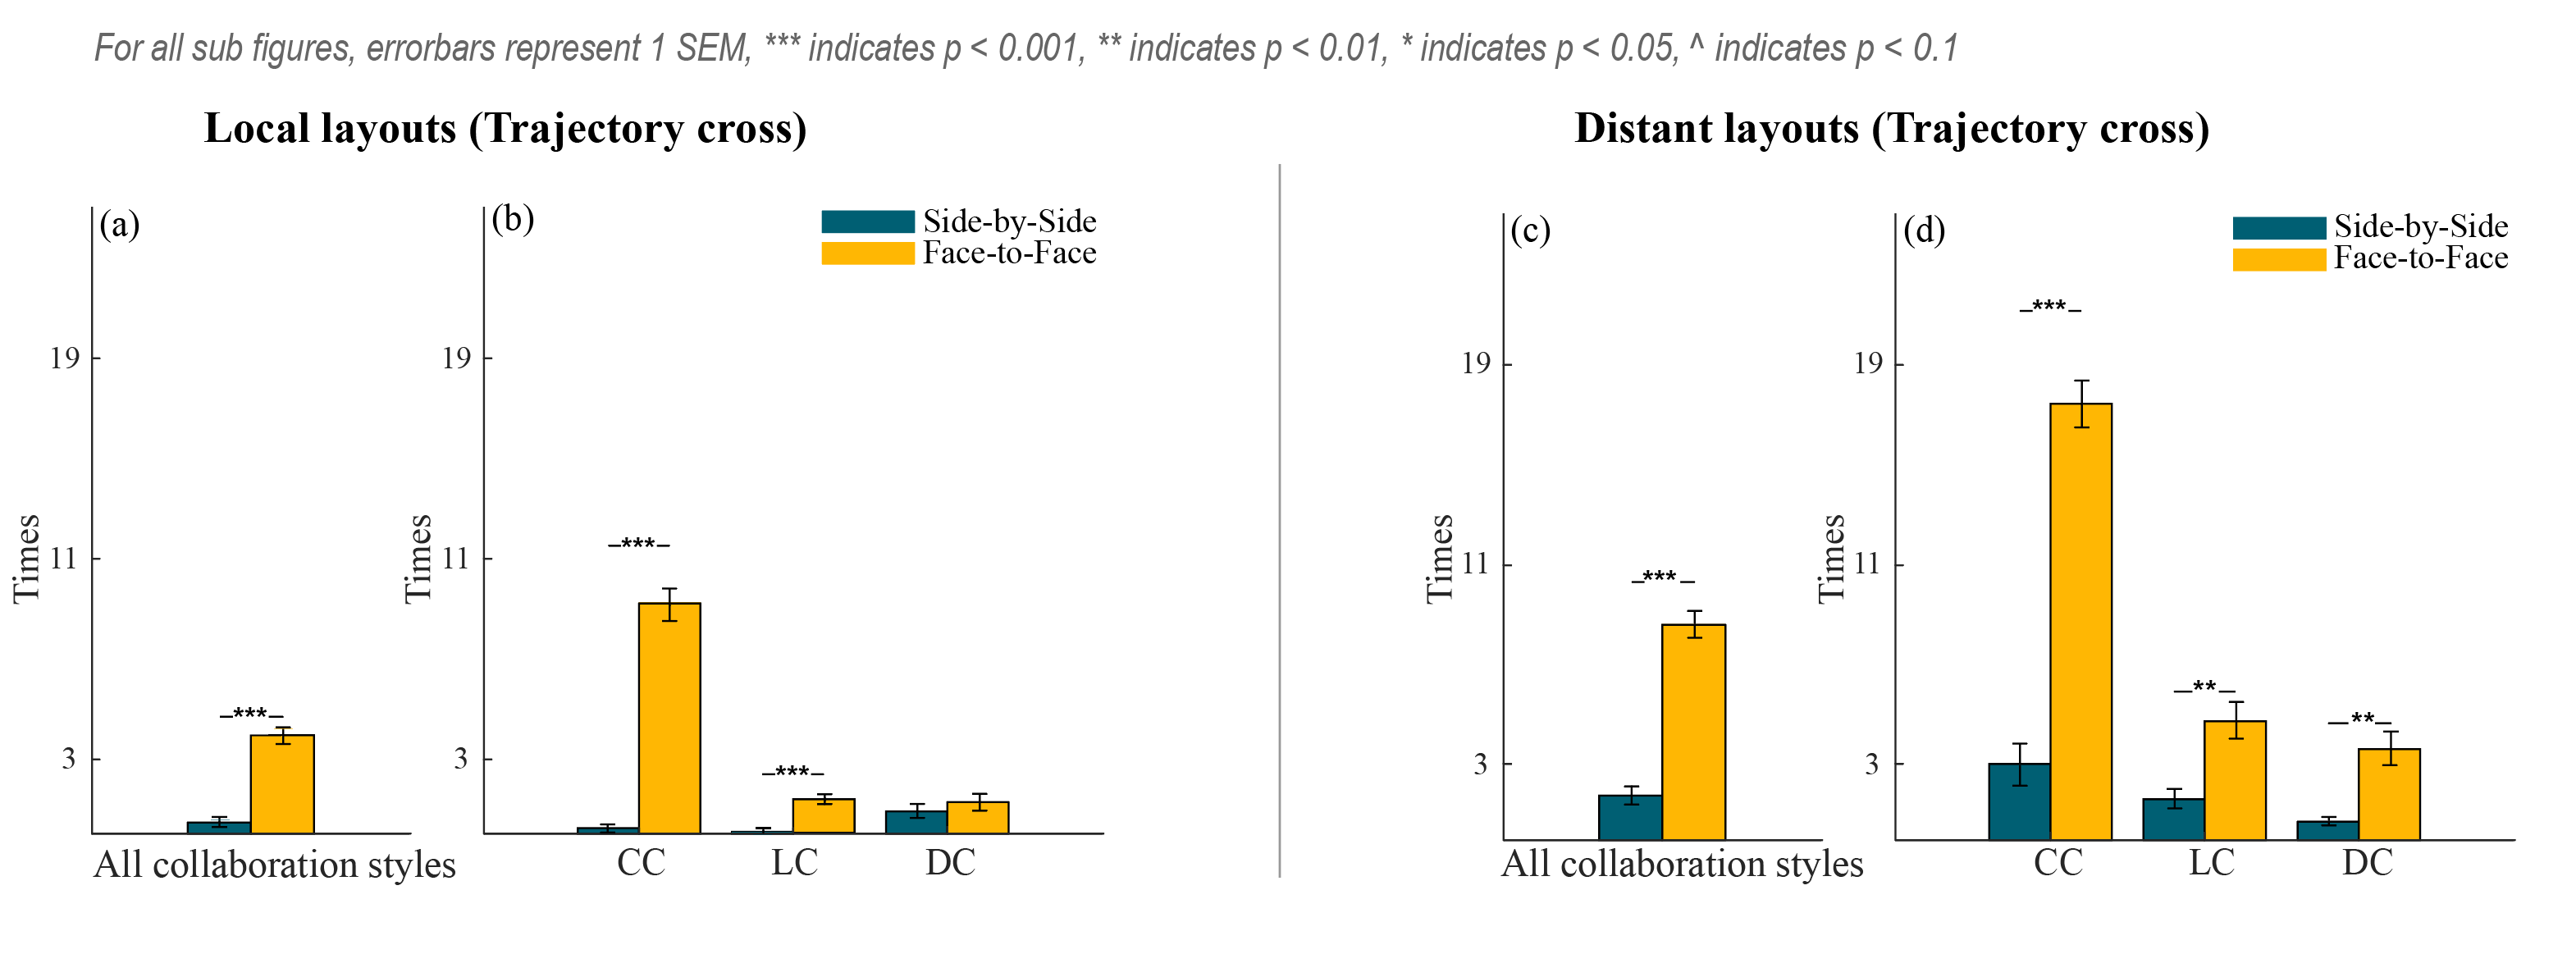
We counted the number of occurrences in each trial that two participants’ trajectories crossed horizontally. Overall, we found that two participants’ trajectories crossed significantly more in Face-to-face than in Side-by-side (The number of times: MFace = 6.27, SDFace = 6.23, MSide = 1.12, SDSide = 2.08, t(11) = -11.0, p ¡ 0.001).
Analysing Local Layouts and Distant Layouts separately, the two-way repeated measure ANOVAs yielded consistent results with the overall T-Test in both conditions. There was a significant main effect on the frequency of trajectory crossing for Local Layouts (The number of times: MFace = 3.93, SDFace = 4.15, MSide = 0.43, SDSide = 0.96, F(1,11) = 113, p ¡ 0.001 , = 0.911 (see Fig. 9(a, c))) and Distant Layouts (MFace = 8.61, SDFace = 7.03, MSide = 1.81, SDSide = 2.59, F(1,11) = 83.3, p ¡ 0.001 , = 0.883). In both layouts, participants crossed more frequently in Face-to-face than in Side-by-side.
For Local Layouts, pairwise comparisons within each Collaboration Style found more trajectory crosses in Face-to-face than in Side-by-side in both Close Collaboration (The number of times: MFace = 9.17, SDFace = 2.96, MSide = 0.33, SDSide = 0.31, t(11) = -9.44, p ¡ 0.001, corrected) and Loose Collaboration (MFace = 1.33, SDFace = 0.89, MSide = 0.083, SDSide = 0.28, t(11) = -5.00, p ¡ 0.001, corrected) (see Fig. 9(b)). For Distant Layouts, pairwise comparisons within each Collaboration Style found more trajectory crosses in Face-to-face than in Side-by-side in every Collaboration Style (see Fig. 9(d)): Close Collaboration (The number of times: MFace = 17.41, SDFace = 4.1, MSide = 3.04, SDSide = 3.83, t(11) = -6.84, p ¡ 0.001, corrected), Loose Collaboration (MFace = 4.75, SDFace = 3.09, MSide = 1.63, SDSide = 1.59, t(11) = -3.43, p = 0.0056 ¡ 0.01, corrected) and Divide & Conquer (MFace = 3.67, SDFace = 2.2, MSide = 0.75, SDSide = 0.63, t(11) = -4.13, p = 0.0017 ¡ 0.01, corrected).
There were significant interaction effect between Collaboration Style and Standing Position for both Local Layouts (F(2,22) = 46.6, p ¡ 0.001 , = 0.809.) and Distant Layouts (F(2,22) = 21.1, p ¡ 0.001 , = 0.657).
The trajectory crosses here indicate switches of territory in the horizontal direction, as one working at the left or right side of each other when facing the screen. Overall we can see that participants switched territories much more frequently in Face-to-face than in Side-by-side.
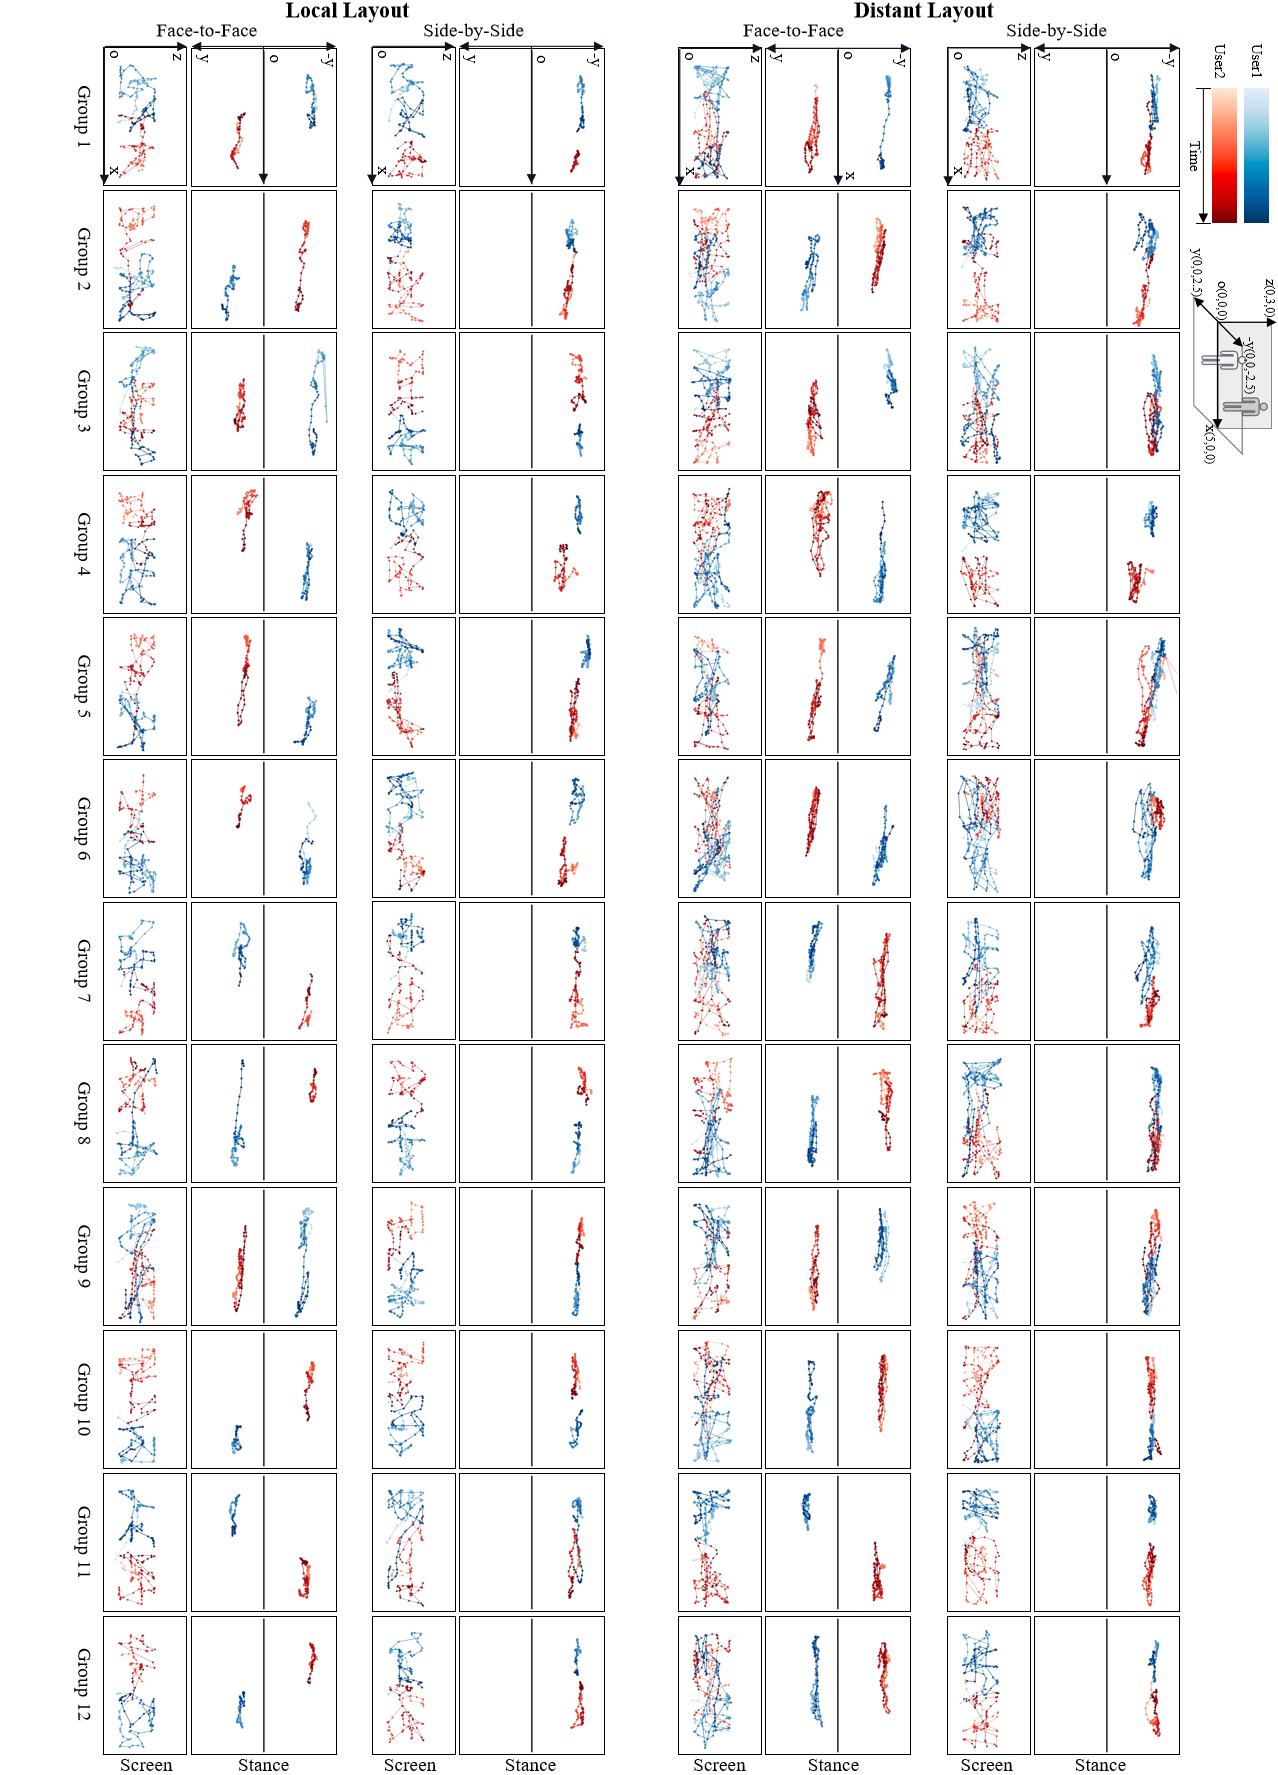
5.2.4. Territoriality in loose collaboration
While Close Collaboration and Divide & Conquer enforce or forbid participants to communicate or help each other, Loose Collaboration allows participants to work together freely, thus operationalizes a more natural situation with richer collaborative patterns. In Fig. 10 we visualize the accumulated trajectory patterns of both humans and their cursors for each group, to have a closer look at how Standing Position may have affected territorialities on the screen and physically in the room respectively.
For Local Layouts, 11 of the 12 groups in Side-by-side and 8 out of 12 groups in Face-to-face showed no overlap in screen work areas. This shows in both conditions, participants had strong territorial awareness and each of them worked on screen areas that were clearly delineated. We do not see large differences between Side-by-side and Face-to-face in this respect.
For Distant Layouts, we can observe larger differences between Side-by-side and Face-to-face in territoriality. In Side-by-side, 9 of 12 groups showed a clear demarcation line dividing their work areas on the screen. Whereas in Face-to-face, only 2 of 12 groups had a clear separation of screen territories. The physical territories in Side-by-side were more mixed in Distant Layouts than in Local Layouts as the task required them to move farther to look for containers. But we can see they were less free than in Face-to-face for crossing to their partner’s side. Side-by-side partners presented stronger territorial separation and a more constrained range of movements.
This finding is consistent with the previous section on trajectory cross, showing that Face-to-face provided more freedom in navigating the physical space than Side-by-side by having partners on each side, especially in Distant Layouts. Face-to-face allowed and led to more mixture of the screen territory than Side-by-side while protecting their physical territories to keep it socially comfortable.
5.3. RQ3: Users’ Awareness and Communication
In our observational data we logged the occurrences of participants’ eye contact and action conflict (trying to pick the same disc), while other observational data didn’t show significant difference between two standing position. We analyze these quantitatively to understand how Standing Position affects partners’ communication and awareness. Our qualitative observations also supported us to gain more insights about user awareness and how they communicated.
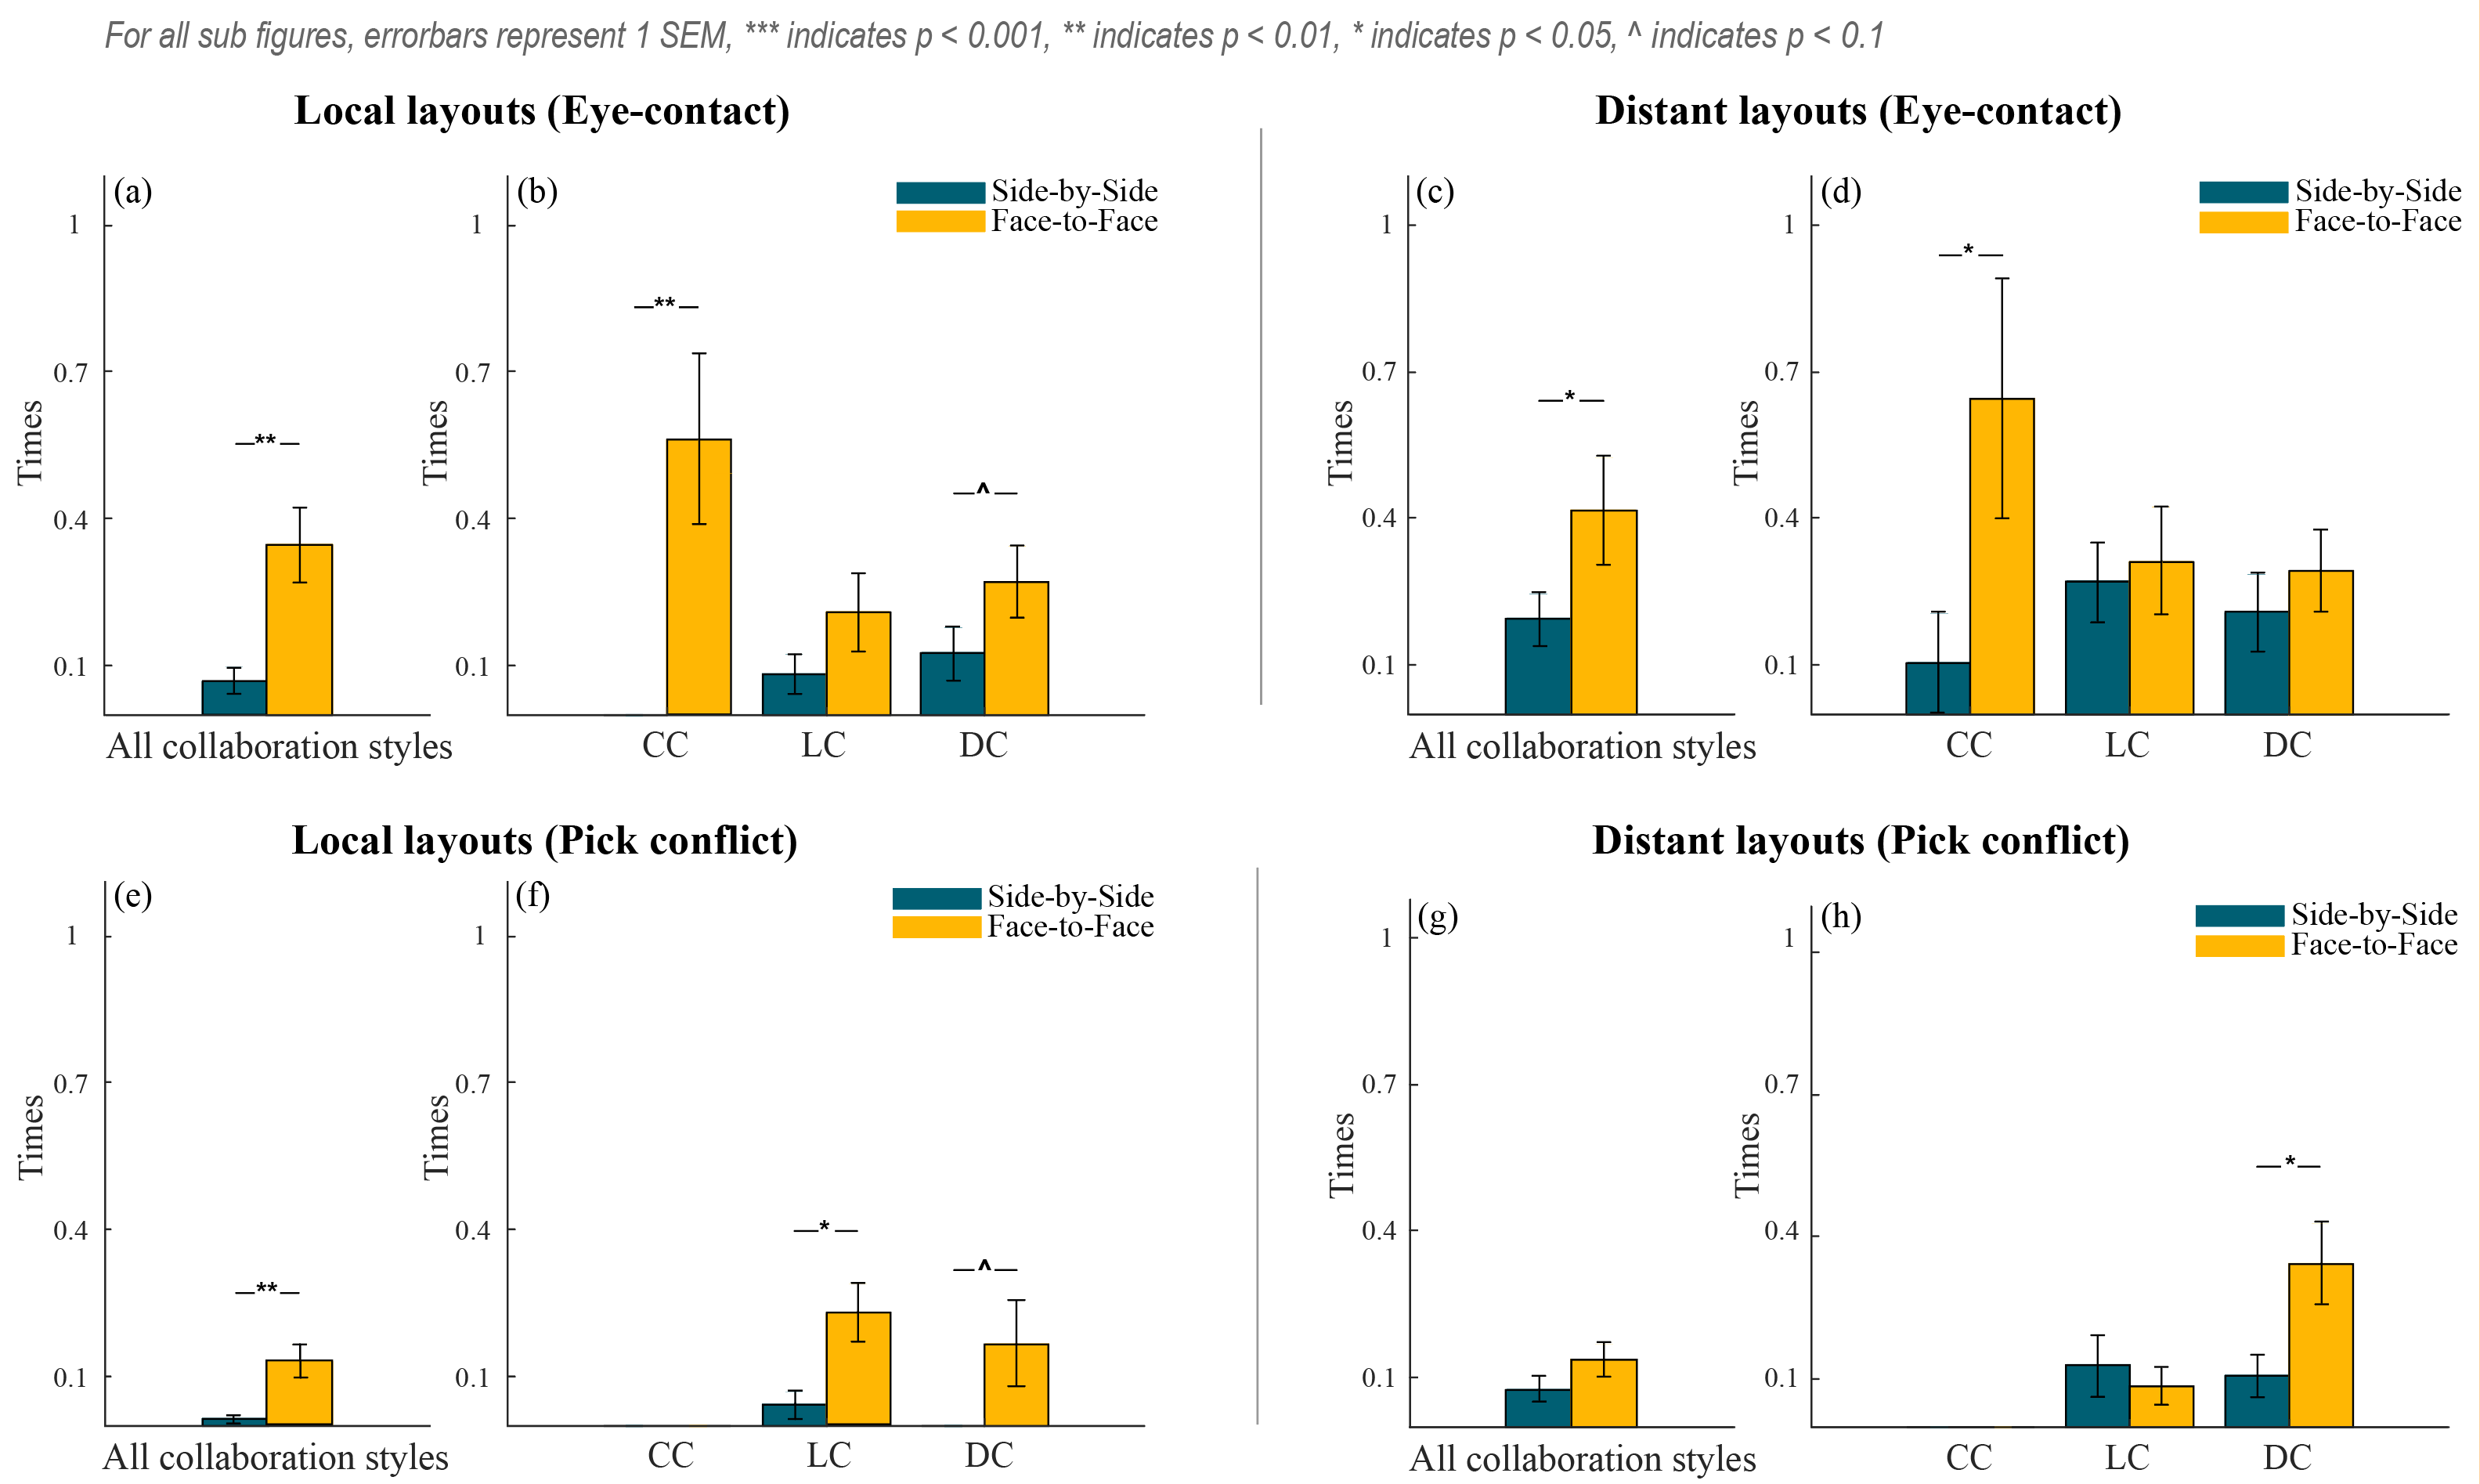
5.3.1. Eye-contact
For Local Layouts, combining three collaboration styles together (main effect), we found participants experienced more eye contacts (The number of times: MFace = 0.35, SDFace = 0.74, MSide = 0.069, SDSide = 0.28, F(1,23) = 13.3, p = 0.0013 ¡ 0.01, = 0.366, Fig. 11(a)) in Face-to-face than in Side-by-side. Within each Collaboration Style, pairwise comparisons revealed that Face-to-face had significantly more eye contact than Side-by-side in Close Collaboration (The number of times: MFace = 0.56, SDFace = 1.07, MSide = 0, SDSide = 0, t(23) = -3.24, p = 0.0036 ¡ 0.01, corrected) and Divide & Conquer (MFace = 0.27, SDFace = 0.44, MSide = 0.13, SDSide = 0.39, t(23) = -1.90, p = 0.0695 ¡ 0.1, marginally significant, uncorrected) collaboration styles (Fig. 11(b)).
For Distant Layouts, combining three collaboration styles together (main effect), we also found participants had more eye contact (The number of times: MFace = 0.41, SDFace = 0.92, MSide = 0.19, SDSide = 0.59, F(1,23) = 6.66, p = 0.0167 ¡ 0.05, = 0.225, Fig. 11(c)) in Face-to-face than in Side-by-side. Within each Collaboration Style, pairwise comparisons revealed that Face-to-face had significantly more eye contact than Side-by-side in Close Collaboration only (MFace = 0.64, SDFace = 1.33, MSide = 0.1, SDSide = 0.71, t(23) = -2.17, p = 0.0408 ¡ 0.05, uncorrected) collaboration style (Fig. 11(d)).
There were significant interaction effects between Collaboration Style and Standing Position on eye-contact for both Local Layouts(F(2,46) = 5.02, p = 0.0107 ¡ 0.05 , = 0.179) and Distant Layouts(F(2,46) = 2.88, p = 0.0661 ¡ 0.1, = 0.111).
We can see that participants had more eye contact in Face-to-face condition than in Side-by-side, which is consist with previous research that gaze awareness could be enhanced in face-to-face position (Ishii and Kobayashi, 1992). While this was true in all Collaboration Style, the difference was particularly large in Close Collaboration. Interestingly, while we see more eye contact in closer collaboration than in loose or no collaboration in Face-to-face, less eye contact was observed in closer collaboration in Side-by-side condition. We guess this might also be due to the multiple function of eye contact - both to communicate intention and to avoid or resolve conflict. In Side-by-side, other communication channels were used instead of eye contact, such as verbal or gestural, when participants were collaborating closely together, whereas in Face-to-face eye contact remained as a main communication channel.
5.3.2. Other communication channels
Through our on-site observation and post-task interview, we found there are three main communication channels that participants used to communicate and cooperate:Verbal Communication, Cursor, Body Language.
Verbal Communication: All participants reported they used verbal communication to convey messages while collaborating with their partners. In particular, P1-A shared her communication strategy: “I first told her ‘here’ and ‘there.’ But I found that was not clear enough. Later, I directed her with words like ‘below,’ and ‘above’. I think this was more efficient. For instance, if I told her ’I’m on the second line,’ that helped her quickly target where I was. Two people may think differently, and the information we share can be vague. So it is more efficient to give this kind of direction.”
Cursor: Six participants indicated that they will used the cursor to direct their partners, especially when they were in Face-to-face position. P1-B stated that:“If it is on the opposite side, I think it was very clear when he used the cursor to indicate to me the location. But when on the same side, since the position from which he was pointing was fixed, he could not exactly point the cursor to the position I needed to go. He could only tell me ’two up’ or ’two down’.” P12-A also pointed out that she used the cursor to help her partner, even during the DC collaborative style:“although in this situation, communication is forbidden, we could still use the cursor to indicate to the other person. I think the hints were more obvious when standing on the same side.”
Body Language: Body language has been mentioned when participants talk about how they interacted with their partners. Three pairs of participants mentioned they used finger pointing during collaboration. However, two teams indicated challenges of using finger pointing to guide others in Face-to-face condition. P1-B mentioned:“[In face-to-face condition], we first pointed with our fingers. But then I realized that I didn’t know where she was pointing. Later I discovered that although the cursor cannot be clicked, it can still be used as sort of a guidance”; Likewise, P10-A indicated that she barely saw her partner’s finger guide while she engaged in the task:“when standing on the opposite side, I always first found the target area before I saw his finger was pointing there.” Besides, P10-A also pointed out that she used peripheral vision to check on her partner, “when I am on the same side with my partner since he is next to me, I could see him with a peripheral vision, I received this kind of physical signal more directly while in a side-by-side position.”
From our observation, communication through all these channels occurred in both Side-by-side and Face-to-face conditions. However, the subjective feedback from the participants indicated different preferences for certain communication methods in different Standing Position: cursor communication was easier in Face-to-face and finger pointing was harder in Face-to-face, while peripheral vision can be well-used in Side-by-side.
5.3.3. Pick conflict
With all the communication channels in use, let us look at the result of pick conflict, which indicates part of the effectiveness of their communication.
For Local Layouts, combining three collaboration styles together (main effect), we found participants had more pick conflicts (The number of times: MFace = 0.13, SDFace = 0.39, MSide = 0.01, SDSide = 0.12, F(1,23) = 10.27, p = 0.0039 ¡ 0.01, = 0.309, Fig. 11(e)) in Face-to-face than in Side-by-side, while no significant interaction effect was found. Within each Collaboration Style, pairwise comparisons revealed more pick conflicts in Face-to-face than in Side-by-side happened in Loose Collaboration (The number of times: MFace = 0.23, SDFace = 0.47, MSide = 0.04, SDSide = 0.2, t(23) = -2.58, p = 0.0166 ¡ 0.0167, corrected) and Divide & Conquer (t(23) = -1.88, p = 0.0727 ¡ 0.1, marginally significant, uncorrected)(Fig. 11(f)).
For Distant Layouts, the main effect of Standing Position was not significant. There was a significant interaction effect on pick conflict occurrences (F(2,46) = 5.05, p = 0.0104 ¡ 0.05, = 0.180). Within each Collaboration Style, pairwise comparisons revealed that more pick conflicts in Face-to-face than in Side-by-side happened in Divide & Conquer only (The number of times: MFace = 0.33, SDFace = 0.55, MSide = 0.1, SDSide = 0.31, t(23) = -2.70, p = 0.0129 ¡ 0.0167, corrected) collaboration style (Fig. 11(h)). Notice that due to the design of this experiment, only one pick device was provided in Close Collaboration thus there was no pick conflict.
We can see generally there were significantly more pick conflict in Face-to-face condition than in Side-by-side. Probably more pick-conflict was a side effect of more territory crossing in screen space: two participants have separate physical spaces with fuzzy personal territories while they still share a common screen space, which causes more conflict. However there was no significant difference on pick conflict between standing positions in Loose Collaboration for Distant Layouts. Perhaps in this condition participants were able to exercised their freedom in free collaboration and use all communication channels, which allowed them to better avoid conflicts.
5.4. RQ4: Users’ Subjective Experience
We analyzed the NASA-TLX scores by comparing Side-by-side and Face-to-face with non-parametric permutation tests. We found no significant difference between them in any of the scale including Mental Demand, Physical Demand, Temporal Demand, Performance, Effort and Frustration. The only thing that came close to a difference was that Face-to-face (M = 2.58, SD = 1.10) was more temporally demanding than Side-by-side (M = 2.25, SD = 1.07) with a marginal significance p = 0.0740.
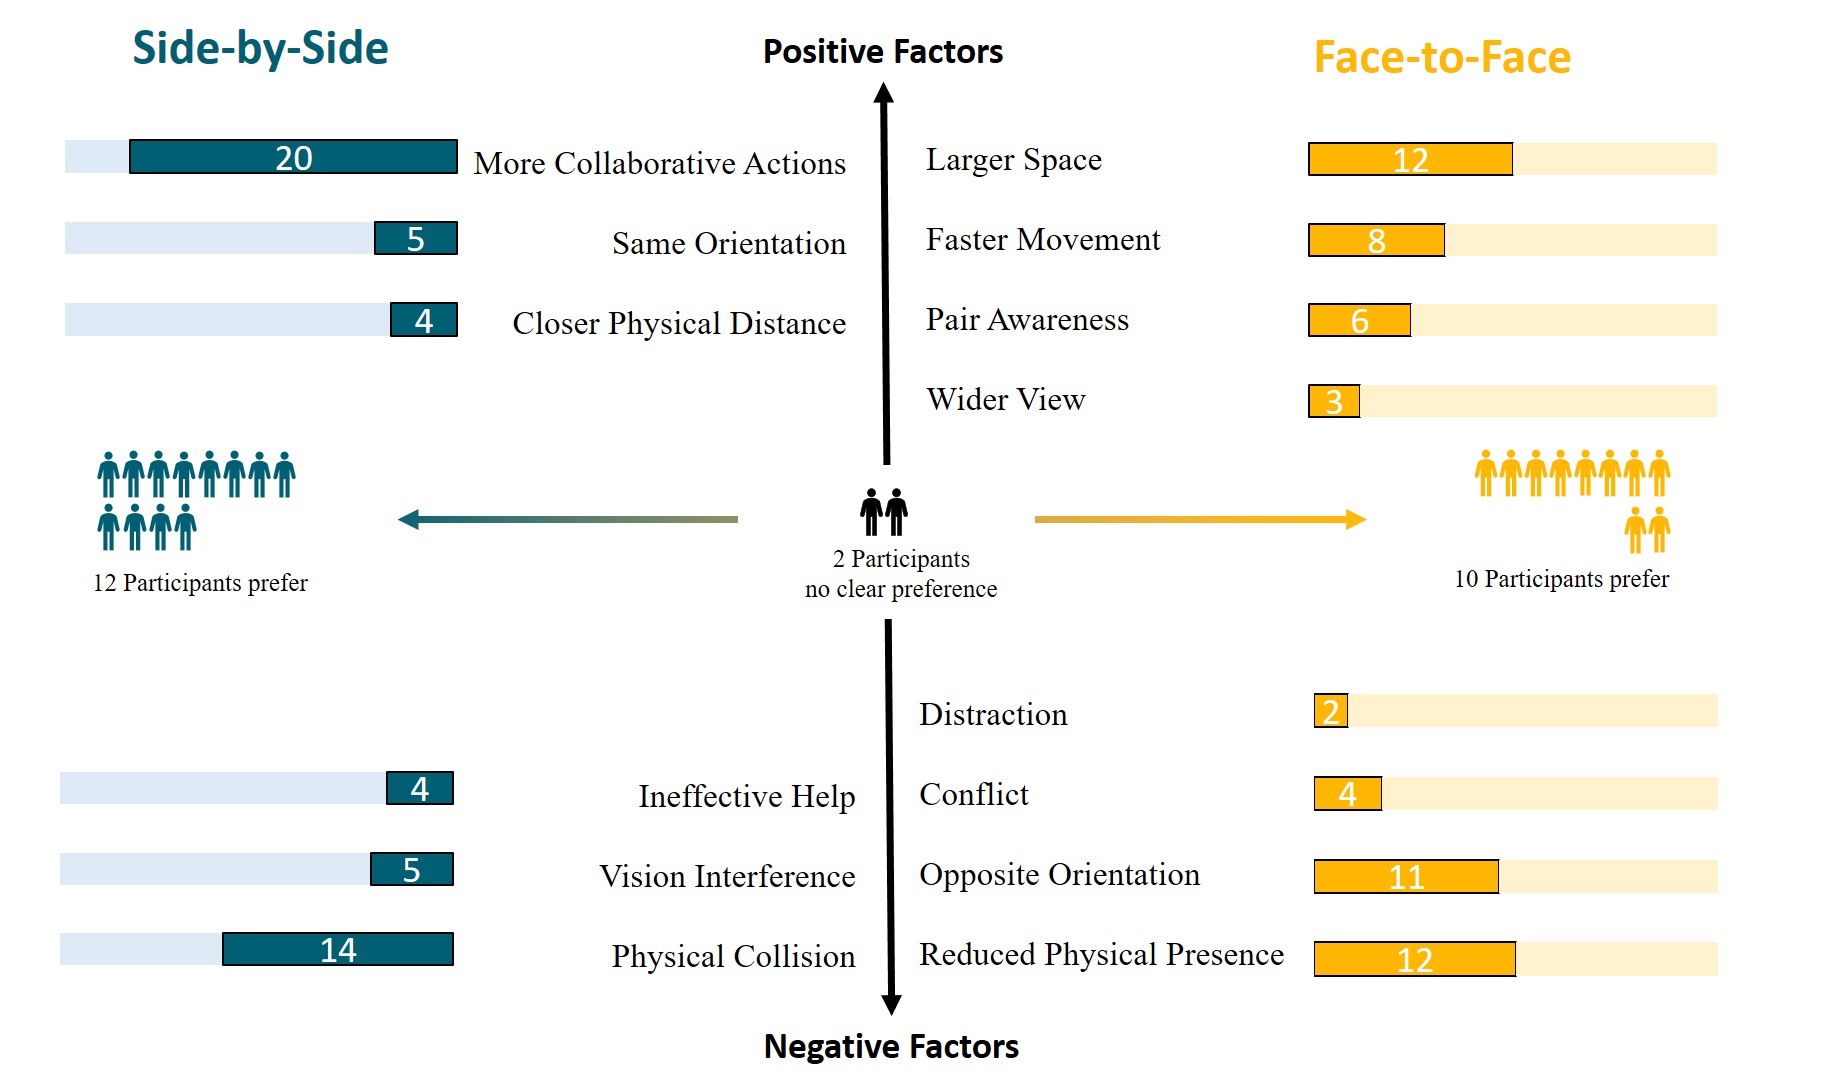
During the post-task interview, we ask users specifically about their feelings and self preference about the two collaborating standing positions. In general, 12 participants stated that they personally prefer to stand Side-by-side with their partners in front of the transparent display. 10 participants stated they preferred to stand on the opposite side while collaborating with their partners. There were two participants who reported their preference was based on specific circumstances. P3-B reported that she preferred Side-by-side collaboration in terms of collaborative experience and she preferred Face-to-face interaction in regard to task-performing efficiency; P10-B reported that under close and loose collaboration conditions in local layout he preferred Side-by-side collaboration; However, when under no collaboration condition in distance layout, he preferred Face-to-face collaboration. Additionally, we further coded the reasons behind their preferences and re-categorized the codes as the positive and negative factors of the two different collaboration styles., see Fig. 12. We will further introduce/explain their answers in below:
5.4.1. Factors affecting task performance in Side-by-Side Collaboration
Positive Factors
We found three main positive factors of Side-by-side collaboration reported by our participants as follows:
More Collaborative Actions: 20 participants stated there was more collaboration involved while standing on the same side of the display. P2-B mentioned: “Standing on the same side is itself a kind of collaboration. When he couldn’t find the location, I could move to the right position and call him to come over.”
Same Orientation: Five participants reported they liked the consistency of direction orientation, as P8-A explains: “…mainly because of the direction. For example, if you couldn’t find a disc, your partner could just simply say ‘it’s on your left!”’
Closer Physical Distance: Three participants stated that they felt physically closer to their partners. P5-A responded: “There was a sense of distance when standing on the opposite side of my partner. Since he is my partner, I felt more comfortable when he stood beside me; maybe it is a sort of a psychological effect.”
Negative Factors
We found three main negative factors of Side-by-side collaboration reported by our participants as follows:
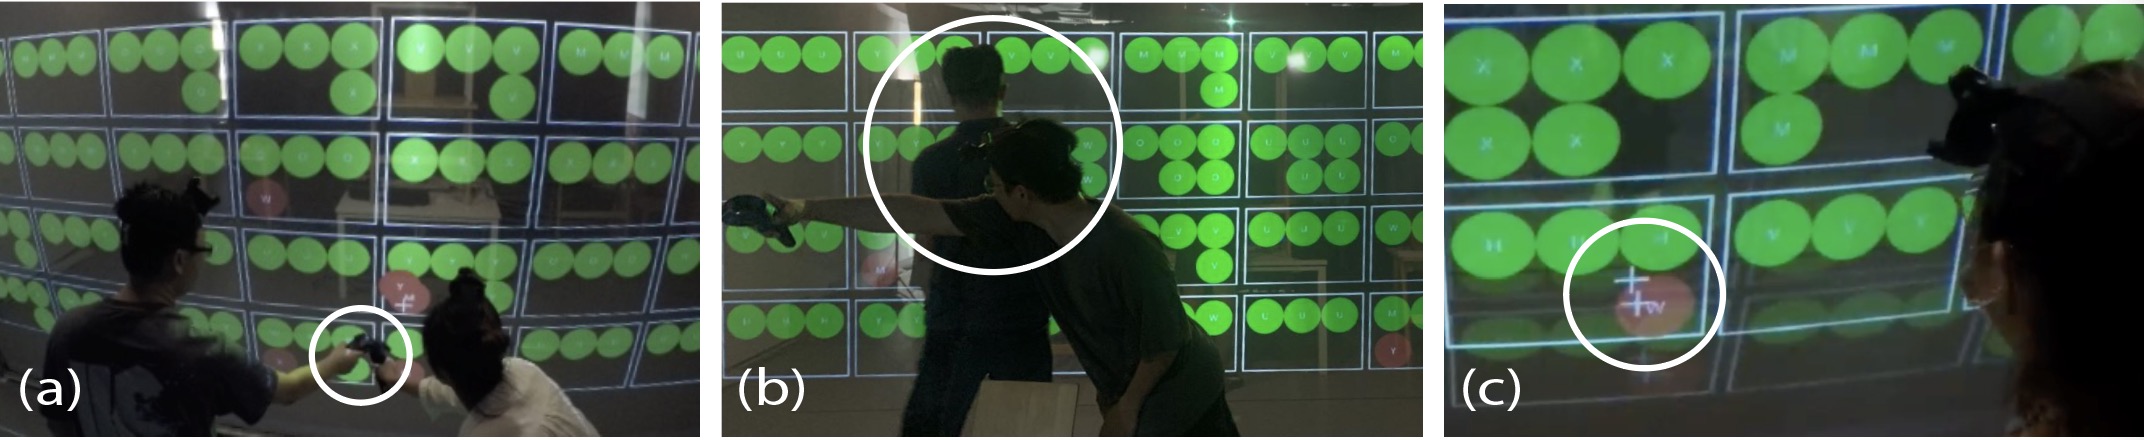
Physical Collision: 14 participants reported they had concerns about colliding with their partners when standing on the same side of the transparent display (See Fig. 13(a)). P8-A indicated: “We happened to bump into each other at first because we hadn’t discussed a positioning strategy. I tried to avoid weaving in and out during the tasks since I didn’t want to affect my partner. However, it made it hard to get the discs that I wanted.” P12-B also mentioned the side effects after a collision: “During the D&C collaboration style and distant layout scenario, we inevitably had intersecting trajectories. After the running into each other, some of the disc positions we were trying to remember were suddenly forgotten. Because of the ban on communication, we could no longer recall the positions, which slowed down our completion of the tasks.”
Vision Interference: Five participants reported their partner blocked their vision while switching positions (See Fig. 13(b)). For example, P6-B stated: “for instance, when I saw an ‘x’ on the lower right corner, but the frame was on the upper left and so I needed to move the disc and cross paths with my partner, however, because he was standing in front of the display when I passed by him, my disc would disappear and I couldn’t see it for a bit.”
Ineffective Help: Four participants pointed out that collaboration could be in effective due to different work styles. P3-B mentioned that taking guidance sometimes can be troubling: “maybe we had better not have collaborated. We didn’t know each other before, so I didn’t know his manner or way of thinking. He didn’t know mine either. For example, if there were two ‘v’s and he wanted me to place them both together in the correct frame, but maybe I preferred to drag one disc first and then on the way drag the other red disc. Maybe his way of doing something might be different from mine, so it was a little stressful when we collaborated. I wanted to choose a certain disc to move, but he might have already clicked on a different one.” P4-B added: “he thought you were going to click this ball, but you actually were going to click another. So his instruction to you is useless.”
5.4.2. Factors affecting task performance in face-to-face Collaboration
Positive Factors
We found four main positive factors of Face-to-face collaboration reported by our participants as follow:
Larger Space: 12 participants reported that they acquired a larger active space while standing in Face-to-face with their partners. P3-A mentioned the advantage of not having the bumping issue they had when standing Side-by-side:“when the two people stand on the same side, sometimes due to the space limitations they may try to change positions. When we were standing on different sides of the display, I didn’t worry about bumping into my partner when I changed my position.” P1-A:“I had more freedom when standing on the opposite side. I could go further.” This supports and explains our findings on more territorial crossing in Face-to-face condition.
Faster Movement: Eight participants claimed that working on opposite sides contributed to more effective individual performance since they had more space to move around and could be more focused on their own tasks. P5-B explained:“I could move faster when standing on the opposite side. I didn’t have to worry about stepping on my partner’s feet.” This is consistent with our quantitative finding that the physical movement speed was measured higher in Face-to-face than in Side-by-side for Distant Layouts (see Fig. 8).
Collaborative Awareness: Six participants mentioned that awareness of their partner rose during Face-to-face collaboration, which enabled even more ability to help each other in comparison to Side-by-side collaboration. P1-B mentions: “It was very clear for me when she pointed with the cursor.” P4-B explained: “We had more interaction while standing on the opposite sides of the display. Maybe this is because when we communicated, he knew my relative position better. For example, when I wanted to point to him he could see me, and see whether I was in the middle or on which side. Your own spatial position was also a kind of instruction.”
Wider View: Three participants reported that Face-to-face collaboration provided them with a broader view. P4-A mentioned that “when standing on each side, I felt my vision was wider. I could see what he was choosing, and I could help him find the next.” (P8-A mentioned the same.)
Negative Factors
We found four main negative factors of Face-to-face collaboration reported by our participants as follow:
Reduced Physical Presence: 12 participants reported different presence issues. Five participants reported they could not see the display clearly; Five participants said they could not hear any guidance; Two participants reported they could not see the other’s body language. P9-B stated that:“I could hardly hear my partner’s instruction from the other side, and could hardly see him as well. ” P10-A mentioned “my partner didn’t talk much. When standing on the opposite side of the display, I could not discern his body language since I was also watching the content on the display. Sometimes I found he was helping point out a position, but I had already finished.”
Opposite Orientation: 11 participants reported a directional issue while standing on opposite sides of the display. All complaints were the same as participant P7-A: “It was more difficult to describe when on opposite sides. It takes a lot of brain power. You need to turn your brain around to know whether it is on the ’left’ or ’right’, which is his ’left’.”
Conflict: Four participants mentioned there was conflict involved. As explained by participant P3-B: “There may be minor conflict when standing on each side of the display, when there are not many discs left, both of us may go after the same disc” (See Fig. 13(c)). This was consistent with our quantitative findings on Pick Conflict (see Fig. 11).
Distraction: Two participants mentioned that they were distracted by their partners since they needed to look both at the display and also check on their partner. P5-A stated: “when he was standing opposite me, the back light shining on him projected a shadow on the display, which affected my view.”
6. Discussion
Previous session elaborated in detail how Side-by-side and Face-to-face affected task performance, users’ navigation pattern and territoriality, communication, conflicts as well as users’ subjective experiences. Here we summarize the findings and discuss them in light of existing literature.
6.1. Collaboration Efficiency and Experience Around Transparent Display
From participants’ subjective experience, we learned that pairs collaborated more closely in Side-by-side than Face-to-face when given the choice. However, the task efficiency was not higher but slightly lower in Side-by-side position. This is consistent with findings in previous work that collaboration could hinder efficiency, even though it may improve subjective experience (Liu et al., 2016). In our case, participants raised the issue that sometimes seeking help from their partner did not lead to effective help. Other potential reasons being indicated include more physical collision and vision interference in the Side-by-side configuration. On the other hand, the Face-to-face configuration with a see-through display clearly increased collaborative awareness, which is also known to support collaboration (Ishii and Kobayashi, 1992; Pejsa et al., 2016). The larger space for physical movement in Face-to-face configuration provided a collision-free space for each participant to reach anywhere on the screen to perform tasks and help each other. This was much appreciated, but meanwhile also led to more conflicted actions as picking the same disc.
The user preferences between Side-by-side and Face-to-face are on par. Overall there is no clear “winner” per se between Side-by-side and Face-to-face configuration. They are rather complimentary and have both strengths and weaknesses. Likewise, users’ subjective preferences would also take consideration. We found collaboration has different meanings from person to person. For instance, P5-A mentioned that she “felt more comfortable” in the Side-by-side position because she likes to always work closely with her partner. P1-A also mentioned that she prefers Side-by-side position because more collaboration has occurred. On the other hand, some participants considered task efficiency when making their preference. P3-B explained that even though collaboration is more fun, it reduces the task efficiency. P11-B indicated he prefers work by himself because the overall task was easy and not necessary for communication or collaboration. P8-B mentioned that she prefers Face-to-face position because she is more focused on finishing the task and she “think(s) faster when working alone.” Interestingly, P12-B mentioned that even the goal is to work together, but she is more interested in competition. She considered the Side-by-side position to be more competitive, ”I can obviously feel that I want to do more when standing on the opposite with my partner, I intentionally want to win the competition.“
Overall, by providing two standing positions, transparent display would potentially support more diverse collaboration scenarios and user preference than traditional displays.
6.2. New Territoriality Around Transparent Displays
Territoriality is widely discussed in the literature of colocated collaboration. Territories form naturally to help people mediate their social interaction through laying claim association of a space to a person during computer-supported cooperative work (Ruddle et al., 2015; Tang, 1991; Scott et al., 2004; Sigitov et al., 2019).
The territoriality we observed in the Side-by-side condition was similar to findings in previous works on tabletops (Scott et al., 2004) and wall displays (Sigitov et al., 2019). We can see participants tended to divide the screen into separate work areas (see Fig. 10 (Local/Distant Layout, Side-by-Side)). This was also the case in Face-to-face condition with local layouts where participants did not need to search far to find a target container. We also observed similar issues of collision and interference in Side-by-side situation (see Fig. 13 (a), (b)), which is consistent with previous research indicating that people must negotiate the use of the shared space when space is scarce, because of physical interference, collisions, and occlusion problem (Scott et al., 2004; Ha et al., 2006; Jakobsen and Hornbæk, 2016).
Our findings go beyond existing knowledge about territoriality in colocated collaboration, by identifying a different territorial behaviour in Face-to-face configuration with a transparent large display. The large space on two sides of the screen provided the freedom for users to move around and access anywhere on the screen, which led to much more territorial overlap on the screen space compared to Side-by-side. In the meanwhile, the physical territories were preserved by the screen partitioning the room into two sides, to keep collaborators collision-free and socially comfortable. This finding was supported and explained by four different measures in our study comparing Face-to-face to Side-by-side, including the more overlapped cursor activity areas in the visualization of human and cursor movements (Fig. 10), the significantly higher frequency of trajectory cross (Fig. 9), the significantly faster travel speed of participants (Fig. 8) as well as the closer horizontal distance between participants (Fig. 7). This finding is in line with the work of Soni et al. (Soni et al., 2021), which also found that group members did not tend to partition the space when the user can move freely in front of the display.
6.3. Awareness and Conflict Around Transparent Displays
Awareness itself can be referred to the understanding and subsequent response to the environment and activities of others (Dourish and Bellotti, 1992), which is also one of the central concepts in Computer Supported Cooperative Work.
Through quantitative analysis, we found in Face-to-face position, participants commonly reported the orientation reversal problem, in which one participant’s left is the others’ right. Li et al (Li et al., 2014). indicated the image and text reversal issue existent with the two-sided transparent display. Our study has further understood how the mirror-effect affected people’s collaboration. 11 participants reported they experienced the confusions caused by the opposite orientation. As P7-A mentioned,”it “takes a lot of brainpower” to converse his left to his partner’s right, with opposite orientation, muddle be one of the reasons for explaining why participants reported higher mental demand while performing tasks in the Side-by-side position.
We also found that as a side effect of overlapped screen territories, Side-by-side collaboration had more action conflicts between participants. However, this was mitigated when participants were loosely collaborating on distant layouts. Our interviews identified the communication channels participants used in all conditions, including verbal communication, body gestures and cursor indication. They also revealed insights on how cursor indication was effective and body gestures were ineffective for communication through transparent displays. People would like to use both verbal and non-verbal communication when collaboration, which consist with previous study that implicit communication is important for collaboration (Che et al., 2020; Zheng, 2022; Zheng and Tversky, 2022).
In addition, consistent with previous work, we also found the lack of full transparency of the display affected the awareness and communication between partners. Some previous studies acknowledged this issue and even researched on finding feasible solutions for resolving this issue. For instance, Li et al. (Li et al., 2017) introduced a trace augmentation method to trace the user’s cursor movement; Prouzeau et al. (Prouzeau et al., 2018) proposed Awareness Bards, Focus Map, and Step Map to assist the transition between personal and shared workspaces; Li et al. (Li et al., 2016) and Akkil et al. (Akkil et al., 2016) tried to introduced gaze awareness for user to better collaborate for remote physical tasks.
6.4. Implications for Collaborative Transparent Display
In this experiment, we set three collaborative styles including CC, CL,and DC and two layouts including local and distant. Critically, we found the standing position was not independent of these two variables, which means some differences between the Side-by-side position and the Face-to-face position were condition specific. This suggests some unique properties of transparent displays in certain situations and possible implications for future design. For instance, Face-to-face resulted in higher efficiency when users collaborated in the distant layout (see Fig. 5), which allowed users to have a wider view and higher physical movement speed (see Fig. 8). These results suggested that the high efficiency (less time consumption) of the Face-to-face position could only be manifested in difficult and space-demanding tasks, while in simple tasks there was no efficiency difference between Side-by-side and Face-to-face positions. Thus, the transparent display may be utilized for maximize advantages for spatially demanding and difficult tasks where a traditional non-transparent display may fail.
We also discovered more pairs pick conflicts in the Face-to-face position. Throughout the post-task interview, 12 participants reported different presence issues, such as an obscured user’s view of each other and distorted speech. Some presence issues can be resolved using action and speech augmentation techniques, while others cannot. For example, in the Face-to-face, the participates had a larger absolute distance and a smaller horizontal distance. Thus, clicking on the same object from opposite sides of the screen might be caused by a reduced physical presence. The transparent display is only a kind of ”see-through” but not ”walk-through” medium. Even though the transparent display is made of thin see-through fibre, it can inhibit the physical presence across the display, which causes a physical barrier. On account of this, we suggest that the Face-to-face position with a transparent display could be used in more independent collaborative tasks, and the Side-by-side position with either non-transparent or transparent display is suitable for close collaborative tasks.
6.5. Limitations and Future Work
The limitations of this work are listed as follows:
First, technical limitations of the display hardware provide limited transparency and weakened speech recognition, which may affect the performance and collaboration effectiveness of the Face-to-face condition. Although technical limitations may have affected some measures, we believe most of our effects and findings were strong and robust enough to hold with another similar transparent display. However, the configuration of the transparent display can be various. Different designs of transparent displays (such as different display sizes, different input devices, and different transparency levels) could be involved to further understand collaborative behaviours around transparent display in the future.
Second, our study adopted an abstract classification task to serve the purpose of making quantitative and qualitative comparisons between transparent displays and traditional one-side use displays. While providing robust and replicatable comparisons, our study sacrificed some external validity. Moreover, our study used a data manipulation task, thus the findings can be generalized to a range of tasks that make spatial arrangements of data items, including sense-making of scattered items, and other classification task. However, our findings may not generalize very well to other different tasks in nature. For the future work, we would conduct different collaborative tasks, such as sense-making (Morris et al., 2010) or immersive analytics (Isenberg et al., 2011) to further understand collaborative behaviours around the transparent display in other application fields.
Third, our study only implemented on pairs of people. We chose pair as the group size since it is the smallest collaboration unit size, and small group collaboration may be divided into pair collaboration. More experiments are needed in the future to understand the effect of different group sizes and to investigate the suitable group size for wall-sized transparent displays. In the future, we will design and test other types of collaborative study to enrich our understanding about collaborative transparent display.
7. Conclusion
In this paper, we conducted a comparative study with an established method to investigate how wall-sized transparent displays support colocated collaborative work, in particular, how it differs from existing one-side-use wall displays. We achieved a rigorous quantitative and qualitative comparison by recruiting 12 pairs of participants to perform tasks face-to-face versus side-to-side using the same transparent display. Although previous works discussed the potential advantages and challenges of using various transparent displays to support collaboration, we are the first to formally evaluated the effects of transparent displays on a colocated collaboration task. By comparing task performances, physical navigation and territoriality, communication and conflicts, we identified unique characteristics of transparent displays: supporting new territorial behaviours with large and divided physical space; improving collaborative awareness; challenges in communication. Furthermore, we concluded a complete list of positive and negative factors identified in collaborating face-to-face and side-by-side. Our work contributes to the empirical understanding of transparent displays and provide insights for designing future systems on such platforms for supporting colocated collaboration.
Acknowledgements.
This project is supported by National Natural Science Foundation Youth Fund 62202267. Thanks for all the participants.References
- (1)
- (1984) 1984. SIGCOMM Comput. Commun. Rev. 13-14, 5-1 (1984).
- Cze (2008) 2008. CHI ’08: CHI ’08 extended abstracts on Human factors in computing systems (Florence, Italy). ACM, New York, NY, USA. General Chair-Czerwinski, Mary and General Chair-Lund, Arnie and Program Chair-Tan, Desney.
- Ablamowicz and Fauser (2007) Rafal Ablamowicz and Bertfried Fauser. 2007. CLIFFORD: a Maple 11 Package for Clifford Algebra Computations, version 11. Retrieved February 28, 2008 from http://math.tntech.edu/rafal/cliff11/index.html
- Abril and Plant (2007) Patricia S. Abril and Robert Plant. 2007. The patent holder’s dilemma: Buy, sell, or troll? Commun. ACM 50, 1 (Jan. 2007), 36–44. https://doi.org/10.1145/1188913.1188915
- Adya et al. (2004) A. Adya, P. Bahl, J. Padhye, A.Wolman, and L. Zhou. 2004. A multi-radio unification protocol for IEEE 802.11 wireless networks. In Proceedings of the IEEE 1st International Conference on Broadnets Networks (BroadNets’04). IEEE, Los Alamitos, CA, 210–217.
- Akkil et al. (2016) Deepak Akkil, Jobin Mathew James, Poika Isokoski, and Jari Kangas. 2016. GazeTorch: enabling gaze awareness in collaborative physical tasks. In Proceedings of the 2016 CHI Conference Extended Abstracts on Human Factors in Computing Systems. 1151–1158.
- Akyildiz et al. (2007) I. F. Akyildiz, T. Melodia, and K. R. Chowdhury. 2007. A Survey on Wireless Multimedia Sensor Networks. Computer Netw. 51, 4 (2007), 921–960.
- Akyildiz et al. (2002) I. F. Akyildiz, W. Su, Y. Sankarasubramaniam, and E. Cayirci. 2002. Wireless Sensor Networks: A Survey. Comm. ACM 38, 4 (2002), 393–422.
- American Mathematical Society (2015) American Mathematical Society 2015. Using the amsthm Package. American Mathematical Society. http://www.ctan.org/pkg/amsthm.
- Andler (1979) Sten Andler. 1979. Predicate Path expressions. In Proceedings of the 6th. ACM SIGACT-SIGPLAN symposium on Principles of Programming Languages (POPL ’79). ACM Press, New York, NY, 226–236. https://doi.org/10.1145/567752.567774
- Andrews et al. (2010) Christopher Andrews, Alex Endert, and Chris North. 2010. Space to think: large high-resolution displays for sensemaking. In Proceedings of the SIGCHI conference on human factors in computing systems. 55–64.
- Anisi (2003) David A. Anisi. 2003. Optimal Motion Control of a Ground Vehicle. Master’s thesis. Royal Institute of Technology (KTH), Stockholm, Sweden.
- Antunes et al. (2014) Pedro Antunes, Valeria Herskovic, Sergio F Ochoa, and José A Pino. 2014. Reviewing the quality of awareness support in collaborative applications. Journal of Systems and Software 89 (2014), 146–169.
- Anzaroot and McCallum (2013) Sam Anzaroot and Andrew McCallum. 2013. UMass Citation Field Extraction Dataset. Retrieved May 27, 2019 from http://www.iesl.cs.umass.edu/data/data-umasscitationfield
- Anzaroot et al. (2014) Sam Anzaroot, Alexandre Passos, David Belanger, and Andrew McCallum. 2014. Learning Soft Linear Constraints with Application to Citation Field Extraction. arXiv:1403.1349
- Archer, Jr. et al. (1984) J. E. Archer, Jr., R. Conway, and F. B. Schneider. 1984. User recovery and reversal in interactive systems. ACM Trans. Program. Lang. Syst. 6, 1 (Jan. 1984), 1–19.
- Bahl et al. (2004) P. Bahl, R. Chancre, and J. Dungeon. 2004. SSCH: Slotted Seeded Channel Hopping for Capacity Improvement in IEEE 802.11 Ad-Hoc Wireless Networks. In Proceeding of the 10th International Conference on Mobile Computing and Networking (MobiCom’04). ACM, New York, NY, 112–117.
- Begole et al. (1999) James Begole, Mary Beth Rosson, and Clifford A Shaffer. 1999. Flexible collaboration transparency: supporting worker independence in replicated application-sharing systems. ACM Transactions on Computer-Human Interaction (TOCHI) 6, 2 (1999), 95–132.
- Benko et al. (2015) Hrvoje Benko, Eyal Ofek, Feng Zheng, and Andrew D Wilson. 2015. Fovear: Combining an optically see-through near-eye display with projector-based spatial augmented reality. In Proceedings of the 28th Annual ACM Symposium on User Interface Software & Technology. 129–135.
- Benko et al. (2014) Hrvoje Benko, Andrew D Wilson, and Federico Zannier. 2014. Dyadic projected spatial augmented reality. In Proceedings of the 27th annual ACM symposium on User interface software and technology. 645–655.
- Bornmann et al. (2019) Lutz Bornmann, K. Brad Wray, and Robin Haunschild. 2019. Citation concept analysis (CCA)—A new form of citation analysis revealing the usefulness of concepts for other researchers illustrated by two exemplary case studies including classic books by Thomas S. Kuhn and Karl R. Popper. arXiv:1905.12410 [cs.DL]
- Bowman et al. (1993) Mic Bowman, Saumya K. Debray, and Larry L. Peterson. 1993. Reasoning About Naming Systems. ACM Trans. Program. Lang. Syst. 15, 5 (November 1993), 795–825. https://doi.org/10.1145/161468.161471
- Braams (1991) Johannes Braams. 1991. Babel, a Multilingual Style-Option System for Use with LaTeX’s Standard Document Styles. TUGboat 12, 2 (June 1991), 291–301.
- Buss et al. (1987a) Jonathan F. Buss, Arnold L. Rosenberg, and Judson D. Knott. 1987a. Vertex Types in Book-Embeddings. Technical Report. Amherst, MA, USA.
- Buss et al. (1987b) Jonathan F. Buss, Arnold L. Rosenberg, and Judson D. Knott. 1987b. Vertex Types in Book-Embeddings. Technical Report. Amherst, MA, USA.
- Carroll et al. (2003) John M Carroll, Dennis C Neale, Philip L Isenhour, Mary Beth Rosson, and D Scott McCrickard. 2003. Notification and awareness: synchronizing task-oriented collaborative activity. International Journal of Human-Computer Studies 58, 5 (2003), 605–632.
- Cetin et al. (2018) Gokhan Cetin, Wolfgang Stuerzlinger, and John Dill. 2018. Visual analytics on large displays: exploring user spatialization and how size and resolution affect task performance. In 2018 International Symposium on Big Data Visual and Immersive Analytics (BDVA). IEEE, 1–10.
- Chang et al. (2015) Y-L Betty Chang, Cresencia Fong, Edward Tse, Mark Hancock, and Stacey D Scott. 2015. ” Callout Bubble Saved My Life” Workspace Awareness Support in BYOD Classrooms. In Proceedings of the 2015 International Conference on Interactive Tabletops & Surfaces. 73–82.
- Che et al. (2020) Yuhang Che, Allison M Okamura, and Dorsa Sadigh. 2020. Efficient and trustworthy social navigation via explicit and implicit robot–human communication. IEEE Transactions on Robotics 36, 3 (2020), 692–707.
- Chen et al. (2020) Lei Chen, Hai-Ning Liang, Feiyu Lu, Konstantinos Papangelis, Ka Lok Man, and Yong Yue. 2020. Collaborative behavior, performance and engagement with visual analytics tasks using mobile devices. Human-centric Computing and Information Sciences 10, 1 (2020), 1–24.
- Cherek et al. (2018) Christian Cherek, Anke Brocker, Simon Voelker, and Jan Borchers. 2018. Tangible Awareness: How Tangibles on Tabletops Influence Awareness of Each Other’s Actions. In Proceedings of the 2018 CHI Conference on Human Factors in Computing Systems. 1–7.
- Cidota et al. (2016) Marina Cidota, Stephan Lukosch, Dragos Datcu, and Heide Lukosch. 2016. Workspace awareness in collaborative AR using HMDS: a user study comparing audio and visual notifications. In Proceedings of the 7th Augmented Human International Conference 2016. 1–8.
- Clark (1991) Malcolm Clark. 1991. Post Congress Tristesse. In TeX90 Conference Proceedings. TeX Users Group, 84–89.
- Clarkson (1985a) Kenneth L. Clarkson. 1985a. Algorithms for Closest-Point Problems (Computational Geometry). Ph.D. Dissertation. Stanford University, Palo Alto, CA. UMI Order Number: AAT 8506171.
- Clarkson (1985b) Kenneth Lee Clarkson. 1985b. Algorithms for Closest-Point Problems (Computational Geometry). Ph.D. Dissertation. Stanford University, Stanford, CA, USA. Advisor(s) Yao, Andrew C. AAT 8506171.
- Cohen (1996) Jacques Cohen (Ed.). 1996. Special issue: Digital Libraries. Commun. ACM 39, 11 (Nov. 1996).
- Cohen et al. (2007) Sarah Cohen, Werner Nutt, and Yehoshua Sagic. 2007. Deciding equivalances among conjunctive aggregate queries. J. ACM 54, 2, Article 5 (April 2007), 50 pages. https://doi.org/10.1145/1219092.1219093
- Collier (1993) David Collier. 1993. The comparative method. Political Science: The State of Discipline II, Ada W. Finifter, ed., American Political Science Association (1993).
- Conti et al. (2009a) Mauro Conti, Roberto Di Pietro, Luigi V. Mancini, and Alessandro Mei. 2009a. (new) Distributed data source verification in wireless sensor networks. Inf. Fusion 10, 4 (Oct. 2009), 342–353. https://doi.org/10.1016/j.inffus.2009.01.002
- Conti et al. (2009b) Mauro Conti, Roberto Di Pietro, Luigi V. Mancini, and Alessandro Mei. 2009b. (old) Distributed data source verification in wireless sensor networks. Inf. Fusion 10, 4 (2009), 342–353. https://doi.org/10.1016/j.inffus.2009.01.002
- Corbin and Strauss (2014) Juliet Corbin and Anselm Strauss. 2014. Basics of qualitative research: Techniques and procedures for developing grounded theory. Sage publications.
- CROSSBOW (2008) CROSSBOW 2008. XBOW Sensor Motes Specifications. http://www.xbow.com.
- Culler et al. (2004) D. Culler, D. Estrin, and M. Srivastava. 2004. Overview of Sensor Networks. IEEE Comput. 37, 8 (Special Issue on Sensor Networks) (2004), 41–49.
- Dey and de Guzman (2006) Anind K Dey and Ed de Guzman. 2006. From awareness to connectedness: the design and deployment of presence displays. In Proceedings of the SIGCHI conference on human factors in computing systems. 899–908.
- Dijkstra (1979) E. Dijkstra. 1979. Go to statement considered harmful. In Classics in software engineering (incoll). Yourdon Press, Upper Saddle River, NJ, USA, 27–33. http://portal.acm.org/citation.cfm?id=1241515.1241518
- Douglass et al. (1998) Bruce P. Douglass, David Harel, and Mark B. Trakhtenbrot. 1998. Statecarts in use: structured analysis and object-orientation. In Lectures on Embedded Systems, Grzegorz Rozenberg and Frits W. Vaandrager (Eds.). Lecture Notes in Computer Science, Vol. 1494. Springer-Verlag, London, 368–394. https://doi.org/10.1007/3-540-65193-4_29
- Dourish and Bellotti (1992) Paul Dourish and Victoria Bellotti. 1992. Awareness and coordination in shared workspaces. In Proceedings of the 1992 ACM conference on Computer-supported cooperative work. 107–114.
- Dunlop and Basili (1985) D. D. Dunlop and V. R. Basili. 1985. Generalizing specifications for uniformly implemented loops. ACM Trans. Program. Lang. Syst. 7, 1 (Jan. 1985), 137–158.
- Editor (2007) Ian Editor (Ed.). 2007. The title of book one (1st. ed.). The name of the series one, Vol. 9. University of Chicago Press, Chicago. https://doi.org/10.1007/3-540-09237-4
- Editor (2008) Ian Editor (Ed.). 2008. The title of book two (2nd. ed.). University of Chicago Press, Chicago, Chapter 100. https://doi.org/10.1007/3-540-09237-4
- Elrod et al. (1992) Scott Elrod, Richard Bruce, Rich Gold, David Goldberg, Frank Halasz, William Janssen, David Lee, Kim McCall, Elin Pedersen, Ken Pier, et al. 1992. Liveboard: a large interactive display supporting group meetings, presentations, and remote collaboration. In Proceedings of the SIGCHI conference on Human factors in computing systems. 599–607.
- Fear (2005) Simon Fear. 2005. Publication quality tables in LaTeX. http://www.ctan.org/pkg/booktabs.
- Geiger and Meek (2005) Dan Geiger and Christopher Meek. 2005. Structured Variational Inference Procedures and their Realizations (as incol). In Proceedings of Tenth International Workshop on Artificial Intelligence and Statistics, The Barbados. The Society for Artificial Intelligence and Statistics.
- Gergle et al. (2013) Darren Gergle, Robert E Kraut, and Susan R Fussell. 2013. Using visual information for grounding and awareness in collaborative tasks. Human–Computer Interaction 28, 1 (2013), 1–39.
- Gerndt (1989) Michael Gerndt. 1989. Automatic Parallelization for Distributed-Memory Multiprocessing Systems. Ph.D. Dissertation. University of Bonn, Bonn, Germany.
- Gong et al. (2021a) Jiangtao Gong, Teng Han, Siling Guo, Jiannan Li, Siyu Zha, Liuxin Zhang, Feng Tian, Qianying Wang, and Yong Rui. 2021a. HoloBoard: a Large-format Immersive Teaching Board based on pseudo HoloGraphics. In The 34th Annual ACM Symposium on User Interface Software and Technology. 441–456.
- Gong et al. (2021b) Jiangtao Gong, Xiaobai Ji, Siyu Zha, Teng Han, Qicheng Ding, Jiannan Li, Liuxin Zhang, and Qianying Wang. 2021b. HoloBoard: an Immersive Teaching Board System. In Extended Abstracts of the 2021 CHI Conference on Human Factors in Computing Systems. 1–4.
- Goossens et al. (1999) Michel Goossens, S. P. Rahtz, Ross Moore, and Robert S. Sutor. 1999. The Latex Web Companion: Integrating TEX, HTML, and XML (1st ed.). Addison-Wesley Longman Publishing Co., Inc., Boston, MA, USA.
- Grinstein et al. (2006) Georges Grinstein, Theresa O’Connell, Sharon Laskowski, Catherine Plaisant, Jean Scholtz, and Mark Whiting. 2006. Vast 2006 contest-a tale of alderwood. In 2006 IEEE Symposium On Visual Analytics Science And Technology. IEEE, 215–216.
- Gundy et al. (2007) Matthew Van Gundy, Davide Balzarotti, and Giovanni Vigna. 2007. Catch me, if you can: Evading network signatures with web-based polymorphic worms. In Proceedings of the first USENIX workshop on Offensive Technologies (WOOT ’07). USENIX Association, Berkley, CA, Article 7, 9 pages.
- Gundy et al. (2008) Matthew Van Gundy, Davide Balzarotti, and Giovanni Vigna. 2008. Catch me, if you can: Evading network signatures with web-based polymorphic worms. In Proceedings of the first USENIX workshop on Offensive Technologies (WOOT ’08). USENIX Association, Berkley, CA, Article 7, 2 pages.
- Gundy et al. (2009) Matthew Van Gundy, Davide Balzarotti, and Giovanni Vigna. 2009. Catch me, if you can: Evading network signatures with web-based polymorphic worms. In Proceedings of the first USENIX workshop on Offensive Technologies (WOOT ’09). USENIX Association, Berkley, CA, 90–100.
- Gutwin and Greenberg (1996) Carl Gutwin and Saul Greenberg. 1996. Workspace awareness for groupware. In Conference Companion on Human Factors in Computing Systems. 208–209.
- Gutwin and Greenberg (1999) Carl Gutwin and Saul Greenberg. 1999. The effects of workspace awareness support on the usability of real-time distributed groupware. ACM Transactions on Computer-Human Interaction (TOCHI) 6, 3 (1999), 243–281.
- Ha et al. (2006) Vicki Ha, Kori M Inkpen, Regan L Mandryk, and Tara Whalen. 2006. Direct intentions: The effects of input devices on collaboration around a tabletop display. In First IEEE International Workshop on Horizontal Interactive Human-Computer Systems (TABLETOP’06). IEEE, 8–pp.
- Hagerup et al. (1993) Torben Hagerup, Kurt Mehlhorn, and J. Ian Munro. 1993. Maintaining Discrete Probability Distributions Optimally. In Proceedings of the 20th International Colloquium on Automata, Languages and Programming (Lecture Notes in Computer Science, Vol. 700). Springer-Verlag, Berlin, 253–264.
- Harel (1978) David Harel. 1978. LOGICS of Programs: AXIOMATICS and DESCRIPTIVE POWER. MIT Research Lab Technical Report TR-200. Massachusetts Institute of Technology, Cambridge, MA.
- Harel (1979) David Harel. 1979. First-Order Dynamic Logic. Lecture Notes in Computer Science, Vol. 68. Springer-Verlag, New York, NY. https://doi.org/10.1007/3-540-09237-4
- Harris et al. (2009) Amanda Harris, Jochen Rick, Victoria Bonnett, Nicola Yuill, Rowanne Fleck, Paul Marshall, and Yvonne Rogers. 2009. Around the table: Are multiple-touch surfaces better than single-touch for children’s collaborative interactions?. In CSCL (1). 335–344.
- Harvard CodeBlue (2008) Harvard CodeBlue 2008. CodeBlue: Sensor Networks for Medical Care. http://www.eecs.harvard.edu/mdw/ proj/codeblue/.
- Heering and Klint (1985) J. Heering and P. Klint. 1985. Towards monolingual programming environments. ACM Trans. Program. Lang. Syst. 7, 2 (April 1985), 183–213.
- Heo et al. (2013) Heejeong Heo, Seungki Kim, Hyungkun Park, Jeeyong Chung, Geehyuk Lee, and Woohun Lee. 2013. TransWall. In ACM SIGGRAPH 2013 Emerging Technologies. 1–1.
- Herlihy (1993) Maurice Herlihy. 1993. A Methodology for Implementing Highly Concurrent Data Objects. ACM Trans. Program. Lang. Syst. 15, 5 (November 1993), 745–770. https://doi.org/10.1145/161468.161469
- Hoare (1972) C. A. R. Hoare. 1972. Chapter II: Notes on data structuring. In Structured programming (incoll), O. J. Dahl, E. W. Dijkstra, and C. A. R. Hoare (Eds.). Academic Press Ltd., London, UK, UK, 83–174. http://portal.acm.org/citation.cfm?id=1243380.1243382
- Hollis (1999) Billy S. Hollis. 1999. Visual Basic 6: Design, Specification, and Objects with Other (1st ed.). Prentice Hall PTR, Upper Saddle River, NJ, USA.
- Hörmander (1985a) Lars Hörmander. 1985a. The analysis of linear partial differential operators. III. Grundlehren der Mathematischen Wissenschaften [Fundamental Principles of Mathematical Sciences], Vol. 275. Springer-Verlag, Berlin, Germany. viii+525 pages. Pseudodifferential operators.
- Hörmander (1985b) Lars Hörmander. 1985b. The analysis of linear partial differential operators. IV. Grundlehren der Mathematischen Wissenschaften [Fundamental Principles of Mathematical Sciences], Vol. 275. Springer-Verlag, Berlin, Germany. vii+352 pages. Fourier integral operators.
- Hornecker et al. (2008) Eva Hornecker, Paul Marshall, Nick Sheep Dalton, and Yvonne Rogers. 2008. Collaboration and interference: awareness with mice or touch input. In Proceedings of the 2008 ACM conference on Computer supported cooperative work. 167–176.
- IEEE (2004) IEEE 2004. IEEE TCSC Executive Committee. In Proceedings of the IEEE International Conference on Web Services (ICWS ’04). IEEE Computer Society, Washington, DC, USA, 21–22. https://doi.org/10.1109/ICWS.2004.64
- Inkpen et al. (2005) Kori Inkpen, Kirstie Hawkey, Melanie Kellar, Regan Mandryk, Karen Parker, Derek Reilly, Stacey Scott, and Tara Whalen. 2005. Exploring display factors that influence co-located collaboration: angle, size, number, and user arrangement. In Proc. HCI international, Vol. 2005. Citeseer.
- Isenberg et al. (2010) Petra Isenberg, Danyel Fisher, Meredith Ringel Morris, Kori Inkpen, and Mary Czerwinski. 2010. An exploratory study of co-located collaborative visual analytics around a tabletop display. In 2010 ieee symposium on visual analytics science and technology. IEEE, 179–186.
- Isenberg et al. (2011) Petra Isenberg, Danyel Fisher, Sharoda A Paul, Meredith Ringel Morris, Kori Inkpen, and Mary Czerwinski. 2011. Co-located collaborative visual analytics around a tabletop display. IEEE Transactions on visualization and Computer Graphics 18, 5 (2011), 689–702.
- Ishii and Kobayashi (1992) Hiroshi Ishii and Minoru Kobayashi. 1992. Clearboard: A seamless medium for shared drawing and conversation with eye contact. In Proceedings of the SIGCHI conference on Human factors in computing systems. 525–532.
- Jakobsen and Hornbæk (2014) Mikkel R Jakobsen and Kasper Hornbæk. 2014. Up close and personal: Collaborative work on a high-resolution multitouch wall display. ACM Transactions on Computer-Human Interaction (TOCHI) 21, 2 (2014), 1–34.
- Jakobsen and Hornbæk (2016) Mikkel R Jakobsen and Kasper Hornbæk. 2016. Negotiating for Space?: Collaborative Work Using a Wall Display with Mouse and Touch Input.. In CHI, Vol. 16. 2050–2061.
- Jansen et al. (2019) Yvonne Jansen, Jonas Schjerlund, and Kasper Hornbæk. 2019. Effects of locomotion and visual overview on spatial memory when interacting with wall displays. In Proceedings of the 2019 CHI Conference on Human Factors in Computing Systems. 1–12.
- Jongerius et al. (2020) Chiara Jongerius, Roy S Hessels, Johannes A Romijn, Ellen Smets, and Marij A Hillen. 2020. The measurement of eye contact in human interactions: A scoping review. Journal of Nonverbal Behavior 44, 3 (2020), 363–389.
- Kirschmer and Voight (2010) Markus Kirschmer and John Voight. 2010. Algorithmic Enumeration of Ideal Classes for Quaternion Orders. SIAM J. Comput. 39, 5 (Jan. 2010), 1714–1747. https://doi.org/10.1137/080734467
- Knuth (1981a) Donald E. Knuth. 1981a. Seminumerical Algorithms. Addison-Wesley.
- Knuth (1981b) Donald E. Knuth. 1981b. Seminumerical Algorithms (2nd ed.). The Art of Computer Programming, Vol. 2. Addison-Wesley, Reading, MA.
- Knuth (1984) Donald E. Knuth. 1984. The TeXbook. Addison-Wesley, Reading, MA.
- Knuth (1997) Donald E. Knuth. 1997. The Art of Computer Programming, Vol. 1: Fundamental Algorithms (3rd. ed.). Addison Wesley Longman Publishing Co., Inc.
- Knuth (1998) Donald E. Knuth. 1998. The Art of Computer Programming (3rd ed.). Fundamental Algorithms, Vol. 1. Addison Wesley Longman Publishing Co., Inc. (book).
- Kong (2001a) Wei-Chang Kong. 2001a. E-commerce and cultural values. IGI Publishing, Hershey, PA, USA, Name of chapter: The implementation of electronic commerce in SMEs in Singapore (Inbook-w-chap-w-type), 51–74. http://portal.acm.org/citation.cfm?id=887006.887010
- Kong (2001b) Wei-Chang Kong. 2001b. The implementation of electronic commerce in SMEs in Singapore (as Incoll). In E-commerce and cultural values. IGI Publishing, Hershey, PA, USA, 51–74. http://portal.acm.org/citation.cfm?id=887006.887010
- Kong (2002) Wei-Chang Kong. 2002. Chapter 9. In E-commerce and cultural values (Incoll-w-text (chap 9) ’title’), Theerasak Thanasankit (Ed.). IGI Publishing, Hershey, PA, USA, 51–74. http://portal.acm.org/citation.cfm?id=887006.887010
- Kong (2003) Wei-Chang Kong. 2003. The implementation of electronic commerce in SMEs in Singapore (Incoll). In E-commerce and cultural values, Theerasak Thanasankit (Ed.). IGI Publishing, Hershey, PA, USA, 51–74. http://portal.acm.org/citation.cfm?id=887006.887010
- Kong (2004) Wei-Chang Kong. 2004. E-commerce and cultural values - (InBook-num-in-chap). IGI Publishing, Hershey, PA, USA, Chapter 9, 51–74. http://portal.acm.org/citation.cfm?id=887006.887010
- Kong (2005) Wei-Chang Kong. 2005. E-commerce and cultural values (Inbook-text-in-chap). IGI Publishing, Hershey, PA, USA, Chapter: The implementation of electronic commerce in SMEs in Singapore, 51–74. http://portal.acm.org/citation.cfm?id=887006.887010
- Kong (2006) Wei-Chang Kong. 2006. E-commerce and cultural values (Inbook-num chap). IGI Publishing, Hershey, PA, USA, Chapter (in type field) 22, 51–74. http://portal.acm.org/citation.cfm?id=887006.887010
- Korach et al. (1984) E. Korach, D. Rotem, and N. Santoro. 1984. Distributed algorithms for finding centers and medians in networks. ACM Trans. Program. Lang. Syst. 6, 3 (July 1984), 380–401.
- Kornerup (1994) Jacob Kornerup. 1994. Mapping Powerlists onto Hypercubes. Master’s thesis. The University of Texas at Austin. (In preparation).
- Kosiur (2001) David Kosiur. 2001. Understanding Policy-Based Networking (2nd. ed.). Wiley, New York, NY.
- Kruger et al. (2003) Russell Kruger, Sheelagh Carpendale, Stacey D Scott, and Saul Greenberg. 2003. How people use orientation on tables: comprehension, coordination and communication. In Proceedings of the 2003 international ACM SIGGROUP conference on Supporting group work. 369–378.
- Kunz et al. (2010) Andreas Kunz, Thomas Nescher, and Martin Küchler. 2010. Collaboard: a novel interactive electronic whiteboard for remote collaboration with people on content. In 2010 International Conference on Cyberworlds. IEEE, 430–437.
- Lam et al. (2011) Heidi Lam, Enrico Bertini, Petra Isenberg, Catherine Plaisant, and Sheelagh Carpendale. 2011. Empirical studies in information visualization: Seven scenarios. IEEE transactions on visualization and computer graphics 18, 9 (2011), 1520–1536.
- Lamport (1986) Leslie Lamport. 1986. LaTeX: A Document Preparation System. Addison-Wesley, Reading, MA.
- Langner et al. (2018) Ricardo Langner, Ulrike Kister, and Raimund Dachselt. 2018. Multiple coordinated views at large displays for multiple users: Empirical findings on user behavior, movements, and distances. IEEE transactions on visualization and computer graphics 25, 1 (2018), 608–618.
- Lee et al. (2020) Benjamin Lee, Xiaoyun Hu, Maxime Cordeil, Arnaud Prouzeau, Bernhard Jenny, and Tim Dwyer. 2020. Shared surfaces and spaces: Collaborative data visualisation in a co-located immersive environment. IEEE Transactions on Visualization and Computer Graphics 27, 2 (2020), 1171–1181.
- Lee et al. (2014) Hyunjae Lee, Sangyoung Cho, Jiwoo Hong, Geehyuk Lee, and Woohun Lee. 2014. Janus. In ACM SIGGRAPH 2014 Emerging Technologies. 1–1.
- Lee (1981) Jan Lee. 1981. Transcript of question and answer session. In History of programming languages I (incoll), Richard L. Wexelblat (Ed.). ACM, New York, NY, USA, 68–71. https://doi.org/10.1145/800025.1198348
- Lee (2005) Newton Lee. 2005. Interview with Bill Kinder: January 13, 2005. Video. Comput. Entertain. 3, 1, Article 4 (Jan.-March 2005). https://doi.org/10.1145/1057270.1057278
- Li et al. (2008) Cheng-Lun Li, Ayse G. Buyuktur, David K. Hutchful, Natasha B. Sant, and Satyendra K. Nainwal. 2008. Portalis: using competitive online interactions to support aid initiatives for the homeless. In CHI ’08 extended abstracts on Human factors in computing systems (Florence, Italy). ACM, New York, NY, USA, 3873–3878. https://doi.org/10.1145/1358628.1358946
- Li et al. (2017) Jiannan Li, Saul Greenberg, and Ehud Sharlin. 2017. A two-sided collaborative transparent display supporting workspace awareness. International Journal of Human-Computer Studies 101 (2017), 23–44.
- Li et al. (2014) Jiannan Li, Saul Greenberg, Ehud Sharlin, and Joaquim Jorge. 2014. Interactive two-sided transparent displays: designing for collaboration. In Proceedings of the 2014 conference on Designing interactive systems. 395–404.
- Li et al. (2016) Jerry Li, Mia Manavalan, Sarah D’Angelo, and Darren Gergle. 2016. Designing shared gaze awareness for remote collaboration. In Proceedings of the 19th ACM Conference on Computer Supported Cooperative Work and Social Computing Companion. 325–328.
- Lijphart (1971) Arend Lijphart. 1971. Comparative politics and the comparative method. American political science review 65, 3 (1971), 682–693.
- Lindlbauer et al. (2014a) David Lindlbauer, Toru Aoki, Anita Höchtl, Yuji Uema, Michael Haller, Masahiko Inami, and Jörg Müller. 2014a. A collaborative see-through display supporting on-demand privacy. In ACM SIGGRAPH 2014 Emerging Technologies. 1–1.
- Lindlbauer et al. (2014b) David Lindlbauer, Toru Aoki, Robert Walter, Yuji Uema, Anita Höchtl, Michael Haller, Masahiko Inami, and Jörg Müller. 2014b. Tracs: transparency-control for see-through displays. In Proceedings of the 27th annual ACM symposium on User interface software and technology. 657–661.
- Lindlbauer et al. (2016) David Lindlbauer, Klemen Lilija, Robert Walter, and Jörg Müller. 2016. Influence of display transparency on background awareness and task performance. In Proceedings of the 2016 CHI Conference on Human Factors in Computing Systems. 1705–1716.
- Liu et al. (2016) Can Liu, Olivier Chapuis, Michel Beaudouin-Lafon, and Eric Lecolinet. 2016. Shared interaction on a wall-sized display in a data manipulation task. In Proceedings of the 2016 CHI Conference on Human Factors in Computing Systems. 2075–2086.
- Liu et al. (2014) Can Liu, Olivier Chapuis, Michel Beaudouin-Lafon, Eric Lecolinet, and Wendy E Mackay. 2014. Effects of display size and navigation type on a classification task. In Proceedings of the SIGCHI conference on Human factors in computing systems. 4147–4156.
- Matsuda and Komuro (2020) Yoshio Matsuda and Takashi Komuro. 2020. Dynamic layout optimization for multi-user interaction with a large display. In Proceedings of the 25th International Conference on Intelligent User Interfaces. 401–409.
- Mayer et al. (2018) Sven Mayer, Lars Lischke, Jens Emil Grønbæk, Zhanna Sarsenbayeva, Jonas Vogelsang, Paweł W Woźniak, Niels Henze, and Giulio Jacucci. 2018. Pac-many: Movement behavior when playing collaborative and competitive games on large displays. In Proceedings of the 2018 CHI Conference on Human Factors in Computing Systems. 1–10.
- McCracken and Golden (1990) Daniel D. McCracken and Donald G. Golden. 1990. Simplified Structured COBOL with Microsoft/MicroFocus COBOL. John Wiley & Sons, Inc., New York, NY, USA.
- Morris et al. (2010) Meredith Ringel Morris, Jarrod Lombardo, and Daniel Wigdor. 2010. WeSearch: supporting collaborative search and sensemaking on a tabletop display. In Proceedings of the 2010 ACM conference on Computer supported cooperative work. 401–410.
- Mullender (1993) Sape Mullender (Ed.). 1993. Distributed systems (2nd Ed.). ACM Press/Addison-Wesley Publishing Co., New York, NY, USA.
- Mumford (1987) E. Mumford. 1987. Managerial expert systems and organizational change: some critical research issues. In Critical issues in information systems research (incoll). John Wiley & Sons, Inc., New York, NY, USA, 135–155. http://portal.acm.org/citation.cfm?id=54905.54911
- Natarajan et al. (2007) A. Natarajan, M. Motani, B. de Silva, K. Yap, and K. C. Chua. 2007. Investigating Network Architectures for Body Sensor Networks. In Network Architectures, G. Whitcomb and P. Neece (Eds.). Keleuven Press, Dayton, OH, 322–328. arXiv:960935712 [cs]
- Ni et al. (2006) Tao Ni, Doug A Bowman, and Jian Chen. 2006. Increased display size and resolution improve task performance in information-rich virtual environments. In Proceedings of Graphics Interface 2006. 139–146.
- Nielson (1985) F. Nielson. 1985. Program transformations in a denotational setting. ACM Trans. Program. Lang. Syst. 7, 3 (July 1985), 359–379.
- Niemantsverdriet et al. (2019) Karin Niemantsverdriet, Harm Van Essen, Minna Pakanen, and Berry Eggen. 2019. Designing for awareness in interactions with shared systems: the DASS framework. ACM Transactions on Computer-Human Interaction (TOCHI) 26, 6 (2019), 1–41.
- Novak (2003) Dave Novak. 2003. Solder man. Video. In ACM SIGGRAPH 2003 Video Review on Animation theater Program: Part I - Vol. 145 (July 27–27, 2003). ACM Press, New York, NY, 4. https://doi.org/99.9999/woot07-S422
- Obama (2008) Barack Obama. 2008. A more perfect union. Video. Retrieved March 21, 2008 from http://video.google.com/videoplay?docid=6528042696351994555
- Okuya et al. (2020) Yujiro Okuya, Olivier Gladin, Nicolas Ladevèze, Cédric Fleury, and Patrick Bourdot. 2020. Investigating Collaborative Exploration of Design Alternatives on a Wall-Sized Display. In Proceedings of the 2020 CHI Conference on Human Factors in Computing Systems. 1–12.
- Olson and Olson (2000) Gary M Olson and Judith S Olson. 2000. Distance matters. Human–computer interaction 15, 2-3 (2000), 139–178.
- Olwal et al. (2006) Alex Olwal, Stephen DiVerdi, Nicola Candussi, Ismo Rakkolainen, and Tobias Hollerer. 2006. An immaterial, dual-sided display system with 3D interaction. In IEEE Virtual Reality Conference (VR 2006). IEEE, 279–280.
- Olwal et al. (2008) Alex Olwal, Stephen DiVerdi, Ismo Rakkolainen, and Tobias Höllerer. 2008. Consigalo: multi-user face-to-face interaction on immaterial displays.. In INTETAIN. 8.
- Pejsa et al. (2016) Tomislav Pejsa, Julian Kantor, Hrvoje Benko, Eyal Ofek, and Andrew Wilson. 2016. Room2room: Enabling life-size telepresence in a projected augmented reality environment. In Proceedings of the 19th ACM conference on computer-supported cooperative work & social computing. 1716–1725.
- Petrie (1986a) Charles J. Petrie. 1986a. New Algorithms for Dependency-Directed Backtracking (Master’s thesis). Technical Report. Austin, TX, USA.
- Petrie (1986b) Charles J. Petrie. 1986b. New Algorithms for Dependency-Directed Backtracking (Master’s thesis). Master’s thesis. University of Texas at Austin, Austin, TX, USA.
- Poker-Edge.Com (2006) Poker-Edge.Com. 2006. Stats and Analysis. Retrieved June 7, 2006 from http://www.poker-edge.com/stats.php
- Prouzeau et al. (2018) Arnaud Prouzeau, Anastasia Bezerianos, and Olivier Chapuis. 2018. Awareness techniques to aid transitions between personal and shared workspaces in multi-display environments. In Proceedings of the 2018 ACM International Conference on Interactive Surfaces and Spaces. 291–304.
- R Core Team (2019) R Core Team. 2019. R: A Language and Environment for Statistical Computing. R Foundation for Statistical Computing, Vienna, Austria. https://www.R-project.org/
- Ragin (2014) Charles C Ragin. 2014. The comparative method. University of California Press.
- Reda et al. (2015) Khairi Reda, Andrew E Johnson, Michael E Papka, and Jason Leigh. 2015. Effects of display size and resolution on user behavior and insight acquisition in visual exploration. In Proceedings of the 33rd Annual ACM Conference on Human Factors in Computing Systems. 2759–2768.
- Reid (1980) Brian K. Reid. 1980. A high-level approach to computer document formatting. In Proceedings of the 7th Annual Symposium on Principles of Programming Languages. ACM, New York, 24–31.
- Rodden et al. (2003) Tom Rodden, Yvonne Rogers, John Halloran, and Ian Taylor. 2003. Designing novel interactional workspaces to support face to face consultations. In Proceedings of the SIGCHI conference on Human factors in computing systems. 57–64.
- Rogers and Lindley (2004) Yvonne Rogers and Siân Lindley. 2004. Collaborating around vertical and horizontal large interactive displays: which way is best? Interacting with Computers 16, 6 (2004), 1133–1152.
- Rous (2008) Bernard Rous. 2008. The Enabling of Digital Libraries. Digital Libraries 12, 3, Article 5 (July 2008). To appear.
- Ruddle et al. (2015) Roy A Ruddle, Rhys G Thomas, Rebecca S Randell, Phil Quirke, and Darren Treanor. 2015. Performance and interaction behaviour during visual search on large, high-resolution displays. Information Visualization 14, 2 (2015), 137–147.
- Saeedi et al. (2010a) Mehdi Saeedi, Morteza Saheb Zamani, and Mehdi Sedighi. 2010a. A library-based synthesis methodology for reversible logic. Microelectron. J. 41, 4 (April 2010), 185–194.
- Saeedi et al. (2010b) Mehdi Saeedi, Morteza Saheb Zamani, Mehdi Sedighi, and Zahra Sasanian. 2010b. Synthesis of Reversible Circuit Using Cycle-Based Approach. J. Emerg. Technol. Comput. Syst. 6, 4 (Dec. 2010).
- Salas and Hille (1978) S.L. Salas and Einar Hille. 1978. Calculus: One and Several Variable. John Wiley and Sons, New York.
- Scientist (2009) Joseph Scientist. 2009. The fountain of youth. Patent No. 12345, Filed July 1st., 2008, Issued Aug. 9th., 2009.
- Scott et al. (2004) Stacey D Scott, M Sheelagh T Carpendale, and Kori Inkpen. 2004. Territoriality in collaborative tabletop workspaces. In Proceedings of the 2004 ACM conference on Computer supported cooperative work. 294–303.
- Shavitt et al. (2021) Carmel Shavitt, Anastasia Kuzminykh, Itay Ridel, and Jessica R Cauchard. 2021. Naturally Together: A Systematic Approach for Multi-User Interaction With Natural Interfaces. Proceedings of the ACM on Human-Computer Interaction 5, CSCW2 (2021), 1–31.
- Sigitov et al. (2019) Anton Sigitov, André Hinkenjann, Ernst Kruijff, and Oliver Staadt. 2019. Task Dependent Group Coupling and Territorial Behavior on Large Tiled Displays. Frontiers in Robotics and AI (2019), 128.
- Sigitov et al. (2018a) Anton Sigitov, Oliver Staadt, and André Hinkenjann. 2018a. Towards intelligent interfaces for mixed-focus collaboration. In Adjunct Publication of the 26th Conference on User Modeling, Adaptation and Personalization. 287–292.
- Sigitov et al. (2018b) Anton Sigitov, Oliver Staadt, André Hinkenjann, and Ernst Kruijff. 2018b. Column major pattern: how users process spatially fixed items on large, tiled displays. In Proceedings of the 2018 Conference on Human Information Interaction & Retrieval. 305–308.
- Smith (2010) Stan W. Smith. 2010. An experiment in bibliographic mark-up: Parsing metadata for XML export. In Proceedings of the 3rd. annual workshop on Librarians and Computers (LAC ’10, Vol. 3), Reginald N. Smythe and Alexander Noble (Eds.). Paparazzi Press, Milan Italy, 422–431. https://doi.org/99.9999/woot07-S422
- Sommer (1969) Robert Sommer. 1969. Personal Space. The behavioral basis of design. (1969).
- Soni et al. (2021) Nikita Soni, Ailish Tierney, Katarina Jurczyk, Schuyler Gleaves, Elisabeth Schreiber, Kathryn A Stofer, and Lisa Anthony. 2021. Collaboration around Multi-touch Spherical Displays: A Field Study at a Science Museum. Proceedings of the ACM on Human-Computer Interaction 5, CSCW2 (2021), 1–34.
- Spector (1990) Asad Z. Spector. 1990. Achieving application requirements. In Distributed Systems (2nd. ed.), Sape Mullender (Ed.). ACM Press, New York, NY, 19–33. https://doi.org/10.1145/90417.90738
- Tang et al. (2007) Anthony Tang, Carman Neustaedter, and Saul Greenberg. 2007. Videoarms: embodiments for mixed presence groupware. In People and Computers XX—Engage. Springer, 85–102.
- Tang et al. (2006) Anthony Tang, Melanie Tory, Barry Po, Petra Neumann, and Sheelagh Carpendale. 2006. Collaborative coupling over tabletop displays. In Proceedings of the SIGCHI conference on Human Factors in computing systems. 1181–1190.
- Tang (1991) John C Tang. 1991. Findings from observational studies of collaborative work. International Journal of Man-machine studies 34, 2 (1991), 143–160.
- Tang and Minneman (1991) John C Tang and Scott Minneman. 1991. VideoWhiteboard: video shadows to support remote collaboration. In Proceedings of the SIGCHI conference on Human factors in computing systems. 315–322.
- Thornburg (2001) Harry Thornburg. 2001. Introduction to Bayesian Statistics. Retrieved March 2, 2005 from http://ccrma.stanford.edu/~jos/bayes/bayes.html
- Tollmar et al. (1996) Konrad Tollmar, Ovidiu Sandor, and Anna Schömer. 1996. Supporting social awareness@ work design and experience. In Proceedings of the 1996 ACM conference on Computer supported cooperative work. 298–307.
- TUG (2017) TUG 2017. Institutional members of the TeX Users Group. Retrieved May 27, 2017 from http://wwtug.org/instmem.html
- Tzamaloukas and Garcia-Luna-Aceves (2000) A. Tzamaloukas and J. J. Garcia-Luna-Aceves. 2000. Channel-Hopping Multiple Access. Technical Report I-CA2301. Department of Computer Science, University of California, Berkeley, CA.
- Veytsman ([n.d.]) Boris Veytsman. [n.d.]. acmart—Class for typesetting publications of ACM. Retrieved May 27, 2017 from http://www.ctan.org/pkg/acmart
- von Zadow et al. (2016a) Ulrich von Zadow, Daniel Bösel, Duc Dung Dam, Anke Lehmann, Patrick Reipschläger, and Raimund Dachselt. 2016a. Miners: Communication and awareness in collaborative gaming at an interactive display wall. In Proceedings of the 2016 ACM International Conference on Interactive Surfaces and Spaces. 235–240.
- von Zadow and Dachselt (2017) Ulrich von Zadow and Raimund Dachselt. 2017. Giant: Visualizing group interaction at large wall displays. In Proceedings of the 2017 CHI Conference on Human Factors in Computing Systems. 2639–2647.
- von Zadow et al. (2016b) Ulrich von Zadow, Patrick Reipschläger, Daniel Bösel, Anita Sellent, and Raimund Dachselt. 2016b. YouTouch! Low-cost user identification at an interactive display wall. In Proceedings of the International Working Conference on Advanced Visual Interfaces. 144–151.
- Wenzel (1992) Elizabeth M. Wenzel. 1992. Three-dimensional virtual acoustic displays. In Multimedia interface design (incoll). ACM, New York, NY, USA, 257–288. https://doi.org/10.1145/146022.146089
- Werneck et al. (2000a) Renato Werneck, João Setubal, and Arlindo da Conceicão. 2000a. (new) Finding minimum congestion spanning trees. J. Exp. Algorithmics 5, Article 11 (Dec. 2000). https://doi.org/10.1145/351827.384253
- Werneck et al. (2000b) Renato Werneck, João Setubal, and Arlindo da Conceicão. 2000b. (old) Finding minimum congestion spanning trees. J. Exp. Algorithmics 5 (2000), 11. https://doi.org/10.1145/351827.384253
- Wigdor et al. (2009) Daniel Wigdor, Hao Jiang, Clifton Forlines, Michelle Borkin, and Chia Shen. 2009. WeSpace: the design development and deployment of a walk-up and share multi-surface visual collaboration system. In Proceedings of the SIGCHI Conference on Human Factors in Computing Systems. 1237–1246.
- Yuill and Rogers (2012) Nicola Yuill and Yvonne Rogers. 2012. Mechanisms for collaboration: A design and evaluation framework for multi-user interfaces. ACM Transactions on Computer-Human Interaction (TOCHI) 19, 1 (2012), 1–25.
- Zagermann et al. (2016) Johannes Zagermann, Ulrike Pfeil, Roman Rädle, Hans-Christian Jetter, Clemens Klokmose, and Harald Reiterer. 2016. When tablets meet tabletops: The effect of tabletop size on around-the-table collaboration with personal tablets. In Proceedings of the 2016 CHI Conference on Human Factors in Computing Systems. 5470–5481.
- Zanella and Greenberg (2001) Ana Zanella and Saul Greenberg. 2001. Reducing interference in single display groupware through transparency. In ECSCW 2001. Springer, 339–358.
- Zheng (2022) Chen Zheng. 2022. Coordinating Joint Action in a Real-Life Activity: The Interplay of Explicit and Implicit Coordination. Ph.D. Dissertation. Columbia University.
- Zheng and Tversky (2022) Chen Zheng and Barbara Tversky. 2022. Explicit and Implicit Coordination of Joint Action. In Proceedings of the Annual Meeting of the Cognitive Science Society, Vol. 44.
- Zhou et al. (2008) G. Zhou, J. Lu, C.-Y. Wan, M. D. Yarvis, and J. A. Stankovic. 2008. Body Sensor Networks. MIT Press, Cambridge, MA.
- Zhou et al. (2010) Gang Zhou, Yafeng Wu, Ting Yan, Tian He, Chengdu Huang, John A. Stankovic, and Tarek F. Abdelzaher. 2010. A multifrequency MAC specially designed for wireless sensor network applications. ACM Trans. Embed. Comput. Syst. 9, 4, Article 39 (April 2010), 41 pages. https://doi.org/10.1145/1721695.1721705
- Zillner et al. (2014) Jakob Zillner, Christoph Rhemann, Shahram Izadi, and Michael Haller. 2014. 3D-board: a whole-body remote collaborative whiteboard. In Proceedings of the 27th annual ACM symposium on User interface software and technology. 471–479.
Appendix A Appendix of Data Processing Details
A.1. Data preprocessing and definitions of measures
In our experiment, each condition was repeated twice in case of an accident. Because of no accidents happened, we average the repeated data in the same condition within each participant for all log data, recorded data and observation data. The definition of indices derived from the log data is shown here:
-
(1)
Task completion time: for each participant, the task completion time is the duration from picking up the first disc to dropping the last disc.
-
(2)
Horizontal distance between pairs: horizontal distance between pairs refers to the distance between two participants’ perpendicular projection points onto the screen. We averaged the distance across time within one trial to get one horizontal distance value for this trial.
-
(3)
Absolute distance between pairs: absolute distance between pairs refers to the distance between pairs in physical space. We averaged the distance of their head trackers across time within one trial to get one absolute distance value for this trial.
-
(4)
Human speed: we calculate the human speed within each recording time interval (0.3s) by dividing the absolute distance (participant traveled in the physical space) within this time interval by 0.3s. Then we averaged the speed across time within one trial to get one human speed value for this trial.
-
(5)
Cursor speed: we calculate the cursor speed within each recording time interval (0.3s) by dividing the horizontal distance (cursor traveled on the display) within this time interval by 0.3s. Then we averaged the speed across time within one trial to get one cursor speed value for this trial.