Paschen-line Constraints on Dust Attenuation and Star Formation at with JWST/NIRSpec
Abstract
We use medium resolution JWST/NIRSpec observations from the Cosmic Evolution Early Release Science (CEERS) Survey to place the first constraints on dust attenuation and star formation based on the Paschen lines for a sizable sample of 63 galaxies at redshifts . Our analysis indicates strong correlations between the Balmer decrement, , and line ratios that include the Paschen lines (i.e., , , and the Paschen decrement, ), suggesting that the former is sensitive to the overall dust obscuration towards H II regions in high-redshift galaxies. The line ratios are used to derive the nebular reddening, , and star-formation rates (SFRs). There is marginal evidence that SFRs deduced from the Paschen lines may exceed by those derived from the Balmer lines alone, suggesting the presence of star formation that is optically thick in the Balmer lines, though deeper observations are needed to confirm this result. Using the Paschen-line constraints on bolometric SFRs, we reevaluate the relationship between dust obscuration and UV spectral slope, and find a reddening of the UV continuum that, on average, follows the SMC extinction curve. This analysis highlights the need for deeper spectroscopy of more representative samples to evaluate nebular dust attenuation and bolometric SFRs in high-redshift galaxies, and their relationship to the reddening of the UV continuum.
Subject headings:
stars:abundances — ISM: abundances — ISM: HII regions — galaxies: high-redshift — galaxies: ISM — galaxies: star formationI. INTRODUCTION
Hydrogen recombination lines provide critical constraints on the star-formation rates (SFRs) and dust reddening towards the ionized (H II) regions of high-redshift star-forming galaxies (Kennicutt et al., 1994). These lines are dependent on the presence of short-lived massive stars and are therefore less sensitive to star-formation history (SFH) than the UV continuum. The lines suffer less extinction than the far-UV continuum, and can be measured from the ground with high signal-to-noise () for individual typical star-forming galaxies up to redshift . Constraints on the reddening of H II regions (i.e., nebular reddening) are fundamental to the interpretation of some rest-frame optical emission lines ratios that are commonly used to infer the ionization state of the ISM and gas-phase metallicity (e.g., , and R23, defined as ). Moreover, the nebular reddening and its connection to the reddening of the stellar continuum can yield insights on the spatial distribution of dust relative to stars.
Observations from ground-based multi-object near-IR spectrographs (e.g., Keck/MOSFIRE, VLT/KMOS) and space-based facilities (e.g., HST/WFC3 grism) have yielded measurements of hydrogen recombination lines and nebular reddening for thousands of galaxies up to (e.g., Förster Schreiber et al. 2009; Kashino et al. 2013; Price et al. 2014; Reddy et al. 2015; De Barros et al. 2016; Reddy et al. 2020; Shivaei et al. 2020b; Rezaee et al. 2021; Battisti et al. 2022). There is a general consensus from these studies that, on average, the nebular reddening exceeds that of the stellar continuum, where the difference in reddening may correlate with SFR, specific SFR (sSFR), stellar mass, and/or gas-phase metallicity. These differences in the nebular and stellar continuum reddening are typically attributed to the higher dust column densities expected for the lines of sight towards young massive stars which are embedded in their parent molecular clouds (e.g., Calzetti et al. 1994).
As useful as these spectroscopic observations have been for advancing our understanding of the nebular dust attenuation and recombination-line SFRs of high-redshift galaxies, virtually all of this knowledge is based on the lowest-order lines of the Balmer series, in particular H and H, and only for galaxies at redshifts . Up until recently, Paschen lines have been robustly detected in just a few lensed galaxies (Papovich et al., 2011; Finkelstein et al., 2011). The recently-launched James Webb Space Telescope (JWST) and its NIRSpec instrument (Ferruit et al., 2022) now offer the wavelength coverage and sensitivity to detect higher-order Paschen lines for sub- galaxies (Pa at m up to , Pa at m up to ), as well as Balmer lines into the epoch of reionization (H up to , H up to ; Shapley et al. 2023). As they are less affected by dust attenuation, the Paschen lines more closely track the bolometric SFR than the (observed) Balmer lines; they may reveal the presence of star formation that is optically thick in the Balmer lines; and, in combination with Balmer lines, they can provide unprecedented constraints on the nebular reddening and characteristics of the ISM that depend on it (e.g., ionization parameter and gas-phase metallicity).
In this paper, we use the first spectroscopic data from the Cosmic Evolution Early Release Science (CEERS) survey (Finkelstein et al., 2022) with JWST (Section II) to investigate the improvements in nebular reddening constraints afforded by the Paschen lines (Section III), and the implications of such constraints on the reddening of the UV continuum for galaxies at redshifts (Section IV) . A Chabrier (2003) initial mass function (IMF) is considered throughout the paper. Wavelengths are reported in the vacuum frame. We adopt a cosmology with km s-1 Mpc-1, , and .
II. DATA
II.1. Observations
The publicly available NIRSpec Multi Shutter Assembly (MSA) data from the CEERS program (Program ID: 1345; Finkelstein et al. 2022) were used for this analysis. These medium resolution data were obtained using the G140M/F100LP, G235M/F170LP, and G395M/F290LP grating and filter combinations, covering a wavelength range of m. Observations were obtained over six pointings in the AEGIS field, with each pointing consisting of three exposures of 14 groups with the NRSIRS2 readout mode, and a total of 3107 s integration in each grating and filter combination. Each “slit” on the MSA was formed from three adjacent microshutters, and a three-point nod dither pattern was adopted. Together, the six pointings include 321 slits and 318 unique targets.
II.2. Data Reduction
NIRSpec spectroscopic data were reduced following the procedures given in Topping et al. (2023, in prep). Briefly, individual uncalibrated exposures were processed through the JWST calwebb_detector1 pipeline111https://jwst-pipeline.readthedocs.io/en/latest/index.html. This step masks all saturated pixels, subtracts the bias and dark current, and masks ‘snowballs’ and ‘showers’ resulting from high-energy cosmic ray hits. The images were then corrected for striping by subtracting the noise. Following these steps, 2D spectrograms were cut out for each slit on the MSA. Flat-field corrections, subtraction of background based on the dithered exposures, and photometric calibrations were applied to the 2D spectrograms, and a wavelength solution using the most recent calibration reference data system (CRDS; jwst_1027.pmap) was implemented. Each spectrogram was then rectified and interpolated onto a common wavelength grid for its grating and filter combination. Finally, the rectified and interpolated spectrograms were combined using the offsets appropriate for the three-point nod dither pattern, excluding pixels masked during the calibration steps. The corresponding 2D error spectra were generated by summing in quadrature the Poisson noise, read noise, and variance between exposures. One-dimensional spectra were optimally extracted from the 2D spectrograms and, in cases where neither emission lines nor continua were seen, a blind extraction was performed based on the position of the object determined from other gratings (see Sanders et al., 2023, in prep, for further details). If there were no emission lines or continua visible in the 2D spectrograms for any grating, then no extraction was performed. One-dimensional spectra were extracted for 252 targets.
II.3. Slit Loss Corrections and Flux Scaling
The combination of a small NIRSpec MSA microshutter width (), off-center location of the target within the microshutter, and a wavelength-dependent PSF necessitates accurate corrections for light falling outside the microshutter and 1D extraction window. These “slit losses” were computed as follows. If a CEERS target had JWST/NIRCam F115W imaging, a subimage centered on the target was extracted. The corresponding segmentation map was used to mask all pixels belonging to unrelated objects within the subimage. The subimage was then rotated, accounting for both the tilt of the AEGIS F115W mosaic relative to North and the position angle of the NIRSpec MSA observations. This rotated subimage was then convolved with Gaussian kernels to produce the expected light profiles at longer wavelengths. The full widths at half maximum (FWHMs) of these kernels were computed by subtracting in quadrature the FWHM of the JWST PSF at m from the FWHMs of the JWST PSFs at m, in increments of m.
If a target did not have F115W imaging, a Sérsic fit to the HST/WFC3 F160W image was used to create a model of the galaxy. The parameters of the Sérsic fit were obtained from the GALFIT modeling performed by van der Wel et al. (2014), and a model was created only if the fit was deemed acceptable based on the criteria given in that study. This model was then rotated as described above and convolved with the JWST PSFs at m, in increments of m, as determined from the JWST WebbPSF software222https://webbpsf.readthedocs.io/en/stable/installation.html. Finally, if a target did not have F115W imaging or an acceptable Sérsic model fit to its F160W light profile, a point source was assumed.
The convolved images of the target at each wavelength were then shifted according to the expected position of the target within the microshutter and masked. The masking accounts for the microshutter width, the gap between adjacent microshutters along the cross-dispersion axis, and the size of the window used to extract the 2D spectrograms to 1D. The 1D spectra were then divided by the fraction of light passing through the unmasked region(s)—i.e., the slit and extraction apertures—as a function of wavelength.
To test the validity of this procedure, we first checked if the slit loss corrections based on the F115W imaging were consistent with those obtained by assuming a Sérsic model of the F160W light profile for galaxies where both F115W imaging and a F160W-based Sérsic model were available. This comparison shows that the fractions of transmitted flux obtained with the two methods agree within . In addition, the continuum is significantly detected in the individual NIRSpec spectra for the vast majority of targets, with a typical per wavelength pixel of . Passing the slit-loss-corrected 1D spectra through the NIRCam broadband photometric filters yields integrated fluxes that are in excellent agreement with the measured ground-based near-IR, NIRCam, and/or Spitzer/IRAC photometry, with a factor of dispersion. This agreement suggests that the relative flux calibration between different gratings is generally robust, and that ratios of lines observed in different gratings can be trusted. All spectra were then scaled such that their integrated fluxes in the relevant bandpasses match the ground-based near-IR, NIRCam, and/or IRAC photometry (Sanders et al., 2023, in prep).
II.4. Line Measurements and Composite Spectra
Emission line fluxes were measured by fitting their profiles with Gaussian functions on top of a continuum model determined by the best-fit SED to the broadband photometry (Section II.5), as described in Sanders et al. (2023, in prep). In the case of blended complexes, such as [N II] +H+[N II] , multiple Gaussians were fit simultaneously, along with a continuum model determined by the best-fit SED. This method accounts for stellar absorption under the HI emission lines. Uncertainties in line fluxes were estimated by measuring the spread in fluxes obtained in many realizations of the spectra, where the science spectrum was perturbed in each realization by the corresponding error spectrum.
Part of the analysis described here takes advantage of the high afforded by composite spectra. Composite spectra were generated by shifting each object’s spectrum to the rest frame, converting from flux density to luminosity density, interpolating to a common wavelength grid, and averaging luminosity densities at each wavelength point using clipping. Average line luminosities, line ratios, and their corresponding uncertainties including sample variance were calculated by generating many realizations of the composite spectra. In each realization, the spectra of individual objects were perturbed according to their measurement errors, and composite spectra were constructed by random selection of these perturbed spectra with replacement. Line flux measurements on the composite spectra were performed in a manner similar to that of individual objects.
II.5. SED Fitting
Stellar population modeling was used to account for stellar absorption under the hydrogen emission lines (Section II.4), and to estimate stellar masses (). Ground- and space-based photometry for each target were drawn from existing multi-wavelength catalogs in the AEGIS field, primarily from the catalogs produced by the 3D-HST team (Momcheva et al., 2016; Skelton et al., 2014) and those produced by G. Brammer333https://s3.amazonaws.com/grizli-v2/JwstMosaics/v4/index.html. The photometry was corrected for the contribution from strong emission lines. The modeling employed the FAST program (Kriek et al., 2009) with the stellar population synthesis models of Conroy et al. (2009). Motivated by previous results (e.g., Reddy et al. 2018; Shivaei et al. 2020b), the photometry was modeled with two sets of assumptions: the SMC extinction curve (Gordon et al., 2003) and a subsolar stellar metallicity (; “SMC+subsolar” modeling), and the Calzetti et al. (2000) attenuation curve and a solar metallicity (; “Calzetti+solar” modeling). Stellar masses derived with the SMC+subsolar modeling are on average larger than those derived with the Calzetti+solar modeling. The amount of stellar absorption under the hydrogen emission lines changes by only a few percent between the two modeling assumptions. Therefore, stellar masses and the stellar absorption (which are the salient parameters in this analysis) are not significantly affected by the two modeling assumptions. In Sections III.3 and IV, we discuss the stellar-metallicity dependence of the factors used to convert H and UV luminosity to SFR. Delayed- star-formation histories, where , were assumed. Here, is the time since the onset of star formation and is the characteristic star formation timescale. Further details on the SED modeling are provided in Shapley et al. (2023).
| Line | (Å)aaRest-frame vacuum wavelength, taken from the Atomic Spectra Database website of the National Institute of Standards and Technology (NIST), https://www.nist.gov/pml/atomic-spectra-database. | bbIntensity of line relative to H for Case B recombination, K, and cm-3, based on photoionization modeling with CLOUDY version 17.02 (Ferland et al., 2017). | ||
|---|---|---|---|---|
| H | 6564.60 | 2.790 | ||
| H | 4862.71 | 1.000 | ||
| H | 4341.69 | 0.473 | ||
| H | 4102.89 | 0.263 | ||
| Pa | 18756.4 | 0.305 | ||
| Pa | 12821.6 | 0.155 | ||
| Pa | 10941.2 | 0.087 | ||
| Pa | 10052.6 | 0.054 |
II.6. Final Sample
Several selection criteria were used to assemble the final sample for this analysis. First, galaxies were required to have secure spectroscopic redshifts , allowing for coverage of Pa and/or Pa. The redshift criterion reduces the CEERS sample size from 252 unique objects with extracted spectra to 90. Second, galaxies that may harbor AGN were excluded based on having or significant broad components to their emission lines. The exclusion of possible AGN reduces the sample size further to 80 objects. Third, any objects that had suspect line or SED fits were excluded, resulting in 71 galaxies. Finally, any galaxies that did not have coverage of H, H, and either Pa or Pa were excluded. This last criterion results in a final sample of 63 galaxies.
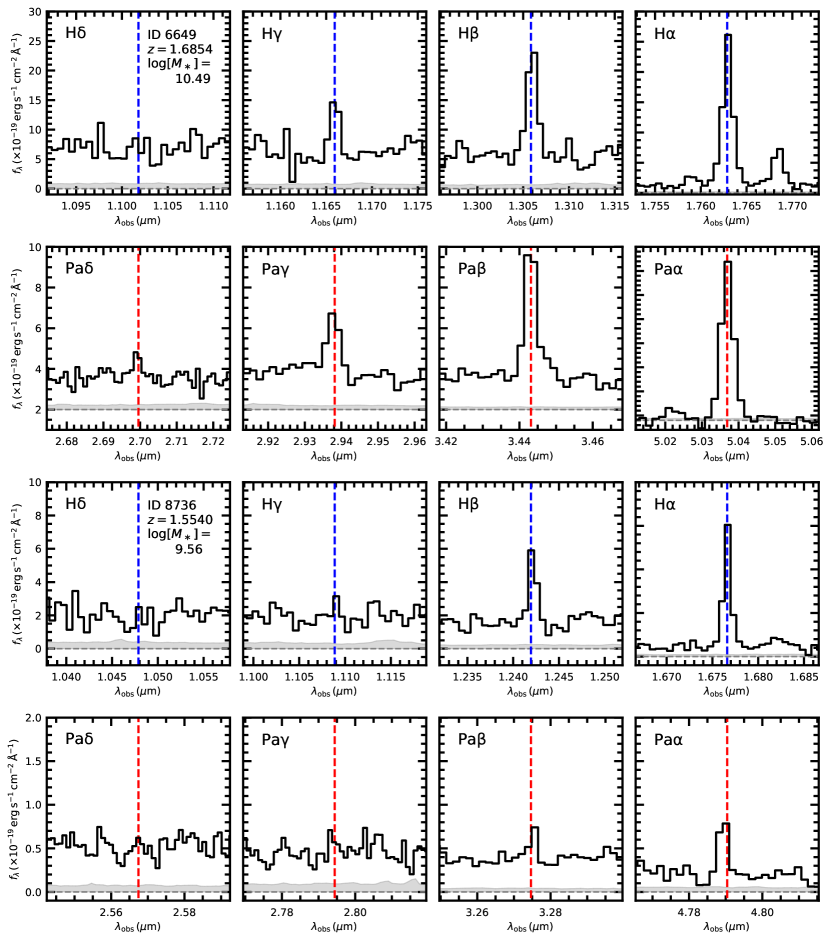
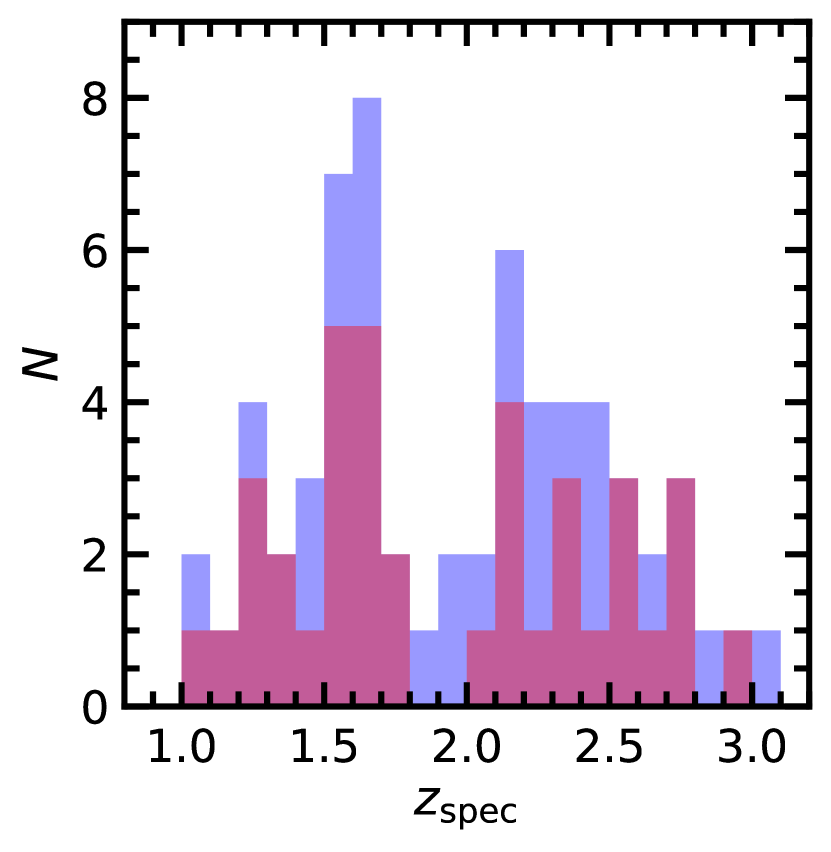
Of these, 61 have coverage of Pa, 28 have coverage of Pa, and 26 have coverage of both lines. The redshift distribution of the final sample is shown in Figure 1. Of the 63 galaxies in the sample, 38 have detections of H, H, and either Pa or Pa (i.e., the “line-detected sample”). The bulk of the analysis focuses on these 38 galaxies, but the entire sample of 63 galaxies is also considered when forming composite spectra. The 63 galaxies have SED-based SFRs (Section II.5) in the range to yr-1, with a median of yr-1. The stellar masses vary in the range , with a median of . Figure 2 shows the first four Balmer and Paschen lines in the spectra of two galaxies in the sample: a brighter galaxy with a higher and nebular reddening (CEERS ID 6649), and a fainter galaxy with a lower and nebular reddening close to zero (CEERS ID 8736).
III. PASCHEN-LINE CONSTRAINTS ON NEBULAR REDDENING AND SFRs
III.1. The Balmer Decrement and Line Ratios Including Paschen Lines
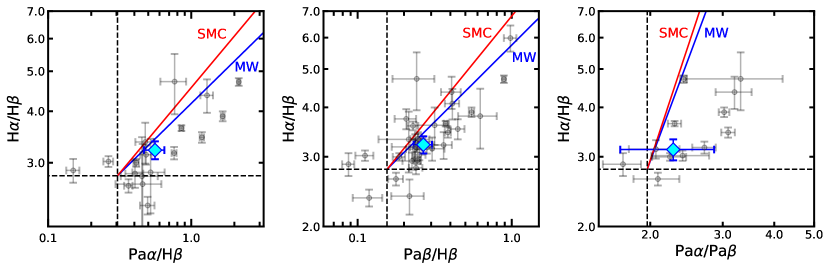
Given the ubiquitous use of the Balmer decrement, , to constrain the nebular reddening and SFRs of high-redshift galaxies, it is useful to first assess how well it correlates with line ratios that include the Paschen lines. In the absence of dust, the ratios of the different recombination lines are fixed at a given temperature and density. Thus, comparing the observed line ratios with the intrinsic ones allows us to infer the reddening towards the nebular regions from which those lines originate. The intrinsic (dust-free) ratios assumed in this analysis are listed in Table 1. Figure 3 compares the Balmer decrements with and for the 38 galaxies in the line-detected sample.444There are two (of 38) galaxies in the line-detected sample with ratios lying below the intrinsic ratios expected in the absence of dust attenuation, suggesting additional systematic error associated with the relative flux calibration between gratings for these two objects. The right panel shows the relationship between the Balmer decrement and the Paschen decrement, , for the 12 galaxies in the line-detected sample that have detections of both Paschen lines. These 12 galaxies are at redshifts where H and H lie in the bluest grating, F100LP, and Pa and Pa lie in the reddest grating, F290LP. As such, the ratios and for these galaxies do not suffer from uncertainties in the relative flux calibration between gratings, and therefore serve as a useful check of reddening inferred from ratios consisting of lines observed in different gratings (e.g., or ).
Shown in all three panels of Figure 3 are the predicted line ratios as a function of reddening for the Small Magellanic Cloud (SMC; Gordon et al. 2003) and Milky Way (MW; Cardelli et al. 1989) extinction curves.555For the SMC curve, we assumed the functional form of Gordon et al. (2003) at m. At m, a functional form for the curve was assumed. The (Calzetti et al., 2000) curve predicts line ratios that are similar to those of the MW. Spearman tests indicate strong positive correlations between the line ratios, with likelihoods of a null correlation of and between the Balmer decrement and and , respectively, and between the Balmer and Paschen decrements. The strength of the correlations between the Balmer decrement and line ratios involving the Paschen lines suggests that the former is sensitive to the overall nebular dust attenuation of the galaxies. In other words, the fraction of star formation that is optically thick in the Balmer lines is not so high as to cause a decoupling between the reddening deduced from the Balmer lines and the reddening deduced from the less-dust-sensitive Paschen lines.
Individually, most galaxies have line ratios statistically consistent with the predictions of the MW extinction curve. However, when considering the line-detected sample as a whole, the average , , and appear to lie systematically higher than the predictions of either the SMC or MW curves—or the curve derived by Reddy et al. 2020 for galaxies, which is similar to that of the MW—at a given Balmer decrement. On the other hand, the average and measured from the composite spectrum of all 63 galaxies are consistent within of the MW predictions given the average of these galaxies. The composite spectrum of the 26 galaxies with coverage of both Pa and Pa also indicates average ratios that are statistically consistent with the MW and SMC extinction curves. These results suggest that some fraction of galaxies in the line-detected sample may harbor star formation that is optically thick in the Balmer lines, a point we return to below.
III.2. Dependence of Nebular Reddening on Line Ratios
We next explored the extent to which the nebular reddening depends on the specific line ratios used to derive it. In the following discussion, -BD denotes the nebular reddening derived from the Balmer decrement, . We also considered the reddening derived from either or , -PB; the reddening derived from the Paschen decrement, -PD; and the reddening derived from all available Balmer and Paschen lines, -ALL. For the latter, we included H, H, H, H, Pa, Pa, Pa, and Pa, and used minimization to determine the best-fit that comes closest to reproducing all the line ratios given their uncertainties.666Of the 63 galaxies in the full sample, the numbers with detections of H, H, H, H, Pa, Pa, Pa, and Pa are 63, 53, 35, 26, 21, 38, 29, and 12, respectively. The MW extinction curve was assumed for all calculations—the reddenings are relatively insensitive to the choice of extinction or attenuation curves as their shapes are very similar in the optical and near-IR. Uncertainties in nebular reddening are derived from perturbing the line fluxes by their errors many times and computing the spread in reddening derived from these many realizations.
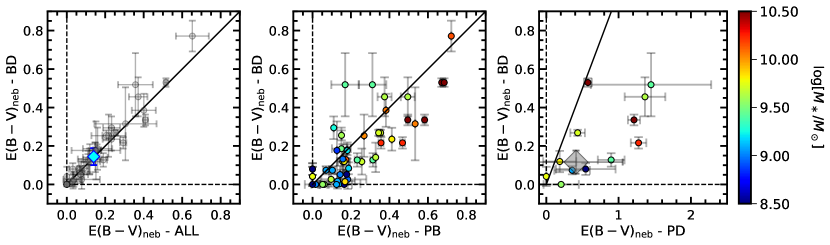
Figure 4 shows that -BD agrees well with -ALL within the uncertainties. This result is expected given that, relative to other lines in the fit, the high of H and H causes these lines to dominate the fit to . Meanwhile, -PB is generally consistent within of -BD, though there are some notable outliers for which -PB -BD. These outliers are ones for which or significantly exceed the values predicted for their (Section III.1; Figure 3). When considering only the Paschen lines in the derivation, i.e., the Paschen decrement, we find the inferred -PD for individual galaxies in the line-detected sample (median value of -PD ) general exceed the estimates from the Balmer decrement (median value of -BD ), again suggesting the presence of some star formation that is optically thick in the Balmer lines. The sensitivity of the Paschen lines to regions that may be more attenuated (relative to the Balmer lines) has also been observed in nearby galaxies with H and Pa line maps (Giménez-Arteaga et al., 2022). The average -PD derived from the composite spectrum of the 26 galaxies with coverage of both Paschen lines lies within of -BD. The similar or higher nebular reddening derived from the Paschen lines versus the Balmer lines implies differences in nebular and stellar reddening at least as large as those reported in previous studies that were based on Balmer decrements (e.g., Calzetti 1997; Calzetti et al. 2000; Förster Schreiber et al. 2009; Yoshikawa et al. 2010; Wuyts et al. 2011; Wild et al. 2011; Kreckel et al. 2013; Kashino et al. 2013; Price et al. 2014; Reddy et al. 2015; De Barros et al. 2016; Buat et al. 2018; Reddy et al. 2020; Shivaei et al. 2020b).
III.3. SFRs from Balmer and Paschen Lines
As the Paschen lines are less affected by dust, they are more directly connected to the bolometric SFRs of galaxies compared to the Balmer lines. Paschen-line SFRs were computed by dust correcting either the Pa or Pa luminosities according to -PB, and converting the dust-corrected luminosities to SFRs using the following equations:
| (1) |
and
| (2) |
where () and () for a () Binary Population and Stellar Synthesis (BPASS) v2.2.1 model (Eldridge et al., 2017; Stanway & Eldridge, 2018) with an upper mass cutoff of the IMF of (Reddy et al., 2022). Following Du et al. (2018), we adopted the (solar metallicity) conversion factor for all galaxies at , galaxies at with , and galaxies at with . The (subsolar metallicity) conversion factor was adopted for all other galaxies. The same redshift and mass criteria were used to compute H-based SFRs, where the H luminosity was corrected for dust using -BD, and assuming
| (3) |
where () for the () models discussed above. Direct comparisons between Balmer-based and Paschen-based SFRs are unaffected by the stellar-metallicity assumptions as both sets of SFRs will be affected in an identical manner. The errors in SFRs include the uncertainties in line fluxes and reddening.
For the 12 galaxies with measured Paschen decrements, the SFRs computed by dust correcting the Pa luminosity according to -PD lie within of those computed using -PB. Specifically, while in some cases -PD may be significantly redder than -PB for a given galaxy, the attenuation in magnitudes at the wavelength of Pa, m, is typically mag (with the maximum mag for the reddest galaxy in the sample), resulting in small differences in the resulting SFRs. We return to this point below.
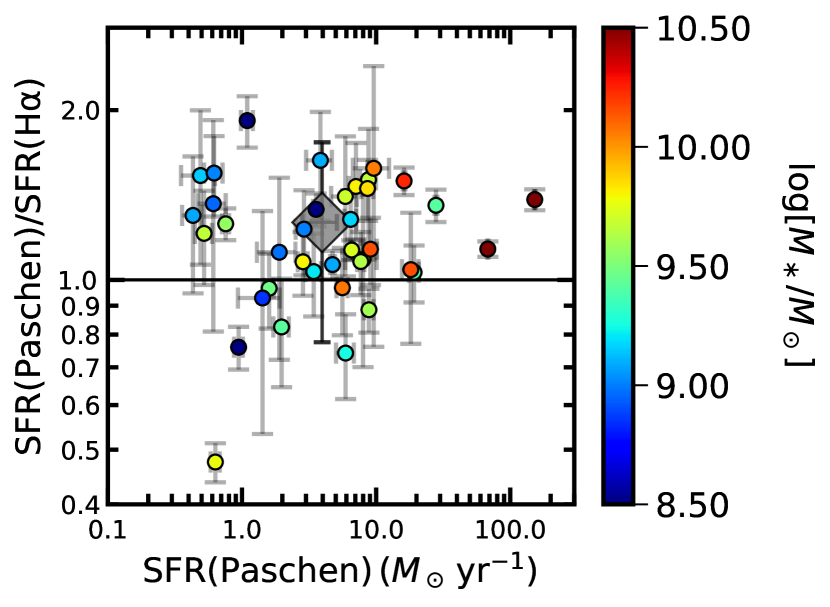
The ratios of the Paschen-line SFRs to H SFRs are shown in Figure 5. The average ratio derived from the composite spectrum of the full sample is also shown in the figure. The two galaxies with the highest SFRs and in the sample have Paschen-line SFRs that clearly exceed their H SFRs, and -PB that are significantly redder than -BD (Figure 4). These results suggest the presence of star formation that is optically thick in the Balmer lines. Not surprisingly, the fainter lines characteristic of the lower luminosity and lower galaxies yield uncertainties in the SFR ratios that are too large to draw a robust conclusion regarding the fraction of optically-thick star formation in these galaxies. Based on measurements from the composite spectrum, the average Paschen-line SFR is larger than the average H SFR of galaxies in the sample, but all galaxies have Paschen-line SFRs that are within a factor of 2 of the H SFRs. Deeper spectroscopy with higher measurements of the Paschen lines—and the continuum, which aids in accurate flux calibration—is needed to robustly constrain the fraction of optically-thick star formation in these galaxies.
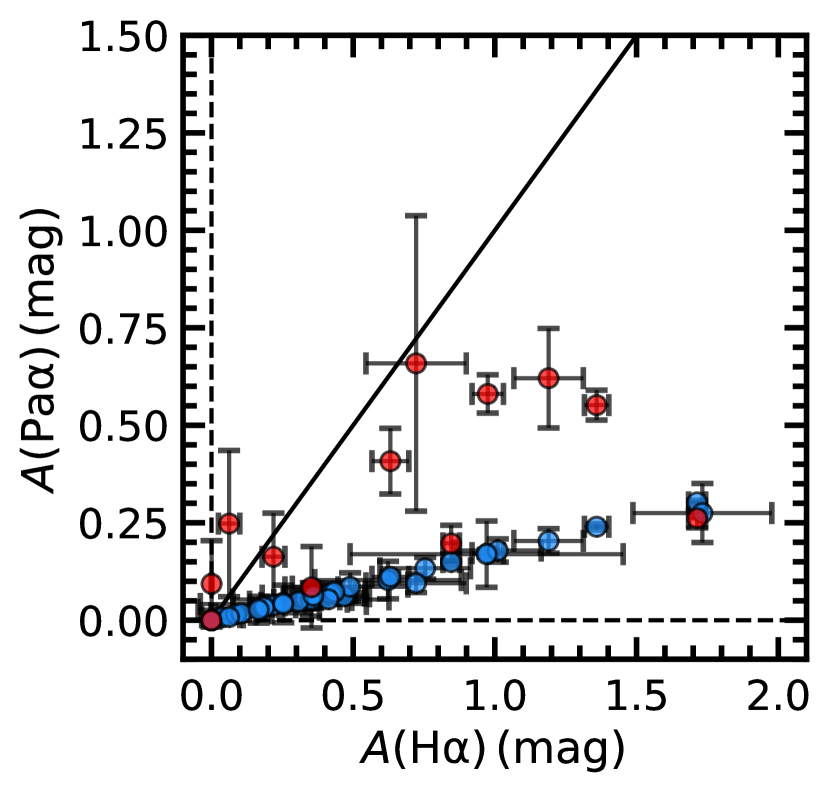
An expected yet important issue to emphasize is the sensitivity of the Paschen lines to bolometric SFR. This aspect is illustrated in Figure 6, where the attenuation in magnitudes of H (assuming -BD) and Pa (assuming -PB) are shown for the line-detected sample. The typical attenuation of Pa is only mag, while it is closer to mag for H. Even with the more extreme values of reddening derived from the Paschen decrement, -PD, for the 12 galaxies with significant detections of Pa and Pa, the derived attenuation of Pa is still smaller than that of H, and even more so had we assumed -PD in computing the attenuation of H. Clearly, the Paschen lines, and in particular Pa, allow for a more direct probe of bolometric SFR that is less sensitive to dust reddening, an aspect that we take advantage of in the next section to probe the relationship between dust obscuration and UV reddening.
IV. PASCHEN-INFERRED DUST OBSCURATION AND THE UV CONTINUUM SLOPE
The spectral slope of the far- to near-UV stellar continuum, , where , has long been used as a proxy for dust obscuration (e.g., Calzetti et al. 1994; Meurer et al. 1999; Reddy et al. 2006; Daddi et al. 2007; Overzier et al. 2011; Reddy et al. 2012; Buat et al. 2012; Bouwens et al. 2016b; Reddy et al. 2018; Fudamoto et al. 2020). The sensitivity of the Paschen lines to bolometric SFR offers a new opportunity to reevaluate the relationship between and dust obscuration. The best-fit SED of each galaxy (Section II.5) was used to calculate the flux density at Å, which in turn was converted to an (unobscured) UV luminosity. This unobscured UV luminosity was converted to a UV SFR based on the same redshift and mass criteria discussed in Section III.3, where we assumed
| (4) |
and () for the () BPASS models with an age of Myr, typical of the ages derived for galaxies in the sample. This UV SFR was subtracted from the (dust-corrected) Paschen-line SFR (Section III.3) to yield an obscured SFR. This obscured SFR was then converted to infrared (IR) luminosity using the relation from Kennicutt (1998), modified for a Chabrier (2003) IMF. There are 5 of 38 galaxies for which the UV SFR exceeds the Paschen-line SFR. In these cases, the IR luminosity was fixed to of the unobscured UV luminosity. Thus, for each galaxy, we have an estimate of the ratio of the IR and UV luminosities, i.e., , or IRX. The photometry corresponding to the rest-frame UV was used to compute for each galaxy. Uncertainties were computed by perturbing the photometric fluxes many times and recomputing .
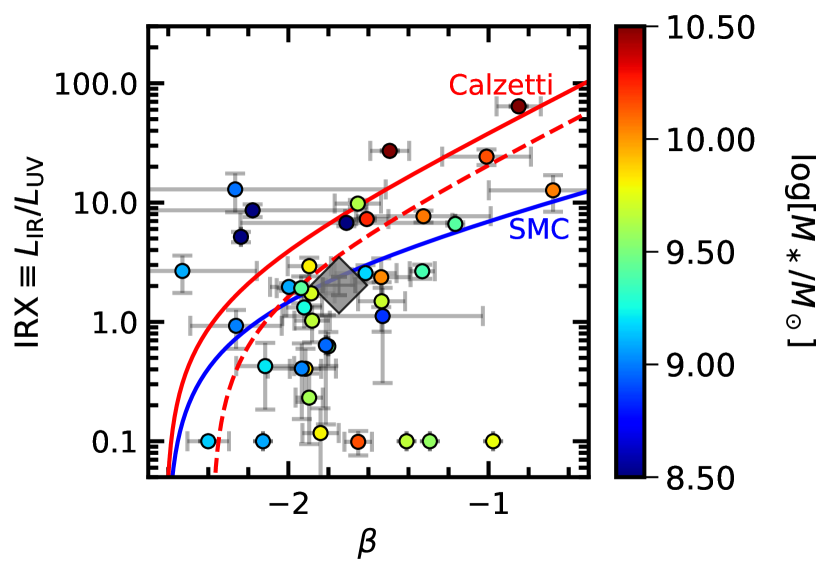
The relationship between dust obscuration, parameterized by IRX, and , i.e., the IRX- relation, for galaxies in the line-detected sample is shown in Figure 7, along with the predicted relations assuming the Calzetti et al. (2000) and SMC curves and an intrinsic appropriate for the BPASS model discussed above. While there is relatively large spread in IRX at a given —which likely correlates with gas-phase metallicity and/or mass (e.g., Reddy et al. 2006; Buat et al. 2012; Zeimann et al. 2015; Bouwens et al. 2016a; Reddy et al. 2018; Shivaei et al. 2020a)—the data points generally scatter around the IRX- relation predicted for a subsolar stellar metallicity model and the SMC extinction curve (see Reddy et al. 2018). The average IRX and for the full sample of 63 galaxies (large diamond in Figure 7) are also consistent with the predictions of the SMC curve. These results confirm previous studies of stacked Herschel far-IR data suggesting that the reddening of the stellar continuum of galaxies with subsolar stellar metallicities is in accordance, on average, with the SMC extinction curve (Reddy et al., 2018). We also find that the most massive galaxies in our sample ( ) exhibit redder UV slopes and higher IRX that may be more consistent with a Calzetti et al. (2000) curve and a solar metallicity model (shown by the dashed red line in Figure 7), confirming previous investigations that found similar results at high redshift (e.g., Reddy et al. 2010; Bouwens et al. 2016a).
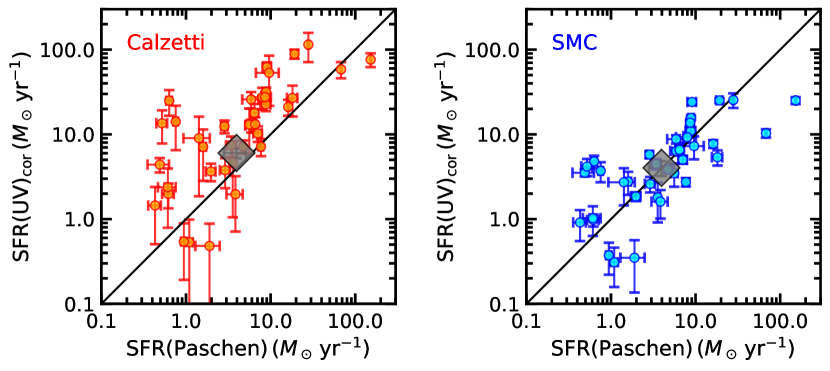
These results are also evident in a direct comparison of the Paschen-based SFRs and the UV based SFRs, where the latter have been corrected for dust using either the Calzetti et al. (2000) dust attenuation curve with a solar metallicity model or the SMC extinction curve with a subsolar metallicity model (Figure 8). The average Paschen-line SFR computed from the composite spectrum of all 63 galaxies is in good agreement with the average dust-corrected UV SFR in both cases. However, for the line-detected sample, the median residual of the SFRs relative to the line of equality is significantly reduced when assuming the SMC extinction curve (median residual of ) versus the Calzetti et al. (2000) curve (median residual of ). The SFR comparison suggests the general applicability of the SMC extinction curve for the UV continuum reddening, but note that there are some cases (e.g., such as the two galaxies with the highest Paschen-line SFRs in the sample) where the Calzetti et al. (2000) curve may provide a better description.
Finally, note the apparent increase in scatter between UV- and Paschen-based SFRs for galaxies at the lower end of the SFR distribution (i.e., Paschen-based SFRs yr-1), irrespective of the attenuation curve used to correct the former. This effect has also been seen in comparisons between UV and Balmer-line SFRs, as well as in low-redshift () galaxies with UV and Pa measurements (Cleri et al., 2022), and has commonly been attributed to stochastic variations in SFR for faint and low-mass galaxies at high redshift (e.g., Domínguez et al. 2015; Guo et al. 2016; Emami et al. 2019; Atek et al. 2022). Our results are the first at to show that this increase in scatter between UV and Balmer-line SFRs persists when using the less-dust-sensitive Paschen lines to infer the SFR.
V. CONCLUSIONS
We present the first analysis of the Paschen lines for a substantial sample of 63 galaxies at observed with JWST/NIRSpec as part of the CEERS survey. Using a combination of Balmer and Paschen lines, we constrain the dust reddening and SFRs of these galaxies. The Balmer decrement, , is strongly correlated with ratios involving the Paschen lines, including , , and the Paschen decrement, , confirming that the Balmer decrement is sensitive to the overall reddening within these galaxies. The measured Paschen-line ratios suggest nebular reddening that is typically larger than that obtained with the Balmer decrement, at least for galaxies with higher SFRs and stellar masses. Consequently, we find marginal evidence that Paschen-based SFRs are larger than those deduced from the Balmer lines alone for such galaxies, though deeper observations are needed to confirm this. Using the Paschen-based SFRs, we investigate the relationship between dust obscuration, parameterized by the IRX ratio, and UV continuum slope, . These measurements, along with direct comparisons of Paschen-line and dust-corrected UV SFRs, confirm previous studies that have found that the SMC extinction curve provides an adequate description of the reddening of the UV continuum in subsolar-metallicity high-redshift galaxies, at least on average.
Larger and more representative samples of galaxies with Paschen-line observations will enable us to extend this analysis to directly constrain the shape of the nebular attenuation curve at high redshift (Reddy et al., 2020; Rezaee et al., 2021; Prescott et al., 2022), and nebular reddening and SFRs and their relationship to stellar continuum reddening. The sensitivity of the Paschen lines to bolometric SFR makes them a critical component for calibrating infrared-based SFRs with JWST/MIRI observations; investigating stochasticity in SFR, particularly for low-mass galaxies; and providing stringent constraints on dust-corrected line ratios that are commonly used to infer the physical state of the ISM, including the ionization parameter and gas-phase metallicity.
References
- Atek et al. (2022) Atek, H., Furtak, L. J., Oesch, P., et al. 2022, MNRAS, 511, 4464
- Battisti et al. (2022) Battisti, A. J., Bagley, M. B., Baronchelli, I., et al. 2022, MNRAS, 513, 4431
- Bouwens et al. (2016a) Bouwens, R. J., Smit, R., Labbé, I., et al. 2016a, ApJ, 831, 176
- Bouwens et al. (2016b) Bouwens, R. J., Aravena, M., Decarli, R., et al. 2016b, ApJ, 833, 72
- Buat et al. (2018) Buat, V., Boquien, M., Małek, K., et al. 2018, A&A, 619, A135
- Buat et al. (2012) Buat, V., Noll, S., Burgarella, D., et al. 2012, A&A, 545, A141
- Calzetti (1997) Calzetti, D. 1997, AJ, 113, 162
- Calzetti et al. (2000) Calzetti, D., Armus, L., Bohlin, R. C., et al. 2000, ApJ, 533, 682
- Calzetti et al. (1994) Calzetti, D., Kinney, A. L., & Storchi-Bergmann, T. 1994, ApJ, 429, 582
- Cardelli et al. (1989) Cardelli, J. A., Clayton, G. C., & Mathis, J. S. 1989, ApJ, 345, 245
- Chabrier (2003) Chabrier, G. 2003, PASP, 115, 763
- Cleri et al. (2022) Cleri, N. J., Trump, J. R., Backhaus, B. E., et al. 2022, ApJ, 929, 3
- Conroy et al. (2009) Conroy, C., Gunn, J. E., & White, M. 2009, ApJ, 699, 486
- Daddi et al. (2007) Daddi, E., Dickinson, M., Morrison, G., et al. 2007, ApJ, 670, 156
- De Barros et al. (2016) De Barros, S., Reddy, N., & Shivaei, I. 2016, ApJ, 820, 96
- Domínguez et al. (2015) Domínguez, A., Siana, B., Brooks, A. M., et al. 2015, MNRAS, 451, 839
- Du et al. (2018) Du, X., Shapley, A. E., Reddy, N. A., et al. 2018, ApJ, 860, 75
- Eldridge et al. (2017) Eldridge, J. J., Stanway, E. R., Xiao, L., et al. 2017, Publications of the Astronomical Society of Australia, 34, e058
- Emami et al. (2019) Emami, N., Siana, B., Weisz, D. R., et al. 2019, ApJ, 881, 71
- Ferland et al. (2017) Ferland, G. J., Chatzikos, M., Guzmán, F., et al. 2017, Revista Mexicana de Astronomia y Astrofisica, 53, 385
- Ferruit et al. (2022) Ferruit, P., Jakobsen, P., Giardino, G., et al. 2022, A&A, 661, A81
- Finkelstein et al. (2011) Finkelstein, K. D., Papovich, C., Finkelstein, S. L., et al. 2011, ApJ, 742, 108
- Finkelstein et al. (2022) Finkelstein, S. L., Bagley, M. B., Ferguson, H. C., et al. 2022, arXiv e-prints, arXiv:2211.05792
- Förster Schreiber et al. (2009) Förster Schreiber, N. M., Genzel, R., Bouché, N., et al. 2009, ApJ, 706, 1364
- Fudamoto et al. (2020) Fudamoto, Y., Oesch, P. A., Faisst, A., et al. 2020, A&A, 643, A4
- Giménez-Arteaga et al. (2022) Giménez-Arteaga, C., Brammer, G. B., Marchesini, D., et al. 2022, ApJS, 263, 17
- Gordon et al. (2003) Gordon, K. D., Clayton, G. C., Misselt, K. A., Landolt, A. U., & Wolff, M. J. 2003, ApJ, 594, 279
- Guo et al. (2016) Guo, Y., Rafelski, M., Faber, S. M., et al. 2016, ApJ, 833, 37
- Kashino et al. (2013) Kashino, D., Silverman, J. D., Rodighiero, G., et al. 2013, ApJ, 777, L8
- Kennicutt (1998) Kennicutt, Robert C., J. 1998, ARA&A, 36, 189
- Kennicutt et al. (1994) Kennicutt, Jr., R. C., Tamblyn, P., & Congdon, C. E. 1994, ApJ, 435, 22
- Kreckel et al. (2013) Kreckel, K., Groves, B., Schinnerer, E., et al. 2013, ApJ, 771, 62
- Kriek et al. (2009) Kriek, M., van Dokkum, P. G., Labbé, I., et al. 2009, ApJ, 700, 221
- Meurer et al. (1999) Meurer, G. R., Heckman, T. M., & Calzetti, D. 1999, ApJ, 521, 64
- Momcheva et al. (2016) Momcheva, I. G., Brammer, G. B., van Dokkum, P. G., et al. 2016, ApJS, 225, 27
- Overzier et al. (2011) Overzier, R. A., Heckman, T. M., Wang, J., et al. 2011, ApJ, 726, L7
- Papovich et al. (2011) Papovich, C., Finkelstein, S. L., Ferguson, H. C., Lotz, J. M., & Giavalisco, M. 2011, MNRAS, 412, 1123
- Prescott et al. (2022) Prescott, M. K. M., Finlator, K. M., Cleri, N. J., Trump, J. R., & Papovich, C. 2022, ApJ, 928, 71
- Price et al. (2014) Price, S. H., Kriek, M., Brammer, G. B., et al. 2014, ApJ, 788, 86
- Reddy et al. (2012) Reddy, N., Dickinson, M., Elbaz, D., et al. 2012, ApJ, 744, 154
- Reddy et al. (2010) Reddy, N. A., Erb, D. K., Pettini, M., Steidel, C. C., & Shapley, A. E. 2010, ApJ, 712, 1070
- Reddy et al. (2006) Reddy, N. A., Steidel, C. C., Erb, D. K., Shapley, A. E., & Pettini, M. 2006, ApJ, 653, 1004
- Reddy et al. (2015) Reddy, N. A., Kriek, M., Shapley, A. E., et al. 2015, ApJ, 806, 259
- Reddy et al. (2018) Reddy, N. A., Oesch, P. A., Bouwens, R. J., et al. 2018, ApJ, 853, 56
- Reddy et al. (2020) Reddy, N. A., Shapley, A. E., Kriek, M., et al. 2020, ApJ, 902, 123
- Reddy et al. (2022) Reddy, N. A., Topping, M. W., Shapley, A. E., et al. 2022, ApJ, 926, 31
- Rezaee et al. (2021) Rezaee, S., Reddy, N., Shivaei, I., et al. 2021, MNRAS, 506, 3588
- Shapley et al. (2023) Shapley, A. E., Sanders, R. L., Reddy, N. A., Topping, M. W., & Brammer, G. B. 2023, arXiv e-prints, arXiv:2301.03241
- Shivaei et al. (2020a) Shivaei, I., Darvish, B., Sattari, Z., et al. 2020a, ApJ, 903, L28
- Shivaei et al. (2020b) Shivaei, I., Reddy, N., Rieke, G., et al. 2020b, ApJ, 899, 117
- Skelton et al. (2014) Skelton, R. E., Whitaker, K. E., Momcheva, I. G., et al. 2014, ApJS, 214, 24
- Stanway & Eldridge (2018) Stanway, E. R., & Eldridge, J. J. 2018, MNRAS, 479, 75
- van der Wel et al. (2014) van der Wel, A., Chang, Y.-Y., Bell, E. F., et al. 2014, ApJ, 792, L6
- Wild et al. (2011) Wild, V., Charlot, S., Brinchmann, J., et al. 2011, MNRAS, 417, 1760
- Wuyts et al. (2011) Wuyts, S., Förster Schreiber, N. M., Lutz, D., et al. 2011, ApJ, 738, 106
- Yoshikawa et al. (2010) Yoshikawa, T., Akiyama, M., Kajisawa, M., et al. 2010, ApJ, 718, 112
- Zeimann et al. (2015) Zeimann, G. R., Ciardullo, R., Gronwall, C., et al. 2015, ApJ, 814, 162