Early Results from GLASS-JWST. XXI: Rapid assembly of a galaxy at revealed by its C/O abundance
Abstract
The abundance of carbon relative to oxygen (C/O) is a promising probe of star formation history in the early universe, as the ratio changes with time due to production of these elements by different nucleosynthesis pathways. We present a measurement of (stat) (sys) in a galaxy observed as part of the GLASS-JWST Early Release Science Program. Notably, we achieve good precision thanks to the detection of the rest-frame ultraviolet O iii], C iii], and C iv emission lines delivered by JWST/NIRSpec. The C/O abundance is 0.8 dex lower than the solar value and is consistent with the expected yield from core-collapse supernovae, indicating that longer-lived intermediate mass stars have not fully contributed to carbon enrichment. This in turn implies rapid buildup of a young stellar population with age Myr in a galaxy seen 900 million years after the Big Bang. Our chemical abundance analysis is consistent with spectral energy distribution modeling of JWST/NIRCam photometric data, which indicates a current stellar mass and specific star formation rate sSFR Gyr-1. These results showcase the value of chemical abundances and C/O in particular to study the earliest stages of galaxy assembly.
1 Introduction
The abundance of heavy elements is a fundamental property of galaxies that traces their growth and star formation, since metals originate from nucleosynthesis in the stellar evolution process (e.g., Maiolino & Mannucci, 2019; Matteucci, 2012). The abundance pattern of metals with different nucleosynthetic origins and enrichment timescales provides a particularly powerful tool for constraining the formation history of galaxies. Since different elements can originate from stars of different masses, the timescales on which the interstellar medium (ISM) is enriched with these elements will differ according to the variation of stellar lifetime with mass. In the simple “closed-box” chemical evolution model, oxygen and other elements are predominantly produced in massive stars (M ) and returned to the ISM on short timescales by core-collapse supernovae (SNe; 10 Myr). While carbon is also produced in massive stars, another important pathway is via intermediate-mass (M ) asymptotic giant branch (AGB) stars with lifetimes of (e.g., Kobayashi et al., 2011, 2020). Consequently, galaxies with a formation timescale of Myr will have C/O abundance approximately equivalent to the yield from core-collapse SNe alone, while C/O increases at ages Myr. The gas-phase abundance ratio C/O can thus indicate whether the stellar population in a galaxy is dominated by stars younger or older than 100 Myr.
C/O abundance is a promising tracer of the earliest phases of galaxy formation both because of its variation on relatively short timescales (100 Myr) and because it can be derived from ratios of rest-frame ultraviolet (UV) emission lines of C (C iii]1907,1909, C iv1548,1550) and O (O iii]1661,1666). These are typically the brightest UV nebular emission lines (e.g., Berg et al., 2022; Byler et al., 2018) and are accessible with JWST/NIRSpec out to extremely high redshifts (). These lines have a further advantage that their ratios are relatively insensitive to dust reddening due to their close proximity in wavelength. Measurements of C iii], C iv, and O iii] at have shown that these high-ionization lines are strong in sources, with equivalent widths significantly larger than all but the most extreme galaxies at (e.g., Stark et al., 2015a, b, 2017; Mainali et al., 2017; Senchyna et al., 2017; Hutchison et al., 2019). The C/O abundance ratio is thus a premier tool for inferring the formation timescales of galaxies in the epoch of reionization during the first billion years of cosmic history.
In the local universe, a relation has been found between C/O and O/H in which C/O plateaus to a low-metallicity floor which averages log(C/O at 12+log(O/H, the primary nucleosynthesis regime, while C/O increases with O/H at higher metallicity (e.g., Henry et al., 2000; Esteban et al., 2014; Berg et al., 2016, 2019; Toribio San Cipriano et al., 2017). Using rest-UV spectroscopy of nearby dwarf galaxies, Berg et al. (2019) showed that this relation displays a large intrinsic scatter of dex in C/O at fixed O/H. This scatter has been shown to be a function of the star formation history (for the enrichment timescale reasons outlined above) and the preferential removal of O relative to C by SNe-driven outflows, where galaxies with shorter formation timescales and little preferential O removal have lower C/O (Berg et al., 2019; Yin et al., 2011). Intermediate-redshift galaxies at fall on the low-metallicity plateau with a mean value and scatter similar to the sample (e.g., Berg et al., 2018a, 2019). Arellano-Córdova et al. (2022) recently reported the first C/O determination at enabled by JWST spectroscopy. These authors found log(C/O for a galaxy, consistent with the local low-metallicity plateau. However, the interpretation of this value is clouded by its low precision due to a marginal detection of C iii] (2.4) and no detection of rest-UV O iii], relying instead on the ratio relative to rest-optical [O iii] lines that is highly sensitive to dust reddening. This early result nonetheless provides a precise O/H abundance and shows the promise of JWST spectroscopy for abundance patterns at extremely high redshifts.
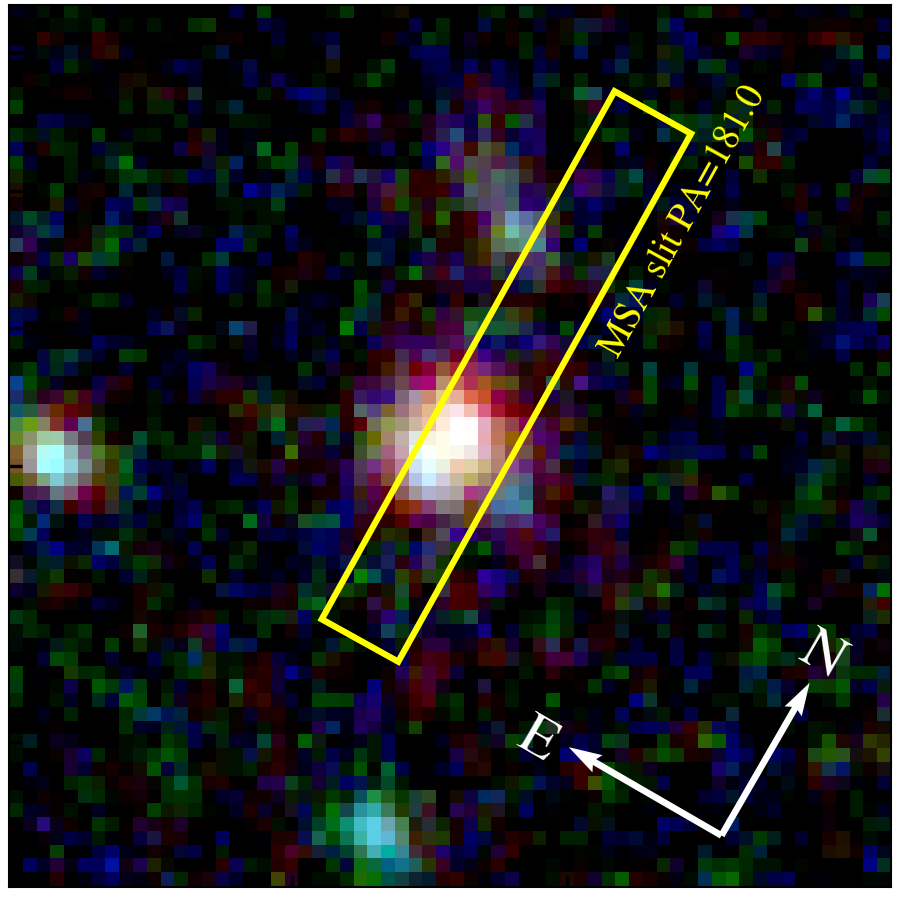
In this work, we present the first high-precision measurement of C/O for a galaxy at enabled by JWST/NIRSpec measurements of the rest-UV C iii], C iv, and O iii] lines from the GLASS-JWST ERS program (Treu et al., 2022). This target (source ID 150008 in the GLASS NIRSpec target catalog and ID 2649 in the Stage 1 photometric catalog described by Paris et al. 2023; RA, Dec = 3.6025240, 30.4192187 degrees) was originally included in the NIRSpec observations as a candidate galaxy based on photometry indicating a Lyman break. We visually inspected the GLASS-JWST spectra of known candidate sources for suitability of C/O abundance measurements and selected this as the best example based on clear detection of the necessary rest-UV lines. For many otherwise promising galaxies, either the C iii] or O iii] lines are not covered due to their position on the slitmask (including the protocluster members described in Morishita et al. 2022). Our current work represents a high-redshift case study which also serves to illustrate the value and feasibility of a future enlarged sample.
This paper is organized as follows. In Section 2, we describe the observations, data reduction, and photometric and spectroscopic measurements. In Section 3 we derive the physical properties of this target, including the electron temperature (Sec. 3.1), ionic and total abundance ratios (Sec. 3.2), and stellar population properties (Sec. 3.3). We discuss the results and present our conclusions in Section 4.
Throughout this work we adopt the concordance CDM cosmology with km s-1 Mpc-1, , and . We use atomic data from Tayal & Zatsarinny (2017) for O++ collision strengths, Froese Fischer & Tachiev (2004) for O++ transition probabilities, Berrington et al. (1985) for C++ collision strengths, Aggarwal & Keenan (2004) for C3+ collision strengths, and Wiese et al. (1996) for C++ and C3+ transition probabilities. We adopt the solar abundance pattern of Asplund et al. (2021).
2 Observations
2.1 Photometry
We use 7-band JWST/NIRCam photometry from the UNCOVER program (JWST-GO-2561; Bezanson et al. 2022) to constrain the stellar population and star formation history. The data reduction and measurement methods are as described in Merlin et al. (2022) and Paris et al. (2023); here we give a brief summary. The mosaics in all bands are obtained using a customised version of the STScI pipeline for JWST (CRDS_VER 11.16.14, CAL_VER 1.8.2), with tailored modules to accurately perform the astrometric alignment and to remove defects such as snowballs, wisps, and claws (see Rigby et al., 2022). Sources are detected on the F444W image using SExtractor (Bertin & Arnouts, 1996). To extract the multiband photometry, images from each photometric filter are first convolved to match the F444W filter’s point spread function. Colors are then measured within an 028 circular aperture (twice the FWHM of the F444W image) using a-phot (Merlin et al., 2019). The total F444W flux is calculated within a Kron elliptical aperture, with fluxes in other bands given by the 028-aperture color scaled to the total flux. The results are given in Table 1.
At the redshift of our target, F356W and F444W broad-band fluxes include strong nebular emission lines (H+[O iii] and H, respectively). This is clearly apparent in the photometry (Table 1), with flux density in these bands elevated by a factor 1.5. The difference of 0.07 Jy in F356W compared to adjacent filters suggests approximately of emission line flux contribution, in reasonable agreement (within 10%) with the measured fluxes of [O iii] and H (Section 2.2). The F410M filter is relatively unaffected by nebular emission and provides a reliable measurement of stellar continuum at rest-frame 5700 Å. Overall the NIRCam photometry provides good sampling of the rest-frame UV through optical continuum (1400–7000 Å) including the Balmer and 4000 Å breaks. We additionally include fluxes from the Hubble Space Telescope (HST) via the Frontier Fields program (Lotz et al. 2017; Merlin et al. 2016; Castellano et al. 2016; data are available in MAST: http://dx.doi.org/10.17909/t9-4xvp-7s45 (catalog 10.17909/t9-4xvp-7s45)) which sample across the Lyman break at . However, the HST photometry has little effect on results in this paper.
| Transition | Flux | FWHM |
|---|---|---|
| ( erg s-1 cm-2) | (Å) | |
| [O iii] 5007aaJoint fit of [O iii] 4959,5007 and H. | 9.53 0.08 | 16.4 0.2 |
| HaaJoint fit of [O iii] 4959,5007 and H. | 1.71 0.07 | |
| H | 0.38 0.05 | 12.2 1.9 |
| C iii]1909bbJoint fit of C iii] 1907,1909. | 0.20 0.05 | |
| C iii]1907bbJoint fit of C iii] 1907,1909. | 0.36 0.06 | 5.3 0.9 |
| O iii] 1666ccJoint fit of O iii] 1661,1666 and He ii 1640. | 0.53 0.08 | 8.3 1.4 |
| He ii 1640ccJoint fit of O iii] 1661,1666 and He ii 1640. | 0.09 0.07 | |
| C iv1551ddJoint fit of C iv 1549,1551. | 0.22 0.06 | |
| C iv1549ddJoint fit of C iv 1549,1551. | 0.23 0.06 | 4.5 1.1 |
| Filter | (Jy) | |
| F435W | 0.001 0.002 | |
| F606W | 0.001 0.003 | |
| F814W | 0.016 0.002 | |
| F105W | 0.113 0.027 | |
| F125W | 0.110 0.024 | |
| F160W | 0.091 0.031 | |
| F115W | 0.106 0.005 | |
| F150W | 0.109 0.004 | |
| F200W | 0.118 0.004 | |
| F277W | 0.109 0.003 | |
| F356W | 0.179 0.003 | |
| F410M | 0.113 0.005 | |
| F444W | 0.172 0.008 |
2.2 NIRSpec spectroscopy and line fluxes
We obtained moderate resolution () spectroscopy covering –5.3 m with JWST/NIRSpec in multi-object spectroscopy (MOS) mode as part of the GLASS-JWST survey (ERS 1324, PI Treu; Treu et al. 2022; see also Morishita et al. 2022 for details of the NIRSpec observations). The slitlet position for our target is shown in Figure 1. We reduced the NIRSpec spectra using a combination of the default STScI JWST calibration pipeline and the msaexp software111https://github.com/gbrammer/msaexp. First, count-rate maps are produced from the uncalibrated data using calwebb_detector1 with the most recent available reference files (jwst_1014.pmap). Then msaexp conducts additional preprocessing steps to remove the 1/f noise and “snowball” features in the rate images, and calls the level-2 calwebb_spec2 reduction scripts to extract 2D spectra from individual exposures, after WCS registration, slit path-loss correction, flat-fielding, wavelength and flux calibrations. Subsequently, msaexp performs an optimal 1D spectral extraction based on the Horne (1986) algorithm, utilizing the target light profile along the cross-dispersion direction for the optimal extraction aperture. Finally, the 1D spectra extracted from multiple exposures at various dither positions and visits are combined via median stacking with outlier rejections. Our target has well-detected continuum traces in individual exposures, making it feasible to extract and combine the 1D spectra as opposed to first combining the 2D spectra. This method is advantageous for bright objects with sub-pixel dithering, since it enables oversampling the line spread function of our NIRSpec observations in order to improve the sampling of the emission line profiles.
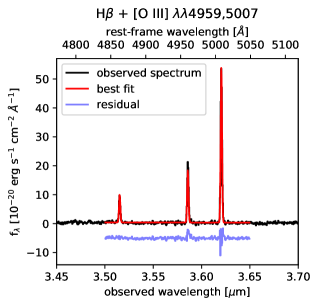
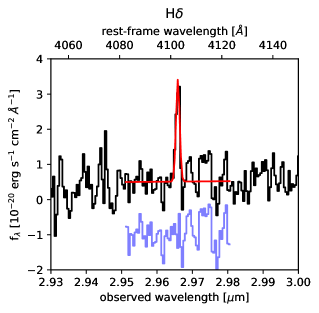
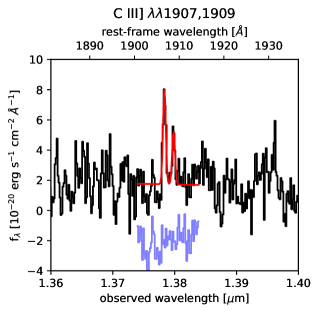
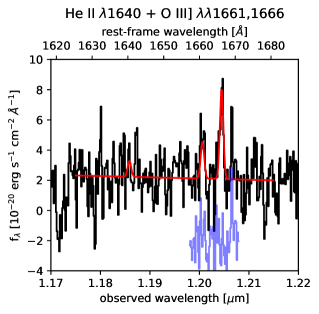
Given the location of our target on the slitmask, the observed wavelength coverage is approximately 1.0–1.6 m with F100LP/G140H, 1.7–2.65 m with F170LP/G235H, and 2.9–4.5 m with F290LP/G395H. There is also a 0.1 m detector gap near the short-wavelength end of each range. This range corresponds to 1360–6220 Å in the rest frame. The spectra include several key rest-frame UV lines used in this analysis (C iii] 1907,1909, O iii] 1661,1666, C iv 1549,1551) as well as prominent rest-frame optical lines (H, H, [O iii] 4959,5007), shown in Figure 1. H and [O iii] 4363 are not covered due to the detector gap, while H and [O ii] 3727,3729 fall redward of the detector area for the slitmask position. Although these missing lines would be useful, the available spectral coverage is suitable for our goal of measuring the C/O abundance.
To account for uncertainties in flux calibration, slit loss, or other factors, we scale the observed spectra to match the photometric flux densities (Section 2.1). The median spectroscopic continuum value is measured within 0.05 m of the central wavelength for F150W (for the G140H spectrum), 0.07 m for F200W (G235H spectrum), and 0.10 m for F410M (G395 spectrum). These filters and spectral ranges are chosen to sample representative parts of each spectral tuning, avoiding strong emission lines. The resulting signal-to-noise is in the median continuum values. The spectra from each grating are then scaled such that these median flux densities match the photometric measurements (Table 1). Notably the main result of C/O abundance derived in this paper is relatively unaffected by scaling effects such as flux calibration and slit losses, since the relevant rest-frame UV lines are close in wavelength and observed in the same grating (F100LP/G140H).
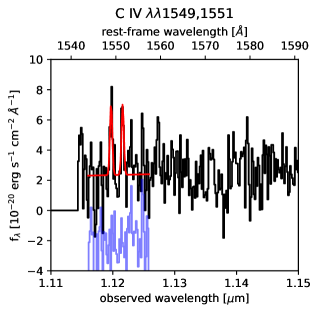
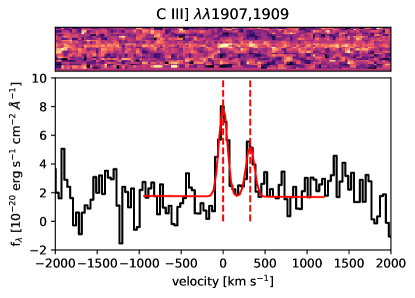
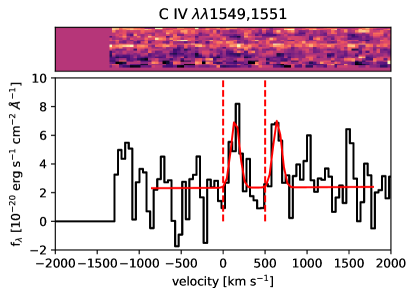
Each emission line of interest is fit with a Gaussian profile along with a first-order polynomial to model the continuum, within a range m around the line centroid. The best-fit line fluxes and Gaussian full width at half maximum (FWHM) values are given in Table 1, with line profiles shown in Figure 1. We fit nearby lines jointly, such as the UV emission doublets and the optical [O iii]+H, using the same redshift and Gaussian width for each line. We also impose the theoretically expected flux ratios [O iii] 5007/4959 and O iii] 1666/1661 in these joint fits, and we report only the stronger line of each doublet. We do not impose constraints on the C iv doublet flux ratio as it can be affected by resonant absorption and scattering, as well as P Cygni stellar features.
In general we find that residuals from these fits are consistent with the noise level. The sole exception is the optical [O iii] doublet, for which the joint fit underestimates the flux of [O iii] 4959 by 15% (and overestimates [O iii] 5007 by 2%) compared to fitting the lines individually. Given this disagreement with the expected flux ratio, the true uncertainty in [O iii] 5007 flux may be as large as 10% (cf. the 1% statistical uncertainty reported in Table 1). However, even if all lines in our analysis are subject to an additional 10% uncertainty in flux, this would still be comparable or smaller than the statistical uncertainty in derived physical properties.
The redshifts of each line fit provide a useful check of the wavelength calibration and uncertainty estimates. Excluding C iv, the remaining four independent fits are all consistent within 1 of their weighted mean (with for 3 degrees of freedom). This indicates a reliable wavelength scale and good fitting results. We exclude C iv emission from this mean because it shows a clear redward velocity shift of km s-1 relative to (Figure 2). The C iv emission appears to be real, exhibiting two lines (both at ) at the expected doublet separation with combined significance in our joint fit. We interpret this shift as arising from scattering in a galactic-scale outflow, which produces the commonly-observed redshifted emission in resonant lines (such as C iv, Mg ii, and Ly; e.g., Prochaska et al. 2011). In this scenario we also expect C iv absorption at velocities from interstellar and outflowing gas along the line-of-sight. Consequently the C iv emission flux can be affected by such absorption (as described in detail by, e.g., Senchyna et al., 2022). However, the continuum signal-to-noise is such that we cannot obtain constraining measurements of interstellar absorption. Similarly we do not have strong constraints on the stellar P Cygni component, which can also affect the nebular emission line profile.
We additionally consider the line widths as a test of the fit quality and as a dynamical mass estimator. The instrument resolution is FWHM Å in G395H (corresponding to H, H, and [O iii]) and 5.2 Å in G140H (C iv, C iii], O iii]). The only fit with FWHM above the instrument resolution is for H and [O iii], which gives an intrinsic velocity FWHM km s-1 corrected for the instrument resolution. All other fits agree within of this value, including H and C iv whose best-fit FWHM are smaller than the instrument resolution. For He ii 1640, the line width is fit jointly with O iii] and the resulting fit should thus be interpreted as a nebular component (as opposed to, e.g., broad stellar emission). Regardless, He ii emission is not detected (). We note that excluding He ii from the fit has negligible effect on the derived O iii] flux or line width. While we find an intrinsic velocity width FWHM km s-1, this may be an underestimate since the source appears to not fill the entire slit width (Figure 1). The longer wavelength lines are likely more accurate as the coarser angular resolution will result in more uniform slit illumination. Our line width measurement is indeed based on the reddest lines available. The implied dynamical mass is within a radius of 1 kpc, with uncertainty of order a factor of 2 (e.g., Law et al., 2009).
3 Physical properties
In this section we present physical properties derived from the photometry and emission line measurements. Quantities such as the stellar mass and SFR must be corrected for the modest lensing magnification. We adopt a magnification factor obtained from the lens model described in Bergamini et al. (2023a, b). This value and 1 confidence interval are determined from a Monte Carlo analysis, and account for the positional accuracy recovered in the updated model (Bergamini et al., 2023b). The formal lensing uncertainties are small and we do not propagate them through the analysis, so that the derived properties can more easily be updated with predictions from other lens models. However, most of the relevant properties for this work (e.g., chemical abundances and stellar population age) are independent of lensing magnification.
3.1 Nebular reddening, temperature and density
The primary goal of this work is to determine the gas-phase abundances, particularly the C/O ratio. Here we use the direct Te method which relies on nebular temperature (Te) and density (ne) measurements.
We first examine the nebular reddening in order to estimate Te from the [O iii] emission lines. The Balmer flux ratio H/H is within 1.4 of the expected intrinsic value 0.264 (assuming Case B recombination with Te K and ne cm-3). Table 2 lists the reddening E(B-V) based on the Cardelli et al. (1989) attenuation law with (as found by Calzetti et al., 2000). This does not include correction for underlying stellar absorption, which could plausibly reduce the E(B-V) value by 0.05 based on SED modeling results (Section 3.3); this is well within the statistical uncertainty. The reddening is insensitive to temperature; an assumed range of Te K results in only change to E(B-V). We additionally report the SFR derived from reddening-corrected H luminosity using the Kennicutt (1998) calibration corrected to a Chabrier (2003) initial mass function (IMF). While E(B-V) is relatively robust to the choice of attenuation law and , we note that the total attenuation and UV-to-optical correction factor can vary by 50%. We thus approach the reddening correction cautiously as the uncertainty is fairly large. The SED analyses described in Section 3.3 give best-fitting E(B-V) –0.3 which, along with the SED-derived star formation rate, suggests that the true reddening is likely in the low end of our uncertainty range from H/H.
We calculate electron temperature using PyNeb (Luridiana et al., 2015) with the atomic data listed in Section 1. The result is Te K from the ratio of UV O iii] to optical [O iii] emission, using the reddening correction described above (corresponding to a correction factor 2.1 in the UV-to-optical flux ratio) and assuming ne = 200 cm-3. (The result is insensitive to density; adopting an extreme cm-3 decreases Te by only 2,000 K.) The uncertainty is entirely dominated by reddening correction, with only 1500 K uncertainty from emission line signal/noise. We can also place a firm lower limit Te 18,000 K assuming no reddening. While this temperature is much higher than typical nearby galaxies and H ii regions (which have Te 10,000 K), high Te is expected in metal-poor and highly star-forming galaxies (e.g., Pérez-Montero et al., 2021; Berg et al., 2021). Indeeed, low-redshift extremely metal-poor galaxies (12+log(O/H) have been found with Te 21,000–25,000 K (e.g., Izotov et al., 2018, 2019, 2021). While such high temperatures may be puzzling given the efficient cooling at Te 20,000 K, comparable or higher Te values have been reported in galaxies based on early JWST observations (e.g., Curti et al., 2023; Schaerer et al., 2022), suggesting they may be common in the rapidly star forming population at this early epoch.
The C iii] doublet ratio is sensitive to electron density. The measured 1907/1909 flux ratio of is compatible with a wide range of densities, though the best-fit measurement is formally unphysical (beyond the low-density limit). The 1 bounds indicate cm-3 assuming Te = 24,000 K. We reiterate that the change in derived Te across this density range is insignificant for our analysis.
| Property | Value |
|---|---|
| RA | 00:14:24.607 |
| Dec | 30:25:09.24 |
| M∗ ()aaFrom the parametric SED fitting method of Santini et al. (2023). | |
| SFRSED ()aaFrom the parametric SED fitting method of Santini et al. (2023). | |
| SFRHβ () | |
| Agepar (Myr)aaFrom the parametric SED fitting method of Santini et al. (2023). | |
| Agenon-par (Myr)bbFrom the non-parametric SED fitting method of Morishita et al. (2019). | |
| E(B-V)gas | |
| Te (K) | |
| ne (cm-3) | |
| Abundances | |
| ccAssuming O32 is uniformly distributed between and Te(O+)=Te(O++). | |
| C++/O++ | |
| C++/O++ddRelative to solar (Asplund et al., 2021). | |
| C3+/C++ | |
| ddRelative to solar (Asplund et al., 2021). | |
3.2 Chemical abundances
We use the measured line fluxes and physical properties from Section 3.1 to calculate ionic abundances using PyNeb, and report the results in Table 2. Our main interest is C/O. We measure C++/O++ ion abundance from the C iii] 1907,1909 / O iii] 1661,1666 flux ratio, which is relatively robust to various sources of uncertainty. The Te uncertainty propagates to dex in C++/O++, with lower Te corresponding to lower C++/O++ abundance. Flux measurement uncertainty (i.e., signal/noise) contributes from each of the O iii] and C iii] doublets. Considering a range of density ne – cm-3 corresponds to only dex relative to our assumed 200 cm-3 (which is motivated by measurements at ; e.g., Sanders et al. 2016). Although the high ne cm-3 permitted by our data would increase the derived C/O by 0.08 dex, we also note that C iii]-based densities are typically higher than found from the more widely-used optical diagnostics (e.g., Mingozzi et al., 2022). Reddening correction is somewhat difficult to assess, as a Milky Way-like attenuation law (e.g., that adopted from Cardelli et al., 1989) indicates that C iii] is more attenuated due to the strong 2175 Å “bump” feature, while laws with weak or no bump (e.g., Calzetti et al., 2000; Reddy et al., 2015) instead have larger attenuation of O iii]. While the bump feature tends to be weak in metal-poor galaxies, Witstok et al. (2023) have recently reported a Milky Way-like bump strength in a low-metallicity galaxy. We thus conservatively adopt a relative reddening factor of (i.e., within 10% of no reddening) for the O iii]/C iii] ratio, which encompasses the plausible range of attenuation laws given the E(B-V) value. This corresponds to uncertainty of only dex, relatively small thanks to the small wavelength separation of the rest-UV emission lines. Collectively the total ion abundance uncertainty from sources discussed above is dex, with the largest contribution from signal/noise of the rest-UV lines.
Another source of uncertainty is the relative temperature associated with C iii] and O iii] emission, which is not well established especially at the high Te of our target. We specifically consider how abundance measurements are affected if C iii] is associated with an intermediate-ionization zone characterized by Te(S++), instead of Te(O++). Extrapolating the Te-Te relation of Garnett (1992) gives an intermediate-ionization temperature lower by 2400 K, propagating to higher C++/O++ abundance (although Garnett suggests Te(O++) is more appropriate for C iii] emission). In contrast the Croxall et al. (2016) and Rogers et al. (2021) relations suggest the opposite with lower inferred C++/O++. Given these relations, we consider a systematic uncertainty corresponding to K difference in Te(C++) relative to Te(O++). This propagates to dex in C++ abundance relative to O++ and C3+. The magnitude of this effect is therefore potentially comparable to the statistical uncertainties reported in Table 2.
The ratio of C iv/C iii] emission allows a measurement of C3+/C++ abundance which is useful for assessing ionization correction factors. We assume that the C iv emission is nebular in origin, noting that interstellar absorption or stellar emission can result in under- or over-estimates of the C3+ abundance, respectively. Ultimately our reported results allow for up to a conservative factor of 2 uncertainty in C3+. We follow the same approach as for C++/O++, assuming the same temperature in the C3+ zone and a relative reddening correction of (i.e., C iv attenuated by 1.03 more than O iii] and C iii]). The abundance from C iv 1549 flux is half that from 1551, although consistent within 1.3. We view the 1551 line as more reliable since it is less susceptible to absorption by interstellar and outflowing gas, and adopt this as our reference for the abundance. The resulting C3+/C++ abundance is given in Table 2 with uncertainties propagated as above.
Our best measurement of metal ion abundance relative to hydrogen is O++/H+, which we obtain from the ratio of [O iii] 5007/H using the Te method. We report the value as in Table 2. The uncertainty is dominated by Te.
3.2.1 Ionization correction factor and total gas-phase abundances
Having established the ionic abundances, we now turn to the total gas-phase abundances of C/O and O/H. This requires an ionization correction factor (ICF) for unobserved ions. The ionization correction from O++/H+ to O/H is typically estimated using the reddening-corrected O32 = [O iii] 5007/[O ii] 3727 ratio alongside a relation to convert measured Te(O++) to Te(O+). Since [O ii] 3727 is not covered due to the wavelength range of the observations, we cannot directly measure O32. The [O ii] 2471 line is covered but undetected, yielding a 3 upper limit of 12+log(O+/H. This limit suggests that more than half of O is in O++, as expected based on the relatively high C3+/C++ ratio. This oxygen ICF (i.e., O++/O+ ) in turn suggests an ICF from C++/O++ to total C/O of (e.g., Berg et al., 2019). As this result is relatively unconstraining, we also consider indirect estimates for O+. It has been shown that O32 is strongly correlated with the rest-frame equivalent width of [O iii] 5007 (EW(5007)) over 2.5 orders of magnitude for star-forming galaxies at (Tang et al., 2019; Sanders et al., 2020). Using the spectroscopically measured EW(5007) Å, the O32–EW(5007) relation of Sanders et al. (2020) implies O32 . However, it is unclear whether this relation evolves between and . The handful of published sources with O32 and EW(5007) measurements (e.g., Curti et al., 2023; Trussler et al., 2022; Schaerer et al., 2022) lie dex above the Sanders et al. (2020) relation, suggesting O32 = 3.6 is a lower limit. The target of this analysis has [O iii]5007/H = 5.4, within the range measured by Curti et al. (2023) for 3 galaxies at ([O iii]5007/H = [3.08, 8.29, 7.11]). These galaxies have O32 = [9.32, 8.94, 13.65]222We calculated O32 based on the observed line fluxes from Curti et al. (2023) using the Cardelli et al. (1989) dust curve assumed in this work. , suggesting that O32 of our target falls in a similar range.
To estimate O+/H+, we conservatively assume a uniform distribution of O32 –10 and adopt the median value of O32 as our fiducial estimate. We further assume that Te(O+) = Te(O++), though the resulting total O/H changes by dex if we instead use the conversion of Campbell et al. (1986) or Pilyugin et al. (2009). Under these assumptions, we estimate 12+log(O+/H. We then calculate the total O abundance under the common assumption O/H , finding 12+log(O/H. The contribution from O3+ is likely negligible in this case (and in all but the most extreme high-ionization sources). Berg et al. (2018a) used photoionization modeling to estimate an O3+ fraction 0.05 for a high-ionization galaxy with C3+/C++=0.86 (cf. in this work). The non-detection of He ii also implies little O3+. Here, a 5% correction for O3+ is significantly smaller than other sources of uncertainty.
Our target shows a significant contribution of both C++ and C3+, which provides useful information on the likely abundance of other ionic species of C. Photoionization models which reproduce this value of C3+/C++ (e.g., Berg et al., 2019) require high ionization parameters (log() and low metallicity (0.1–0.2 solar). These models indicate small contributions from other carbon ions (10% from C+). Oxygen ions in such cases are dominated by O++, with 10% in the singly and triply ionized states consistent with the assumptions for O/H above. Furthermore, in the photoionization models of Berg et al. (2019), C+/C is nearly equal to O+/O across the full range of grid points. Therefore we expect that ionic is approximately equal to total C/O abundance, with this approximation likely accurate to significantly better than 10% for the case where neither C+ nor O+ are observed.
We estimate that the sources of uncertainty in converting from ionic to total C/O abundance are of order 0.1 dex. The unseen states of C and O are likely of order 10% as discussed above. The C3+ abundance may be somewhat underestimated due to scattering and C iv interstellar absorption (Section 2.2), although underlying stellar wind emission could instead cause the C3+ abundance to be overestimated. A factor of 2 change in C3+ abundance corresponds to only 0.10 dex difference in the total , which we view as a conservative limit. We therefore report the total C/O abundance in Table 2 as equal to the with an additional systematic uncertainty term. We note that this value corresponds to an ICF from C++/O++ to total C/O of dex (or a factor 1.5), mainly driven by the C3+ ion which we measure directly. This ICF(C++/O++) value is consistent with the ICF function of Amayo et al. (2021) for models with O++/O (cf. O++/O= based on O32 assumptions). Allowing for a different relative Te(C++) by up to 2400 K (as discussed above) corresponds to dex in C++ and dex in C/O. We sum this in quadrature with the ICF uncertainty and report the total systematic uncertainty as 0.15 dex in C/O abundance (Table 2).
In summary, we have assessed various factors which affect the derived abundance patterns. Ultimately the C/O abundance is based primarily on the well-measured C iii]/O iii] flux ratio (which to rough approximation scales linearly with C/O), combined with an ICF based on C iv/C iii].
3.3 Stellar mass, age, and star formation history from SED fitting
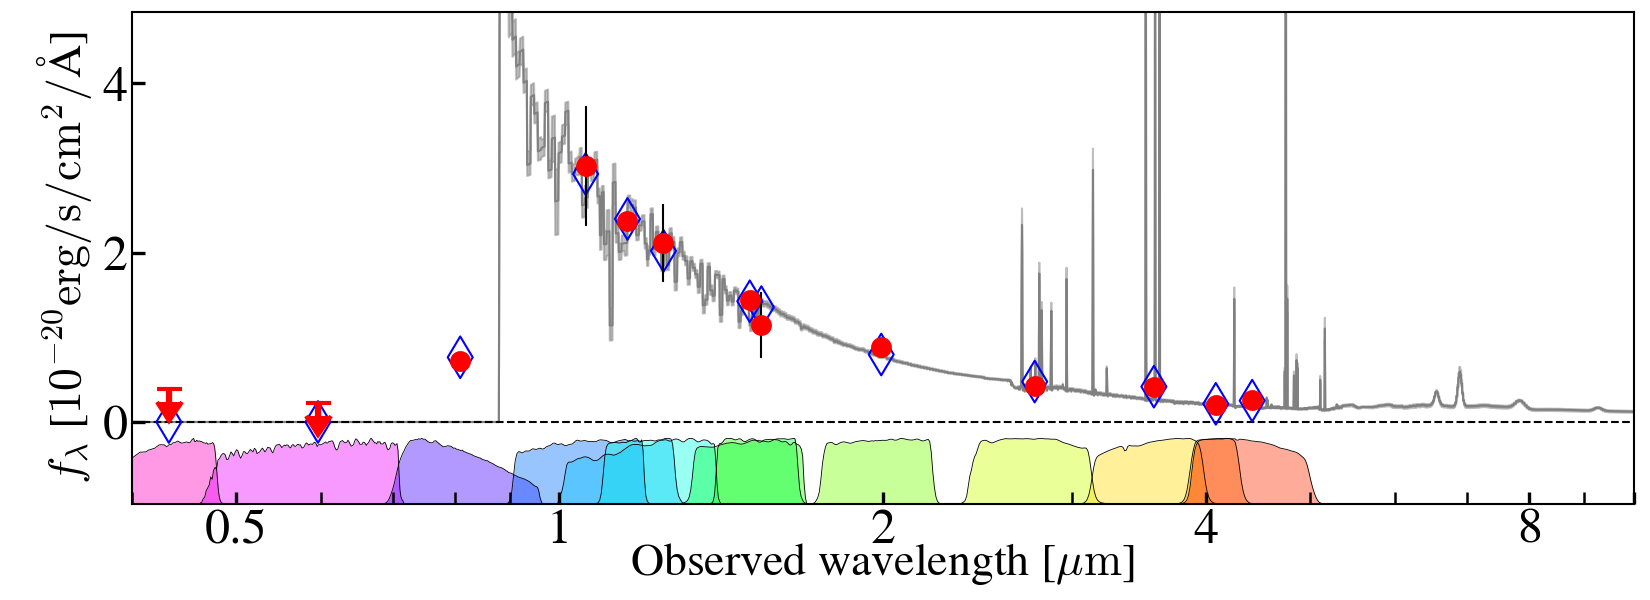
We fit the spectral energy distribution (SED) using the JWST and HST photometry (Table 1; Figure 3) following the methods of Santini et al. (2023), which demonstrated powerful constraints on the stellar mass of high redshift () galaxies. We assume the Bruzual & Charlot (2003) stellar templates, a delayed- star formation history (SFH), Chabrier (2003) initial mass function (IMF), and Calzetti et al. (2000) extinction law. This extinction law has the same as that adopted for our spectroscopic analysis, while we further allow for a range of UV attenuation curves (e.g., 2175 Å bump strengths) in determining the C/O abundance in Section 3.2. The best-fit stellar mass M∗, star formation rate (SFR), and stellar age are given in Table 2. M∗ and SFR are corrected for lensing magnification.
We refer readers to Santini et al. (2023), Dressler et al. (2022), Whitler et al. (2023), and references therein for further discussion of the SFH at high redshifts and the uncertainties associated with SED fitting. A main limitation at high redshifts is the availability of long-wavelength photometry, with JWST/NIRCam providing reasonable sampling redward of the Balmer and 4000 Å breaks up to . The SED of our target is sampled with three filters redward of these breaks (Figure 3), including F410M which is relatively free of strong emission lines and thus anchors the continuum flux density at rest-frame 5700 Å.
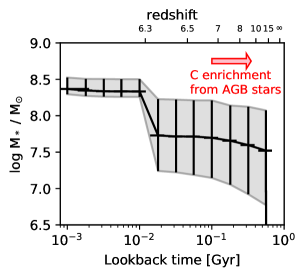
The most relevant stellar population parameter for our abundance analysis is the stellar age. The SED fit with delayed- SFH favors a young 130 Myr age, though the 1 confidence interval extends up to 500 Myr (corresponding to ). To assess possible systematic uncertainties and better constrain the age, we performed an independent analysis of the same photometry with a non-parametric star formation history using the gsf333https://github.com/mtakahiro/gsf (Morishita et al., 2019) and SEDz* (Dressler et al., 2022) software packages. In brief, gsf fits the observed photometry with a linear combination of stellar population templates of different age bins, generated with the stellar population synthesis code fsps (Conroy et al., 2009), where each bin represents a short (30 Myr) burst of constant SFR. SEDz* uses a combination of 10 Myr bursts and constant star formation templates, and is specifically designed to obtain SFHs for galaxies, taking advantage of the fact that their SEDs are largely dominated by class A stars. Figure 3 shows the best-fit SED and star formation history (stellar mass formed per time bin) from gsf. The resulting mass-weighted age of Myr is fully consistent with that following Santini et al. (2023). The de-magnified also agrees within the uncertainties. Likewise, SEDz* fitting results suggest that the majority of stellar mass formed within the preceding Myr. We consider these non-parametric ages to be more reliable. We note that the best-fit stellar population ages are somewhat lower than the predicted average at from Mason et al. (2015), which could be a result of selection bias for young age arising from the requirement of rest-UV emission line detections. Overall the three separate photometric analyses give a consistent picture but with relatively broad allowed ages, from a few tens to hundreds of Myr. When considering only the photometry, it is thus unclear whether the majority of stars seen in this galaxy formed at (as indicated by the best-fit ages) or at –10 (allowed within the 1 bounds). The C/O chemical enrichment information from rest-UV spectroscopy therefore provides a powerful complementary constraint on the star formation history.
4 Discussion and Conclusions
We find a low gas-phase abundance ratio derived primarily from rest-frame UV emission lines. This corresponds to [C/O] relative to the solar scale from Asplund et al. (2021). The overall chemical enrichment of O/H places it near current estimates of the mass-metallicity relation at (e.g., Langeroodi et al., 2022; Jones et al., 2020; Ma et al., 2016), although we caution that this relation is not yet well established at such high redshifts. Figure 4 compares our C/O measurement444For display purposes we add the statistical and systematic uncertainty in quadrature, giving . at with other star forming galaxies and H ii regions at , the recent measurement from Arellano-Córdova et al. (2022), Milky Way stars, and damped Ly systems measured from quasar spectra. Our measurement is in the lower envelope of known values from previous work, making this galaxy one of the lowest C/O systems known, and comparable to similarly metal-poor galaxies at lower redshifts.
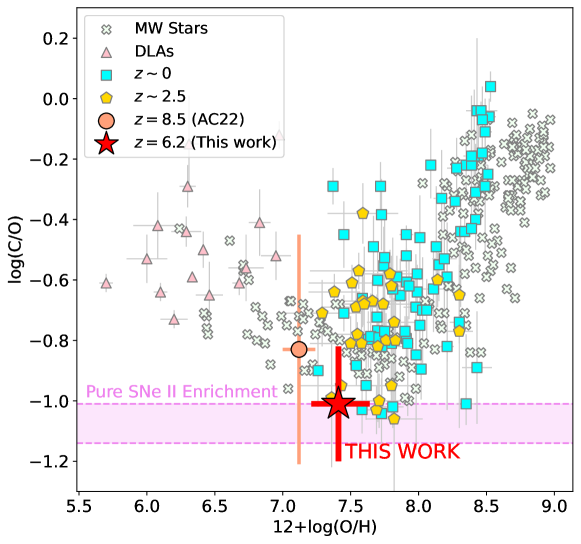
Note— For the H ii regions, C/O was measured from recombination lines (RL). We plot O/H derived using the collisionally-excited line (CEL) Te-method to match the O/H scale of the dwarf galaxy and samples. We assume that the abundance discrepancy factor is the same for C and O (e.g., Toribio San Cipriano et al., 2017), such that C/O derived from RLs and CELs can be fairly compared.
A main point of interest is whether the galaxy is old enough to have undergone significant enrichment from intermediate-mass stars in their AGB phase, as opposed to being dominated by core-collapse supernova yields. We calculate the C/O abundance ratio expected from pure core-collapse SNe enrichment using values from Nomoto et al. (2013) integrated over the massive end of the IMF, assuming yields for stellar metallicities – (shaded region in Figure 4). This range corresponds to adjacent values in the Nomoto et al. (2013) yield tables which straddle the metallicity of our target galaxy. Theoretical yield estimates vary with the initial metallicity which affects, e.g., the stellar evolution, pre-supernova mass loss, and rotational velocity. In this case higher initial metallicity results in larger predicted C/O yields. The core-collapse C/O ratio lies at the extreme lower envelope of local and sources, such that the vast majority of known sources require additional enrichment from AGB stars.
Our C/O measurement agrees with the SNe yield predictions (Figure 4), indicating minimal carbon enrichment from processes other than massive star supernovae. This implies a stellar population age 150 Myr. In older systems, we would expect to see enhanced carbon abundance due to significant enrichment from AGB stars. Including the full yields from AGB stars down to 1 (Nomoto et al., 2006) increases the C/O ratio by 0.5–0.6 dex compared to SNe alone, i.e., to to for the same metallicity range shown in Figure 4. Considering only the yields from stars with main sequence lifetimes shorter than the age of the universe at (i.e., –) results in a 0.25 dex increase to . While a 0.25 dex enhancement is compatible with our measurement, this assumes a closed-box chemical evolution with no inflow or outflow. For the closed-box case we can use the oxygen yields ( for the metallicity of our target and our adopted IMF; Vincenzo et al. 2016) to infer a gas fraction . Given the measured stellar mass (Table 2), the resulting total baryonic mass is several times larger than the dynamical mass estimated in Section 2.2. This in turn suggests that a majority of the oxygen produced in SNe is ejected via outflows, which can increase C/O relative to the closed-box yields in the case where AGB enrichment has occurred. Incidentally the redshifted C iv emission (Figure 2; Section 2.2) is indicatative of a metal-enriched outflow in our target.
Chemical evolution models clearly indicate that the pure core-collapse “floor” C/O value can only be reached when there is no preferential removal of O relative to C from SNe-driven outflows, which is likely not the case when long-timescale AGB enrichment is present (e.g., Yin et al., 2011; Berg et al., 2019). These models suggest following enrichment from AGB stars when modest outflows are included (e.g., when 30% of oxygen is ejected). Our results do not support such high C/O values. This conclusion of little AGB contribution – based on chemical abundance analysis – is consistent with the results of SED fitting which likewise indicate a young age, although with large uncertainty ( Myr; Section 3.3, Figure 3). The source with log(C/O from Arellano-Córdova et al. (2022) is also inferred to have a very young age ( Myr; Carnall et al., 2023), and is consistent with the pure core-collapse scenario, though the abundance constraint for this object is not robust due to the larger uncertainty.
Overall our results indicate a picture of rapid buildup of stellar mass in a galaxy seen only 900 Myr after the big bang, with the majority of stellar mass assembled since (i.e., within 150 Myr) and likely even more recently. The current SFR and stellar mass suggest a mass doubling timescale of only 50 Myr, indicating a rising star formation history based on SED fitting (Figure 3). It is therefore unlikely that this galaxy would have contributed significantly to cosmic reionization at , as our C/O abundance analysis indicates little star formation ( total mass) before this time.
As our results represent the most robust C/O abundance to date in such a high-redshift galaxy, we reflect briefly on lessons learned and prospects for future study. Sensitive rest-UV spectroscopy is essential for this result; the relatively small uncertainty is thanks to clear detection of the UV O iii], C iii], and C iv emission doublets. Notably, we find that C iv is important for assessing the ionization correction factor in this case (where we find C3+ contributes at the level of 0.17 dex), whereas it is often not significant in lower-redshift samples. Care should be taken to assess possible interstellar absorption and stellar contributions to the C iv profile. One of the larger sources of uncertainty is the relative Te associated with emission lines of different ions, as discussed in Section 3.2, which warrants further examination to reach precision better than dex. The precision of our measurement could also be improved with the addition of [O ii] 3726,3729, not covered in our observations, that would yield improved estimates of the ICF. The [O ii] doublet would also provide a better measurement of electron density ne. Measurements of rest-optical [O iii] 4363 (falling in the chip gap in our G395H observations) would provide a better constraint on Te relative to our value based on rest-UV O iii] 1666, for which the error budget is dominated by uncertainty on the reddening correction. The main consequence of these missing emission line diagnostics is that total O/H (and C/H) abundances have larger uncertainty; the effect on derived C/O abundance is relatively minor. Nonetheless it is fully within the capabilities of JWST/NIRSpec to provide these additional measurements with an appropriate mask and filter configuration. Our result thus represents only a lower limit to the C/O precision that can be achieved at with NIRSpec spectroscopy. There is also room for improvement in chemical evolution modeling, which has largely focused on abundance patterns at lower redshifts (e.g. Yin et al., 2011; Berg et al., 2019; Kobayashi et al., 2020). The results of this work and other high-redshift abundance analyses (e.g., Arellano-Córdova et al., 2022; Cameron et al., 2023) motivate exploring multi-element models which are specifically tailored to the rapid formation histories expected in the first billion years of the Universe.
This work demonstrates the value of gas-phase C/O abundance for characterizing star formation histories of galaxies in the epoch of reionization, and the feasibility of reaching good precision with JWST data. A larger sample of targets with C/O measurements will be valuable to characterize the typical SFHs and to compare with complementary results from photometry and SED fitting. For example, Laporte et al. (2022) find stellar population ages Myr in 2 galaxies at within a sample of 6 based on JWST photometry, improving upon earlier Spitzer-based results (e.g., Roberts-Borsani et al., 2020). We would expect these older galaxies to exhibit higher C/O. A positive correlation between C/O and photometrically derived ages (e.g., Dressler et al., 2022) would bolster confidence in both methods. If instead rapid formation histories and ages Myr are a uniform feature of galaxies, then we expect the population to display lower average C/O and smaller intrinsic scatter in C/O at fixed O/H relative to samples at and (Figure 4). Our results motivate the assembly of a larger sample of reionization-era targets with robust rest-UV C iii] and O iii] measurements to constrain the timescale of galaxy assembly in the early universe.
References
- Aggarwal & Keenan (2004) Aggarwal, K. M., & Keenan, F. P. 2004, Phys. Scr, 69, 385, doi: 10.1238/Physica.Regular.069a00385
- Akerman et al. (2004) Akerman, C. J., Carigi, L., Nissen, P. E., Pettini, M., & Asplund, M. 2004, A&A, 414, 931, doi: 10.1051/0004-6361:20034188
- Amayo et al. (2021) Amayo, A., Delgado-Inglada, G., & Stasińska, G. 2021, MNRAS, 505, 2361, doi: 10.1093/mnras/stab1467
- Amorín et al. (2017) Amorín, R., Fontana, A., Pérez-Montero, E., et al. 2017, Nature Astronomy, 1, 0052, doi: 10.1038/s41550-017-0052
- Arellano-Córdova et al. (2022) Arellano-Córdova, K. Z., Berg, D. A., Chisholm, J., et al. 2022, ApJ, 940, L23, doi: 10.3847/2041-8213/ac9ab2
- Asplund et al. (2021) Asplund, M., Amarsi, A. M., & Grevesse, N. 2021, A&A, 653, A141, doi: 10.1051/0004-6361/202140445
- Bayliss et al. (2014) Bayliss, M. B., Rigby, J. R., Sharon, K., et al. 2014, ApJ, 790, 144, doi: 10.1088/0004-637X/790/2/144
- Berg et al. (2021) Berg, D. A., Chisholm, J., Erb, D. K., et al. 2021, ApJ, 922, 170, doi: 10.3847/1538-4357/ac141b
- Berg et al. (2018a) Berg, D. A., Erb, D. K., Auger, M. W., Pettini, M., & Brammer, G. B. 2018a, ApJ, 859, 164, doi: 10.3847/1538-4357/aab7fa
- Berg et al. (2018b) —. 2018b, ApJ, 859, 164, doi: 10.3847/1538-4357/aab7fa
- Berg et al. (2019) Berg, D. A., Erb, D. K., Henry, R. B. C., Skillman, E. D., & McQuinn, K. B. W. 2019, ApJ, 874, 93, doi: 10.3847/1538-4357/ab020a
- Berg et al. (2016) Berg, D. A., Skillman, E. D., Henry, R. B. C., Erb, D. K., & Carigi, L. 2016, ApJ, 827, 126, doi: 10.3847/0004-637X/827/2/126
- Berg et al. (2022) Berg, D. A., James, B. L., King, T., et al. 2022, ApJS, 261, 31, doi: 10.3847/1538-4365/ac6c03
- Bergamini et al. (2023a) Bergamini, P., Acebron, A., Grillo, C., et al. 2023a, A&A, 670, A60, doi: 10.1051/0004-6361/202244575
- Bergamini et al. (2023b) —. 2023b, arXiv e-prints, arXiv:2303.10210, doi: 10.48550/arXiv.2303.10210
- Berrington et al. (1985) Berrington, K. A., Burke, P. G., Dufton, P. L., & Kingston, A. E. 1985, Atomic Data and Nuclear Data Tables, 33, 195, doi: 10.1016/0092-640X(85)90001-4
- Bertin & Arnouts (1996) Bertin, E., & Arnouts, S. 1996, A&AS, 117, 393, doi: 10.1051/aas:1996164
- Bezanson et al. (2022) Bezanson, R., Labbe, I., Whitaker, K. E., et al. 2022, arXiv e-prints, arXiv:2212.04026. https://arxiv.org/abs/2212.04026
- Bruzual & Charlot (2003) Bruzual, G., & Charlot, S. 2003, MNRAS, 344, 1000, doi: 10.1046/j.1365-8711.2003.06897.x
- Byler et al. (2018) Byler, N., Dalcanton, J. J., Conroy, C., et al. 2018, ApJ, 863, 14, doi: 10.3847/1538-4357/aacd50
- Calzetti et al. (2000) Calzetti, D., Armus, L., Bohlin, R. C., et al. 2000, ApJ, 533, 682, doi: 10.1086/308692
- Cameron et al. (2023) Cameron, A. J., Katz, H., Rey, M. P., & Saxena, A. 2023, arXiv e-prints, arXiv:2302.10142, doi: 10.48550/arXiv.2302.10142
- Campbell et al. (1986) Campbell, A., Terlevich, R., & Melnick, J. 1986, MNRAS, 223, 811, doi: 10.1093/mnras/223.4.811
- Cardelli et al. (1989) Cardelli, J. A., Clayton, G. C., & Mathis, J. S. 1989, ApJ, 345, 245, doi: 10.1086/167900
- Carnall et al. (2023) Carnall, A. C., Begley, R., McLeod, D. J., et al. 2023, MNRAS, 518, L45, doi: 10.1093/mnrasl/slac136
- Castellano et al. (2016) Castellano, M., Amorín, R., Merlin, E., et al. 2016, A&A, 590, A31, doi: 10.1051/0004-6361/201527514
- Chabrier (2003) Chabrier, G. 2003, PASP, 115, 763, doi: 10.1086/376392
- Christensen et al. (2012) Christensen, L., Laursen, P., Richard, J., et al. 2012, MNRAS, 427, 1973, doi: 10.1111/j.1365-2966.2012.22007.x
- Conroy et al. (2009) Conroy, C., Gunn, J. E., & White, M. 2009, ApJ, 699, 486, doi: 10.1088/0004-637X/699/1/486
- Cooke et al. (2017) Cooke, R. J., Pettini, M., & Steidel, C. C. 2017, MNRAS, 467, 802, doi: 10.1093/mnras/stx037
- Croxall et al. (2016) Croxall, K. V., Pogge, R. W., Berg, D. A., Skillman, E. D., & Moustakas, J. 2016, ApJ, 830, 4, doi: 10.3847/0004-637X/830/1/4
- Curti et al. (2023) Curti, M., D’Eugenio, F., Carniani, S., et al. 2023, MNRAS, 518, 425, doi: 10.1093/mnras/stac2737
- Dressler et al. (2022) Dressler, A., Vulcani, B., Treu, T., et al. 2022, arXiv e-prints, arXiv:2208.04292. https://arxiv.org/abs/2208.04292
- Erb et al. (2010) Erb, D. K., Pettini, M., Shapley, A. E., et al. 2010, ApJ, 719, 1168, doi: 10.1088/0004-637X/719/2/1168
- Esteban et al. (2009) Esteban, C., Bresolin, F., Peimbert, M., et al. 2009, ApJ, 700, 654, doi: 10.1088/0004-637X/700/1/654
- Esteban et al. (2017) Esteban, C., Fang, X., García-Rojas, J., & Toribio San Cipriano, L. 2017, MNRAS, 471, 987, doi: 10.1093/mnras/stx1624
- Esteban et al. (2014) Esteban, C., García-Rojas, J., Carigi, L., et al. 2014, MNRAS, 443, 624, doi: 10.1093/mnras/stu1177
- Esteban et al. (2004) Esteban, C., Peimbert, M., García-Rojas, J., et al. 2004, MNRAS, 355, 229, doi: 10.1111/j.1365-2966.2004.08313.x
- Fabbian et al. (2009) Fabbian, D., Nissen, P. E., Asplund, M., Pettini, M., & Akerman, C. 2009, A&A, 500, 1143, doi: 10.1051/0004-6361/200810095
- Fosbury et al. (2003) Fosbury, R. A. E., Villar-Martín, M., Humphrey, A., et al. 2003, ApJ, 596, 797, doi: 10.1086/378228
- Froese Fischer & Tachiev (2004) Froese Fischer, C., & Tachiev, G. 2004, Atomic Data and Nuclear Data Tables, 87, 1, doi: 10.1016/j.adt.2004.02.001
- García-Rojas & Esteban (2007) García-Rojas, J., & Esteban, C. 2007, ApJ, 670, 457, doi: 10.1086/521871
- García-Rojas et al. (2005) García-Rojas, J., Esteban, C., Peimbert, A., et al. 2005, MNRAS, 362, 301, doi: 10.1111/j.1365-2966.2005.09302.x
- García-Rojas et al. (2006) García-Rojas, J., Esteban, C., Peimbert, M., et al. 2006, MNRAS, 368, 253, doi: 10.1111/j.1365-2966.2006.10105.x
- García-Rojas et al. (2004) —. 2004, ApJS, 153, 501, doi: 10.1086/421909
- Garnett (1992) Garnett, D. R. 1992, AJ, 103, 1330, doi: 10.1086/116146
- Gustafsson et al. (1999) Gustafsson, B., Karlsson, T., Olsson, E., Edvardsson, B., & Ryde, N. 1999, A&A, 342, 426. https://arxiv.org/abs/astro-ph/9811303
- Henry et al. (2000) Henry, R. B. C., Edmunds, M. G., & Köppen, J. 2000, ApJ, 541, 660, doi: 10.1086/309471
- Horne (1986) Horne, K. 1986, PASP, 98, 609 , doi: 10.1086/131801
- Hutchison et al. (2019) Hutchison, T. A., Papovich, C., Finkelstein, S. L., et al. 2019, ApJ, 879, 70, doi: 10.3847/1538-4357/ab22a2
- Iani et al. (2022) Iani, E., Zanella, A., Vernet, J., et al. 2022, MNRAS, doi: 10.1093/mnras/stac3198
- Izotov et al. (2019) Izotov, Y. I., Thuan, T. X., & Guseva, N. G. 2019, MNRAS, 483, 5491, doi: 10.1093/mnras/sty3472
- Izotov et al. (2021) —. 2021, MNRAS, 504, 3996, doi: 10.1093/mnras/stab1099
- Izotov et al. (2018) Izotov, Y. I., Thuan, T. X., Guseva, N. G., & Liss, S. E. 2018, MNRAS, 473, 1956, doi: 10.1093/mnras/stx2478
- James et al. (2014) James, B. L., Pettini, M., Christensen, L., et al. 2014, MNRAS, 440, 1794, doi: 10.1093/mnras/stu287
- Jones et al. (2020) Jones, T., Sanders, R., Roberts-Borsani, G., et al. 2020, ApJ, 903, 150, doi: 10.3847/1538-4357/abb943
- Kennicutt (1998) Kennicutt, Robert C., J. 1998, ARA&A, 36, 189, doi: 10.1146/annurev.astro.36.1.189
- Kobayashi et al. (2020) Kobayashi, C., Karakas, A. I., & Lugaro, M. 2020, ApJ, 900, 179, doi: 10.3847/1538-4357/abae65
- Kobayashi et al. (2011) Kobayashi, C., Karakas, A. I., & Umeda, H. 2011, MNRAS, 414, 3231, doi: 10.1111/j.1365-2966.2011.18621.x
- Langeroodi et al. (2022) Langeroodi, D., Hjorth, J., Chen, W., et al. 2022, arXiv e-prints, arXiv:2212.02491. https://arxiv.org/abs/2212.02491
- Laporte et al. (2022) Laporte, N., Ellis, R. S., Witten, C. E. C., & Roberts-Borsani, G. 2022, arXiv e-prints, arXiv:2212.05072. https://arxiv.org/abs/2212.05072
- Law et al. (2009) Law, D. R., Steidel, C. C., Erb, D. K., et al. 2009, ApJ, 697, 2057, doi: 10.1088/0004-637X/697/2/2057
- López-Sánchez et al. (2007) López-Sánchez, Á. R., Esteban, C., García-Rojas, J., Peimbert, M., & Rodríguez, M. 2007, ApJ, 656, 168, doi: 10.1086/510112
- Lotz et al. (2017) Lotz, J. M., Koekemoer, A., Coe, D., et al. 2017, ApJ, 837, 97, doi: 10.3847/1538-4357/837/1/97
- Luridiana et al. (2015) Luridiana, V., Morisset, C., & Shaw, R. A. 2015, A&A, 573, A42, doi: 10.1051/0004-6361/201323152
- Ma et al. (2016) Ma, X., Hopkins, P. F., Faucher-Giguère, C.-A., et al. 2016, MNRAS, 456, 2140, doi: 10.1093/mnras/stv2659
- Mainali et al. (2017) Mainali, R., Kollmeier, J. A., Stark, D. P., et al. 2017, ApJ, 836, L14, doi: 10.3847/2041-8213/836/1/L14
- Mainali et al. (2020) Mainali, R., Stark, D. P., Tang, M., et al. 2020, MNRAS, 494, 719, doi: 10.1093/mnras/staa751
- Maiolino & Mannucci (2019) Maiolino, R., & Mannucci, F. 2019, A&A Rev., 27, 3, doi: 10.1007/s00159-018-0112-2
- Mason et al. (2015) Mason, C. A., Trenti, M., & Treu, T. 2015, ApJ, 813, 21, doi: 10.1088/0004-637X/813/1/21
- Matteucci (2012) Matteucci, F. 2012, Chemical Evolution of Galaxies, doi: 10.1007/978-3-642-22491-1
- Matthee et al. (2021) Matthee, J., Sobral, D., Hayes, M., et al. 2021, MNRAS, 505, 1382, doi: 10.1093/mnras/stab1304
- Merlin et al. (2019) Merlin, E., Pilo, S., Fontana, A., et al. 2019, A&A, 622, A169, doi: 10.1051/0004-6361/201833991
- Merlin et al. (2016) Merlin, E., Amorín, R., Castellano, M., et al. 2016, A&A, 590, A30, doi: 10.1051/0004-6361/201527513
- Merlin et al. (2022) Merlin, E., Bonchi, A., Paris, D., et al. 2022, ApJ, 938, L14, doi: 10.3847/2041-8213/ac8f93
- Mingozzi et al. (2022) Mingozzi, M., James, B. L., Arellano-Córdova, K. Z., et al. 2022, ApJ, 939, 110, doi: 10.3847/1538-4357/ac952c
- Morishita et al. (2019) Morishita, T., Abramson, L. E., Treu, T., et al. 2019, ApJ, 877, 141, doi: 10.3847/1538-4357/ab1d53
- Morishita et al. (2022) Morishita, T., Roberts-Borsani, G., Treu, T., et al. 2022, arXiv e-prints, arXiv:2211.09097. https://arxiv.org/abs/2211.09097
- Nissen et al. (2014) Nissen, P. E., Chen, Y. Q., Carigi, L., Schuster, W. J., & Zhao, G. 2014, A&A, 568, A25, doi: 10.1051/0004-6361/201424184
- Nomoto et al. (2013) Nomoto, K., Kobayashi, C., & Tominaga, N. 2013, ARA&A, 51, 457, doi: 10.1146/annurev-astro-082812-140956
- Nomoto et al. (2006) Nomoto, K., Tominaga, N., Umeda, H., Kobayashi, C., & Maeda, K. 2006, Nucl. Phys. A, 777, 424, doi: 10.1016/j.nuclphysa.2006.05.008
- Paris et al. (2023) Paris, D., Merlin, E., Fontana, A., et al. 2023, arXiv e-prints, arXiv:2301.02179. https://arxiv.org/abs/2301.02179
- Peña-Guerrero et al. (2017) Peña-Guerrero, M. A., Leitherer, C., de Mink, S., Wofford, A., & Kewley, L. 2017, ApJ, 847, 107, doi: 10.3847/1538-4357/aa88bf
- Peimbert et al. (2005) Peimbert, A., Peimbert, M., & Ruiz, M. T. 2005, ApJ, 634, 1056, doi: 10.1086/444557
- Pérez-Montero et al. (2021) Pérez-Montero, E., Amorín, R., Sánchez Almeida, J., et al. 2021, MNRAS, 504, 1237, doi: 10.1093/mnras/stab862
- Pilyugin et al. (2009) Pilyugin, L. S., Mattsson, L., Vílchez, J. M., & Cedrés, B. 2009, MNRAS, 398, 485, doi: 10.1111/j.1365-2966.2009.15182.x
- Prochaska et al. (2011) Prochaska, J. X., Kasen, D., & Rubin, K. 2011, ApJ, 734, 24, doi: 10.1088/0004-637X/734/1/24
- Reddy et al. (2015) Reddy, N. A., Kriek, M., Shapley, A. E., et al. 2015, ApJ, 806, 259, doi: 10.1088/0004-637X/806/2/259
- Rigby et al. (2022) Rigby, J., Perrin, M., McElwain, M., et al. 2022, arXiv e-prints, arXiv:2207.05632. https://arxiv.org/abs/2207.05632
- Rigby et al. (2021) Rigby, J. R., Florian, M., Acharyya, A., et al. 2021, ApJ, 908, 154, doi: 10.3847/1538-4357/abcfc9
- Roberts-Borsani et al. (2020) Roberts-Borsani, G. W., Ellis, R. S., & Laporte, N. 2020, MNRAS, 497, 3440, doi: 10.1093/mnras/staa2085
- Rogers et al. (2021) Rogers, N. S. J., Skillman, E. D., Pogge, R. W., et al. 2021, ApJ, 915, 21, doi: 10.3847/1538-4357/abf8b9
- Salpeter (1955) Salpeter, E. E. 1955, ApJ, 121, 161, doi: 10.1086/145971
- Sanders et al. (2016) Sanders, R. L., Shapley, A. E., Kriek, M., et al. 2016, ApJ, 816, 23, doi: 10.3847/0004-637X/816/1/23
- Sanders et al. (2020) Sanders, R. L., Shapley, A. E., Reddy, N. A., et al. 2020, MNRAS, 491, 1427, doi: 10.1093/mnras/stz3032
- Santini et al. (2023) Santini, P., Fontana, A., Castellano, M., et al. 2023, ApJ, 942, L27, doi: 10.3847/2041-8213/ac9586
- Schaerer et al. (2022) Schaerer, D., Marques-Chaves, R., Barrufet, L., et al. 2022, A&A, 665, L4, doi: 10.1051/0004-6361/202244556
- Senchyna et al. (2017) Senchyna, P., Stark, D. P., Vidal-García, A., et al. 2017, MNRAS, 472, 2608, doi: 10.1093/mnras/stx2059
- Senchyna et al. (2022) Senchyna, P., Stark, D. P., Charlot, S., et al. 2022, ApJ, 930, 105, doi: 10.3847/1538-4357/ac5d38
- Stark et al. (2014) Stark, D. P., Richard, J., Siana, B., et al. 2014, MNRAS, 445, 3200, doi: 10.1093/mnras/stu1618
- Stark et al. (2015a) Stark, D. P., Richard, J., Charlot, S., et al. 2015a, MNRAS, 450, 1846, doi: 10.1093/mnras/stv688
- Stark et al. (2015b) Stark, D. P., Walth, G., Charlot, S., et al. 2015b, MNRAS, 454, 1393, doi: 10.1093/mnras/stv1907
- Stark et al. (2017) Stark, D. P., Ellis, R. S., Charlot, S., et al. 2017, MNRAS, 464, 469, doi: 10.1093/mnras/stw2233
- Steidel et al. (2016) Steidel, C. C., Strom, A. L., Pettini, M., et al. 2016, ApJ, 826, 159, doi: 10.3847/0004-637X/826/2/159
- Tang et al. (2019) Tang, M., Stark, D. P., Chevallard, J., & Charlot, S. 2019, MNRAS, 489, 2572, doi: 10.1093/mnras/stz2236
- Tayal & Zatsarinny (2017) Tayal, S. S., & Zatsarinny, O. 2017, ApJ, 850, 147, doi: 10.3847/1538-4357/aa9613
- Toribio San Cipriano et al. (2017) Toribio San Cipriano, L., Domínguez-Guzmán, G., Esteban, C., et al. 2017, MNRAS, 467, 3759, doi: 10.1093/mnras/stx328
- Toribio San Cipriano et al. (2016) Toribio San Cipriano, L., García-Rojas, J., Esteban, C., Bresolin, F., & Peimbert, M. 2016, MNRAS, 458, 1866, doi: 10.1093/mnras/stw397
- Treu et al. (2022) Treu, T., Roberts-Borsani, G., Bradac, M., et al. 2022, ApJ, in press, arXiv:2206.07978. https://arxiv.org/abs/2206.07978
- Trussler et al. (2022) Trussler, J. A. A., Adams, N. J., Conselice, C. J., et al. 2022, arXiv e-prints, arXiv:2207.14265. https://arxiv.org/abs/2207.14265
- Tsamis et al. (2003) Tsamis, Y. G., Barlow, M. J., Liu, X. W., Danziger, I. J., & Storey, P. J. 2003, MNRAS, 338, 687, doi: 10.1046/j.1365-8711.2003.06081.x
- Vanzella et al. (2016) Vanzella, E., De Barros, S., Cupani, G., et al. 2016, ApJ, 821, L27, doi: 10.3847/2041-8205/821/2/L27
- Vincenzo et al. (2016) Vincenzo, F., Matteucci, F., Belfiore, F., & Maiolino, R. 2016, MNRAS, 455, 4183, doi: 10.1093/mnras/stv2598
- Whitler et al. (2023) Whitler, L., Stark, D. P., Endsley, R., et al. 2023, MNRAS, 519, 5859, doi: 10.1093/mnras/stad004
- Wiese et al. (1996) Wiese, W. L., Fuhr, J. R., & Deters, T. M. 1996, Atomic transition probabilities of carbon, nitrogen, and oxygen : a critical data compilation
- Witstok et al. (2023) Witstok, J., Shivaei, I., Smit, R., et al. 2023, arXiv e-prints, arXiv:2302.05468, doi: 10.48550/arXiv.2302.05468
- Yin et al. (2011) Yin, J., Matteucci, F., & Vladilo, G. 2011, A&A, 531, A136, doi: 10.1051/0004-6361/201015022