Effects of particle size and background rotation on the settling of particle clouds
Abstract
We experimentally investigate the behaviour of instantaneous localised releases of heavy particles falling as turbulent clouds in quiescent water, both with and without background rotation. We present the results of 514 systematic experiments for no rotation and for three rotation rates rpm, and for the size of particles in the range to , exploring four decades of the Rouse number which quantifies the inertia of particles. In the canonical framework of turbulent thermals described by Morton et al., [Proc. R. Soc. A: Math. Phys. Sci. 234, 1 (1956)], we compare particle clouds with salt-water thermals to highlight specificities due to the particulate nature of the turbulence forcing. In the absence of rotation, particle clouds initially behave as salty thermals with a modulation of their entrainment capacity, which is optimally enhanced for a finite inertia due to particulate effects. However this regime of turbulence is limited in time due to the inertial decoupling between turbulent eddies and particles. For the three values of explored here, the particulate enhancement of entrainment is inhibited. Moreover the cloud’s expansion is interrupted when the Coriolis force overcomes its inertia, forcing the cloud to transform into vortical columnar flows which considerably increase the residence time of particles.
I Introduction
Interactions between a fluid and solid particles can take many forms. In granular media of maximum packing fraction, particles constrain the fluid motion. Conversely, in configurations of vanishingly small concentrations, particles are seemingly isolated and the fluid tends to constrain the motion of the particles. The continuous transition between these end-members [1] and the influence of other particle properties like their size and density offer a vast spectrum of interactions and phenomena (see [2] for a review), which notably manifest in landslides [3], the transport of sediments in rivers [4], the performance of agricultural sprays [5], or the formation of planets in protoplanetary disks [6].
When the size of particles, their volume fraction and the particle-to-fluid density anomaly are low, the fluid governs the motion of particles whose feedback on the flow is negligible, a situation called one-way coupling [7]. Many studies have considered the one-way coupling between particles and pre-established idealised isotropic turbulent flows whose properties are well controlled [2], evidencing that turbulence is a source of non-uniformities in the field of particle concentration (e.g., [8, 9, 10]) and that turbulence alters the velocity and trajectory of settling particles (e.g., [11, 12]).
Although these studies have brought substantial light on the interactions between the fluid and particles, in several situations the feedback of particles on the fluid has a non-negligible impact on the flow [13] – a situation referred to as two-way coupling [7]. This is especially true when the flow is nourished by the particles, as in downdrafts which can be accompanied by intense rainfalls and are accelerated by the evaporation of droplets [14], or when the flow is produced by the particles themselves e.g., in turbidity currents [15, 16]. The initial motivation of the present study fits in this latter framework: past studies suggest that the magnetic field of small telluric planets and moons like Mercury or Ganymede results from the fluid motions generated by iron snow flakes settling into liquid metal – a phenomenon called iron snow [17]. As a first step to understand this phenomenon, this study focuses on the instantaneous release of heavy particles falling as a cloud in water.
The motion of buoyant clouds has been widely studied by releasing a finite volume of denser miscible fluid (often salt water) in fresh water, which almost immediately becomes turbulent. A decisive aspect of the dynamics of these clouds is the efficiency of turbulence to entrain ambient fluid at the cloud interface. Entrainment is actually key to modelling numerous structures like gravity currents [15, 16], wildfire plumes [18], moist convection cells [19] or heat plumes in ventilated spaces [20]. By a simple modelling of entrainment through a single scalar coefficient, Morton et al. [21] developed in 1956 the turbulent thermal model, which has proved a successful model of finite releases of buoyant fluid in a multitude of contexts [22], even for finite buoyant releases made of immiscible fluid [23] and bubbles [24] generated from different initial conditions. Similarly, past experiments on finite releases of heavy particles have shown that after an initial regime of acceleration, the dynamics of such clouds can be described with the turbulent thermal model [25, 26, 27, 28]. To the best of our knowledge, no specific influence of the particulate nature of the turbulence forcing has been observed on this initial dynamics. Yet, particles have proved capable of modulating turbulence in controlled turbulent flows (see [7] for a review) as well as in recent experiments on particle-laden plumes (i.e. continuous injections of buoyancy), whose entrainment efficiency was altered by particles when they crossed the plume interface [29]. The absence of any such observation for instantaneous releases calls for systematic experiments to determine whether the particulate nature of the turbulence forcing can alter the entrainment efficiency of particle clouds with respect to miscible turbulent thermals. To do so, we investigate the role of particle inertia by covering a large range of particles’ sizes from a regime dominated by the fluid motions (when particles have a low inertia) to a regime dominated by the inertia of particles.
Motivated by the influence of planetary rotation during iron snow, we also investigate the influence of background rotation on the clouds’ dynamics. Various experimental studies exist on plumes in a rotating ambient [30, 31, 32, 33, 34]. Some recent studies brought substantial light on their particular behaviour due to the solid body rotation, both for bubble-laden [33] and miscible plumes [34]. These studies can qualitatively guide the analysis of thermals in a rotating ambient, but while plumes tend to reach a permanent regime, thermals are inherently transient so that scaling laws inevitably differ. A few experimental studies exist for instantaneous buoyant releases that are miscible with water [35, 36], but to the best of our knowledge, no such experiments have been conducted with particle clouds.
In this work, we present the results of 514 experiments performed by systematically varying the size of particles and the angular velocity of the background rotation. The experimental apparatus and governing dimensionless numbers are introduced in section II. Section III analyses the behaviour of particle clouds in a still environment, starting from the reference salt water thermals in the canonical framework of Morton et al. [21] in section III.1. The evolution of clouds is analysed by distinguishing two dynamical regimes, and we observe specific effects resulting from the particulate nature of the turbulence forcing when clouds behave as turbulent thermals. Section IV analyses the additional influence of background rotation. Again distinguishing two regimes, we observe that rotation inhibits most of the particulate effects observed without rotation, and considerably increases the residence time of particles when they fall. In section V, main results are summed up and final remarks are made. Lists of all experiments (table 2) and all notations (table B) can be found in appendixes.
II Experimental apparatus
II.1 Experimental setup
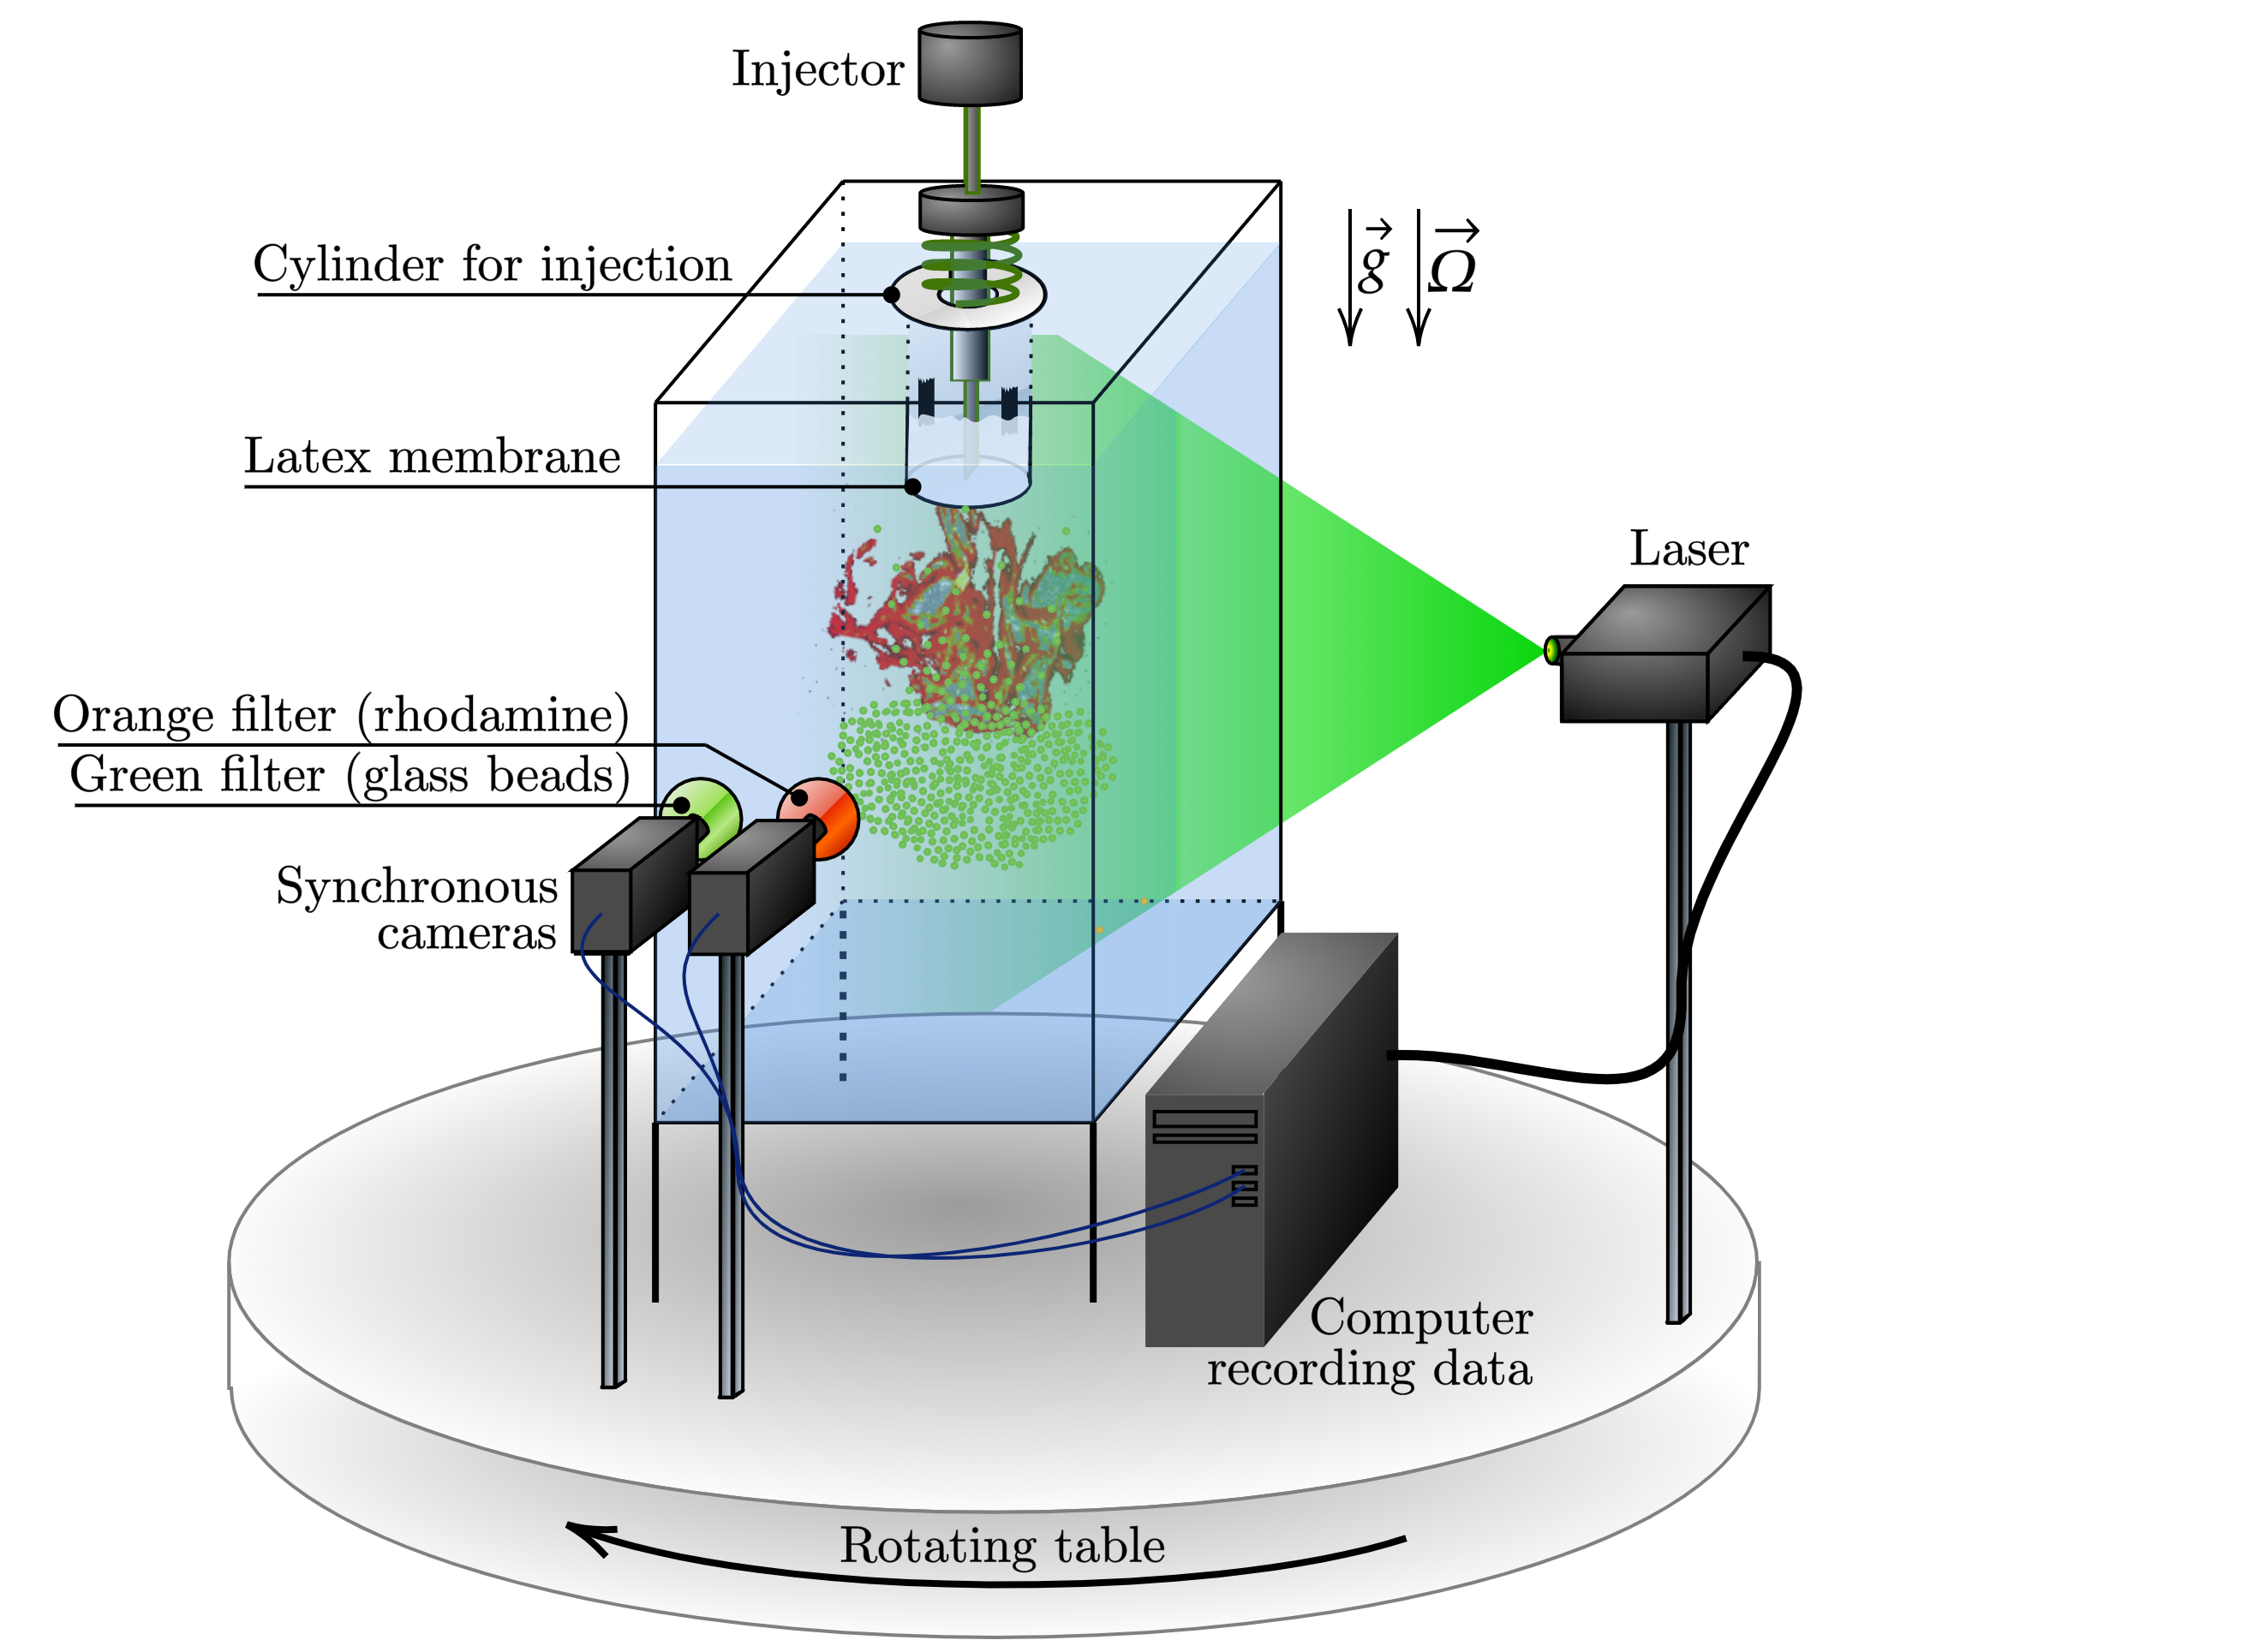

The apparatus is illustrated in figure 1. The experiments are performed in a Plexiglas tank of height cm and cross-section area cm2 containing approximately 160L of fresh water (kg.m-3, m2.s-1). The tank is filled long before the experiments to ensure that water is at room temperature, i.e. 22∘C on average. The tank is fixed in the middle of a rotating table whose angular velocity varies from 0 (no rotation) to 20 rotations per minute (rpm). A lid is placed on top of the tank to limit air motions above the free surface during the experiments. A hole at the centre of the lid enables to insert a cylinder of inner diameter cm to release the buoyant material.
Clouds are either made of salt water, or a mixture of 26.1mL of fresh water and a fixed mass g of spherical glass beads of density kg.m-3 and a mean radius ranging from m to m (see discussion in section II.3). In all cases, the buoyancy introduced into the system is the same. Adding fresh water to particles has two motivations. First, in air, small particles tend to cluster because of electrostatic interactions which are easily removed by placing particles in water with a small amount of soap (typically one drop for 20cl of water). Secondly, if particles fall from air into water, we observe that they entrain some air with them, form clusters, and expell air only gradually as ascending bubbles which are detrimental for the detection of particles and might affect the particle dynamics of interest here. These effects are therefore avoided; the reader is referred to reference [37] for more information about clouds containing such initial clumps of particles. After the cylinder’s bottom nozzle has been sealed by a latex membrane which is stretched and taped onto the cylinder itself, the buoyant material is poured into the cylinder. Water in the cylinder always occupies a volume rising at a height cm above the latex membrane.

Initially there is no relative motion between water and the tank (either water and the tank are motionless, or they are in solid body rotation with the rotating table). At the experiment starts by rupturing the latex membrane with a needle, releasing the content of the cylinder; see figure 2 for an illustration. The 1-mm-thick tip of the needle is sharpened to ensure an efficient and fast rupturing of the latex membrane in less than s according to the videos recorded. Once the membrane retracts, particles are observed to fall out of the cylinder because of their weight. For most particle sizes, the downward acceleration of particles quickly transmits to the fluid, the buoyant material rolls up and the cloud almost immediately becomes turbulent.
Visualisations are performed in a vertical laser sheet with half-angle of divergence , using a Powell lens and a laser of wavelength nm with a power of W or W depending on the series of experiments (Laser Quantum 532nm CW laser 2 W). Since particles and water have different motions, two identical PointGrey cameras are synchronised and record the same experiment with two different filters. The first camera has a green filter (band-pass filter from Edmund Optics, CWL 532nm, FWHM 10nm) to record the motion of glass beads which reflect and refract the laser beam, while the second camera has an orange filter (high-pass filter above 570nm). By colouring the fluid inside the cylinder with rhodamine, the second camera records the motion of the turbulent eddies which appear in orange in the laser sheet because of the fluorescence of rhodamine. In doing so, there is no overlap of information between the two cameras. Both of them save images in a format pixels, corresponding to a field of view whose size is cm in depth and cm in width. Cameras are synchronised, recording images at 50 frames per second (fps). To minimise effects of parallax, they are placed as close as possible to one another, and as far as possible from the laser sheet. A calibration grid was placed in the plane of the laser sheet and photographed by both cameras. This enables to define a coordinate system for each of the two cameras, and to dewarp images so that synchronous photographs can be sumperimposed using Python’s library OpenCV.
II.2 Initial conditions of release
The initial release of particles is notably controlled by the effective density of the fluid within the cylinder, which depends on the volume fraction in particles. Two initial volume fractions can be imposed. Either particles are stirred in the cylinder to form a suspension in water before rupturing the membrane, and in that case the initial release is said to be dilute. Otherwise, particles are left to settle before the experiment so that they form a compact layer at the bottom of the cylinder, directly lying on the latex membrane, and in that case the initial release is said to be compact.
Since larger particles settle faster, only particles with m could be maintained in suspension prior to puncturing the membrane. This is why to compare particle clouds of different particle sizes, experiments have been performed with a compact release for all particle ranges. Then, additionally, experiments have been performed with a dilute release when feasible. The motivation for these dilute releases is twofold: it enables to assess the effect of this initial condition on the cloud development, and it enables to compare the behaviour of particles with respect to salt water clouds, for which salt is always dilute in the whole volume of water within the cylinder.
Then, we want to consider a quasi-instantaneous release of particles, but the smallest ones can take up to 7min to settle over the depth of the cylinder. Hence, the mass excess g needs to be expelled from the cylinder. Yet, we are interested in the flow generated only by the glass beads settling. A compromise consists in immersing the cylinder on the last cm of the cm-high volume of water. Once the membrane is ruptured, the resulting hydrostatic imbalance with the ambient fluid leads to a downward acceleration of the buoyant mixture which is released on a much shorter time scale, at first order independent from the beads’ mean radius and the dilute or compact initial conditions.
In order to assess the robustness of our protocole, let us determine the depth beyond which this initial momentum has a negligible influence on the cloud evolution. When the buoyant material comes out of the cylinder, friction on the inner walls of the cylinder as well as shear on the sides of the buoyant fluid both generate circulation, forcing the buoyant fluid to roll up. The initial acceleration of all the fluid in the cylinder due to the hydrostatic imbalance actually adds some more circulation, which levels the difference between compact and dilute releases: in fact, we observe that for both dilute and compact releases in the range m, all clouds initially roll up and end up approximately spherical with typical size at a depth of order 1-2. For a buoyant cloud with initial momentum, the Morton length [38, 22] quantifies the distance beyond which the cloud buoyancy predominates over the initial momentum. For our experiments, the Morton length can be expressed [see equation (A.15) in [39]]
| (1) |
with m.s-2. The initial cloud density relevant for its dynamics is computed once the cloud has rolled up as a sphere of radius hence . Then, the typical cloud velocity is prescribed by the cloud size and reduced gravity as
| (2) |
which is the same for all experiments. We find that . Hence, after the cloud has rolled up and travelled a distance , corresponding to a total distance of order 2-3, the influence of the initial momentum can be neglected.
II.3 Particle distributions
Particles are provided by Sigmund Lindner (SiLibeads) in sets of polydisperse distributions. For every set of particles, a Gaussian is fitted on the histogram of the distribution of particles’ radii. This provides the average radius of the set of particles, as well as the standard deviation with respect to . The ratio is a measure of the polydispersity of a given set of particles. The average radius and the ratio are listed in table 1 for polydisperse, monodisperse and bidisperse particle sets.
Monodisperse sets are obtained due to sieves, each of them corresponding to a given size which truncates the Gaussian. The distribution obtained is integrated to compute the resulting mean radius. The characteristic deviation is computed simply as the difference in radius between and the cutoff value of the sieve.
Bidisperse sets are obtained by mixing together a percentage of the total mass g from the monodisperse set m, and a percentage of from the monodisperse set m. The characteristic deviation is computed as the difference between the resulting average radius , and the average radius of the monodisperse set whose percentage ( or ) is the largest.
| Range of diameters (m) | Symbol | (m) | () | ||||||||
| Polydisp. | 0-20 | 2.6 | 6.00 | 1.16 | 5.43 | 1.0 | 0.813 | ||||
| 40-70 | or | 29.9 | 0.167 | 3.57 | 0.35 | 9.34 | |||||
| 90-150 | 64.4 | 0.308 | 1.47 | 3.58 | 0.3 | 20.1 | |||||
| 150-250 | 108.1 | 0.696 | 5.57 | 0.23 | 33.8 | ||||||
| 250-500 | 192.4 | 1.48 | 21.1 | 0.22 | 60.1 | ||||||
| 500-750 | 339.8 | 2.73 | 68.8 | 0.24 | 106 | ||||||
| 750-1000 | 465.9 | 3.70 | 128 | 944 | 0.18 | 146 | |||||
| Monodisp. | 90-100 | 45.7 | 0.168 | 0.567 | 1.00 | 0.029 | 14.3 | ||||
| 140-150 | 76.1 | 0.406 | 2.29 | 0.029 | 23.8 | ||||||
| 224-250 | 120.8 | 0.814 | 7.28 | 0.07 | 37.8 | ||||||
| 1000 | 524.5 | 4.13 | 160 | 662 | 0.093 | 164 | |||||
| Bidisp. | 51.8 | 0.210 | 0.805 | 0.118 | 16.2 | ||||||
| 57.8 | 0.255 | 1.09 | 0.211 | 18.1 | |||||||
| 63.9 | 0.304 | 1.44 | 0.191 | 20.0 | |||||||
| 70.0 | 0.354 | 1.84 | 0.087 | 21.9 |
II.4 Dimensionless numbers
In the present study, particles are considered to interact only through hydrodynamic interactions. This assumption is based on three arguments: particles of size m are non-Brownian at temperatures around 290-300K [1]; soap was used during experiments to avoid physico-chemical interactions; finally, collisions are expected to play little part in the cloud dynamics except during the phase of acceleration when particles are released from a compact layer in the cylinder. Hence, particles interact by inducing a velocity perturbation on other particles with a magnitude decreasing with distance, or by wake interactions.
Thus, the following dimensional quantities describe the dynamics of the clouds and the particles they are laden with: gravity , the fluid density and kinematic viscosity , the particles’ density , the total mass of particles , the average radius of particles , the standard deviation of the supposedly Gaussian distribution of particles’ radii, and finally the diameter of the cylinder . The tank angular velocity is not included yet; effects of rotation are discussed in section IV. The tank dimensions are not considered, assuming they are large enough not to influence the dynamics.
These parameters enable us to define the terminal settling velocity of a single particle for the two following end members. Very small particles have a negligible particulate Reynolds number and therefore move in a Stokes flow. Assuming sphericity, the balance between their buoyancy and the linear Stokes drag leads to defining
| (3) |
As for large particles characterised by a large particle Reynolds number , the balance between their buoyancy and a quadratic drag law leads to
| (4) |
with the drag coefficient, approximately constant and equal to 0.445 for a sphere in the range (see [40]). Several empirical expressions exist in the literature to capture the smooth transition from regime (3) to regime (4) when increases. For particulate Reynolds numbers lower than 800 as is the case here, a classical equation is provided by the Schiller-Naumann correction to the Stokes velocity [40]:
| (5) |
Finally, the eight quantities listed above involve three dimensions, thus according to the Vaschy-Buckingham theorem, five dimensionless numbers are defined as listed below:
| (6) |
The ratio quantifies the dispersity of particle distributions. The total number of particles plays an important part in the particles’ interactions, and governs the initial fall. The ratio is typically adequate to characterise the influence of the velocity perturbations induced by a single particle at initial times when the cloud size is of order [41, 42]. The particulate Reynolds number compares advection and molecular diffusion in the flow produced around a particle as it settles. Finally, particles and water have different motions since particles have inertia, as quantified by their Rouse number which compares the inertia of a particle (through its terminal velocity ) and that of the cloud which sustains that particle. Since the reference fluid velocity is the same for all experiments (equation (2)), in this study the Rouse number varies only with the particles’ radius: the larger the particle, the larger its inertia, the larger the Rouse number. Dimensionless numbers for each set of beads are listed in table 1, and appendix A additionally provides a complete list of the experiments performed.
III Particle clouds in a still environment
III.1 The turbulent thermal as a one-phase reference
In this section, we focus on the release of salt water clouds in fresh water, and interpret our results in the framework of Morton et al. [21] (the paper hereafter abbreviated as MTT56), whose equations have proved applicable in a multitude of contexts (see section I), highlighting the role of attractor of the model of turbulent thermal. We then use this purely fluid case to highlight and understand any specificity due to the particulate nature of the turbulence forcing in the next sections.

The robustness of MTT56 comes from its integral description of the main physics of the thermal as well as the small number of hypotheses required. The shape of the thermal is expected to play little part on its dynamics, and it is approximated by a sphere of radius and uniform density so that describing the thermal evolution only requires three variables: , , and the vertical velocity whose integration leads to the thermal position in depth . Knowing the thermal velocity, these quantities can alternatively be computed as functions of : , , .
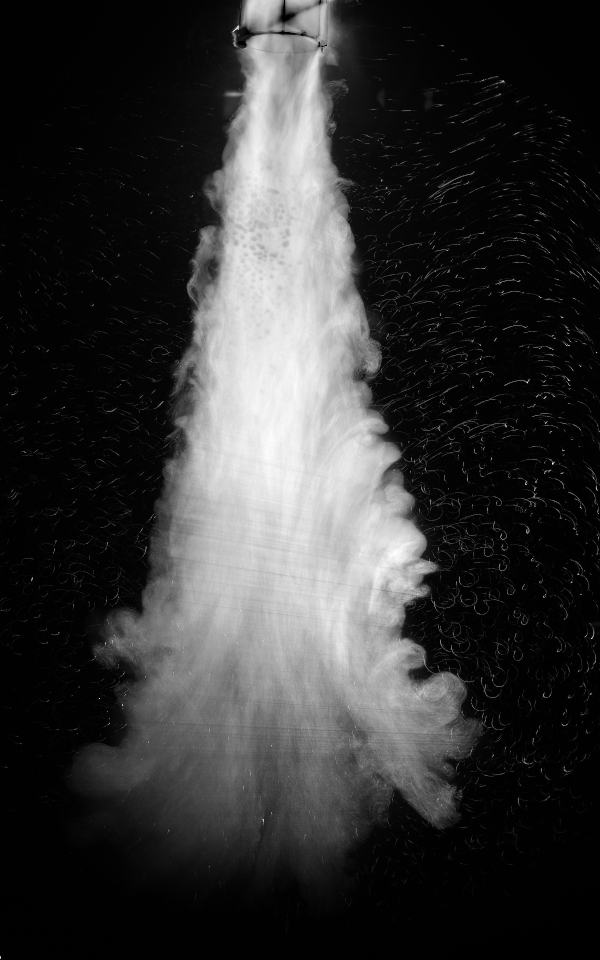
Figure 3 shows the evolution of a salt-water thermal of excess mass g released in the same condition as any particle cloud. We observe that the turbulent cloud radius grows linearly with depth. This is captured by MTT56 through the entrainment hypothesis. The turbulence developing inside the cloud is considered responsible for a uniform inflow of ambient fluid into the spherical thermal – a process called entrainment – with a characteristic inflow velocity . The entrainment hypothesis states that this velocity is proportional to the sole characteristic velocity scale of the system, the thermal vertical velocity , so that the entrainment velocity reads
| (7) |
with a positive constant called the coefficient of entrainment. From this model, the mass of the thermal increases in time due to the uniform entrainment of ambient fluid over the thermal’s surface. Neglecting any detrainment, i.e. any outflow of buoyant material which would be lost in the wake (or stem) behind the thermal, the mass anomaly remains constant within the cloud. Finally the evolution of the cloud’s momentum is mainly driven by the constant buoyancy force , and mitigated by a quadratic drag term. The resulting equations of evolution are
| (8a) | |||||
| (8b) | |||||
| (8c) |
with a drag coefficient. Combining the equations of conservation of mass (8a) and mass excess (8b) immediately yields which shows that directly quantifies the constant growth rate of the thermal in depth with . Figure 3 confirms the linear growth of the turbulent thermal in depth with snapshots [figure 3(a)] and with the pixel-by-pixel standard deviation of light intensity captured by the camera over 8.0s of the cloud fall [figure 3(b)]. Knowing the couple at a given depth enables to compute at any depth from the sole knowledge of and conservation of . Finally, integration of the whole model shows that the cloud decelerates as it entrains ambient fluid. With no specific assumption on , self-similar solutions can be found at large times, which scale like (see [43])
| (9a) | |||||
| (9b) |
In the present context, particle clouds follow this regime only after an initial phase of acceleration and beyond the Morton length [equation (1)].
III.2 Thermal regime: specificities of particle-induced entrainment

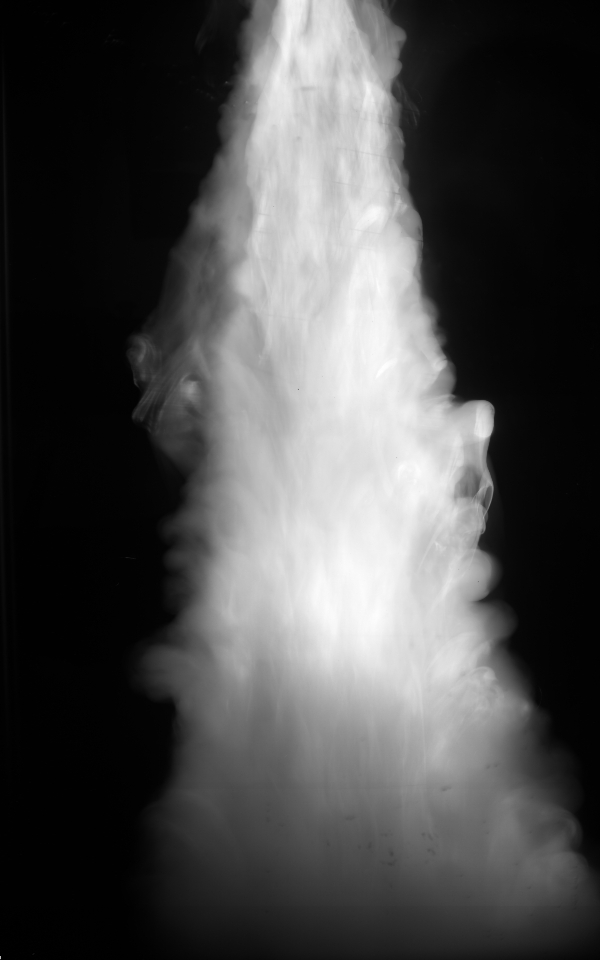

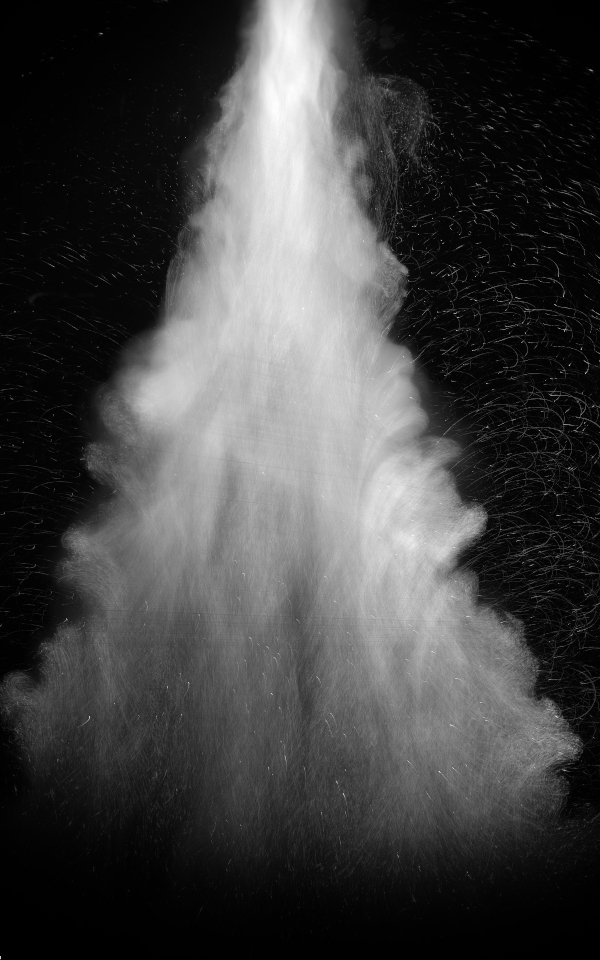

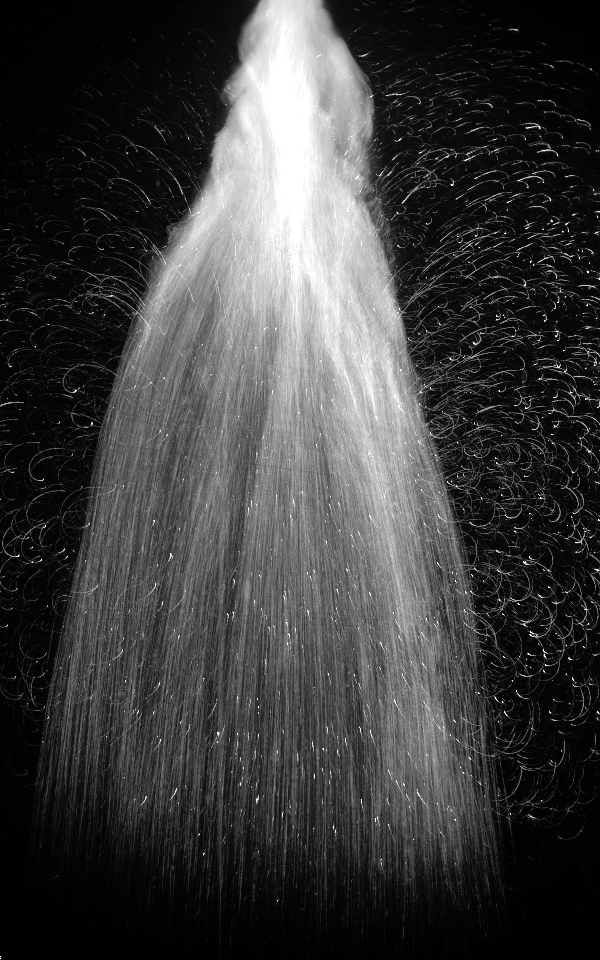

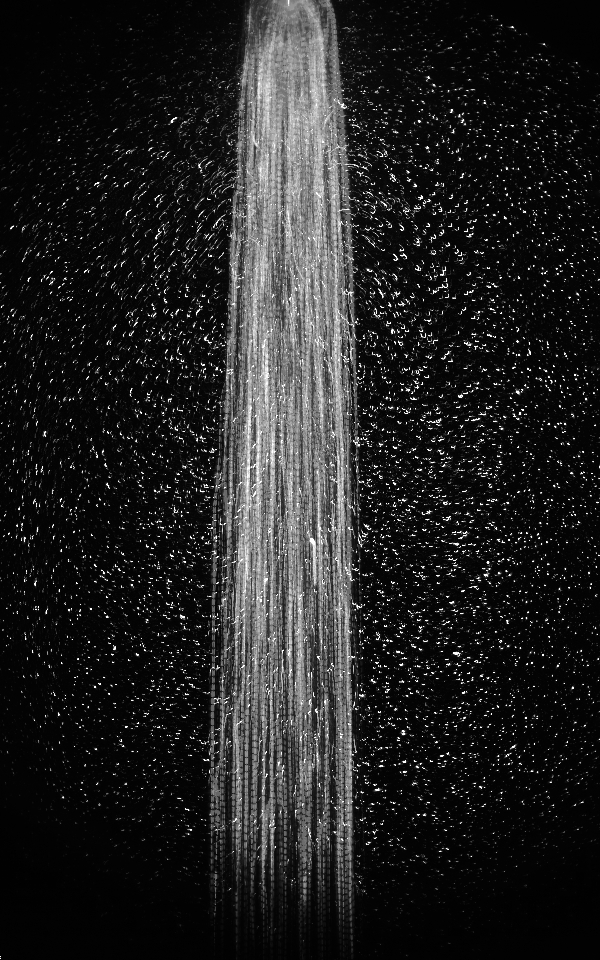
The broad behaviour of particle clouds is now compared to the reference one-phase turbulent thermals. Figure 4 presents snapshots of particle clouds for four different Rouse numbers. At low Rouse numbers, clouds clearly appear to decelerate and linearly grow in depth, in much the same way as salt-water thermals. Yet, for large Rouse numbers, defining a coefficient of entrainment due to the cloud growth hardly seems feasible since the particle cloud spreads little during its fall. This observation is confirmed by the pixel-by-pixel standard deviation of light intensity computed over the fall of a cloud of Rouse number (see figure 4(h)), as opposed to similar visualisations for (see figure 4(b)). Note as well that for , particles are observed to mostly fall vertically without swirling in eddies, as visible due to the particle trajectories in figure 4(h).
These last observations emphasise a transition in the cloud dynamics which is due to a separation between particles and turbulent eddies, hereafter simply referred to as separation, which interrupts the turbulence forcing. This transition is confirmed by analysing the kinematics of the cloud front whose depth is denoted (measuring techniques are described in Appendix C). To do so, for a given Rouse number, the curves from different realisations of the same experiment are averaged. Then, the resulting curve is filtered with a moving average to reduce noise, and the velocity is computed. Finally, two laws can be fitted on : either we fit for the thermal regime where and are arbitrary constants, or we fit an affine law on which is adequate after separation has happened. Figure 5 shows that after an initial duration of acceleration of the cloud front up to 2.5s, the latter decelerates in the thermal regime (see red dashed curves in the range 2.5s-5.2s). This highlights the relevance of the analogy between particle clouds and turbulent thermals described by MTT56, as previously verified in the literature (e.g., [25, 26, 39]). However, after some time, the cloud front velocity becomes constant; see blue dashed curves in figure 5 after 5.2s. This transition is due to separation, which is further discussed in section III.3. We now exclusively focus on the cloud evolution before separation.

As mentioned in section III.1, one of the main features of turbulent thermals is their ability to efficiently entrain surrounding fluid. According to the literature, thermals typically entrain with an average entrainment coefficient [39, 23], whose variability is due to the sensitivity of turbulence to initial conditions, and also to the dependence of on the experimental configuration. The coefficient of entrainment of all clouds is measured following the procedure described in Appendix D.1. Figure 6 shows the entrainment capacity of particle clouds for all Rouse numbers, with respect to the reference of salty thermals whose measured entrainment coefficient is in our case , which lies in the usual range. Note the drastic decrease of the entrainment coefficient for Rouse numbers above 0.3. This drop is directly due to particles of large Rouse number quickly separating from turbulent eddies, resulting in a short-lived turbulence forcing and therefore a low entrainment rate (see section III.3). Most importantly for the rest of this study, two regions are distinguished: clouds in the range go through the self-similar thermal regime, unlike those in the range (see the gray shaded area in figure 6) in which case is still measured but does not have the same meaning (see Appendix D.1).
Then, considering clouds in the range , two main observations can be made. The first observation is that, in the thermal regime, particle clouds entrain more than salt water clouds using the same experimental apparatus, and for the same mass excess. The second observation is that this enhanced entrainment capacity operates most efficiently in a range of Rouse numbers centered on , since when the Rouse number vanishes to zero, and when the Rouse number largely exceeds 0.3.

This enhanced entrainment of particle-laden thermals compared to salt-water thermals is now interpreted in the light of past results on inertial particles. Particles of very large hardly respond to modifications of the flow around them because of their large inertia [9], hence they tend to settle vertically, whatever the flow direction around them. On the opposite, particles of vanishingly small act as passive tracers in the fluid – salt water corresponding to the asymptotic case . In the intermediate range where we observe that , particles of finite inertia follow the fluid, yet they also gravitationally slip with respect to the fluid in their vicinity [44]. This gravitational slip is typically modelled by a vertical terminal velocity which adds up to the local fluid velocity for particles of low inertia [7, 45]. Consequently, through drag, such particles can accelerate the fluid and modify its streamlines so that the fluid follows the particles due to two-way coupling [7, 13]. A single particle may be too small to efficiently modify the flow around it, however the more concentrated the particles, the more efficient their forcing [7, 13, 45].
In our experiments two effects are observed which modify the concentration of particles inside the clouds. First, particles preferentially concentrate on the edges of eddies because their density is larger than that of the ambient. This effect of preferential concentration or inertial clustering is notably due to pressure effects centrifuging dense particles outside of eddies (see [2] for further details). It can be derived from theory (see [7, 29]) and has been evidenced in numerous experimental [8] and numerical [45, 9] past studies. Second, particles preferentially settle on the side of eddies that moves with a downward velocity (parallel to ). This effect of fast-tracking or preferential sweeping has been evidenced in numerical simulations [11, 46], experiments [8], and recently atmospheric flows [47].
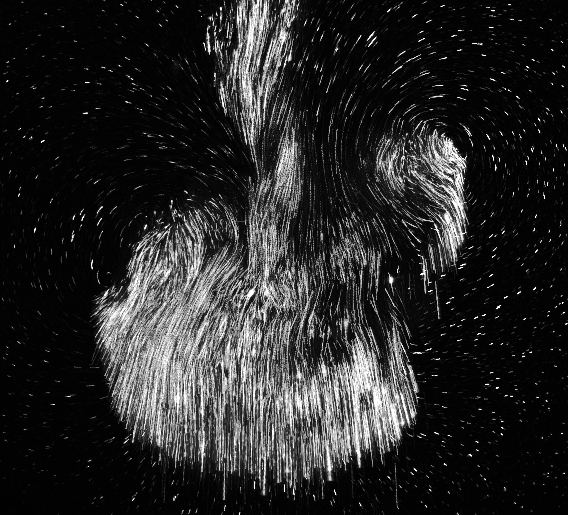


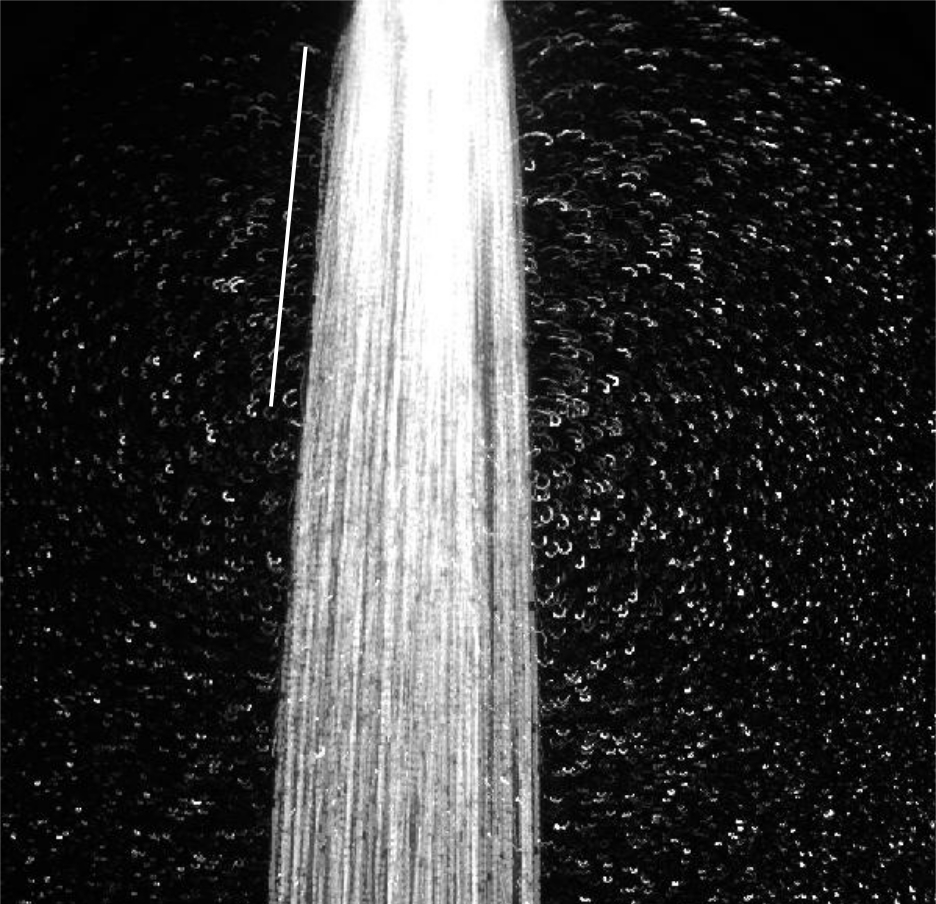
The combination of both phenomena is shown in figure 7(a). In this snapshot, the particle cloud has led to the formation of a vortex ring, whose cross-section evidences two vortical structures, centered on the toroidal vortex core. Many particles settle on the edges of these two vortices, and particles almost exclusively sweep on the downgoing side. Together, preferential concentration and preferential sweeping lead particles to fall on the inner sides of these eddies without rolling upwards with the fluid on the other side. Hence, the work of the buoyancy force exerted on particles is always positive, and no turbulent kinetic energy needs to be converted into potential energy to lift particles on the outer ascending side of those eddies. This enhances the efficiency of the particulate forcing and consequently the entrainment rate of particle clouds compared to salt-water thermals. Additionally, both phenomena increase the local effective density of the fluid on the downgoing side of eddies where eddies are being forced by particles, and they also enhance the gravitational slip of particle clusters with respect to the fluid; see in particular [8]. This enhances the capacity of concentrated particles to impose their own trajectory to the fluid and force the turbulent flow through two-way coupling, as we initially observe during the cloud acceleration for all . All in all, figure 7(c) illustrates the ability of particles to modify the flow and force a new eddy through two-way coupling. On the first photograph particles aim at separating from a vortex, yet one observes the formation of an additional eddy on the following frames. This is likely due to the large concentration and fast downward velocity of the particles sweeping along the former vortex. This enhances entrainment and makes it longer-lasting.
Our observations of the enhancement of entrainment by particles contrast with the study of McConnochie et al. [29] who studied particle-laden turbulent plumes whose buoyancy was due to two agents: particles as well as a difference in salinity. They observed that particles modify the entrainment coefficient only when they settle in the direction opposite to the plume fluid buoyancy flux. This modification was interpreted as being due to particle clusters crossing the plume interface and interacting with it, which requires particles to settle opposing the fluid buoyancy flux. The fact that, in the present study, particles modify the entrainment coefficient as they fall down with the turbulent thermal, might be due to the very distinct nature of a plume and a thermal: once the former reaches a steady state, particles evolve in a pre-established stream, while the particles of a thermal evolve in a fundamentally unsteady flow which develops because of their forcing. This distinction between plumes and thermals in the context of particle-laden flows remains to be fully explored.
III.3 Separation
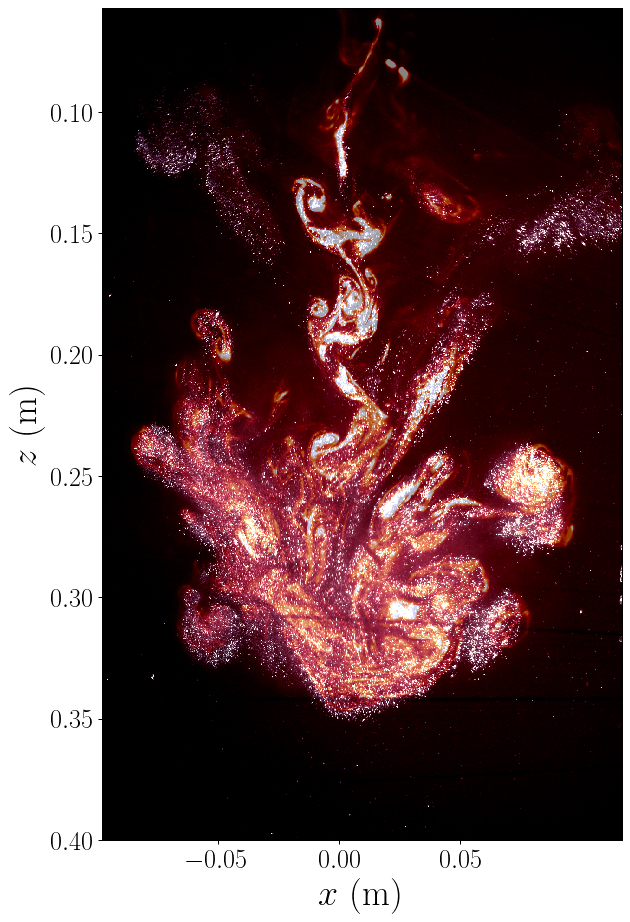
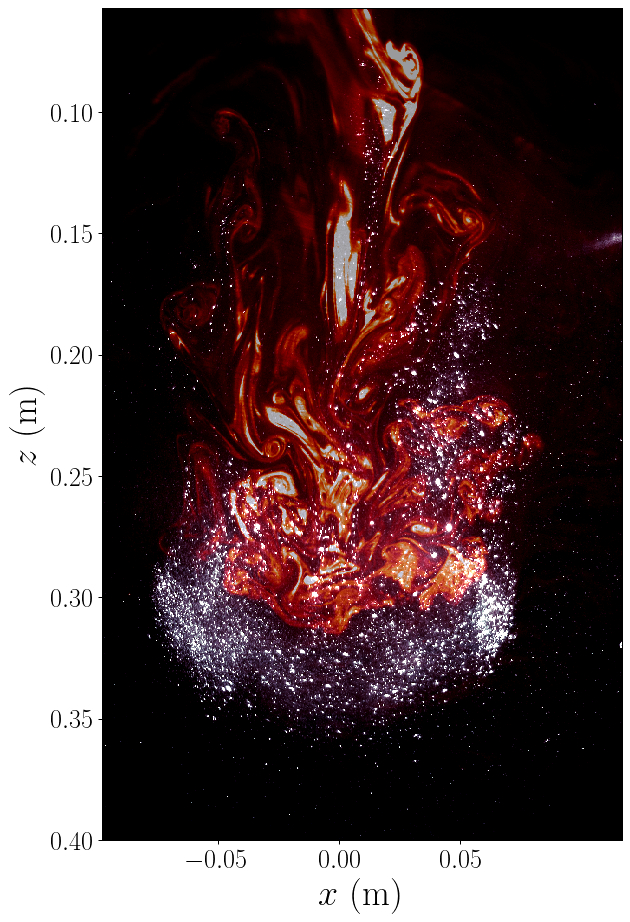
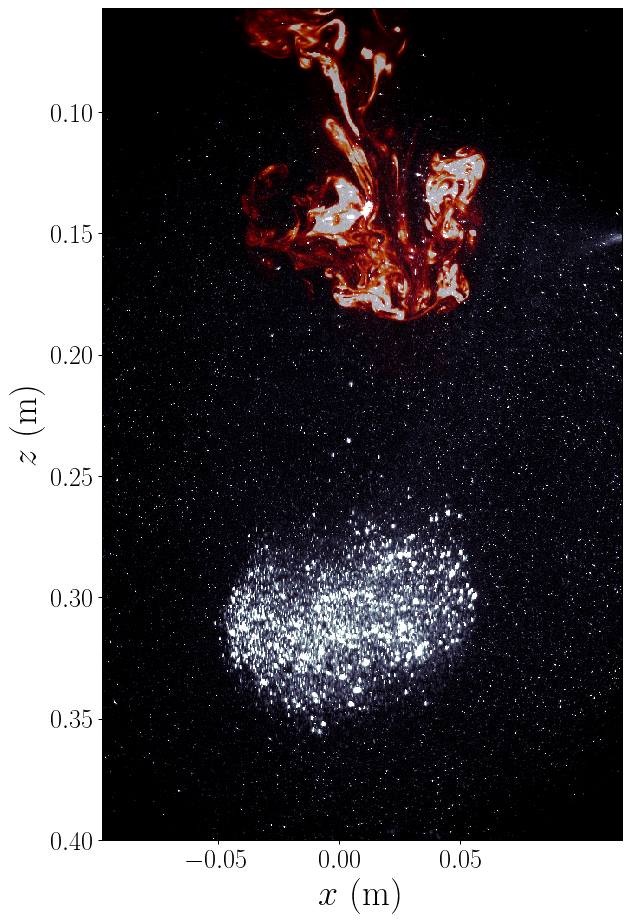
To visualise separation, rhodamine was added to water in the cylinder of injection for a few experiments, and snapshots can be visualised in figure 8. For no separation is visible between particles (in gray/white) and rhodamine (in orange) over the depth of our set-up. On the opposite for large particles of Rouse number , separation quickly takes place even above , and the rapid increase of the distance between rhodamine and particles emphasizes this process. Separation is a gradual phenomenon though, as evidenced by particles of intermediate Rouse number which are still separating in the snapshot in figure 8(b). This process can be understood by the fact that when the thermal velocity becomes lower than the particles’ settling velocity , the rms velocity in the cloud (which scales like ) becomes unable to sustain particles in eddies (e.g., [25, 26]). Hence they separate at a depth which is defined by . From this definition of separation, and from the self-similar behaviour of MTT56 [equation (9b)], the distance of separation is expected to scale like , and we now attempt to verify this scaling experimentally.
Appendix D.2 presents the protocol to measure the depth of separation between turbulent eddies and particles. Essentially, when particles separate from eddies, the patterns made by their trajectories transition from curved and randomly oriented (due to particles whirling inside eddies) to mostly straight and vertical; this enables to measure . Figure 9 shows the depth of separation as measured in experiments, and the associated forced-fit curve following a law . The curve confirms the decrease of with a larger particle size under the trend provided by MTT56 in the thermal regime, which is also consistent with previous results in the literature (see the scaling laws in reference [48]).

As soon as separation starts, the turbulent thermal has a decreasing mass excess which eventually vanishes to zero. After that, particles fall in a quiescent fluid. Hence, particle clouds can rigorously be considered as turbulent thermals only as long as particles have not separated yet. This has led previous authors [25, 26, 28] to distinguish mainly three regimes in the cloud’s evolution: (i) the acceleration regime, (ii) the self-similar turbulent thermal regime of MTT56, and (iii) the swarm regime in which particles settle (mostly) vertically in a quiescent fluid, while the turbulent eddies are left behind particles and viscously decay. This latter regime is analysed in section III.4. For now, we focus on the formation of the swarm during separation.
All swarms change morphology during their fall. The swarms which originate from a turbulent thermal are shaped both by particles and by turbulent eddies over the course of separation. This results in a variety of possible swarm morphologies. Monodisperse (figure 10(a)) and polydisperse (figure 10(b)) swarms are illustrated in figure 10. We observe that monodisperse clouds produce thin swarms which are concentrated in particles and therefore very bright on the camera. Conversely, polydisperse clouds produce swarms of larger height , which keeps increasing in time because of the difference in settling velocities between the smallest and largest particles. Consequently, the brightness of these polydisperse swarms decreases in time (compare the brightness of the three snapshots in figure 10(b)). Finally bidisperse swarms evidence a gradual splitting between two particle fronts (not shown here), due to the bimodal distribution of particle sizes.
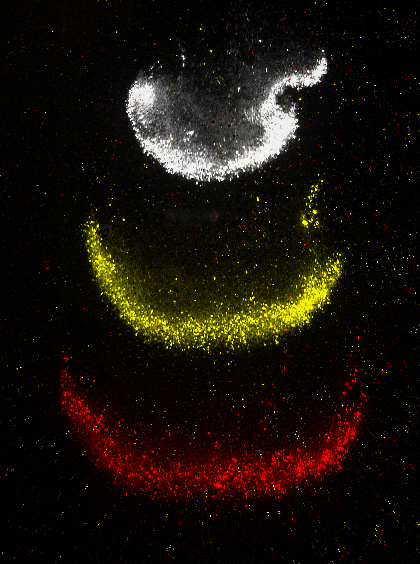
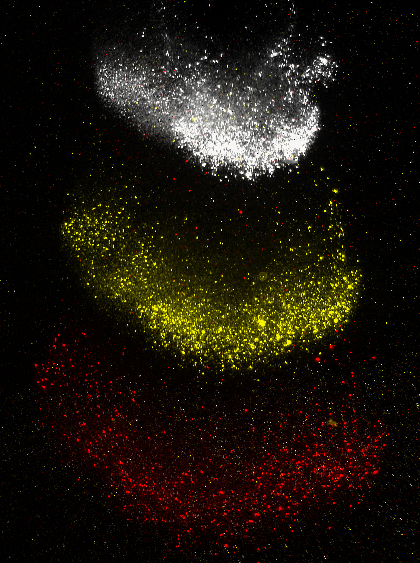
The role of turbulent eddies in shaping the swarm during separation can be visualised in the Supplemental Material [Still-ambient-particles-and-rhodamine.avi (see the case ) and Rouse0p406_STD_0RPM.avi]. Particles initially swirl within the turbulent thermal, until separation starts, as can be assessed from the vertical motion of particles at the cloud front. Then, two regions can be distinguished. On one hand, particles ahead of eddies have separated and fall vertically at a constant velocity which is the (front) velocity of the swarm (hence the subscript s), of order . On the other hand, particles in the eddies keep swirling and fall faster than , say at a velocity
| (10) |
with the velocity excess. The width of the swarm is equal to that of the turbulent region which feeds it with particles. During separation the turbulent cloud keeps growing so that particles are gradually shed outwards in the swarm (see figures 10(a)-10(b)).
From these observations, we can propose a model of swarm formation in the framework of MTT56. The description hereafter is for a cloud transitioning from thermal to swarm regime (), but it is also valid for a cloud which directly accelerates to the swarm regime () if one cancels the velocity of eddies in equations (11) and (12). New notations are introduced to rigorously distinguish the behaviours of eddies, particles within eddies, and particles which have separated from eddies.
During separation, consider that turbulent eddies fall with velocity (see the left column in figure 11) and, for simplicity, assume that they remain in the same self-similar regime despite the loss of particles. This notably implies that remains constant during separation. Then, the radii of both the patch of turbulent eddies and the nascent swarm increase at a rate
| (11) |
All particle sets are polydisperse to some extent. Hence, consider a cloud of minimum (respectively maximum) Rouse number (respectively ). The difference between the maximum and minimum settling velocities reads . Since the depth of separation decreases with , the cloud’s largest particles separate first, with a velocity in the reference frame of the laboratory (see the left column in figure 11). Meanwhile, smaller particles keep falling through turbulent eddies. Assuming that the drag and buoyancy of these smaller particles are balanced, their upper rear front falls with velocity in the reference frame of eddies (right column in figure 11). Since eddies fall at velocity with respect to the laboratory, it means that the smaller particles fall at velocity in the reference frame of the laboratory. Hence, the vertical extent of the particle cloud detected by the cloud-tracking algorithm varies with a rate
| (12) |
Let us finally turn to the transfer of particles from eddies to the swarm. We just concluded that in the reference frame of the laboratory, the velocity of the smallest particles inside the turbulent eddies is . For the sake of simplicity, we adopt the definition . Since the largest particles separate first, we expect the swarm front to fall with a velocity . Combining these expressions of and with equation (10), we find . Consequently the volume flux of particles shed in the emerging swarm is
| (13) |
In equation (13), is the supposedly uniform particle volume fraction within turbulent eddies, with the total number of particles in the cloud, their radius and the radius of the supposedly spherical cloud in the framework of MTT56. The whole process of swarm formation is sketched in figure 11.

The expressions of , and are controlled by the velocity of eddies which cannot instantaneously vanish as soon as particles reach the depth . Neglecting polydispersity for now (), the fact that eddies keep falling explains why the particle cloud is necessarily contracted () and thus particles are compacted () from the thermal to the swarm: this explains why monodisperse swarms have a large aspect ratio even though they originate from an approximately spherical cloud. During separation, eddies keep widening () so that particles are gradually shed outward and behind former particles. As a result the swarm takes a bowl shape (see figure 10, and reference [48] for a clear numerical illustration). However, polydispersity acts against the cloud contraction, and therefore against the compaction of particles. Once separation is over, in the swarm regime the volume flux loses meaning, the cloud keeps a constant lateral extension (), and it grows vertically at a constant rate exclusively governed by polydispersity (see below, section III.4).
This simple description captures the evolution of large polydisperse clouds whose particles do seem to keep the entrainment active during separation; see the Supplemental Material Still-ambient-particles-and-rhodamine.avi for . It also captures the evolution of particle clouds which never go through the thermal regime for (see discussion in section III.4). To sum up, the larger , the lower the depth of separation, hence the thermal at the start of contraction so the more efficient contraction; a lower depth of separation also implies that the thermal has a smaller size, and so does the swarm. Polydispersity, however, acts to increase the swarm height, hence monodisperse swarms are the thinnest (see figure 10).
Note that the role of in shaping clouds is not straightforward: the dependency of and with is not explicit in equations (12)-(13). One can easily show that is independent of for a spherical cloud of constant , and the velocity difference is not a function of the mean settling velocity . The role of is only implicit in the velocity of eddies : since during separation the eddies are expected to fall at velocity , at first order we have during separation. Consequently, for a given velocity difference , a cloud of larger particles experiences a larger during separation and compacts more than a cloud of smaller particles (see the expression of in equation (13)). This trend is consistent with the observation of our clouds in experiments.
III.4 Swarm regime
Swarms are produced in different ways depending on the size of particles. Particles in the range initially accelerate, then transition to the thermal regime and finally separate as a swarm. On the opposite, particles in the range directly transition from their initial acceleration to the swarm regime, which is characterised by a constant fall velocity. This distinction introduced in figure 6 is confirmed in figure 12(a), which complements the previous figure 5 with the kinematics of a cloud directly accelerating to the swarm regime; see blue dashed curves for .


Recall that particles are expected to separate from eddies at their terminal velocity so that the constant swarm velocity should be of order . Particles having separate too deep in the tank for the swarm regime to be analysed. For other clouds, the constant velocity is measured and visible in figure 12(b) in dark symbols. Up to a constant offset of order , measurements prove to be reasonably close to the reference value in dark solid line, all the more as is larger. The fact that swarms of smaller particles fall faster than is interpreted as a consequence of the capacity of numerous smaller particles to drag fluid downward with them through their hydrodynamical interactions by displacing fluid [49, 42], whereas fewer larger particles behave individually and modify only the flow close to themselves in a small wake [41].
The maximum cloud front velocity measured during every experiment is also computed and shown with red symbols in figure 12(b). As increases, the velocities and get closer. This is due to the reduced duration of the thermal regime, which is ultimately shut off, leading clouds of large Rouse number to directly accelerate to reach their maximum velocity as a single particle would, hence .
IV Particle clouds in a rotating environment
IV.1 Formation of a columnar flow

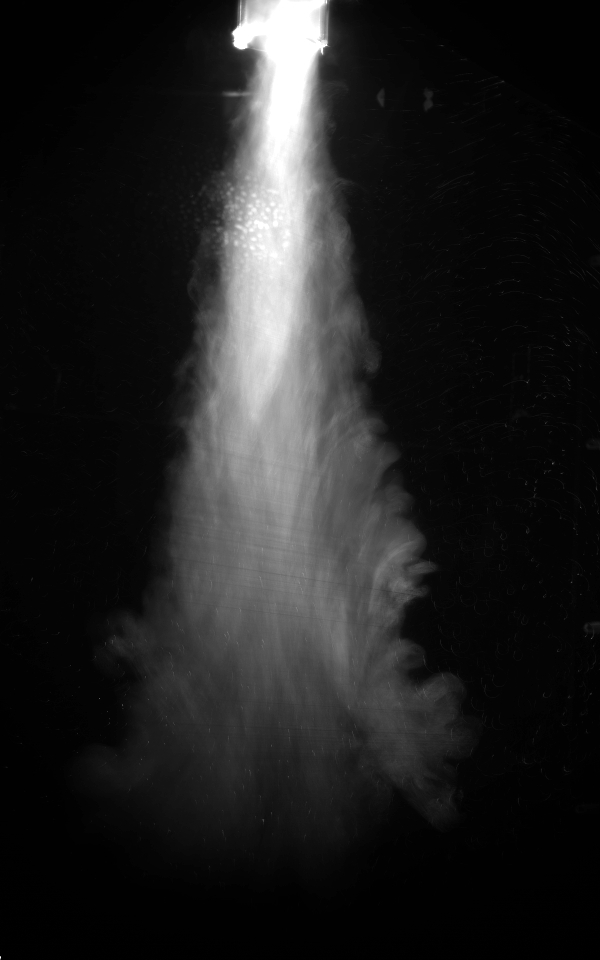

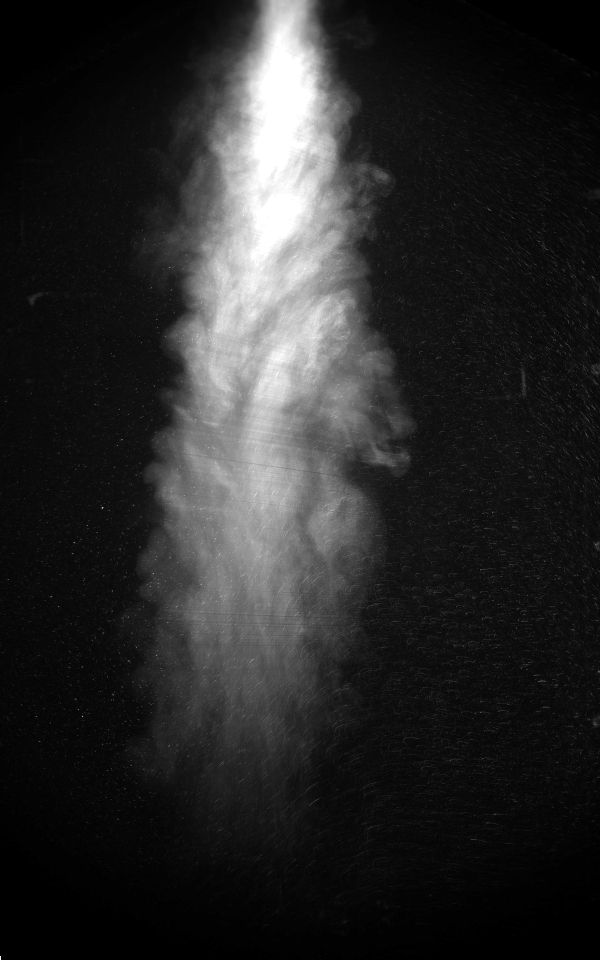

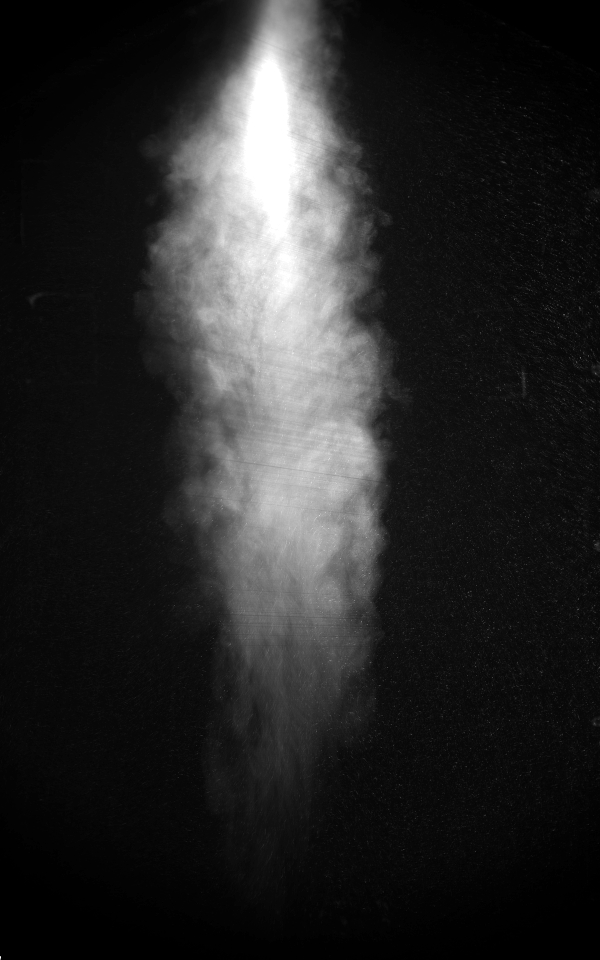

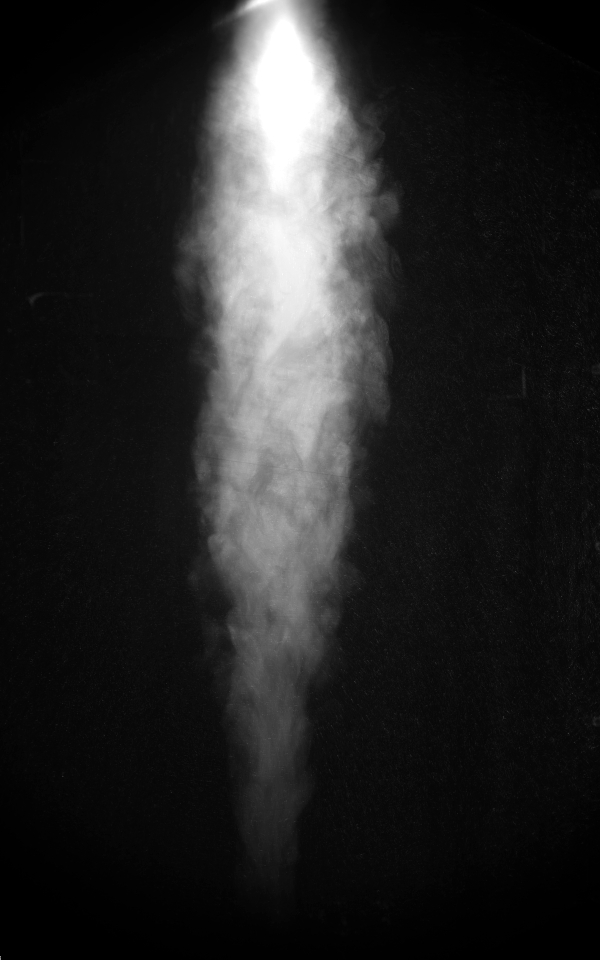
From the previous section, we can expect – as the following section will confirm – that clouds containing particles of vanishingly small Rouse number behave similarly as salt-water clouds, and the larger the larger the discrepancy between their behaviours. Therefore, we start by analysing the influence of rotation on salt-water clouds.
In figure 13, the most striking observation is that rotation interrupts entrainment at some depth , marking a transition from a regime of expanding cloud to a vortical columnar flow of constant radial extension for (see white arrows in figures 13(c) and 13(e); the transition is also visible in a video in the Supplemental Material [SaltWater_10RPM.avi]. Initially the cloud inertia is large, hence as long as the cloud is expanding, one may neglect the influence of rotation and consider that the cloud follows the model of MTT56: the cloud grows and decelerates due to the entrainment of ambient fluid, gradually reducing the cloud inertia. Simultaneously, entrainment enables the ambient fluid in solid body rotation to gradually penetrate through the turbulent thermal and increase its total kinetic momentum. The transition is expected to happen when the Coriolis force predominates over the cloud inertia [35, 36, 30]. This can be quantified with a Rossby number based on the inflow of ambient fluid at the thermal interface. There, the entrained fluid is subject to the Coriolis force with the entrainment velocity (equation (7)), and its inertia reads , leading to
| (14) |
The front velocity is used rather than because the front is easily traceable from videos, and more meaningful due to a modification of the residence time of particles when , as discussed in section IV.4.

The transition is expected when the Rossby number is of order unity. For simplicity and up to a constant factor, we will consider as the condition of transition to a vortical columnar flow. To test this condition, we compute the transitional Rossby number from the automatic cloud-tracking algorithm of Appendix C. The depth of transition is defined due a change in the clouds’ kinematics, from an initial phase of deceleration when to a phase of constant velocity when (see section IV.4). Then, measurements of the Rossby number are approximately constant for , hence the values of this Rossby number are averaged for where noise is low enough. Results are shown in figure 14 in ordinate, as a function of . For any given , measurements confirm that within the uncertainty margin of experiments in the range . Therefore, in a rotating environment, this range of Rouse numbers corresponds to clouds whose particles fall in a vortical columnar flow below .
Before transition so inertia predominates over the Coriolis force, and if one neglects rotation, clouds are expected to behave as turbulent thermals. According to this simple picture, which is rigorously applicable when , the condition yields . Although we lack additional values of to quantitatively confirm this scaling, it is compatible with our present measurements made for three different values of , and was already verified in past experiments with one-phase thermals (see references [35, 36]). Thus, the faster the spinning, the lower the depth of transition, as observed in figure 13.
In figure 14, in the range the transitional Rossby number is larger than unity. This is because such clouds are columnar not due to rotation, but because particles behave as swarms. Hence particles fall with a constant velocity of order and clouds hardly grow so their diameter is approximately equal to . Consequently , as confirmed by the inset of figure 14.
IV.2 Thermal regime with background rotation: entrainment levelling
Let us focus on the evolution of clouds before the transition to a vortical columnar flow. As long as and after a phase of acceleration, the cloud is considered to evolve as a turbulent thermal which entrains ambient fluid and grows linearly in depth. The entrainment capacity of all particle clouds is compared to the reference of salt water thermals in figure 15. This entrainment capacity is not presented for because at such rotation rate, the depth of transition is too low for the entrainment rate to be measurable above .
At both (figure 15(a)) and (figure 15(b)), the entrainment coefficient suddenly drops for as previously seen for . This is again due to particles decoupling from the fluid due to their inertia. Most interestingly, in the range figures 15(a) and 15(b) show that hardly has any influence on , and the entrainment capacity is levelled to a value close to . This contrasts with observations at in figure 6. In other words, because of rotation, particulate effects appear to be inoperative, hence particle clouds entrain approximately as much as their salt-water counterparts, as evidenced by the overlap of most data points with the errorbar of in red hatchings.


It may come as a surprise that rotation suppresses any local maximum value of in the range even though i.e. inertia predominates over the Coriolis force. In a still environment, we observe an enhancement of the entrainment rate for where particles concentrate, especially in the peripheral eddies of the particle cloud (see figure 7). At the particles’ scale, the Coriolis force has a negligible dynamical influence (it is three to four orders of magnitude lower than the particles’ inertia), so the disappearance of the enhancement of is necessarily due to the influence of the Coriolis force on the fluid. This influence acts before , because the condition holds for a transition of the entire cloud, i.e. when rotation starts to fully govern the cloud dynamics. Conversely, the particulate effects at stake are rather localised at the interface between the cloud and the ambient fluid, where the entrainment flux affects the flow as soon as the inflow starts. Consequently, rotation is expected to have a non-negligible influence on the outer shell of the cloud for a Rossby number larger than unity (i.e. before is reached) by modifying the structure of the flow and gradually tilting vortices along . Such modifications likely prevent particles from concentrating and sweeping on the downward sides of eddies, thus switching particulate effects off. Because in our experiments at rpm, the Rossby number never exceeds 6 when , clouds are never sufficiently inertial for their interface to be unaffected by rotation (as pointed out by references [32, 50] in the case of continuous injections of buoyancy, rotation modifies a plume’s dynamics even for modest Rossby numbers; furthermore, rotation eventually influences any plume as long as its injection is long enough, due to the conservation of angular momentum [32]). Although reference [34] bears upon the behaviour of plumes in background rotation, it inspired our reflections on the transition to vortical columnar flows and we refer the reader to this study for additional information on the flow that develops with a starting plume in background rotation. Further investigation on the behaviour of particles and the structure of the flow close to the interface requires additional visualisations of particles in horizontal planes and quantification of the velocity field, which is beyond the scope of the present study.
Another ingredient which may act to inhibit particulate effects is the centrifugal force. In fact, although this force is negligible compared to gravity (the ratio is only of order for the largest rotation rate rpm and for which corresponds to the maximum radial distance to the axis of rotation), depending on the value of we observe that the centrifugal force due to the rotating table is comparable with the centrifugal force exerted on particles when they swirl in eddies at 0rpm. Hence, the centrifugal force due to may switch off preferential concentration as well as preferential sweeping, so that particles cannot concentrate to force the flow through two-way coupling.
IV.3 Swarm regime
Figure 16(a) illustrates the influence of rotation due to the overlay of integral images for different rotation rates and identical Rouse numbers: the faster the rotation, the narrower the column (see also the Supplemental Material Rouse0p406_0-5-10RPM.avi), which is consistent with past observations for miscible thermals [35, 36] and bubble-laden plumes [33]. To confirm this observation, we perform quantitative measurements of the width of columns through the quantity . For a given experiment, it corresponds to the average value of (the cloud width detected by the cloud-tracking algorithm; see appendix C) after it becomes approximately constant. Figure 16(b) confirms that the larger , the narrower the column. For rpm, the column half width is approximately because is so low that the cloud has no time to grow through turbulent entrainment before becoming columnar, so it remains as large as the cylinder of injection. Similarly, all clouds in the range never grow as a thermal and therefore have a width .
The decreasing column width with increasing can be explained from geometrical arguments. Before transition when , for simplicity one may assume that clouds behave as self-similar turbulent thermals. Then, from the scalings (9a)-(9b) of MTT56, the width of a cloud should scale like when , as argued and verified in references [35, 36]. Our experiments are perfomed for three different values of which is insufficient to quantitatively confirm this scaling, yet we note that it is compatible with our present measurements, using as a measurement of the cloud radius at . In other words, as increases, the condition is reached at lower depths hence columns are narrower.


A remark should be made on the fact that the constant width of columns is a robust observation for low Rouse numbers, but for large Rouse numbers it is an approximation whose accuracy is quantified by the error bars in figure 16(b). In fact, for the largest Rouse numbers, particles ultimately fall as swarms. In the absence of background rotation, the latter slowly expand along their fall. In fact, Subramanian and Koch [41] in the range , and later Daniel et al. [51] in the range [93-425], showed that hydrodynamical interactions between particles result in a growth of swarms as . Because of the variability between several realisations, and due to our limited field of view after separation happens, our measurements do not enable us to discriminate between a sublinear or linear evolution of in depth for the swarm regime. Hence, we compute indicative constant values of the growth rate of swarms obtained from linear regressions in the range if , and we perform the same analysis in the range when . Results are shown in figure 17 for clouds which slightly grow indeed, behaving as swarms. In the range , we observe that the more inertial the particles, the more the curves collapse on the dark symbols for , indicating that particles are less and less sensitive to rotation due to their decoupling from the fluid. In the range , the minimum Rouse number for which is measurable tends to increase with ; additionally, for a given Rouse number, the larger the more differs from the reference values in a still environment. Both of these observations are due to the larger azimuthal inertia of the fluid and the increasing stiffening of radial motions when increases, which require a larger particle inertia to be overcome.

IV.4 Kinematics and residence time
The influence of rotation on a cloud front velocity is now assessed. The front velocity is observed to be approximately constant below the depth . Since we can hardly distinguish between particles which fall in a vortical columnar flow, and swarms which are decoupled from the fluid, in both cases the constant velocity for is denoted to be consistent with notations used for clouds in a still environment, and we talk about a swarm regime. This velocity is determined from a linear fit of as illustrated in figure 18(a). Results for the velocities are shown in figure 18(b). In the range , the influence of noticeably decreases with increasing and curves collapse on the curve. This is due to particles being more and more insensitive to the swirling flow, especially as is lower. In the range , the larger the rotation rate, the larger the front velocity (see also the Supplemental Material Rouse0p406_0-5-10RPM.avi). This trend is mainly interpreted through the reduction of the column radius (see figure 16(b)) which, in turn, increases the particle volume fraction . From a macroscopic point of view, this results in a larger effective cloud density , enhancing the cloud velocity through the reduced gravity .
It should be mentioned that fitting an affine model on the average curve is at odds with past measurements which seem in agreement with the scaling proposed by the authors in references [35, 36]. There seems to be no physical reason for columnar clouds to keep decelerating as turbulent thermals following the law after the turbulent entrainment and lateral cloud growth are interrupted by rotation, thus cancelling the mixing drag. Conversely, the previous arguments are consistent with a constant cloud front velocity. Yet, we still note a subtle decrease of the clouds’ velocity in time for the lowest Rouse numbers. This slight decrease is ultimately expected since a lot of the buoyant material remains in suspension behind the cloud front, to such an extent that the cloud front gradually thins out (see figure 13) thus reducing the front effective density and velocity. We expect the front deceleration to depend on the rate of detrainment of buoyant material in the columnar cloud wake, which cannot be measured from our planar visualisations.


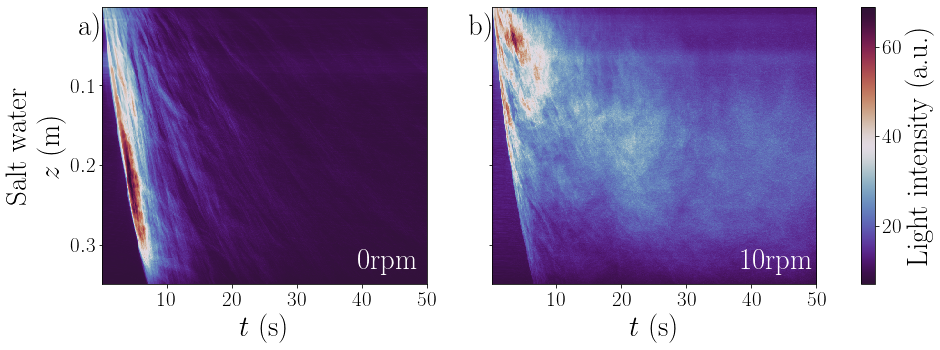
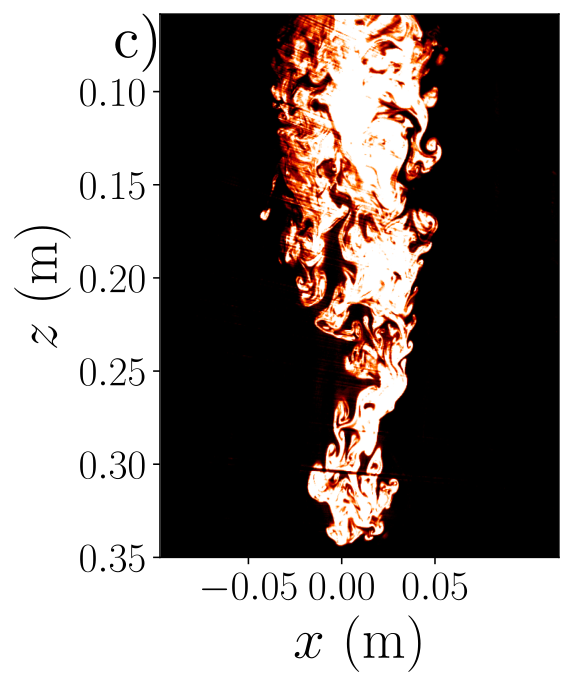
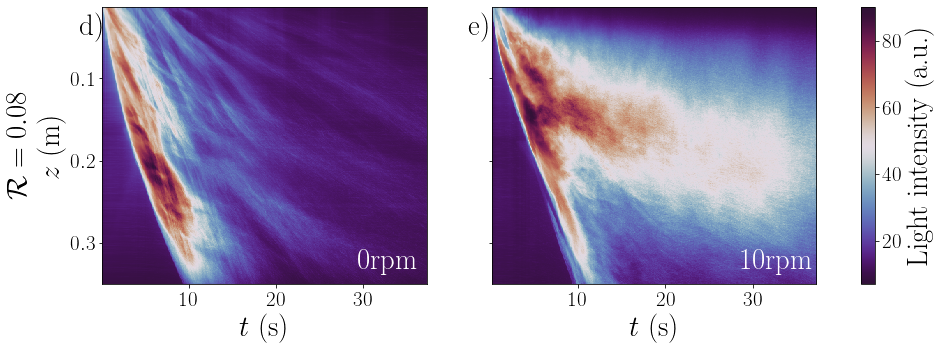
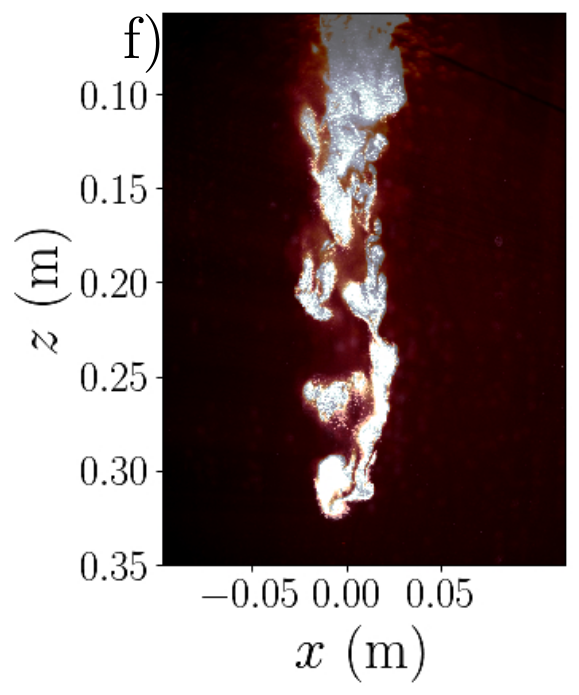
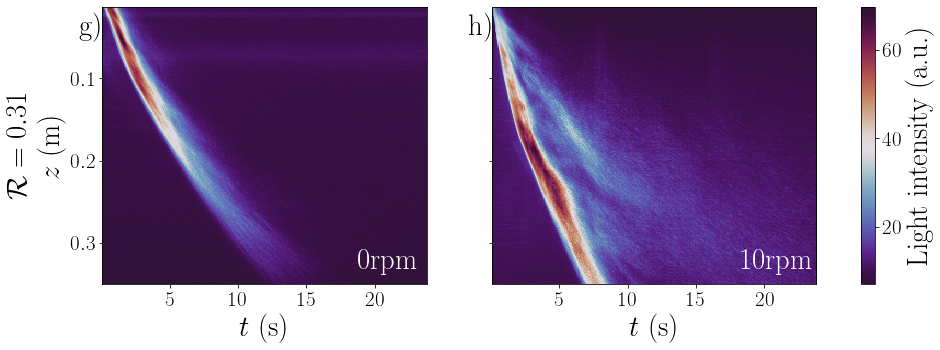
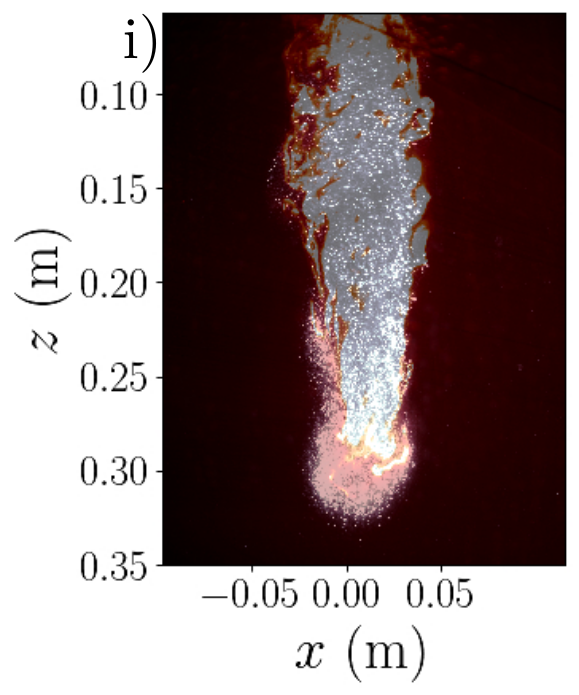
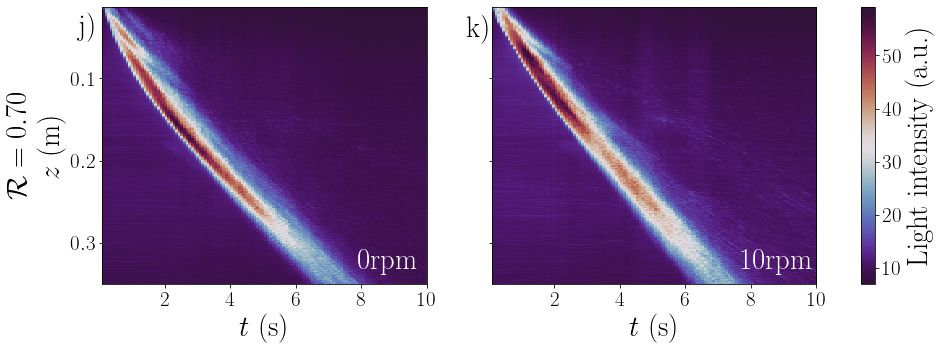
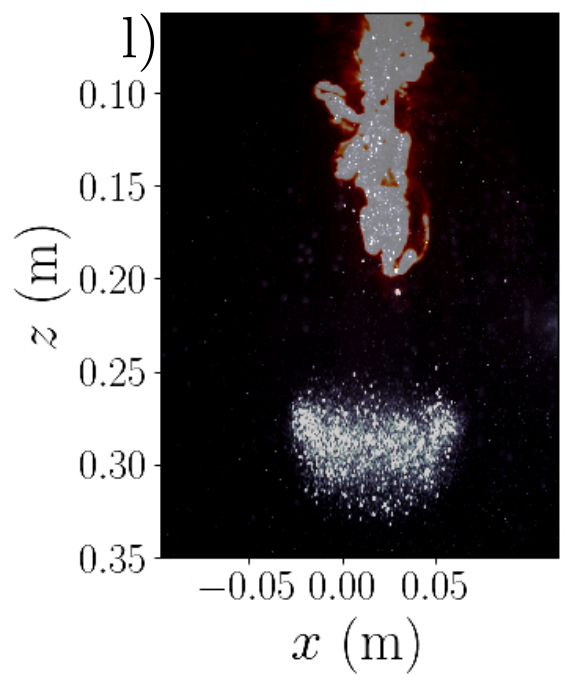
Further understanding can come from analysing how particles distribute and settle in columnar clouds. Figure 19 combines snapshots and Hovmöller diagrams of the light intensity obtained for every image of an experiment after averaging the values of all pixels along every row. For very large Rouse numbers (see figures 19j-l), particles decouple from the fluid due to their inertia and fall as swarms with a constant velocity. For lower Rouse numbers (see figures 19a-i), compared to clouds falling in a still environment, the Hovmöller diagrams confirm that due to rotation, the cloud front velocity is approximately constant and detrainment is enhanced since the residence time of particles at any depth is visibly increased. On the Hovmöller diagrams, the fast concentrated frontal blob falling with constant velocity corresponds to the cloud. Conversely, the slow dilute region where particles settle on a much larger time scale on average corresponds to the stem of detrained particles (see respectively red and white regions in figures 19g-h). Furthermore, images with rhodamine confirm that the frontal blob corresponds to the turbulent cloud initially dyed with rhodamine, since this blob drags rhodamine down the tank (see figure 19i in particular). Thus, detrainment is enhanced by rotation; in addition, we observe that the frontal blob laterally shrinks as it falls in the tank. These observations might result from the interaction between the rotating ambient and the turbulent cloud at its interface, where the cloud seems to be gradually peeled off by a strong shear, thereby switching off particulate effects. Further investigation would require additional observation in a horizontal plane, as well as measurements of the fluid velocity field.
V Summary and conclusion
Instantaneous releases of a buoyant material in still water behave differently if the material is salt water or heavy particles. Particle clouds initially behave as turbulent thermals, and the difference manifests through an increase of their entrainment capacity compared to salty clouds, with a maximum of enhancement for a finite inertia corresponding to (figure 6). The origin of this enhancement likely stems from particulate effects which have already been observed in canonical turbulent flows, mainly preferential concentration and preferential sweeping. A second difference is due to a transition from the thermal regime to the swarm regime because particles decouple from turbulent eddies due to their inertia and eventually separate from them.
Adding background rotation, the particulate enhancement of entrainment is inhibited (figure 15), likely due to the influence of the Coriolis force on the inflow of entrained fluid at the cloud interface. When the Coriolis force predominates on the dynamics of the whole cloud (), the latter transitions to a regime of vortical columnar flow (figure 14). Together with the decoupling of particles from the flow (separation), this transition adds a new limitation on the duration of turbulence. The model of Morton et al. [21] appears like an efficient framework to anticipate the different regimes experienced by the particle clouds throughout their fall.
Polydisperse, bidisperse and monodisperse particle sets were used to assess the role of polydispersity in the clouds dynamics. It appears that polydispersity plays little part in turbulent clouds and vortical columnar flows. It essentially modifies the morphology of swarms during and after separation (section III.3).
It is worth mentioning that the inhibition of the enhancement of entrainment due to background rotation is likely due to the fact that the clouds’ inertia is not large enough for them to be completely insensitive to rotation. Increasing their initial inertia by releasing a larger mass excess could enable to observe a range of depths where rotation leaves them unaffected. Additional measurements for other (lower) values of would also be beneficial to extract quantitative scalings with the rotation speed .
Some open questions remain. According to the literature on particle-laden turbulent flows (e.g., [7, 13]) we expect inertial effects to be optimal when the ratio of the settling velocity over the local flow velocity within the cloud is of order one – in other words when a local Rouse number is of order unity. For our smallest particles, this velocity ratio remains small because the clouds never fall deep enough to decelerate until this local Rouse number becomes of order unity. The entrainment rates of turbulent thermals and our clouds are constant before separation. Yet, if varies on a length scale larger than our field of view (so that its variation could not be assessed), one can imagine that in a larger tank, these clouds would experience a further increase of when the local Rouse number gets close to unity. This hypothesis cannot be ruled out without additional experiments at a larger scale.
Further work on such particle clouds requires to quantify the flow produced by particles through PIV in a vertical laser sheet. Additional visualisations of the glass beads and of PIV particles in horizontal planes would prove enlightening to understand the structure of clouds in the presence of background rotation. It could clarify the mechanism through which the influence of rotation gradually contaminates an entire cloud from its periphery to its entirety, following similar work on plumes [34]. To this end, we would also benefit from experiments at a larger scale with a larger mass excess to better separate scales and dynamical regimes.
VI Acknowledgements
The authors acknowledge funding by the European Research Council under the European Union’s Horizon 2020 research and innovation program through Grant No. 681835-FLUDYCO-ERC-2015-CoG. The authors thank V. Dorel and L. Huguet for the setting of a first version of the experiment and metrology, as well as for their preliminary results that guided the present work.
Appendix A List of experiments
Table 2 lists the number of experiments processed for each couple . Numbers tend to be higher when particles are more sensitive to initial conditions, or when measurements are very sensitive to noise because of the considerable dilution of particles when the cloud falls. Numbers also vary because some experiments were not processed, because clouds occasionally went out of the laser sheet, or pieces of latex membrane fell with clouds in the laser sheet, introducing a bias in measurements.
| Salt water | 0.308 | 0.696 | 1.48 | 2.73 | 3.70 | 0.168 | 0.406 | 0.814 | 4.13 | 0.210 | 0.255 | 0.304 | 0.354 | ||||
| 0 rpm | 6 | 5 | 16 | 8 | 5 | 6 | 5 | 4 | 10 | 8 | 5 | 6 | 6 | 6 | 3 | 2 | 4 |
| 5 rpm | 12 | 0 | 19 | 7 | 15 | 10 | 10 | 5 | 5 | 9 | 14 | 9 | 5 | 4 | 4 | 4 | 4 |
| 10 rpm | 13 | 0 | 21 | 6 | 15 | 9 | 11 | 10 | 5 | 10 | 5 | 5 | 5 | 5 | 7 | 5 | 5 |
| 20 rpm | 17 | 0 | 18 | 3 | 12 | 15 | 15 | 5 | 9 | 5 | 6 | 5 | 5 | 6 | 5 | 5 | 5 |
Appendix B List of notations
Table B lists the notations used in this study for reference.
Defined in Variable Description
\tableheadDefined in Variable Description
\bottomcaptionList of variables, the section in which they are defined, and a short description.
\xentrystretch-0.15
{xtabular}lcl
Section II.1 & Density of ambient fluid
Section II.1 Viscosity of ambient fluid
Section II.1 Angular velocity of the rotating table
Section II.1 Diameter of the cylinder
Section II.1 Total mass excess (1g)
Section II.1 Density of the glass beads
Section II.1 Mean radius of a particle set
Section II.1 Water height above the latex membrane
Section II.2 Morton length
Section II.2 Acceleration of gravity
Section II.2 Initial cloud density
Section II.2 Reference velocity of clouds
Section II.3 Standard deviation of a distribution of particles’ radii
Section II.3 Dimensionless number quantifying polydispersity
Section II.3 A percentage to define bidisperse particle sets
Section II.4 Terminal velocity of a single particle
Section II.4 Particulate Reynolds number
Section II.4 Stokes terminal velocity
Section II.4 Newton’s terminal velocity
Section II.4 Drag coefficient of a spherical particle
Section II.4 Total number of particles in a cloud
Section II.4 Dimensionless average radius of a particle set
Section II.4 Rouse number
Section III.1 Radius of a spherical thermal
Section III.1 Density of a uniform spherical thermal
Section III.1 Vertical position of the centre of mass of a uniform spherical thermal
Section III.1 Vertical velocity of the centre of mass of a thermal; by extension in
experiments, vertical velocity of the barycentre of particles within a cloud
Section III.1 Entrainment velocity
Section III.1 Coefficient of entrainment
Section III.1 Drag coefficient of a spherical thermal
Section III.2 Depth of a cloud’s front
Section III.2 Vertical velocity of a cloud’s front
Section III.2 Entrainment coefficient of salt water thermals
Section III.3 Depth of separation between particles and eddies
Section III.3 Radius of a cloud computed as a standard deviation
Section III.3 Height of a cloud computed as a standard deviation
Section III.3 Constant vertical front velocity in the swarm or vortical columnar regimes
Section III.3 During separation: vertical velocity of particles still present inside eddies
Section III.3 During separation: velocity excess of swirling particles wrt separated particles
Section III.3 During separation: vertical velocity of eddies
Section III.3 Growth rate of the cloud radius
Section III.3 Growth rate of the cloud height
Section III.3 Rouse number of the smallest particles within a cloud
Section III.3 Rouse number of the largest particles within a cloud
Section III.3 Difference of terminal velocities between the largest and smallest particles
Section III.3 During separation: volume flux of particles shed in the emerging swarm
Section III.3 Particles’ volume fraction
Section III.4 Maximum cloud front velocity
Section IV.1 Depth of transition from a thermal to a vortical columnar flow
Section IV.1 Cloud Rossby number
Section IV.1 Rossby number computed at the depth
Section IV.3 (Possibly asymptotically) constant radius of a vortical columnar cloud
Appendix C Otsu’s method: number of pixels in class 0
Appendix C Otsu’s method: number of pixels in class 1
Appendix C Otsu’s method: average intensity in class 0
Appendix C Otsu’s method: average intensity in class 1
Appendix C Cloud-tracking: interparticle distance where a cloud has low concentration
Appendix C Cloud-tracking: interparticle distance outside of clouds
Appendix C Cloud-tracking: threshold intensity to binarise images
Appendix C Cloud-tracking: size of the Gaussian kernel defining a hull around a cloud
Appendix D A number of snapshots to compute standard deviations of light intensity
Appendix D Expanded uncertainty on the value of
Appendix C Measurements from the automatic cloud tracking
Several quantities are computed from an automatic processing of videos of falling glass beads (visualised by the camera with a green filter). This processing consists of an automatic detection of the particle cloud as follows. The signal received by the camera is never a flat field, even before cloud launching at : this means that inhomogeneities are always present in the light intensity, even in the absence of particle cloud. To correct them, a background photograph is always saved at . Then, all photographs of the cloud at are divided by this initial background image, so that pixels without particles should have a value of , while pixels with particles should have larger values of relative light intensity. The aim, then, is to define a threshold on light intensity to binarise the image. This threshold should be time-dependent since the cloud keeps diluting so that its average light intensity keeps decreasing. An appropriate binarisation therefore depends on the histogram of each photograph, and Otsu’s method [52] is adopted to process experiments. It consists in an optimisation algorithm which maximises the inter-class variance between the two resulting levels of intensity (denoted 0 or 1), the inter-class variance being proportional to with the number of pixels in the level , and the average intensity in the level . The second image in figure 20 shows the binarisation of the first image using Otsu’s method to define the threshold.

A first limitation of this naive binarisation is that the tank is only emptied after several experiments, so that the background image usually contains some of the smallest particles from previous experiments which settle very slowly and behave as isolated tracers (see the background around the cloud in the second image in figure 20). These isolated particles pollute the field of view, which makes it necessary to define a criterion to distinguish the falling cloud on one hand, and old remaining particles on the other hand. Otherwise, a naive binarisation either detects the cloud and remaining particles (if the threshold is too low), or does not detect all the particles within the cloud (if the threshold is too large). Regions of high particle concentration are always very bright and easily detected. The main issue is to distinguish between regions of the cloud with low concentration, and detrimental particles from past experiments, since both of these appear in dark shades of gray.
A solution to this problem lies in the interparticle distance. Small particles from past experiments are far away from one another, with a typical interparticle distance . Particles falling with the cloud in regions of low concentration have a typical interparticle distance (first image in figure 20). Then, the idea is to perform a naive binarisation with a threshold of intensity denoted (second image in figure 20), then blur the result with a Gaussian kernel of size which verifies . In doing so, regions of low concentration in the cloud will connect because , which means that blurred particles now overlap, resulting in a signal which is above the threshold . On the opposite, isolated particles from past experiments do not overlap after blurring the image since , hence their signal is lost in noise below . Then, the resulting blurred image is binarised with the same threshold as before, creating a “Gaussian hull” which only contains regions of both large intensity compared to , and whose interparticle distance is small compared to ; see the third image in figure 20. To finish with, the final result is the initial naive binarisation of faw images restricted to the Gaussian hull only (fourth image in figure 20). As observed in figure 20, the Gaussian hull is able to capture some particles in regions of low concentration in the vicinity of the brightest regions, and gets rid of most particles in the background.
Once finally binarised, images are used to compute several quantities: the cloud front position is that of the lowermost white pixel; the coordinates and of the cloud centroid are computed as averages of the coordinates of all white pixels; the cloud vertical and lateral dimensions are computed as standard deviations of white pixels with respect to the centroid. Errorbars on these quantities correspond to a confidence interval of 95% around the mean value, computed as 1.96 times the uncertainty obtained by averaging results of several realisations of an experiment, and from least squares regressions if any.
Appendix D Measurements from raw images
D.1 Coefficient of entrainment
The coefficient of entrainment quantifies the growth rate of clouds, measured as the slope described by the edges of clouds as they fall in the water tank. The simplest and most robust way of quantifying this slope is by using all the photographs of a movie, as well as two integral images computed with the macro ZProject of ImageJ: the average and the pixel-by-pixel standard deviation of light intensity over the entire cloud fall (see figure 21). With these three visualisations, the cloud edges are tracked, the slope is determined by hand in each case, and we retain the mean value of the three methods for each realisation of an experiment. Finally we compute and its error bar respectively as the mean and standard deviation of all the realisations of a given set ().
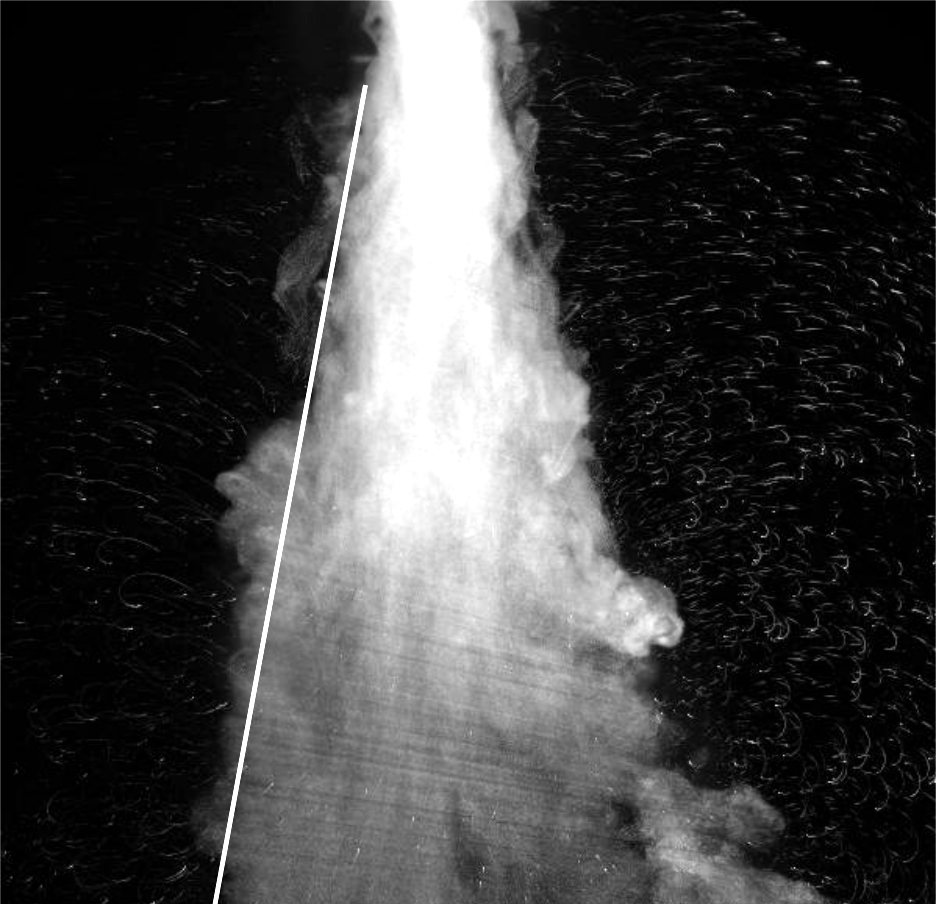
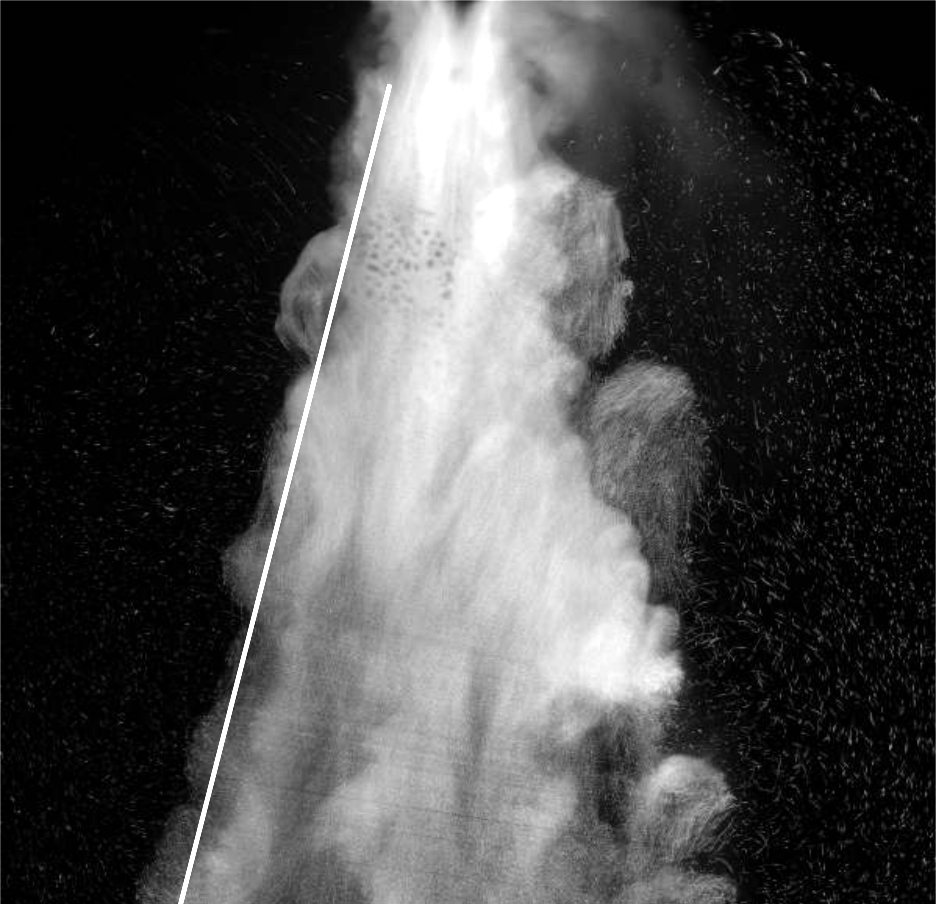
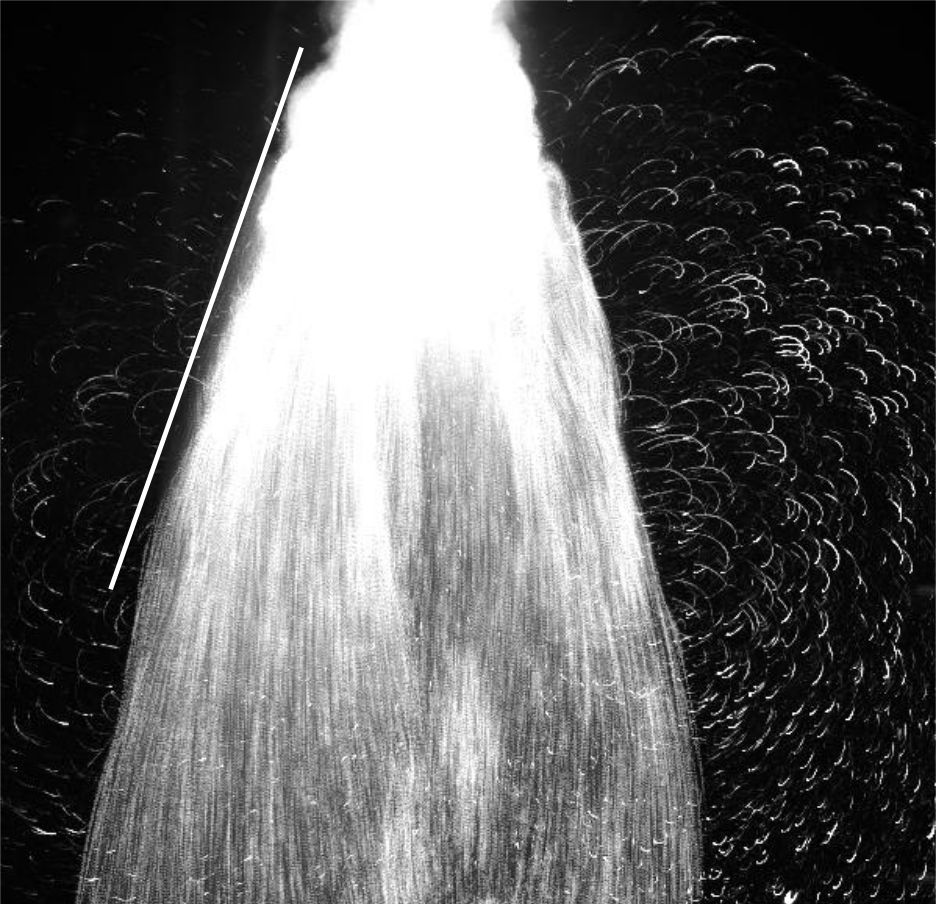
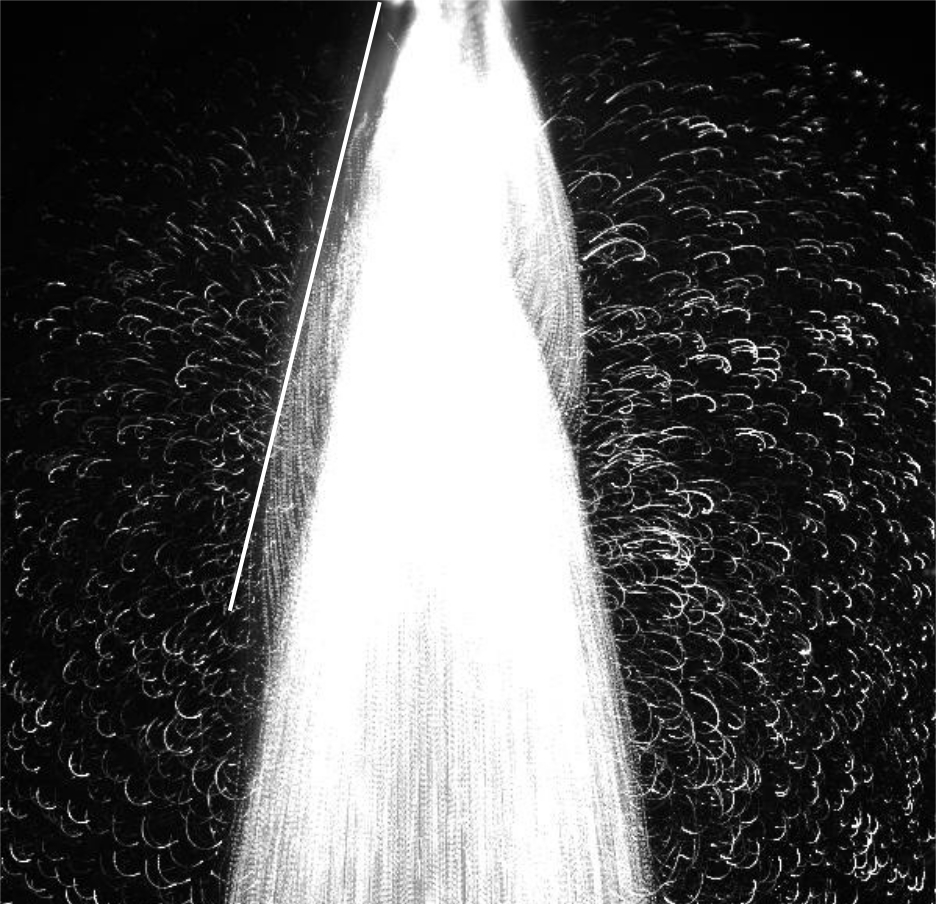
The slope is determined over the distance where the cloud grows linearly, before separation and before transition to a vortical columnar flow. When a cloud never grows linearly (because particles are so large that the Rouse number is above unity), an indicative value of is measured: it corresponds to the initial growth rate of the cloud after rupturing the membrane, in the phase of acceleration of the cloud (see figure 21(e)).
D.2 Depth of separation
Experimentally, the depth of separation can be measured in two different ways. For the first one, the overlay of images from both cameras enables to compute the surface area of overlap between rhodamine and particles, both regions being defined from the cloud-tracking algorithm presented in appendix C. Initially both regions are superimposed. Their overlap gradually shrinks in time or depth, evidencing an inflexion point which is considered as defining separation. Depending on experiments, the inflexion point may not be well defined. In that case the asymptotic states of complete overlap and nil overlap are detected, and separation is considered to happen at mid-time. This first method presents the advantage of being quantitative, but only a few experiments were performed with rhodamine. The second method is based on the trajectories of particles. Moving standard deviations are performed over a chosen number of snapshots (typically 30), which enables to observe the trajectory of individual particles over the snapshots at 50fps (see an example in figure 7(a)). When particles separate from eddies, the patterns made by their trajectories transition from curved and randomly oriented (due to particles whirling inside eddies) to mostly straight and vertical. When half the visible particles have a vertical trajectory, separation is considered to occur. The difficulty to assess the proportion of particles having transitioned affects the determination of the depth of separation . This is accounted for by expanded uncertainties : they are measured in such a way that for lower than almost all particles swirl in eddies, and for larger than almost all particles have a vertical trajectory.
The two methods to identify separation were both implemented for the same series of particle clouds of average Rouse number ; the difference between their respective mean value of corresponded to a low relative error of 2.1%, which was considered satisfactory enough to validate the use of the second approach for all experiments.
References
- Andreotti et al. [2012] B. Andreotti, Y. Forterre, and O. Pouliquen, Les milieux granulaires - Entre fluide et solide (EDP Sciences, 2012).
- Brandt and Coletti [2022] L. Brandt and F. Coletti, Particle-laden turbulence: Progress and perspectives, Annual Review of Fluid Mechanics 54, 159 (2022).
- Fritz et al. [2009] H. M. Fritz, F. Mohammed, and J. Yoo, Lituya Bay landslide impact generated mega-tsunami 50th anniversary, in Tsunami Science Four Years after the 2004 Indian Ocean Tsunami: Part II: Observation and Data Analysis, edited by P. R. Cummins, K. Satake, and L. S. L. Kong (Birkhäuser, Basel, 2009) pp. 153–175.
- Abramian et al. [2019] A. Abramian, O. Devauchelle, G. Seizilles, and E. Lajeunesse, Boltzmann Distribution of Sediment Transport, Physical Review Letters 123, 014501 (2019).
- Lake [1977] J. R. Lake, The effect of drop size and velocity on the performance of agricultural sprays, Pesticide Science 8, 515 (1977).
- Meheut et al. [2012] H. Meheut, Z. Meliani, P. Varniere, and W. Benz, Dust-trapping Rossby vortices in protoplanetary disks, Astronomy & Astrophysics 545, A134 (2012).
- Balachandar and Eaton [2010] S. Balachandar and J. K. Eaton, Turbulent Dispersed Multiphase Flow, Annual Review of Fluid Mechanics 42, 111 (2010).
- Aliseda et al. [2002] A. Aliseda, A. Cartellier, F. Hainaux, and J. C. Lasheras, Effect of preferential concentration on the settling velocity of heavy particles in homogeneous isotropic turbulence, Journal of Fluid Mechanics 468, 77 (2002).
- Yoshimoto and Goto [2007] H. Yoshimoto and S. Goto, Self-similar clustering of inertial particles in homogeneous turbulence, Journal of Fluid Mechanics 577, 275 (2007).
- Salazar et al. [2008] J. P. L. C. Salazar, J. D. Jong, L. Cao, S. H. Woodward, H. Meng, and L. R. Collins, Experimental and numerical investigation of inertial particle clustering in isotropic turbulence, Journal of Fluid Mechanics 600, 245 (2008).
- Maxey [1987] M. R. Maxey, The gravitational settling of aerosol particles in homogeneous turbulence and random flow fields, Journal of Fluid Mechanics 174, 441 (1987).
- Good et al. [2014] G. H. Good, P. J. Ireland, G. P. Bewley, E. Bodenschatz, L. R. Collins, and Z. Warhaft, Settling regimes of inertial particles in isotropic turbulence, Journal of Fluid Mechanics 759 (2014).
- Monchaux and Dejoan [2017] R. Monchaux and A. Dejoan, Settling velocity and preferential concentration of heavy particles under two-way coupling effects in homogeneous turbulence, Physical Review Fluids 2, 104302 (2017).
- Kruger [2020] E. Kruger, Dynamics of downdraughts and cold pools: an experimental and numerical study, Phd thesis, University of Cambridge (2020).
- Ouillon et al. [2019] R. Ouillon, E. Meiburg, and B. R. Sutherland, Turbidity currents propagating down a slope into a stratified saline ambient fluid, Environmental Fluid Mechanics 19, 1143 (2019).
- Necker et al. [2002] F. Necker, C. Härtel, L. Kleiser, and E. Meiburg, High-resolution simulations of particle-driven gravity currents, International Journal of Multiphase Flow 28, 279 (2002).
- Rückriemen et al. [2015] T. Rückriemen, D. Breuer, and T. Spohn, The Fe snow regime in Ganymede’s core: A deep-seated dynamo below a stable snow zone, Journal of Geophysical Research: Planets 120, 1095 (2015).
- Paugam et al. [2016] R. Paugam, M. Wooster, S. Freitas, and M. Val Martin, A review of approaches to estimate wildfire plume injection height within large-scale atmospheric chemical transport models, Atmospheric Chemistry and Physics 16, 907 (2016).
- Yano [2014] J.-I. Yano, Basic convective element: Bubble or plume? A historical review, Atmospheric Chemistry and Physics 14, 7019 (2014).
- Linden [1999] P. F. Linden, The fluid mechanics of natural ventilation, Annual Review of Fluid Mechanics 31, 201 (1999).
- Morton et al. [1956] B. R. Morton, G. I. Taylor, and J. S. Turner, Turbulent gravitational convection from maintained and instantaneous sources, Proceedings of the Royal Society of London. Series A. Mathematical and Physical Sciences 234, 1 (1956).
- Turner [1986] J. S. Turner, Turbulent entrainment: The development of the entrainment assumption, and its application to geophysical flows, Journal of Fluid Mechanics 173, 431 (1986).
- Landeau et al. [2014] M. Landeau, R. Deguen, and P. Olson, Experiments on the fragmentation of a buoyant liquid volume in another liquid, Journal of Fluid Mechanics 749, 478 (2014).
- Peñas et al. [2021] P. Peñas, O. R. Enríquez, and J. Rodríguez-Rodríguez, Bubble-laden thermals in supersaturated water, Journal of Fluid Mechanics 924 (2021).
- Rahimipour and Wilkinson [1992] H. Rahimipour and D. Wilkinson, Dynamic behaviour of particle clouds, in 11th Australasian Fluid Mechanics Conference University of Tasmania, Hobart, Australia (1992).
- Bush et al. [2003] J. W. M. Bush, B. A. Thurber, and F. Blanchette, Particle clouds in homogeneous and stratified environments, Journal of Fluid Mechanics 489, 29 (2003).
- Lai et al. [2013] A. C. H. Lai, B. Zhao, A. W.-K. Law, and E. E. Adams, Two-phase modeling of sediment clouds, Environmental Fluid Mechanics 13, 435 (2013).
- Lai et al. [2016] A. C. H. Lai, R.-Q. Wang, A. W.-K. Law, and E. E. Adams, Modeling and experiments of polydisperse particle clouds, Environmental Fluid Mechanics 16, 875 (2016).
- McConnochie et al. [2021] C. D. McConnochie, C. Cenedese, and J. N. McElwaine, Entrainment into particle-laden turbulent plumes, Physical Review Fluids 6, 123502 (2021).
- Fernando et al. [1998] H. J. S. Fernando, R.-R. Chen, and B. A. Ayotte, Development of a point plume in the presence of background rotation, Physics of Fluids 10, 2369 (1998).
- Goodman et al. [2004] J. C. Goodman, G. C. Collins, J. Marshall, and R. T. Pierrehumbert, Hydrothermal plume dynamics on Europa: Implications for chaos formation, Journal of Geophysical Research: Planets 109 (2004).
- Frank et al. [2017] D. Frank, J. R. Landel, S. B. Dalziel, and P. F. Linden, Anticyclonic precession of a plume in a rotating environment, Geophysical Research Letters 44, 9400 (2017).
- Frank et al. [2021] D. Frank, J. R. Landel, S. B. Dalziel, and P. F. Linden, Effects of background rotation on the dynamics of multiphase plumes, Journal of Fluid Mechanics 915, A2 (2021).
- Sutherland et al. [2021] B. R. Sutherland, Y. Ma, M. R. Flynn, D. Frank, P. F. Linden, D. Lemasquerier, M. Le Bars, C. Pacary, T. Jamin, T. Dauxois, and S. Joubaud, Plumes in rotating fluid and their transformation into tornados, Journal of Fluid Mechanics 924 (2021).
- Ayotte and Fernando [1994] B. A. Ayotte and H. J. S. Fernando, The motion of a turbulent thermal in the presence of background rotation, Journal of the Atmospheric Sciences 51, 1989 (1994).
- Helfrich [1994] K. R. Helfrich, Thermals with background rotation and stratification, Journal of Fluid Mechanics 259, 265 (1994).
- Zhao et al. [2014] B. Zhao, A. W. K. Law, E. E. Adams, and J. W. Er, Formation of particle clouds, Journal of Fluid Mechanics 746, 193 (2014).
- Morton [1959] B. R. Morton, Forced plumes, Journal of Fluid Mechanics 5, 151 (1959).
- Deguen et al. [2011] R. Deguen, P. Olson, and P. Cardin, Experiments on turbulent metal-silicate mixing in a magma ocean, Earth and Planetary Science Letters 310, 303 (2011).
- Crowe et al. [2011] C. T. Crowe, J. D. Schwarzkopf, M. Sommerfeld, and Y. Tsuji, Multiphase Flows with Droplets and Particles, 2nd ed. (CRC Press, Boca Raton, FL, 2011).
- Subramanian and Koch [2008] G. Subramanian and D. L. Koch, Evolution of clusters of sedimenting low-Reynolds-number particles with Oseen interactions, Journal of Fluid Mechanics 603, 63 (2008).
- Pignatel et al. [2011] F. Pignatel, M. Nicolas, and É. Guazzelli, A falling cloud of particles at a small but finite Reynolds number, Journal of Fluid Mechanics 671, 34 (2011).
- Escudier and Maxworthy [1973] M. P. Escudier and T. Maxworthy, On the motion of turbulent thermals, Journal of Fluid Mechanics 61, 541 (1973).
- Nitsche and Batchelor [1997] J. M. Nitsche and G. K. Batchelor, Break-up of a falling drop containing dispersed particles, Journal of Fluid Mechanics 340, 161 (1997).
- Nasab and Garaud [2021] S. Nasab and P. Garaud, Preferential concentration by mechanically driven turbulence in the two-fluid formalism, Physical Review Fluids 6, 104303 (2021).
- Wang and Maxey [1993] L.-P. Wang and M. R. Maxey, Settling velocity and concentration distribution of heavy particles in homogeneous isotropic turbulence, Journal of Fluid Mechanics 256, 27 (1993).
- Li et al. [2021] J. Li, A. Abraham, M. Guala, and J. Hong, Evidence of preferential sweeping during snow settling in atmospheric turbulence, Journal of Fluid Mechanics 928 (2021).
- Wang et al. [2014] R.-Q. Wang, A. W.-K. Law, and E. E. Adams, Large-Eddy Simulation (LES) of settling particle cloud dynamics, International Journal of Multiphase Flow 67, 65 (2014).
- Yamamoto et al. [2015] Y. Yamamoto, F. Hisataka, and S. Harada, Numerical simulation of concentration interface in stratified suspension: Continuum–particle transition, International Journal of Multiphase Flow 73, 71 (2015).
- Fabregat Tomàs et al. [2017] A. Fabregat Tomàs, A. C. Poje, T. M. Özgökmen, and W. K. Dewar, Numerical simulations of rotating bubble plumes in stratified environments, Journal of Geophysical Research: Oceans 122, 6795 (2017).
- Daniel et al. [2009] W. B. Daniel, R. E. Ecke, G. Subramanian, and D. L. Koch, Clusters of sedimenting high-Reynolds-number particles, Journal of Fluid Mechanics 625, 371 (2009).
- Otsu [1979] N. Otsu, A threshold selection method from gray-level histograms, IEEE Transactions on Systems, Man, and Cybernetics 9, 62 (1979).